Article

Pyrolysis Characteristics and Reaction Mechanism of Cement Fiberboard with Thermogravimetry/Fourier Transform Infrared Analysis

1
Zhaoqing Power Supply Bureau of Guangdong Power Grid Co., Ltd., Zhaoqing 526000, China
2
Faculty of Engineering, China University of Geosciences, Wuhan 430074, China
*
Author to whom correspondence should be addressed.
Fire 2025, 8(11), 426; https://doi.org/10.3390/fire8110426
Submission received: 5 September 2025 / Revised: 19 October 2025 / Accepted: 28 October 2025 / Published: 31 October 2025

Abstract

In this study, thermogravimetric analysis (TGA) was coupled with Fourier-transform infrared (FTIR) spectroscopy to systematically investigate the pyrolysis characteristics and mechanisms of cement fiberboard across varying heating rates. Experimental findings demonstrated that the thermal degradation process occurs in four distinct phases. Overlapping decomposition peaks in DTG curves were successfully resolved using a double-Gaussian deconvolution algorithm. A comprehensive kinetic analysis was conducted by integrating model-free iso-conversional methods (Flynn–Wall–Ozawa and Kissinger–Akahira–Sunose analysis) with a model-fitting technique (Coats–Redfern approximation) to determine the activation energies for each degradation stage. A subsequent FTIR spectroscopic analysis revealed that the evolution of gaseous products follows the sequence CO2 > H2O > CH4. The CO2 release was found to originate from multiple pathways, including the decomposition of organic components and high-temperature inorganic reactions. Notably, while the heating rate had a negligible impact on product speciation, it exhibited a statistically significant influence on CO2 emission intensities. Finally, mechanistic interpretations integrating Arrhenius parameters with time-resolved infrared spectral features were proposed for each thermal decomposition stage.

1. Introduction

In recent years, cement fiberboards have gained significant prominence as an indispensable material in the construction sector and architectural cladding applications, due to their exceptional weather resistance, superior mechanical properties, and strong eco-sustainability [1]. Cement fiberboards are recognized as premier fire-rated partitioning materials in construction applications [2,3]. These composite panels are fabricated through a sequence of industrial processes (mixing, pulping, molding, pressing, and autoclave curing) using siliceous–calcareous matrices reinforced with cellulosic fibers. Their enhanced performance characteristics stem from specialized high-pressure compaction equipment, which ensures optimal density profiles [4]. Crucially, the performance of these boards is governed by a multifactorial relationship involving raw material composition, formulation design, manufacturing parameters, and compaction pressures. Cement fiberboard production is more technologically sophisticated than conventional panel manufacturing. The boards comply with international building codes (ASTM E136 [5] and EN 13501-1 [6]) in terms of fire resistance and frost durability [7,8]. Empirical findings have confirmed that these boards are non-combustible and exhibit negligible toxic fume emissions during combustion events. Furthermore, due to their exceptionally low electrical conductivity coefficients, these composites can serve as high-performance dielectric materials, as listed in Table 1.
When subjected to elevated temperatures during fire incidents, cement fiberboards experience sequential pyrolysis reactions that ultimately stabilize to produce a thermally stable carbonaceous layer. This carbonized matrix acts as an effective barrier against flame propagation and thermal transfer, thereby significantly enhancing fire-containment capabilities and safeguarding both human lives and structural integrity [15].
Scholarly investigations into cement fiberboards worldwide have systematically focused on three principal dimensions: performance optimization of constituent materials, development of sustainable resource allocation strategies, and technological advancements in manufacturing techniques. These interconnected research trajectories collectively address critical challenges in construction material science while aligning with contemporary industrial sustainability paradigms. Ferreira S.D. et al. [16] investigated the conversion and product characteristics of fiberboard waste in a screw-conveyor pilot-scale pyrolysis reactor, systematically analyzing the influence of pyrolysis temperature and residence time on product distribution. Ranachowski Z. et al. comprehensively evaluated the thermal degradation of cement fiberboards, emphasizing the synergistic effects of carbonization and fiber embrittlement on microstructure evolution and mechanical property deterioration while validating ultrasonic testing as a non-destructive method for field-based aging assessment [17]. Yu Y. et al. quantitatively examined the dependency of flammability on the cement-to-fiber ratio in cement–fiber composites, observing a nonlinear enhancement in fire resistance with increasing cement content [18]. Fu Z. et al. pioneered a fiber–cement matrix separation methodology to decouple the pyrolysis mechanisms of natural fibers in cementitious environments, providing critical insights into the high-temperature durability of bio-composite systems. Collectively, these investigations have established a robust theoretical framework encompassing sustainable design principles, performance assessment methodologies, and lifecycle management strategies for fiber–cement composites [19,20]. Nevertheless, systematic investigations into pyrolysis mechanisms in cement fiberboards, particularly regarding char-layer formation kinetics and thermal degradation pathways, remain insufficient. This research gap underscores the critical need to comprehensively characterize these pyrolytic processes.
This study analyzed the pyrolysis reactions of cement fiberboards by combining thermogravimetric (TG) analysis with Fourier-transform infrared (FTIR) spectroscopy under different heating rates, which enabled simultaneous acquisition of the mass-loss data and infrared absorption spectra of the volatile products during the reactions [21]. This allowed for the identification of gas-phase products at various stages and the possible reaction mechanisms, clarifying the reaction characteristics at different stages. Using model-free and model-fitting methods, the kinetic parameters and suitable reaction mechanisms for each stage were determined [22,23]. Finally, the kinetic compensation effect was validated, which provides a solid theoretical basis for optimizing the formulations and enhancing the thermal stability and fire resistance of the material [24].

2. Materials and Methods

2.1. Sample Preparation

The cement fiberboards used in this study were sourced from Shanghai Cangsheng Building Decoration Materials Co., Ltd (Shanghai, China). Cement fiberboard is a solid-liquid hybrid system primarily composed of cement, wood fiber, inorganic mineral fiber (aluminum silicate fiber), and inorganic filler (diatomite and CaCO3), with their approximate mass proportions of 40%, 35%, 5% and 20%. To ensure uniform heating during TGA and avoid errors due to internal temperature gradients, all samples were first ground into fine powder with a particle size of less than 0.2 mm [25]. The obtained powder was then dried at 80 °C for approximately 24 h to completely remove free moisture, which ensured precise temperature control and reliable experimental data.

2.2. Thermogravimetry

TGA was conducted using a PerkinElmer TGA 4000 thermal analyzer (Waltham, MA, USA) at four heating rates (10, 20, 30, and 40 K/min) across a temperature range of 300–1200 K. Approximately 8 mg of powdered sample, evenly distributed in the sample cup, was used for each experiment. During the experiment, pure nitrogen gas was continuously purged at 20 mL/min to ensure the rapid removal of volatile gases, which maintained a stable nitrogen atmosphere within the system and ensured uniform sample heating.

2.3. Kinetic Method Analysis

By enabling precise control of the experimental atmosphere and heating rate (typically for trace solid samples), TGA can prevent errors related to thermal gradients and mass-transfer effects during material degradation [26]. This method is particularly suitable for determining chemical kinetic parameters, such as activation energy, as it involves dynamic monitoring of material decomposition rate. The kinetic modeling of solid decomposition can be expressed by Equation (1):
d α d t = k T f α
where α represents the conversion rate during pyrolysis; k T is the reaction rate constant, which can be explained by the Arrhenius law; and f α is the reaction mechanism function [27]. Additionally, α and k T can be calculated using Equations (2) and (3), respectively:
α = m 0 m t m 0 m
k T = A e E a R T
where m 0 , m t , and m represent the sample masses at the initial time point, time t, and the final time point, respectively [28]; A is the pre-exponential factor; E a is the activation energy for the reaction; R is the universal gas constant; and T is the absolute reaction temperature.
Under a linear heating rate, the temperature increases steadily during heating, without any fluctuations [29]. Such processes are simple, easy to control, and suitable for experiments requiring stable temperature changes.
β = d T d t
Equation (1) can be reformulated as follows:
d α d T = A β f α e E a R T
The integral form of the conversion rate can be expressed as follows:
g α = 0 α d α f α = A β T 0 T e E a R T d T
where T 0 is the initial absolute temperature. This integral serves as the fundamental equation for determining the kinetic parameters in the thermal degradation kinetics method for non-isothermal solids [30].
Based on the aforementioned equations, three common isoconversional methods were employed in this study: the Flynn–Wall–Ozawa (FWO) method [31], the Kissinger–Akahira–Sunose (KAS) [32] method, and the Coats–Redfern (CR) method. The FWO and KAS methods are model-free approaches widely used to determine the activation energy for the solid-state reaction of cement fiberboards without prior knowledge of the reaction mechanism [33,34]. Both these integral methods involve measuring the temperature corresponding to a fixed conversion rate under different heating rates. The CR method is a model-fitting approach. Before calculating the activation energy using this method, various reaction mechanisms must be assumed, including reaction order, diffusion, and shrinking geometry models. In this study, the CR method was used to calculate E a based on the f ( α ) or g α functions. The E a values estimated using the CR method were then compared with the values obtained using the FWO method to select the most suitable reaction mechanism f ( α ) ; thereby, the pre-exponential factor A was determined [35].

2.3.1. Flynn–Wall–Ozawa Method

The FWO method [36] is derived using Doyle’s approximation, and the logarithmic form of the reaction rate can be expressed as follows:
l n β = ln A E a R g α 5.331 1.052 E a R T
The relationship curve between l n β and 1/T is a straight line, and its slope can be used to determine the activation energy E a [31].

2.3.2. Kissinger–Akahira–Sunose Method

The KAS method was proposed by Kissinger, Akahira, and Sunose. Similar to the FWO method, it requires obtaining the temperature values corresponding to the same conversion rate under different heating rates. This method is based on the following expression:
l n β T 2 = l n ( A E a R α ) E a R T
At a given conversion rate, a straight line can be obtained by plotting the relationship between l n β T 2 and 1/T. The activation energy E a is determined by the slope of this line. Furthermore, when g α is known, the pre-exponential factor A can also be estimated from the intercept [32,37].

2.3.3. Coats–Redfern Method

The CR method [31] is based on the asymptotic approximation 2RT/ E a → 0, and the logarithmic form of Equation (5) can be expressed as follows:
l n g ( α ) T 2 = ln A R β E α E α R T
When the reaction mechanism is assumed, the plot of l n g ( α ) T 2 versus 1/T forms a straight line, and its slope can be used to determine the activation energy E a . Common reaction mechanisms in solid-state reactions are listed in Table 2 [4].

2.3.4. Bi-Gaussian Deconvolution Method

In the current study, the Bi-Gaussian deconvolution method [38] can be applied to the multi-component reaction models based on the decon­volution of asymmetric curves, which can be expressed as follows [39]:
y 1 = y 0 + H e 1 2 x x c w 1 2 x < x c
y 2 = y 0 + H e 1 2 x x c w 2 2 x x c
where y 0 is the baseline, H is the maximum reaction rate in the longitudinal coordinate, x is the independent variable, x c is the gap between the maximum reaction rates, w 1 is the left half peak width, and w 2 is the right half peak width [40,41].

2.4. TG-FTIR

A Fourier-transform infrared (FTIR) spectrometer (PerkinElmer Frontier, Waltham, MA, USA) was used to characterize the gases released from the thermogravimetric furnace [42]. FTIR analysis was conducted at four different heating rates (10, 20, 30, and 40 K/min) with a pure helium purge flow of 20 mL/min. The spectral scanning frequency was 20 scans per minute, covering a range from 600 cm−1 to 4000 cm−1. The FTIR was connected to the TG analyzer via a transfer pipeline, which was heated and maintained at 200 °C to prevent the condensation of volatile gases released during pyrolysis.
The TG-FTIR hyphenated method can achieve simultaneous and real-time monitoring of sample mass variation and gaseous product information during the pyrolysis of cement fiberboards. The TG module can provide dynamic mass variation data under controlled heating rate and atmosphere conditions, laying an experimental foundation for the subsequent calculation of pyrolysis kinetic parameters. At the same time, the FTIR module identifies and captures gaseous products released during pyrolysis in real-time via characteristic wavenumbers. No pretreatment of gaseous products is required throughout the process, which effectively avoids the loss or structural change of products in the pretreatment stage.

3. Results and Discussion

3.1. Thermogravimetric Analysis

Based on the experimental setup described above, the effect of heating rate on cement fiberboard is shown in Figure 1. Figure 1 shows α and mass loss curves (DTG) of fiber cement boards at four heating rates, where α is a conversion rate defined in Equation (2). Referring to the results shown in Figure 1, the pyrolysis process can be divided into four stages.
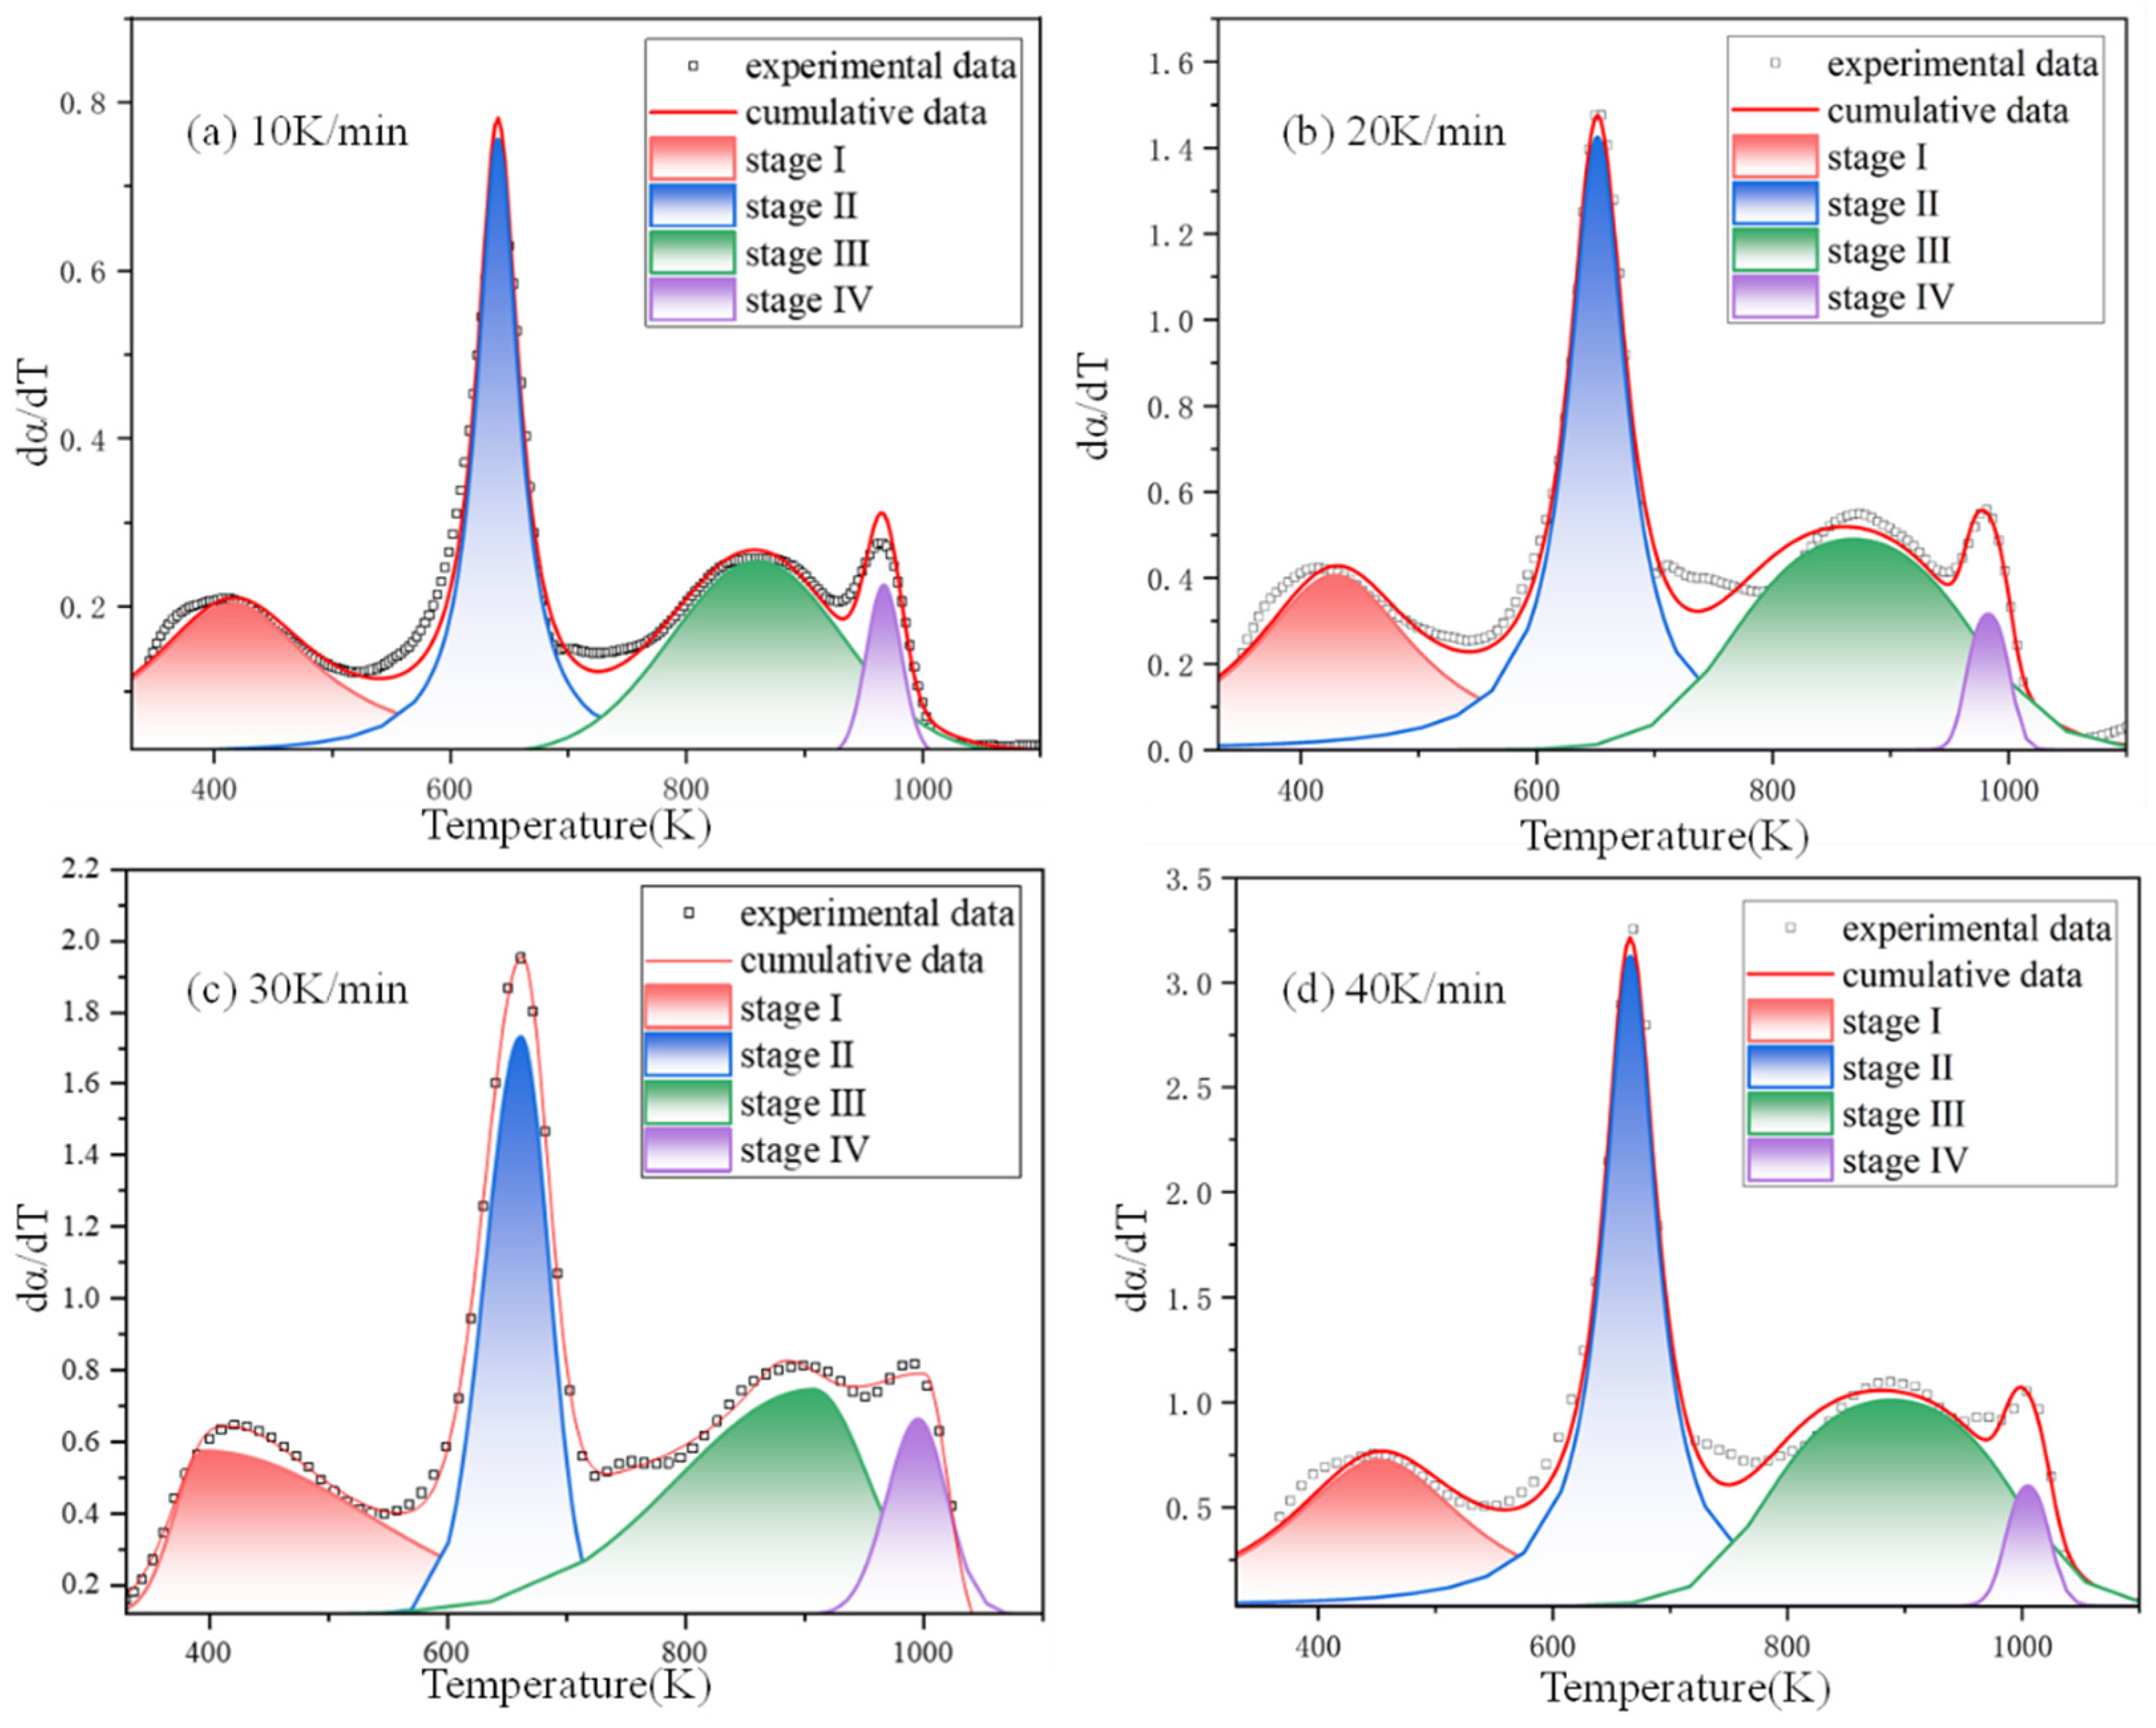
Typically, the segmentation of a material’s pyrolysis stages is conventionally determined based on the characteristic peaks in DTG curves. As shown in the results of Figure 1b of this study, the DTG curves of the cement fiberboard exhibit approximately four distinct characteristic peaks under four heating rates. On this basis, the pyrolysis process of the cement fiberboard investigated in this work can be reasonably delineated into four stages. Furthermore, the four-stage segmentation was further corroborated via the double-Gaussian deconvolution method, with relevant results available in Figure 2 and Table 3 of this study. This method effectively deconvolves overlapping reaction peaks, enabling clear differentiation of individual reaction processes and thus confirming the rationality of the four-stage segmentation.
The cement fiberboard began to pyrolyze around 350 K, with its mass retention rate exhibiting a gradual downward trend as temperature increased. The final residue averaged 82% across all thermogravimetric experiments [43]. Throughout the heating process, the influence of heating rate on material loss remains minimal, indicating the cement fiberboard demonstrates high thermal stability and limited mass loss at elevated temperatures, which confirms its excellent flame-retardant performance. In the temperature range of 550 K, the mass loss is relatively minor at approximately 5%, indicating that the primary reactions in this stage involve the removal of physically adsorbed water and partial chemically bound water. However, increased heating rates induced a distinct shift in the dehydration onset temperature toward higher values, accompanied by reduced total mass loss. This phenomenon suggested potential reaction incompletion under accelerated thermal conditions due to kinetic limitations [44]. Within the 550–750 K regime, substantial mass reduction occurred, with maximum mass loss rates for all thermal profiles observed between 640–670 K. A pronounced positive correlation emerged between heating rates and decomposition characteristics in the 750–950 K range; elevated heating rates not only shifted decomposition peaks to higher temperatures but also broadened the peak profiles, demonstrating characteristic thermal lag. As temperatures exceeded 950 K, mass loss decelerated markedly with a residual decrease of approximately 3%, corresponding to either structural reorganization within the silicate matrix or decomposition of trace impurities [45]. Notably, reaction discrepancies in high-temperature regions exhibited diminished sensitivity to heating rate variations, implying that thermally activated processes dominate over kinetic controls in this regime.

3.2. Kinetic Parameter Calculation and Mechanism Analysis

Conventional model-free and model-based fitting methodologies demonstrated inherent limitations when resolving overlapping thermal decomposition events in thermogravimetric analysis. To circumvent these constraints, a dual Gaussian deconvolution approach was implemented for the quantitative resolution of complex TG profiles obtained from fiber cement composite specimens, thereby enabling precise discrimination of overlapping reaction steps in heterogeneous material systems [38].
This analytical technique effectively resolved overlapping peaks containing multiple pseudo-components, serving as a critical preprocessing step for accurately determining kinetic parameters, thermodynamic properties, and potential interaction mechanisms. Experimental results demonstrated that the residual sum of squares (RSS) values for fiber cement boards at four heating rates (β) are 7.4531 × 10⁻⁵, 4.52266 × 10⁻⁴, 1.86927 × 10⁻⁵, and 9.61257 × 10⁻⁵, respectively. These low RSS values confirmed the reliability of the deconvolution results [41]. The elevated reaction temperatures consistently observed in this system compared to conventional counterparts stem from pronounced thermal gradients between interior and exterior regions, a direct consequence of the material’s inherent thermal insulating properties. The low residual sum of squares (RSS) values confirmed the high fidelity of the deconvolution outcomes. Moreover, the conversion rate profiles corresponding to the four reaction stages are graphically represented in Figure 2, while their optimized deconvolution parameters are systematically tabulated in Table 3.

3.2.1. Calculation of Kinetic Parameters by Model-Free Method

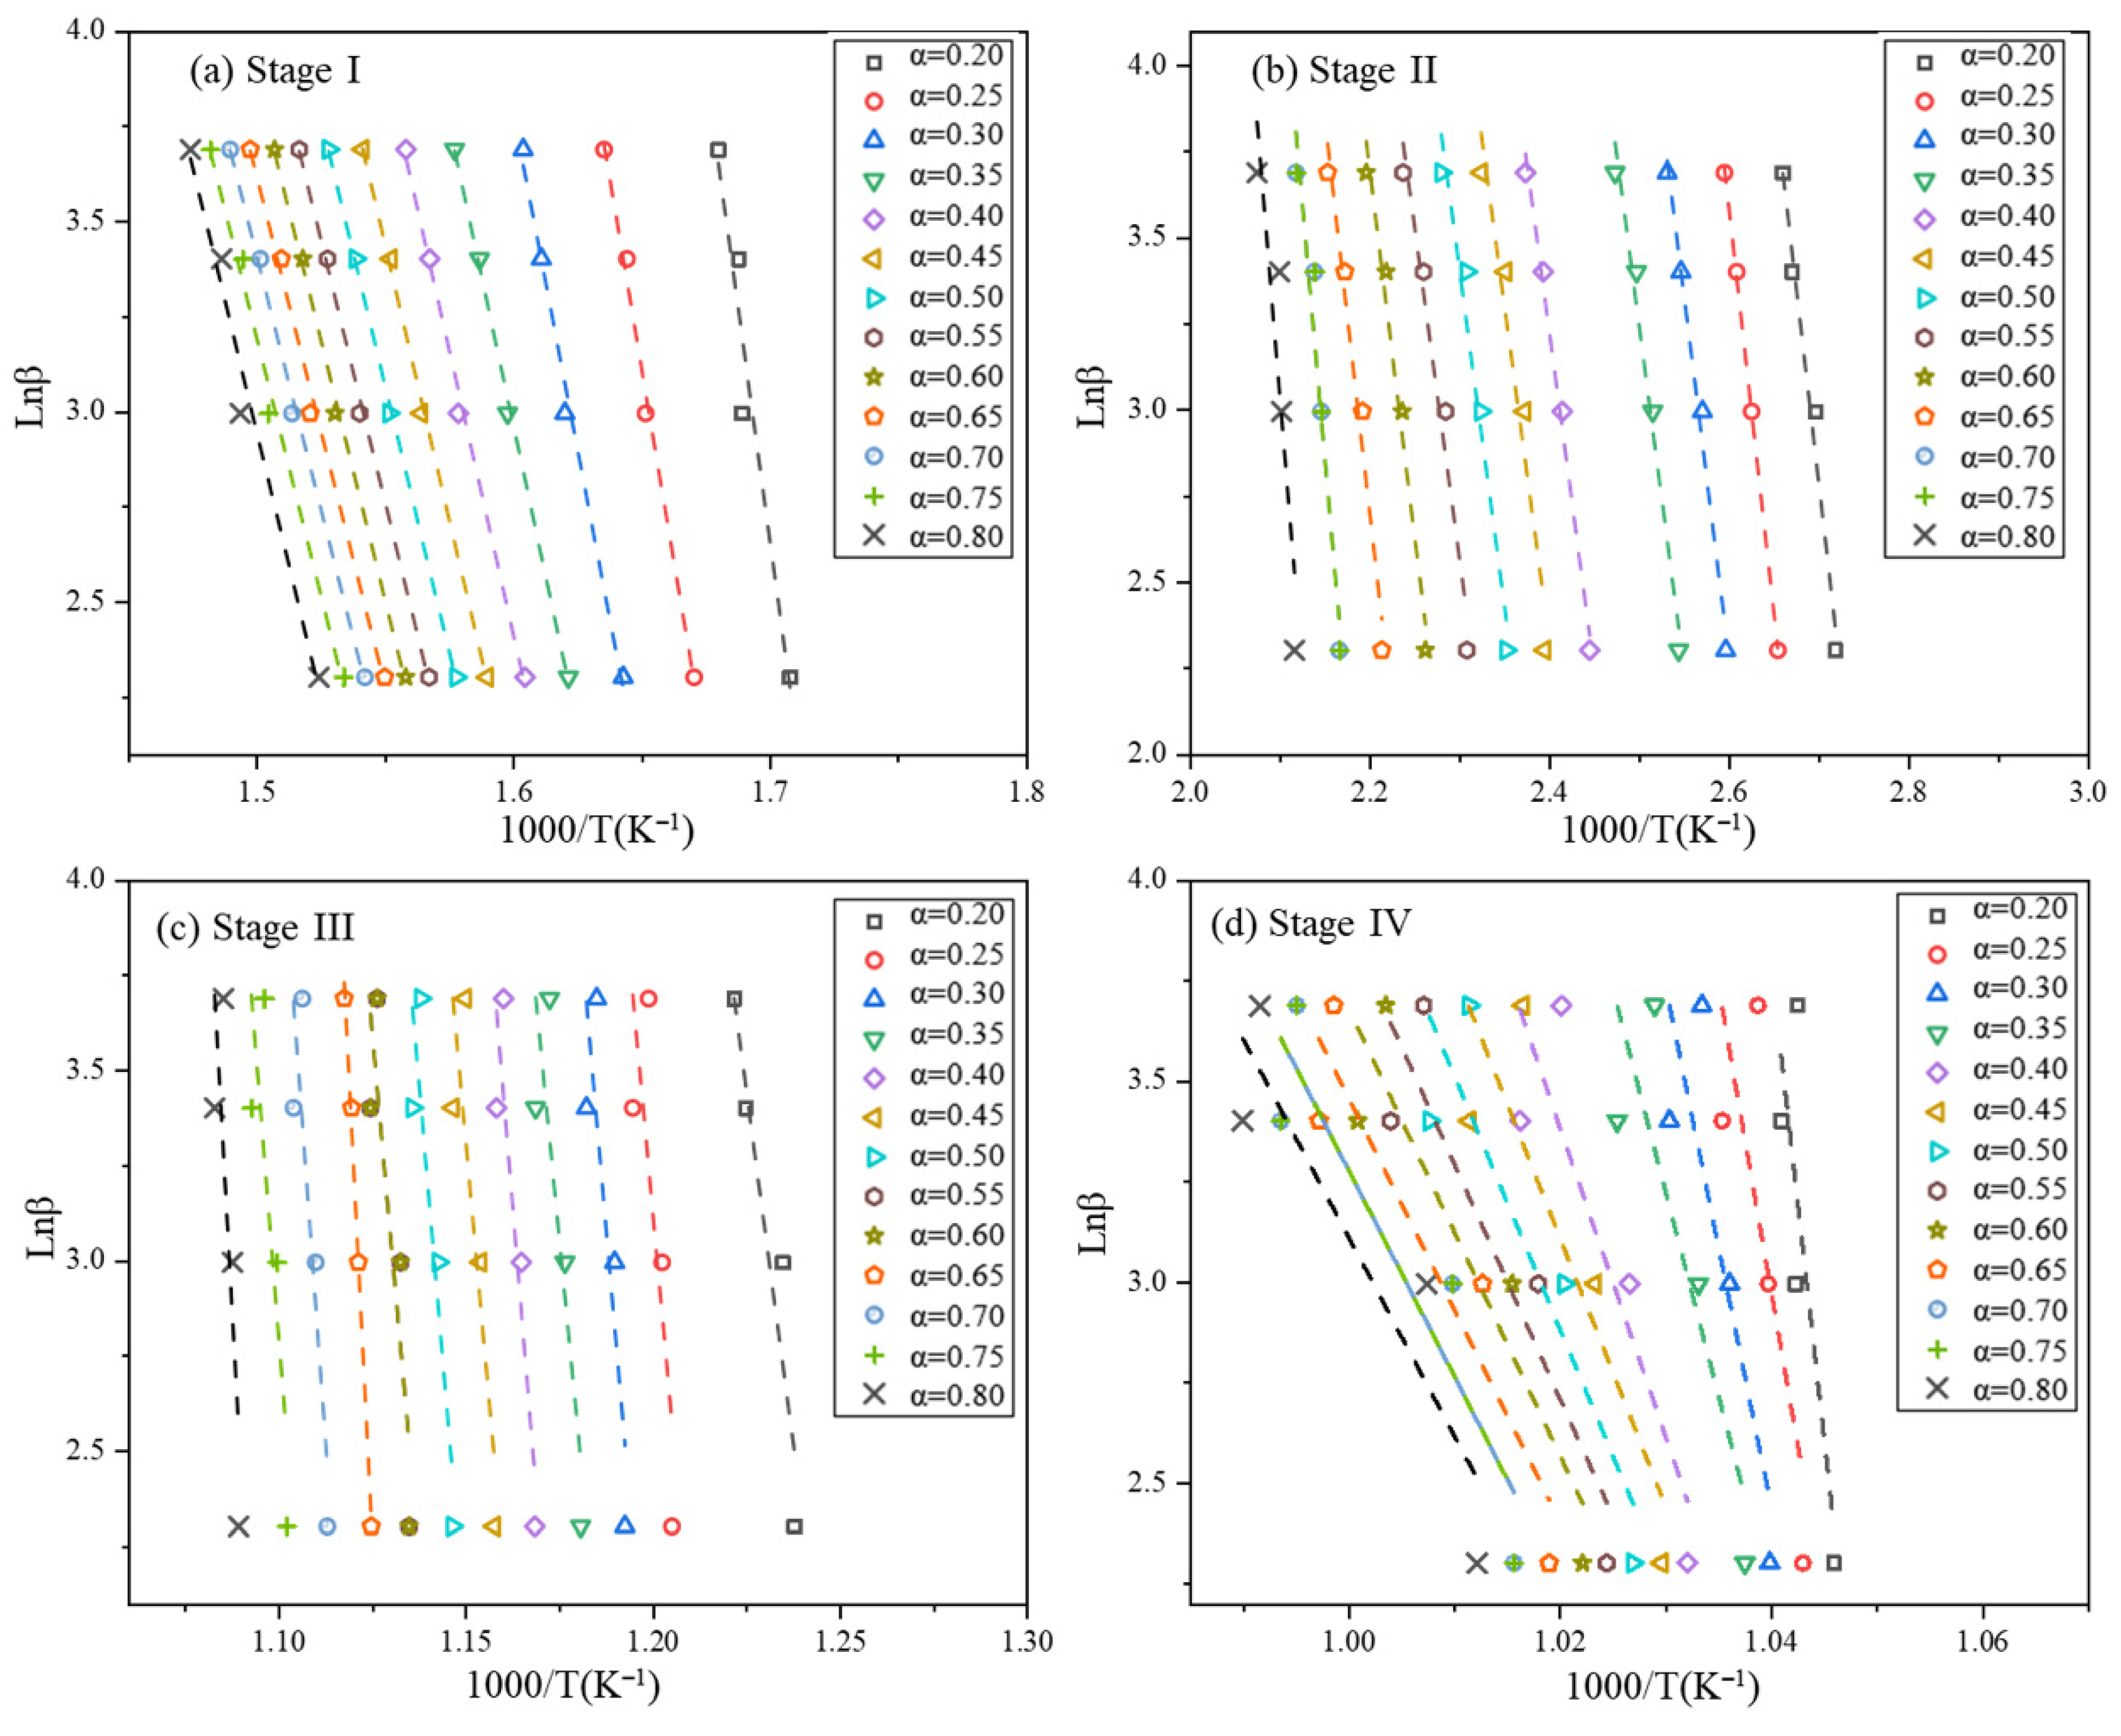
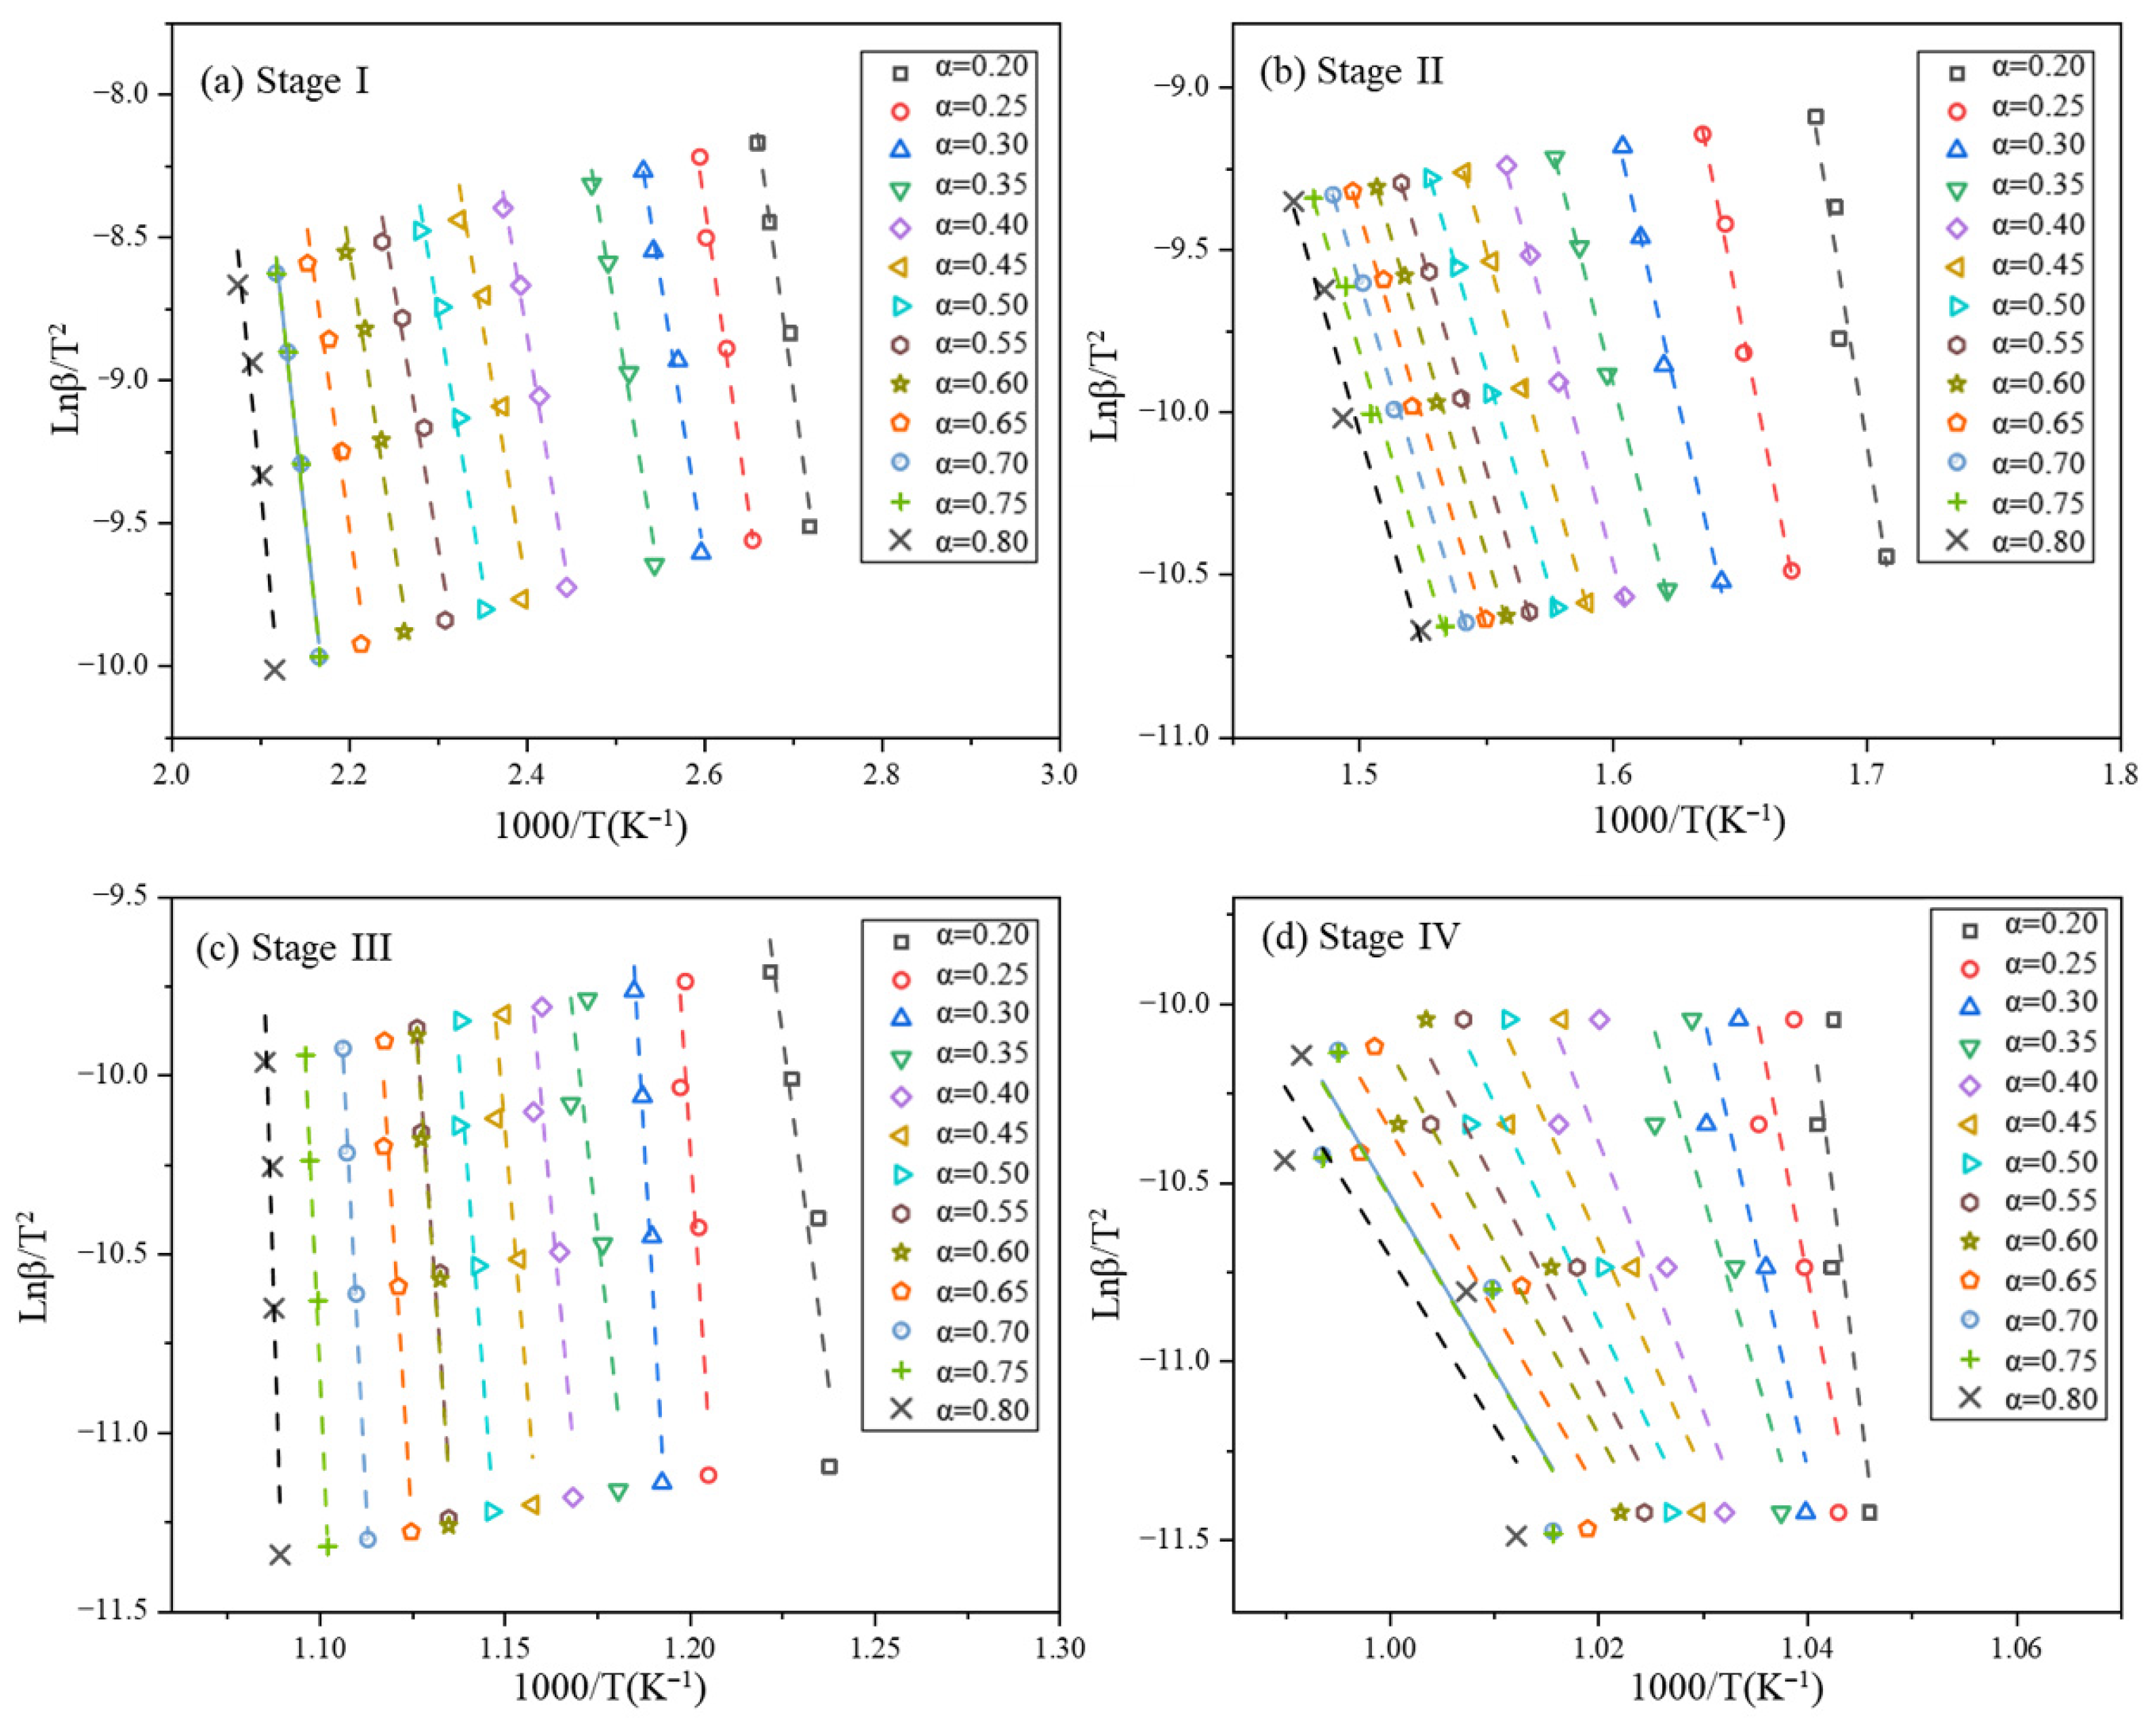
To systematically elucidate the pyrolysis reaction mechanisms and energy evolution characteristics of cement fiberboard, this study established a synergistic analytical framework by integrating the Flynn–Wall–Ozawa (FWO) and Kissinger–Akahira–Sunose (KAS) methods [46]. The dynamic evolution of activation energy ( E a ) is correlated with the conversion function (α), enabling cross-validation and error constraint of kinetic parameters. Based on the Arrhenius theoretical framework, multi-heating rate (β) data fitting was performed, decoupling the pyrolysis process into four consecutive stages according to characteristic peaks in thermogravimetric (TG) curves [47].
Experimental measurements of conversion (α) were conducted at 0.05 intervals across a heating rate range of 0.2–0.8. Fitting curves derived from both methods were plotted according to their respective equations [48]. As illustrated in Figure 3 and Figure 4, four distinct conversion ranges with comparable activation energies were identified: Stage I (0.20 ≤ α ≤ 0.80): 350–550 K, Stage II (0.20 ≤ α ≤ 0.80): 550–750 K, Stage III (0.20 ≤ α ≤ 0.80): 750–950 K, and Stage IV (0.20 ≤ α ≤ 0.80): 950–1100 K. The calculated E a values for incremental conversions across all stages, as summarized in Table 4, demonstrate strong consistency between FWO and KAS methods, with deviations below 5%. This agreement validated the reliability of the kinetic parameter calculations. The mean activation energies for each stage, derived from both methods, are as follows: Upon determination of the reaction mechanism function g(α) for each stage, kinetic analysis revealed correlation coefficients (R2) exceeding 0.90 for all fitted curves, demonstrating excellent goodness-of-fit. The high R2 values confirmed the computational accuracy and reliability of the model, as enhanced linear correlations directly reflected the validity of the Arrhenius assumptions.

3.2.2. Estimation of Reaction Mechanism with the CR Method

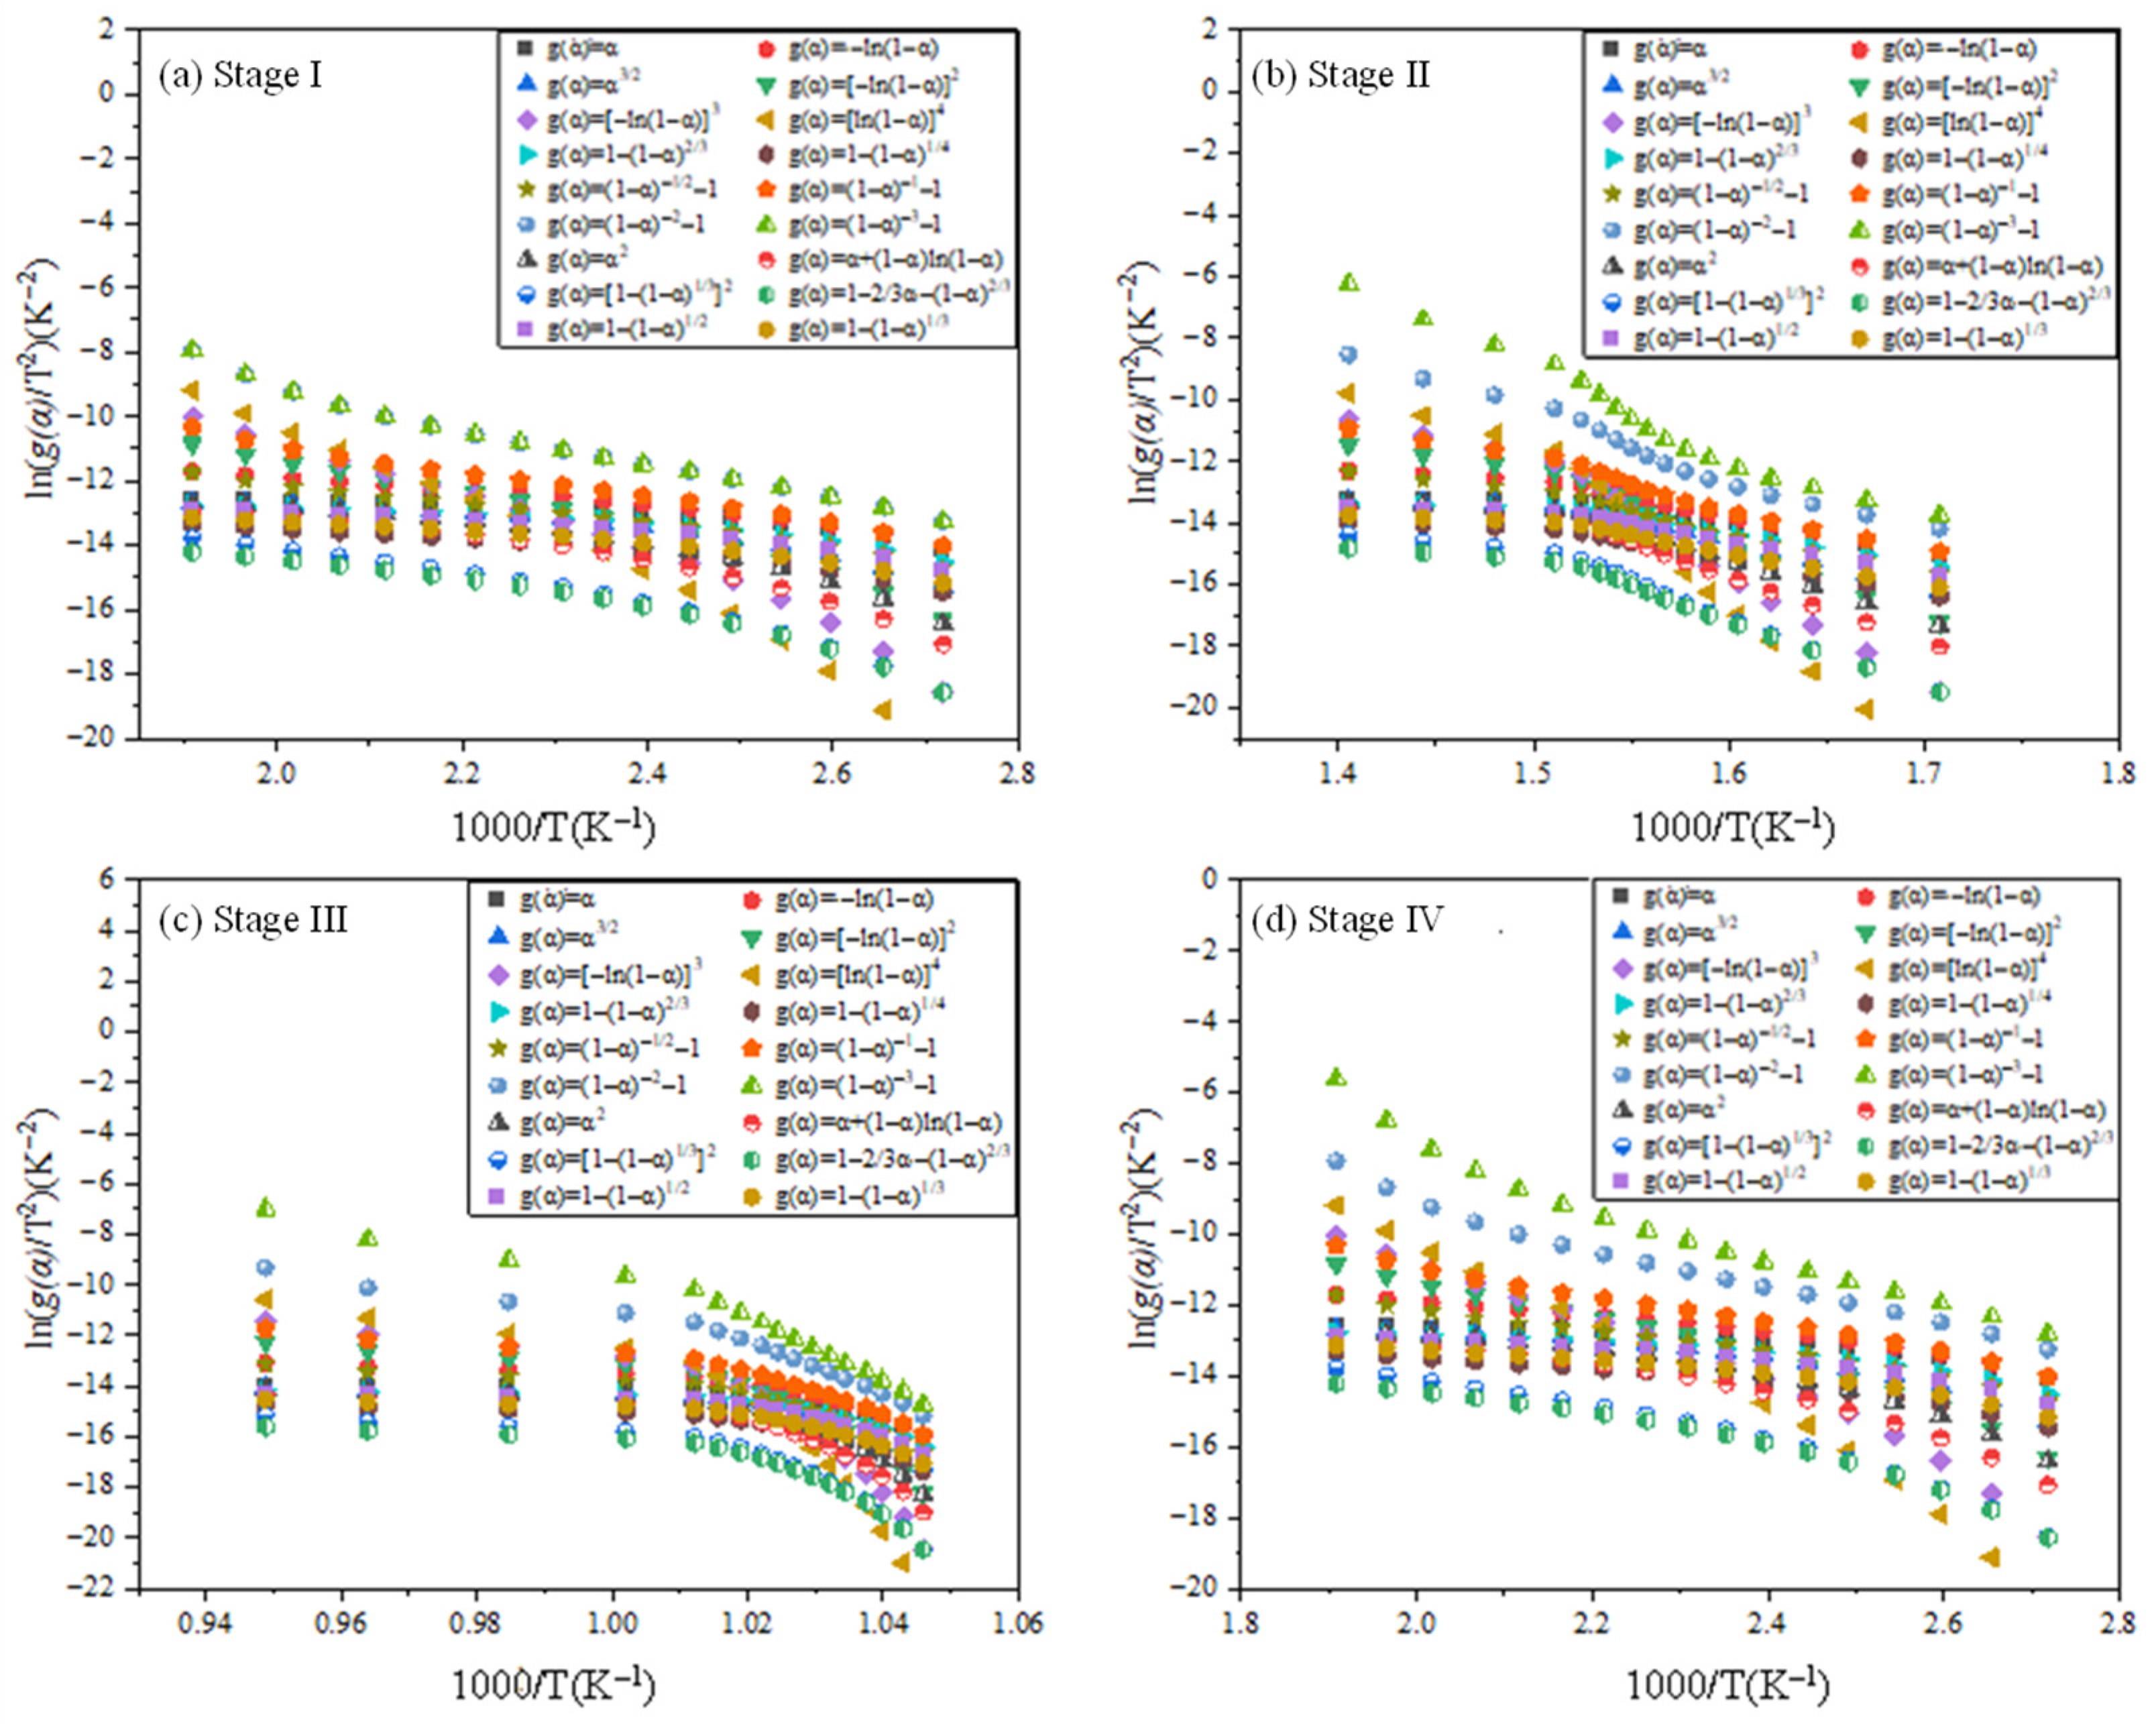
This section employed the Criado (CR) method to hypothesize and analyze the reaction mechanisms for each stage [49]. For the four heating rates, the plots between ln(g(α)/T2) with 1/T based on Equation (9) are shown in Figure 5, taking the heating rate of 10 K/min as an example.
The results in Table 5 indicated that the most suitable reaction mechanism functions in the four stages of cement fiberboard pyrolysis process were g(α) = [ l n ( 1 a ) ] 4 , g(α) = ( 1 α ) 3 1 , g(α) = α 3 / 2 , g (α) = (1 − α ) 2 1 , and their corresponding average values of Ea were 115.415, 217.028, 256.623, 439.325 kJ/mol, respectively. These Ea values derived by the CR method exhibited high concordance with the average activation energy by the FWO and KAS methods, which were 133.713, 222.491, 246.658, and 426.737 kJ/mol. for each stage. It can be seen that the Ea derived from the CR method is in high agreement with the results of the FWO and KAS methods. The final activation energy values for each stage, determined by averaging the results from the CR, FWO, and KAS methods, were 124.6, 219.8, 251.6, and 433.0 kJ/mol, respectively. Accordingly, the four reaction stages reaction mechanism can be identified as follows: assumed random nucleation and its subsequent growth, contracting sphere (spherical symmetry), nucleation, and chemical reaction.

3.3. FTIR Analysis

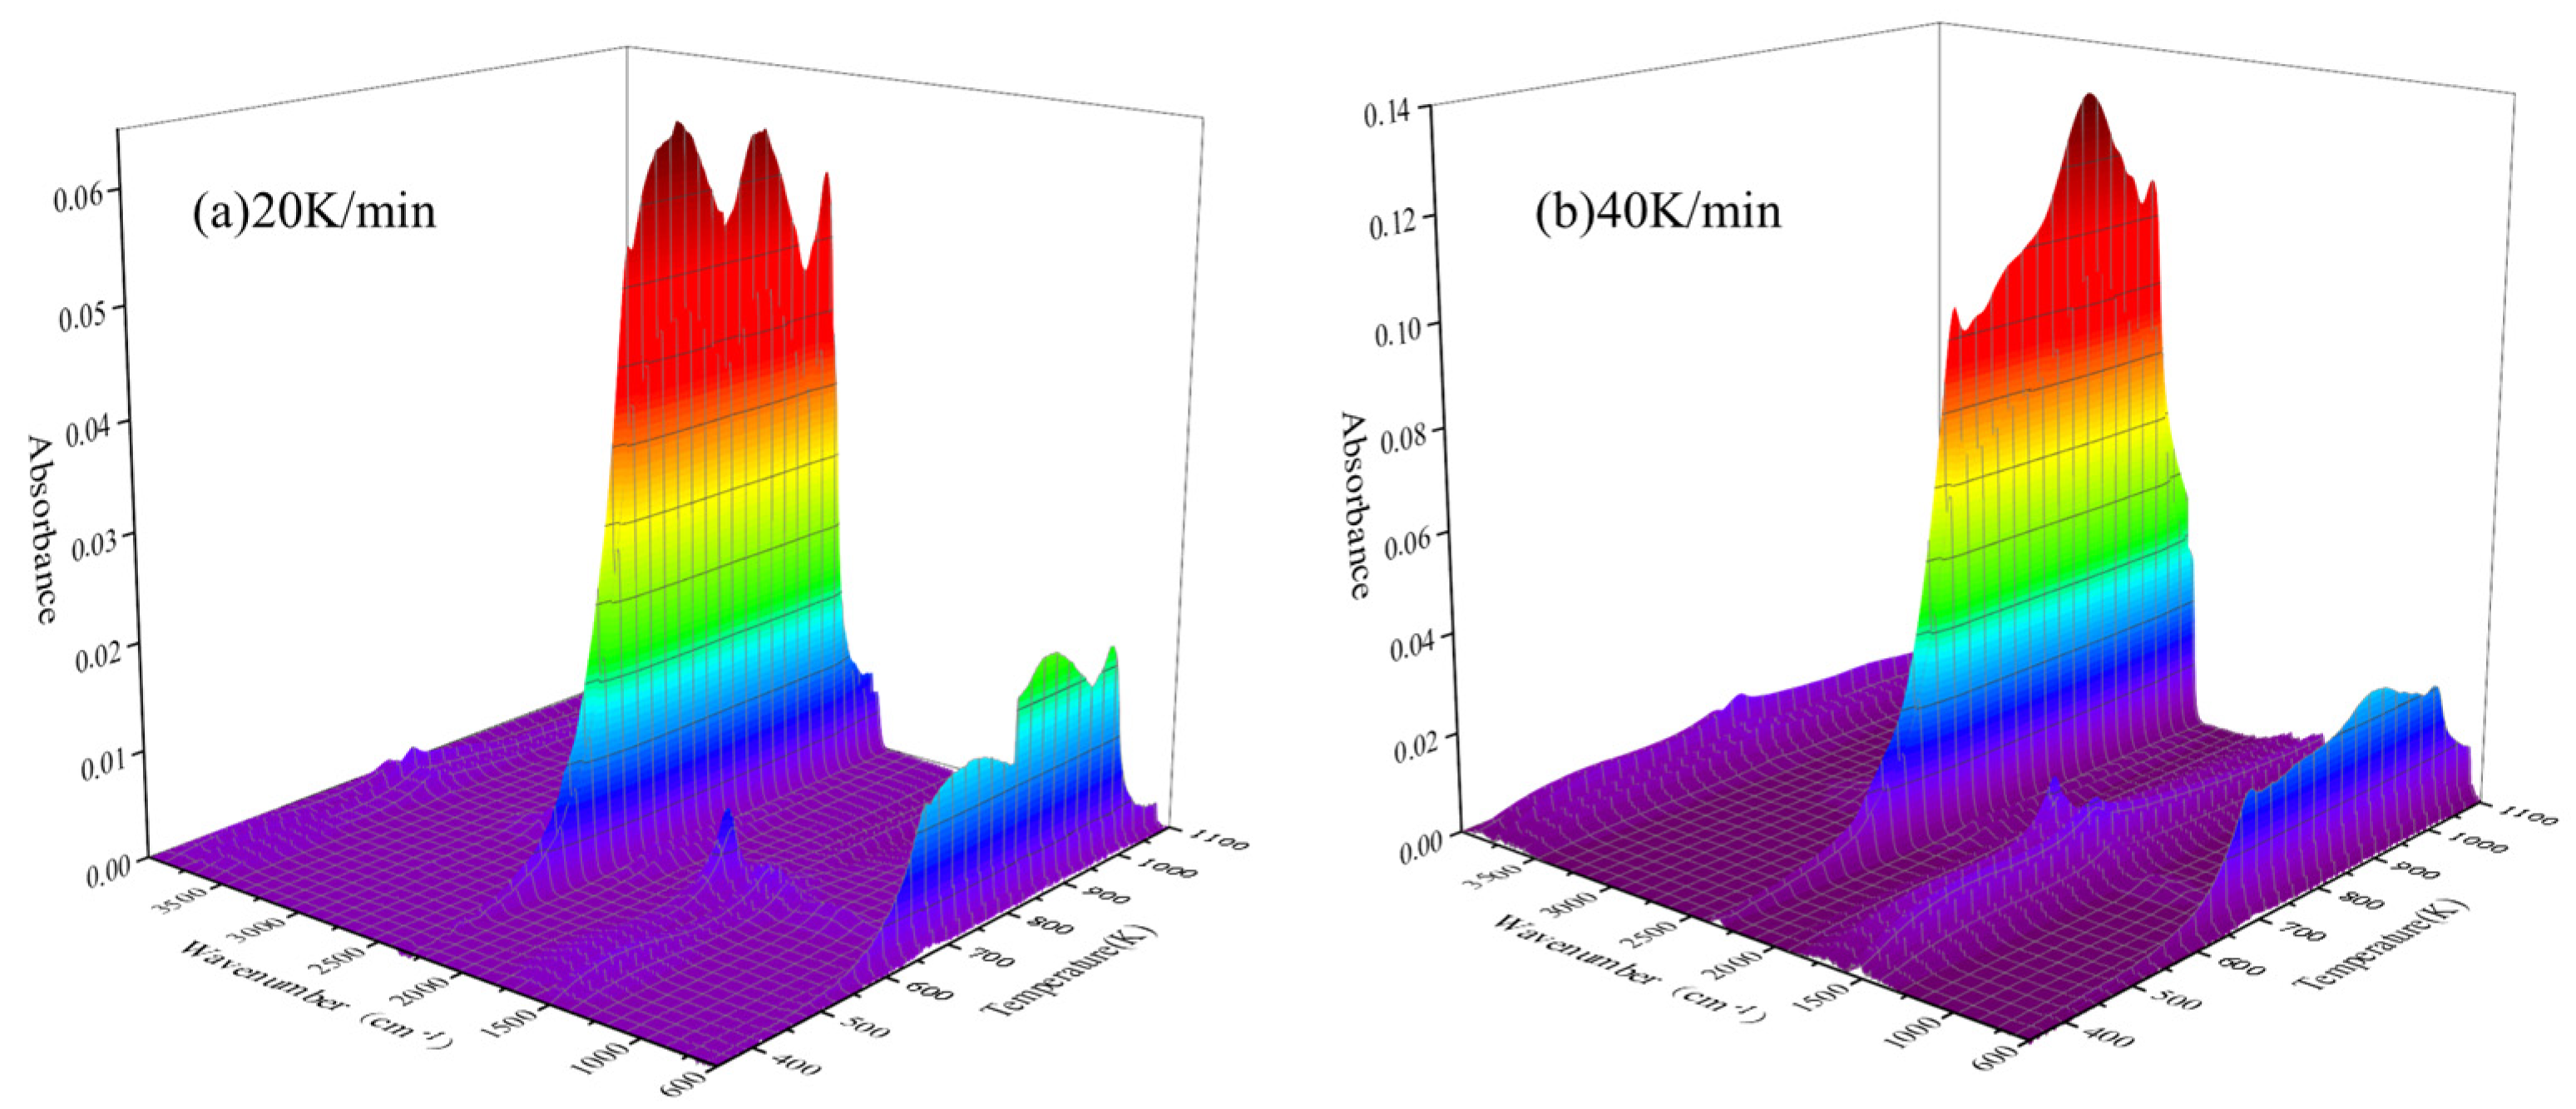
The typical 3D spectrum of TG-FTIR is illustrated in Figure 6, which provides information as a function of wavenumber and temperature [40]. The composition of generated gases can be determined by characteristic wavenumber bands, while the production history of the products can be obtained from the absorbance as a function of temperature. Figure 6 indicates that the reaction intensifies significantly after 600 K, primarily occurring within the temperature range of 600–1100 K, which aligns with the DTG curves. Additionally, it is observed that at a heating rate of 40 K/min, a distinct maximum CO2 absorbance appears at approximately 2357 cm−1 at 973 K, suggesting higher CO2 release at this specific temperature. Based on the absorbance data obtained from TG-FTIR at different heating rates as a function of temperature, the absorbance values at various heating rates (10, 20, 30, and 40 K/min) were calculated and compared with experimental results. The results show that the peak temperatures corresponding to the highest absorbance under these heating rates are 1023 K, 875 K, 1086 K, and 979 K, respectively. The FTIR spectra corresponding to these peak temperatures exhibit a prominent and identifiable CO2 band within 2250–2400 cm−1. A significant amount of CO2 begins to evolve during the second stage, indicating that gaseous products initiate foaming of the char layer. Concurrently, a peak is observed in the 600–750 cm−1 range, attributed to CO2 generated from carbonate reactions in the cement fiberboard. By comparing the absorption spectra shown in Figure 7, these spectra display significant similarity in the maximum peaks across different heating rates. This observation suggests that the heating rate had a negligible influence on the types of gases released during the pyrolysis of IFRC.
As illustrated by the results in Figure 6, the Fourier-transform infrared (FTIR) spectra obtained under different heating rates exhibit consistent wavenumber positions of the characteristic absorption peaks. This observation indicates that neither the types of functional groups nor the species of released gaseous products change with variations in heating rate, since the wavenumber of a characteristic absorption peak in an FTIR spectrum directly corresponds to the structural features of a specific functional group or gas molecule, and the stability of wavenumber positions serves as a core basis for confirming no change in product species.
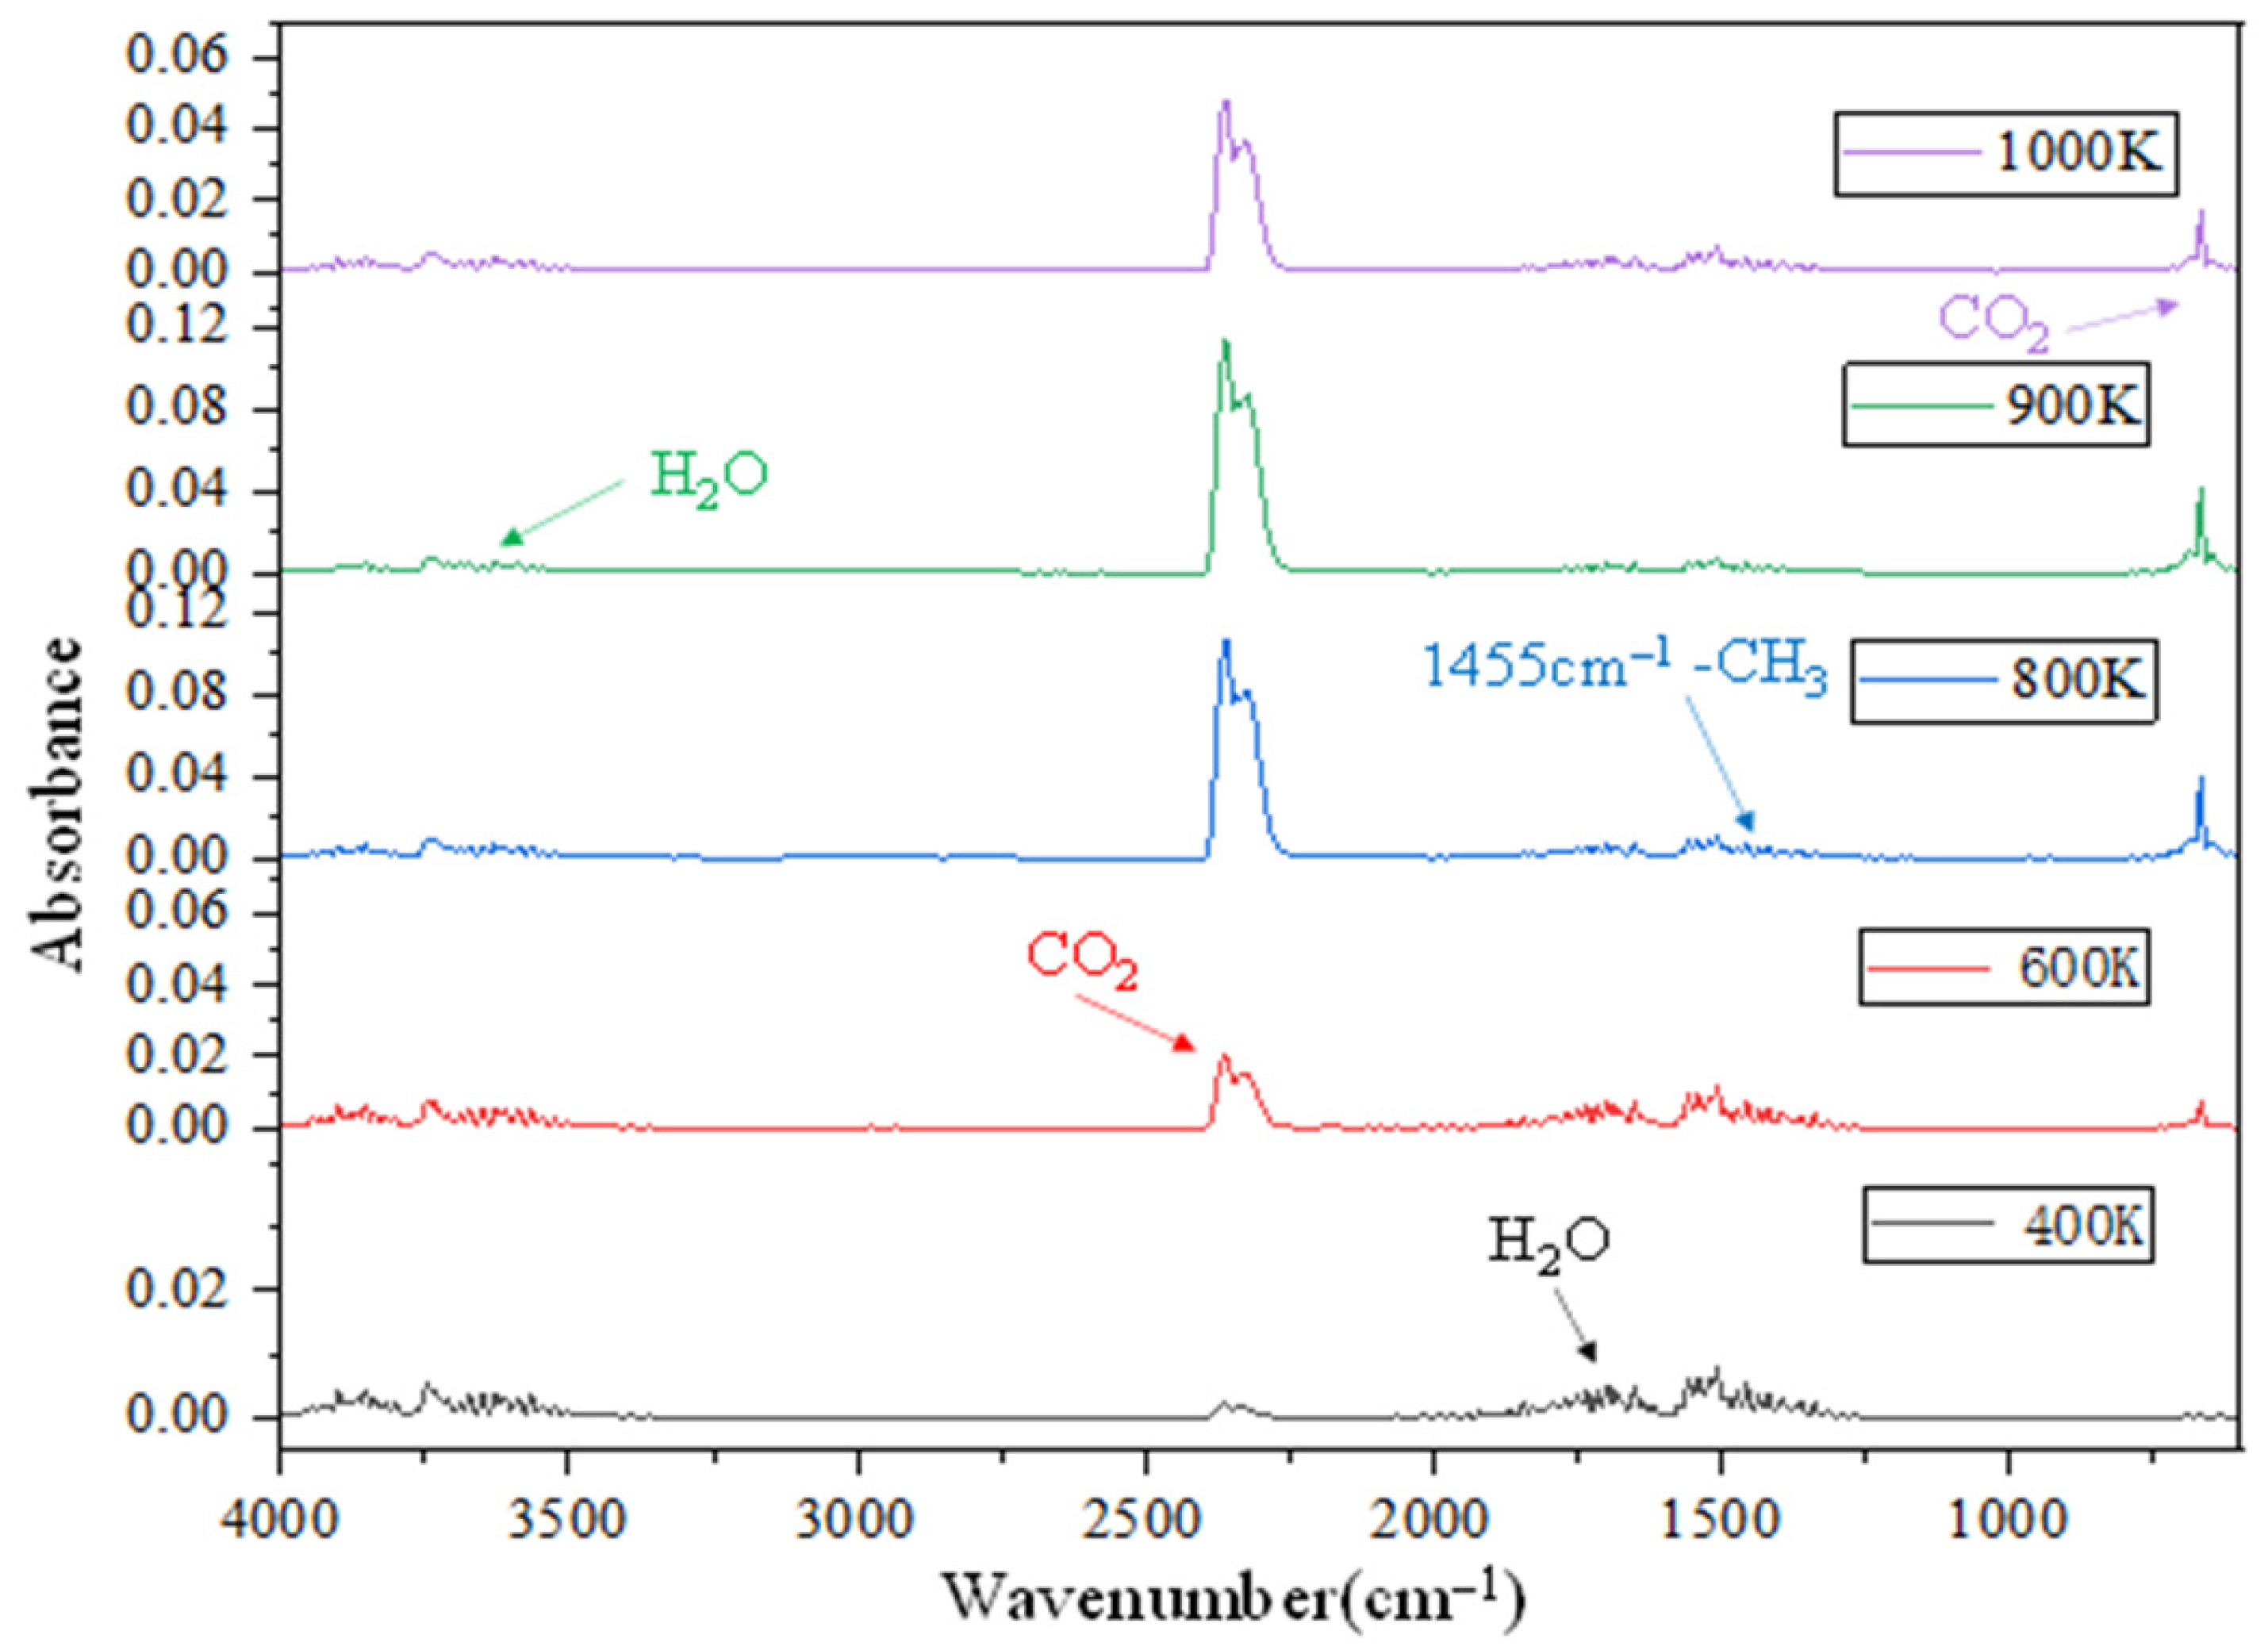
As shown in Figure 7, five representative temperatures from 350 K to 1100 K are provided. Spectra were selected to characterize the compositional changes of released gaseous products with temperature. A small amount of CO2 begins to evolve at 400 K, with its production increasing as temperature rises. Notably, a significant absorption band spans 3100–2750 cm−1 (associated with H2O and CO2), while the CH4 absorption band is located at 1450–1500 cm−1. A summary of gaseous products and functional groups is illustrated in Table 6.
Throughout the pyrolysis process, the primary gaseous species include carbon dioxide (CO2), water (H2O), and methane (CH4). The evolution profiles of these three typical gas products are illustrated in Figure 8, showing the historical evolution of CO2, H2O, and CH4 with temperature during pyrolysis at heating rates of 40 and 20 K/min. CO2 is the dominant gas produced during the pyrolysis of cement fiberboard. Among the gases, CO2 generation is most significantly influenced by the heating rate, whereas H2O and CH4 production exhibit little correlation with the heating rate.

3.4. Speculation on Reaction Mechanisms

During the pyrolysis process, the cement fiberboard undergoes a series of complex reactions that critically influence its fire resistance and structural stability. Integrated thermogravimetric and Fourier-transform infrared spectroscopy analyses reveal that the high-temperature reaction process of cement fiberboard can be categorized into four characteristic stages, with apparent activation energies of 124.6, 219.8, 251.6, and 433.0 kJ·mol−1 for each stage, respectively. Considering the wood fibers are included in the reaction process, the reported activation energy of hemicellulose (112.6 kJ·mol−1), cellulose (162.8 kJ·mol−1), and lignin (156.8 kJ·mol−1) by Chen et al. [50] are used for comparison with our current study.
Stage I (350–550 K): Within this temperature range, the material primarily undergoes physical transformations and initial pyrolysis. Bound water within the matrix gradually evaporates, and the hemicellulose in wood fibers begins to decompose. The apparent activation energy of this stage (124.6 kJ·mol−1) is very close to that of hemicellulose (112.6 kJ·mol−1) [42], confirming that this stage is co-dominated by bond water evaporation and primary decomposition of hemicellulose.
Stage II (550–750 K) and Stage III (750–950 K): As temperature increases, the decomposition of wood fiber plays a dominant role in this process. Specifically, these two stages can be attributed to hemicellulose, cellulose, and lignin. In addition, the decomposition of Ca(OH)2 may occur during the process. The apparent activation energies of these two stages (219.8 and 251.6 kJ·mol−1) are higher than those of pure hemicellulose (112.6 kJ·mol−1), cellulose (162.8 kJ·mol−1), and lignin (156.8 kJ·mol−1) [50].
Stage IV (950–1100 K): Under extremely high temperatures, the activation energy reaches 433.0 kJ·mol−1, clearly exceeding the range of wood component pyrolysis, indicating that the dominant reaction mechanism has shifted to high-temperature inorganic processes. In this stage, the release of CO2 is driven by two key processes: the final decomposition of residual carbonates and the possible carbothermal reduction reactions between residual carbon char and silica [51]. These strongly endothermic reactions collectively explain the high activation energy phenomenon (433.0 kJ·mol−1). The possible reaction equations for the four stages are listed as follows:
Stage I:
B o n d   w a t e r v a p o r
H e m i c e l l u l o s e c h a r + C O 2 + H 2 O
Stage II and III:
H e m i c e l l u l o s e ,   C e l l u l o s e ,   L i g n i n c h a r + C H 4 + C O 2 + H 2 O
C a O H 2 C a O + H 2 O
Stage IV:
C a C O 3 C a O + C O 2
C a C O 3 + S i O 2 C a S i O 3 + C O 2

4. Conclusions

In this study, TGA was coupled with FTIR spectroscopy to investigate the pyrolysis behavior and kinetics of fiber–cement composites. A double-Gaussian deconvolution approach was utilized to resolve four overlapping mass-loss peaks, and both model-free methods and model-fitting methods were employed to determine the kinetic parameters and mechanisms of the pyrolysis reaction. The apparent activation energies E a for the first, second, third, and fourth reaction stages were calculated to be 124.6, 219.8, 251.6, and 433.0 kJ·mol−1, respectively, with the corresponding reaction-mechanism functions identified as g(α) = [ l n ( 1 a ) ] 4 , g(α) = ( 1 α ) 3 1 , g(α) = α 3 / 2 , and g(α) = ( 1   α ) 2 1 . These stages were characterized, in sequence, by assumed random nucleation and its subsequent growth, contracting sphere (spherical symmetry), nucleation, and chemical reaction.
The TGA–FTIR spectral analysis further revealed the possible pyrolysis reactions of cement fiberboards in the four distinct stages. CH4 is primarily released during Stages II and III, mainly attributed to the pyrolysis of hemicellulose, cellulose, and lignin. The gas production sequence consistently remained CO2 > H2O > CH4.

Author Contributions

Conceptualization, Y.Z. and L.T.; methodology, Y.H.; software, C.Y.; validation, Y.D.; formal analysis, W.D.; writing—original draft preparation, Y.Z. and Y.H.; writing—review and editing, Y.D.; visualization, W.D. All authors have read and agreed to the published version of the manuscript.

Funding

The authors would like to acknowledge financial support sponsored by the Science and Technology Project of Guangdong Power Grid Co., Ltd. of China (Grant No. 031200WS22210025).

Data Availability Statement

Data will be made available on request.

Conflicts of Interest

The authors declare no conflict of interest.

References

  1. Shao, Y.; Qiu, J.; Shah, S.P. Microstructure of extruded cement-bonded fiberboard. Cem. Concr. Res. 2001, 31, 1153–1161. [Google Scholar] [CrossRef]
  2. Guntekin, E.; Sahin, H.T. Accelerated weathering performance of cement bonded fiberboard. Sci. Res. Essays 2009, 4, 484–492. [Google Scholar]
  3. He, Z.; Jia, Y.; Wang, S.; Mahoutian, M.; Shao, Y. Maximizing CO2 sequestration in cement-bonded fiberboards through carbonation curing. Constr. Build. Mater. 2019, 213, 51–60. [Google Scholar] [CrossRef]
  4. Soroushian, P.; Marikunte, S.; Won, J.-P. Statistical Evaluation of Mechanical and Physical Properties of Cellulose Fiber Reinforced Cement Comr posites. Mater. J. 1995, 92, 172–180. [Google Scholar]
  5. ASTM E136-19; Standard Test Method for Assessing Combustibility of Materials Using a Vertical Tube Furnace at 750 °C. ASTM International: West Conshohocken, PA, USA, 2019.
  6. EN 13501-1:2018; Fire Classification of Construction Products and Building Elements—Part 1: Classification Using Data from Reaction to Fire Tests. European Committee for Standardization (CEN): Brussels, Belgium, 2018.
  7. Małaszkiewicz, D.; Sztukowska, M. Utilization of wastes from medium density fiberboards production as an aggregate for lightweight cement composite. Matec Web Conf. 2018, 174, 02005. [Google Scholar] [CrossRef]
  8. Shao, Y.; Shah, S. Mechanical properties of PVA fiber reinforced cement composites fabricated by extrusion processing. Mater. J. 1997, 94, 555–564. [Google Scholar]
  9. GB 50016-2014; Code for Fire Protection Design of Buildings. China Planning Press: Beijing, China, 2014.
  10. International Organization for Standardization (ISO). Fibre-ceent flat shets—Product Specification and Test Methods; ISO: Geneva, Switzerland, 2017. [Google Scholar]
  11. ASTM International. Standard Specification for Mineral Fiber Block and Board Thermal Insulation; ASTM International: West Conshohocken, PA, USA, 2019. [Google Scholar]
  12. International Organization for Standardization (ISO). Cellular Plastics—Thermoplastic Materials—Specification for Rigid Foam for thermal Insulation of Buildings; ISO: Geneva, Switzerland, 2018. [Google Scholar]
  13. International Organization for Standardization (ISO). Thermal Insulation Products for Building Equipment and Industrial Installations—Determination of Organic Content; ISO: Geneva, Switzerland, 2023. [Google Scholar]
  14. International Organization for Standardization (ISO). Refractory Products—Methods of Test for Ceramic Fibre Products; ISO: Geneva, Switzerland, 1999. [Google Scholar]
  15. Maynet, W.; Samsudin, E.; Soh, N.N. Physical and mechanical properties of cement board made from oil palm empty fruit bunch fibre: A review. In Proceedings of the IOP Conference Series: Materials Science and Engineering, Batu Pahat, Malaysia, 1–2 December 2020; IOP Publishing: Bristol, UK, 2021. [Google Scholar]
  16. Ferreira, S.D.; Altafini, C.R.; Perondi, D.; Godinho, M. Pyrolysis of Medium Density Fiberboard (MDF) wastes in a screw reactor. Energy Convers. Manag. 2015, 92, 223–233. [Google Scholar] [CrossRef]
  17. Ranachowski, Z.; Ranachowski, P.; Dębowski, T.; Gorzelańczyk, T.; Schabowicz, K. Investigation of structural degradation of fiber cement boards due to thermal impact. Materials 2019, 12, 944. [Google Scholar] [CrossRef]
  18. Yu, Y.; Hou, J.; Dong, Z.; Wang, C.; Lu, F.; Song, P. Evaluating the flammability performance of Portland cement-bonded particleboards with different cement–wood ratios using a cone calorimeter. J. Fire Sci. 2016, 34, 199–211. [Google Scholar] [CrossRef]
  19. Fu, Z.; Yao, Y.J.C. Pyrolysis mechanism of natural fiber in cement-based composites at high temperatures. Constr. Build. Mater. 2022, 351, 128986. [Google Scholar] [CrossRef]
  20. Hou, J.; Jin, Y.; Che, W.; Yu, Y. Value-added utilization of wood processing residues into cement-bonded particleboards with admirable integrated performance. Constr. Build. Mater. 2022, 344, 128144. [Google Scholar] [CrossRef]
  21. Azni, M.E.; Norhan, A.S.; Lofflad, H.; Roslan, S.N. Feasibility study on empty fruit bunch (EFB) cement board. In Proceedings of the ISER 9th International Conference, Berlin, Germany, 30 October 2015. [Google Scholar]
  22. Chen, C.H.; Jang, L.-S.; Lei, M.-Y.; Chou, S. A comparative study of combustibility and surface flammability of building materials. Fire Mater. 1997, 21, 271–276. [Google Scholar] [CrossRef]
  23. Davies, I.; Davies, O. Agro-waste-cement particleboards: A review. MAYFEB J. Environ. Sci. 2017, 2, 10–26. [Google Scholar]
  24. Mayer, A.K.; Kuqo, A.; Koddenberg, T.; Mai, C. Seagrass-and wood-based cement boards: A comparative study in terms of physico-mechanical and structural properties. Compos. Part A Appl. Sci. Manuf. 2022, 156, 106864. [Google Scholar] [CrossRef]
  25. Jiang, G.; Xu, X.; Zhang, J.; He, C.; Tao, S.; Wu, Y.; Ding, Y. Pyrolysis characteristics and reaction mechanism of intumescent fire-retardant coating with thermogravimetry/Fourier transform infrared analysis. J. Anal. Appl. Pyrolysis 2024, 177, 106306. [Google Scholar] [CrossRef]
  26. Ding, Y.; Ezekoye, O.A.; Lu, S.; Wang, C. Thermal degradation of beech wood with thermogravimetry/Fourier transform infrared analysis. Energy Convers. Manag. 2016, 120, 370–377. [Google Scholar] [CrossRef]
  27. Chen, R.; Lu, S.; Zhang, Y.; Lo, S. Pyrolysis study of waste cable hose with thermogravimetry/Fourier transform infrared/mass spectrometry analysis. Energy Convers. Manag. 2017, 153, 83–92. [Google Scholar] [CrossRef]
  28. Thirugnanam, S.; Srinivasan, R.; Anand, K.; Bhardwaj, A.; Puthilibai, G.; Madhu, P.; Karthick, A. Utilisation possibilities of waste medium-density fiberboard: A material recycling process. Mater. Today Proc. 2022, 59, 1362–1366. [Google Scholar] [CrossRef]
  29. Xu, X.; Chen, R.; Pan, R.; Zhang, D. Pyrolysis kinetics, thermodynamics, and volatiles of representative pine wood with thermogravimetry–Fourier transform infrared analysis. Energy Fuels 2020, 34, 1859–1869. [Google Scholar] [CrossRef]
  30. Correia, D.M.; Ribeiro, C.; Ferreira, J.C.; Botelho, G.; Ribelles, J.L.G.; Lanceros-Méndez, S.; Sencadas, V. Influence of electrospinning parameters on poly (hydroxybutyrate) electrospun membranes fiber size and distribution. Polym. Eng. Sci. 2014, 54, 1608–1617. [Google Scholar] [CrossRef]
  31. Zhang, D.; Pan, R.; Chen, R.; Xu, X. Pyrolysis characteristics and reaction mechanisms of pine needles. Appl. Biochem. Biotechnol. 2019, 189, 1056–1083. [Google Scholar] [CrossRef]
  32. Kissinger, H.E. Variation of peak temperature with heating rate in differential thermal analysis. J. Res. Natl. Bur. Stand. 1956, 57, 217–221. [Google Scholar] [CrossRef]
  33. Ding, Y.; Fukumoto, K.; Ezekoye, O.A.; Lu, S.; Wang, C.; Li, C. Experimental and numerical simulation of multi-component combustion of typical charring material. Combust. Flame 2020, 211, 417–429. [Google Scholar] [CrossRef]
  34. Ding, Y.; Jiang, G.; Fukumoto, K.; Zhao, M.; Zhang, X.; Wang, C.; Li, C. Experimental and numerical simulation of multi-component combustion of typical no-charring material. Energy 2023, 262, 125555. [Google Scholar] [CrossRef]
  35. Horowitz, H.H.; Metzger, G. A new analysis of thermogravimetric traces. Anal. Chem. 1963, 35, 1464–1468. [Google Scholar] [CrossRef]
  36. Ozawa, T. A new method of analyzing thermogravimetric data. Bull. Chem. Soc. Jpn. 1965, 38, 1881–1886. [Google Scholar] [CrossRef]
  37. Slopiecka, K.; Bartocci, P.; Fantozzi, F. Thermogravimetric analysis and kinetic study of poplar wood pyrolysis. Appl. Energy 2012, 97, 491–497. [Google Scholar] [CrossRef]
  38. Zhang, J.; Liu, J.; Evrendilek, F.; Xie, W.; Kuo, J.; Zhang, X.; Buyukada, M. Kinetics, thermodynamics, gas evolution and empirical optimization of cattle manure combustion in air and oxy-fuel atmospheres. Appl. Therm. Eng. 2019, 149, 119–131. [Google Scholar] [CrossRef]
  39. Sharma, P.; Pandey, O.; Diwan, P.J.F. Non-isothermal kinetics of pseudo-components of waste biomass. Fuel 2019, 253, 1149–1161. [Google Scholar] [CrossRef]
  40. Jiang, L.; Zhang, D.; Li, M.; He, J.-J.; Gao, Z.-H.; Zhou, Y.; Sun, J.-H. Pyrolytic behavior of waste extruded polystyrene and rigid polyurethane by multi kinetics methods and Py-GC/MS. Fuel 2018, 222, 11–20. [Google Scholar] [CrossRef]
  41. Zhang, J.; Ding, Y.; Chen, W.; Li, C.; Jiao, Y. Pyrolysis kinetics, thermodynamics, and interaction analysis of co-pyrolysis of bituminous coal and electrolytic aluminum solid waste. Fuel 2023, 333, 126375. [Google Scholar] [CrossRef]
  42. Dungani, R.; Jawaid, M.; Khalil, H.P.S.A.; Jasni, J.; Aprilia, S.; Hakeem, K.R.; Hartati, S.; Islam, M.N. A Review on Quality Enhancement of Oil Palm Trunk Waste by Resin Impregnation: Future Materials. BioResources 2013, 8, 3136–3156. [Google Scholar] [CrossRef]
  43. Sidhu, N.; Mastalski, I.; Zolghadr, A.; Patel, B.; Uppili, S.; Go, T.; Maduskar, S.; Wang, Z.; Neurock, M.; Dauenhauer, P.J. On the intrinsic reaction kinetics of polypropylene pyrolysis. Matter 2023, 6, 3413–3433. [Google Scholar] [CrossRef]
  44. Raveendran, K.; Ganesh, A.; Khilar, K. Pyrolysis characteristics of biomass and biomass components. Fuel 1996, 75, 987–998. [Google Scholar] [CrossRef]
  45. Gao, X.; Jiang, L.; Xu, Q. Experimental and theoretical study on thermal kinetics and reactive mechanism of nitrocellulose pyrolysis by traditional multi kinetics and modeling reconstruction. J. Hazard. Mater. 2020, 386, 121645. [Google Scholar] [CrossRef] [PubMed]
  46. Chen, R.; Xu, X.; Lu, S.; Zhang, Y.; Lo, S. Pyrolysis study of waste phenolic fibre-reinforced plastic by thermogravimetry/Fourier transform infrared/mass spectrometry analysis. Energy Convers. Manag. 2018, 165, 555–566. [Google Scholar] [CrossRef]
  47. Chen, D.; Yin, L.; Wang, H.; He, P. Pyrolysis technologies for municipal solid waste: A review. Waste Manag. 2014, 34, 2466–2486. [Google Scholar] [CrossRef] [PubMed]
  48. Derakhshesh, Z.; Khorasani, M.; Akhlaghi, S.; Keyvani, B.; Alvani, A.A.S. Design and optimization of an intumescent flame retardant coating using thermal degradation kinetics and Taguchi’s experimental design. Polym. Int. 2012, 61, 926–933. [Google Scholar] [CrossRef]
  49. Chen, R.; Li, Q.; Xu, X.; Zhang, D. Pyrolysis kinetics and reaction mechanism of representative non-charring polymer waste with micron particle size. Energy Convers. Manag. 2019, 198, 111923. [Google Scholar] [CrossRef]
  50. Chen, T.; Li, L.; Zhao, R.; Wu, J. Pyrolysis kinetic analysis of the three pseudocomponents of biomass–cellulose, hemicellulose and lignin: Sinusoidally modulated temperature method. J. Therm. Anal. Calorim. 2017, 128, 1825–1832. [Google Scholar] [CrossRef]
  51. Zeng, F.-G.; Jia, J.-B. Reaction types and kinetics of methane generation from Huolinhe lignite pyrolysis by TG/MS experiment and quantum chemical calculations. Acta Phys.-Chim. Sin. 2009, 25, 1117–1124. [Google Scholar]
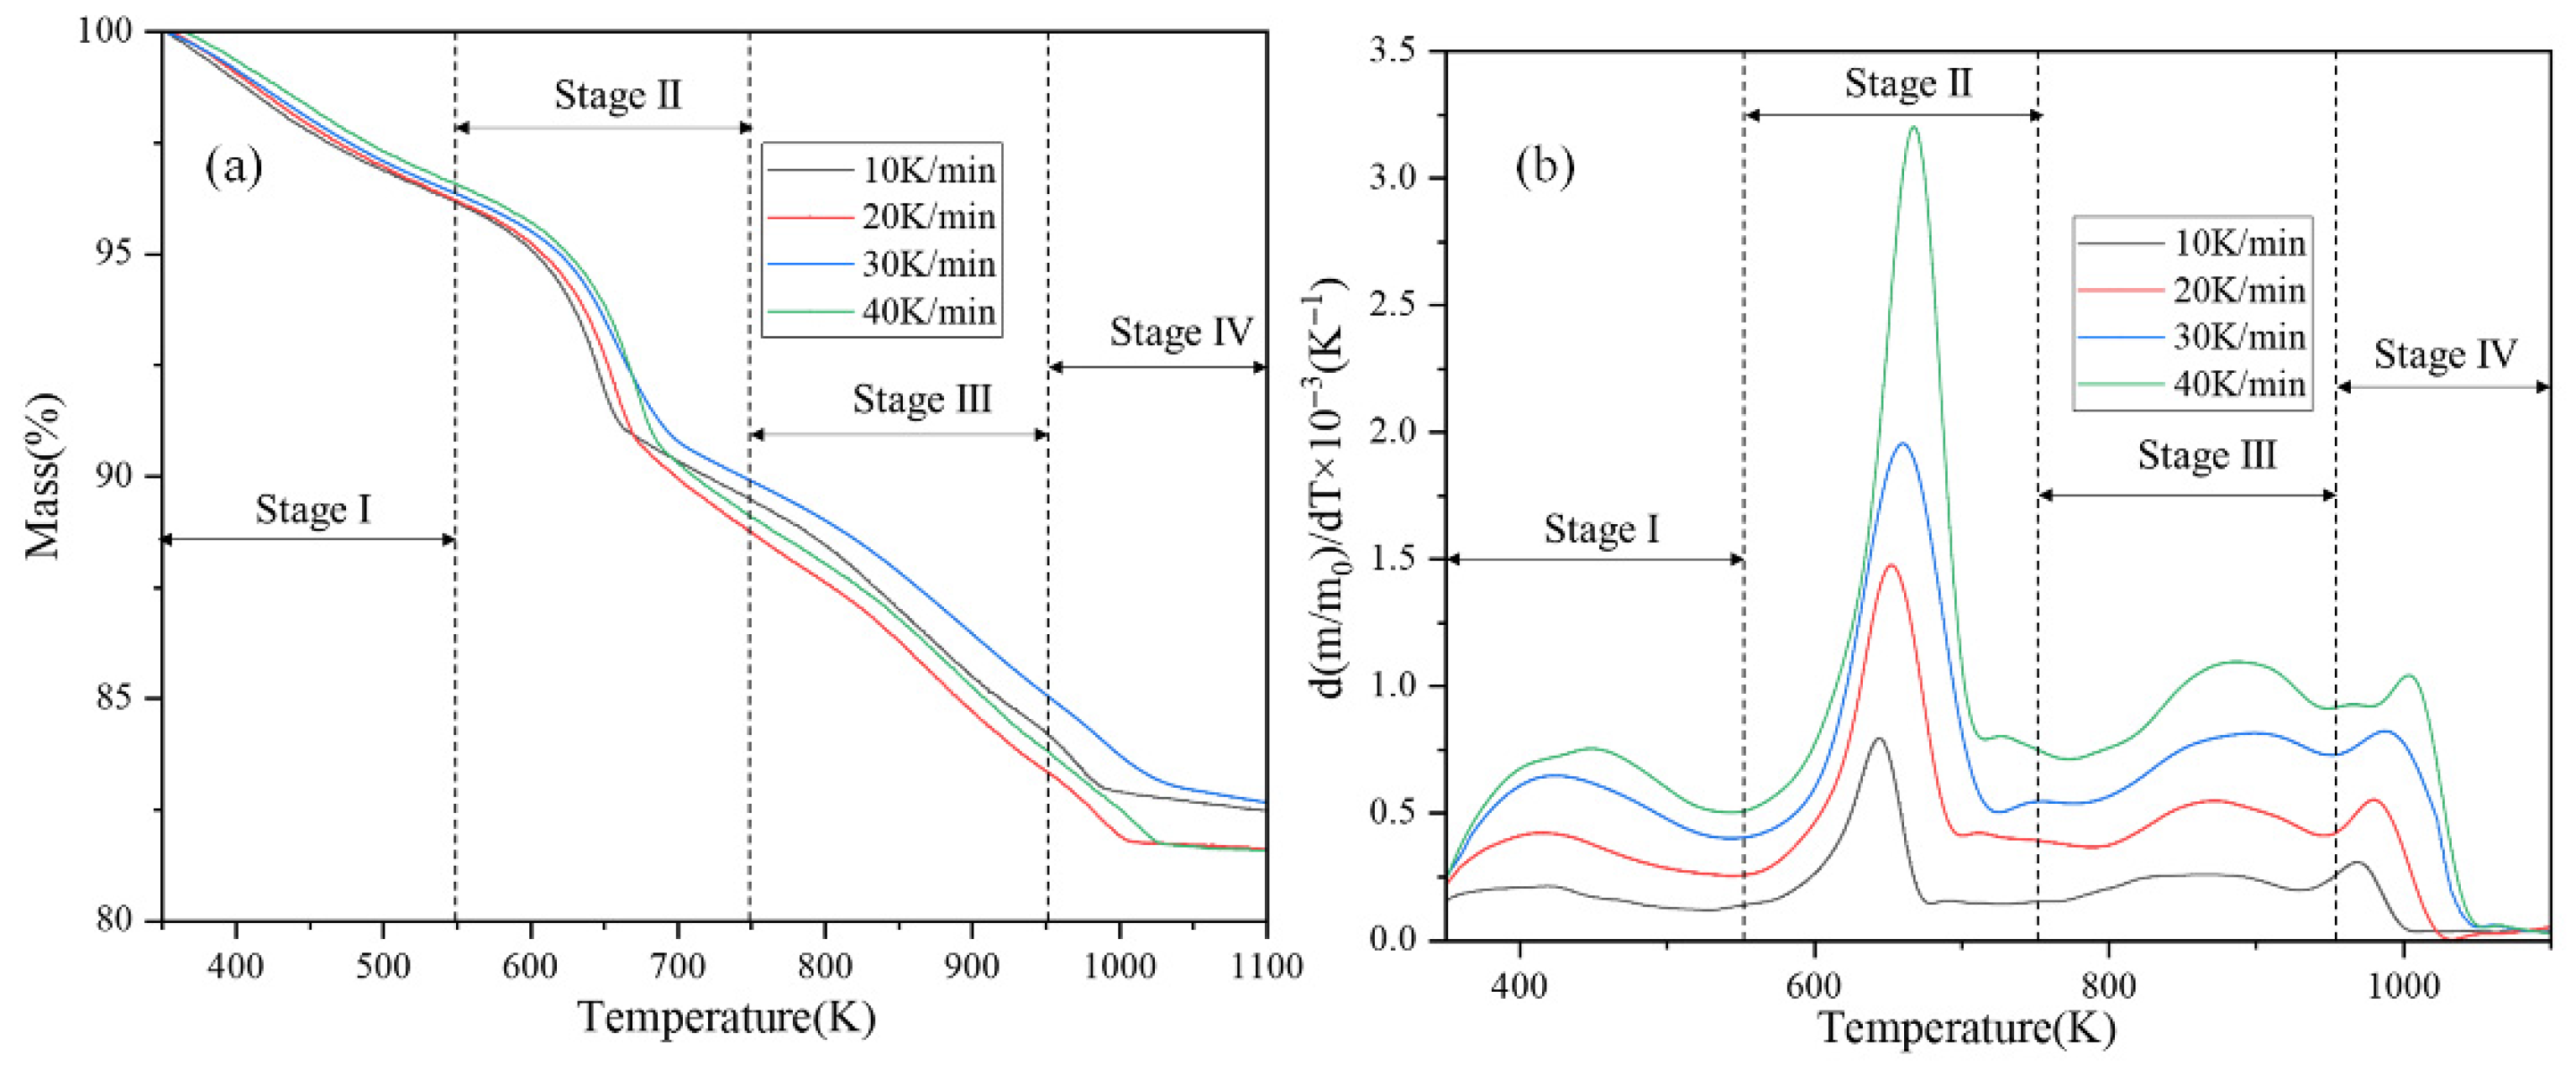
Figure 1. TG and DTG curves of cement fiberboard: (a) TG curve; (b) DTG curve.
Fire 08 00426 g001
Figure 2. Deconvolution results of the reaction rate curves of cement fiberboard at four heating rates: (a) 10 K/min; (b) 20 K/min; (c) 30 K/min; (d) 40 K/min.
Fire 08 00426 g002
Figure 3. FWO plots for the four stages at different conversion rates.
Fire 08 00426 g003
Figure 4. KAS plots for the four stages at different conversion rates.
Fire 08 00426 g004
Figure 5. CR plot of the pyrolysis of fiber cement boards at 10 K/min: (a) Stage I; (b) Stage II; (c) Stage III; (d) Stage IV.
Fire 08 00426 g005
Figure 6. Absorbance spectra stack plot of TG-FTIR at various heating rates: (a) 20 K/min; (b) 40 K/min.
Fire 08 00426 g006
Figure 7. Absorption spectra of various temperatures at 40 K/min.
Fire 08 00426 g007
Figure 8. Absorbance of evolved gases throughout the pyrolysis at 40 and 20 K/min: (a) 20 K/min; (b) 40 K/min.
Fire 08 00426 g008
Table 1. Comparison table of fire resistance ratings and freeze–thaw resistance performance for common building materials.
Material TypeFire Rating (GB 8624 Standard)Freeze–Thaw Cycle Resistance (Cycles)Key Freeze–Thaw Indicators (Post-Freeze Performance Retention Rate)Applicable Building Types & RequirementsImplementation Standard/Reference
Cement fiber boardClass A (non-combustible)≥50 cycles (−20~20 °C)Flexural strength retention ≥ 85%, compressive strength ≥ 90%High-rise buildings, public places, underground projects (must meet Class A external insulation requirements of GB50016 [9])ISO 8336:2017 [10]
Rock wool boardClass A (non-combustible)Not applicable (inorganic material, good freeze resistance)Severe cold region external insulation, fire isolation belt (Class A mandatory for public buildings and residential)ASTM C612 [11]
Extruded polystyrene board (XPS)Class B1 (hardly combustible)≤25 cycles (prone to cracking)Mass loss rate ≤ 5%Low-rise residential, non-crowded public spaces (building height < 24 m, B2 grade allowed)ISO 4898:2018 [12]
EPS foam boardClass B2 (combustible)≤15 cycles (high water absorption)Relative dynamic modulus loss ≤ 30%Temporary buildings, low-risk buildings (strictly prohibited in high-rise and crowded public buildings)ISO 4898:2018 [12]
Perlite boardClass A (non-combustible)Not applicable (indoor dry environment)Roof insulation, top-level insulation (must meet Class A fireproof insulation, e.g., stair exits, escape routes)ISO 6334:2023 [13]
Ceramic fiber boardClass A (non-combustible)≥100 cycles (high temperature, freeze–thaw resistant)Mass loss rate ≤ 3%High-temperature industrial equipment, fireproof core (dual resistance to heat and freeze–thaw)ISO 10635:1999 [14]
Table 2. Common reaction mechanisms for solids.
No. f ( α ) g ( α ) Reaction Model
11 α Zero-order
2 1     α l n ( 1 α ) First-order
3 2 / 3 α 1 / 2 α 3 / 2 Nucleation
4 1 / 2 ( 1 α ) [ l n ( 1 a ) ] 1 [ l n ( 1 α ) ] 2 Assumed random nucleation and its subsequent growth
5 1 / 3 ( 1 α ) [ l n ( 1 a )   ] 2 [ l n ( 1 α ) ] 3 Assumed random nucleation and its subsequent growth
6 1 / 4 ( 1 α ) [ l n ( 1   a )   ] 3 [ l n ( 1 a ) ] 4 Assumed random nucleation and its subsequent growth
7 3 / 2 ( 1 α ) 1 / 3 1 ( 1 α ) 2 / 3 Chemical reaction
8 4 ( 1 a ) 3 / 4 1 ( 1 α ) 1 / 4 Chemical reaction
9 2 ( 1 α ) 3 / 2 ( 1 α ) 1 / 2 1 Chemical reaction
10 ( 1 α ) 2 ( 1 α ) 1 1 Chemical reaction
11 1 / 2 ( 1     α ) 3 ( 1 α ) 2 1 Chemical reaction
12 1 / 3 ( 1 α ) 4 ( 1 α ) 3 1 Chemical reaction
13 1 / 2 α 1 α 2 One-dimensional diffusion
14 [ l n ( 1 α ) ] 1 α + ( 1 α ) l n   ( 1     α )Two-dimensional diffusion
15 ( 3 / 2 ) ( 1 α ) 2 / 3 [ 1 ( 1 α ) 1 / 3 1 1 ( 1 α ) 1 / 3 2 Three-dimensional diffusion, spherical symmetry
16 ( 3 / 2 ) ( 1 α ) 1 / 3 1 ] 1 1 2 / 3 α ( 1 α ) 2 / 3 Three-dimensional diffusion, cylindrical symmetry
17 2 ( 1 α ) 1 / 2 1 ( 1 α ) 1 / 2 Contracting cylinder
18 3 ( 1 α ) 2 / 3 1 ( 1 α ) 1 / 3 Contracting sphere
Table 3. Deconvolution parameters for four stages of pyrolysis of cement fiberboard.
StageParameter10 K/min20 K/min30 K/min40 K/min
Stage I y 0 0000
x c 364.99384.82405.43449.06
H0.160.330.450.64
w 1 18.8326.7932.7976.53
w 2 160.5991.3677.11215.41
Stage II y 0 0000
x c 645.35656.45662.87667.81
H0.551.141.512.53
w 1 29.4627.1730.3623.33
w 2 16.7516.1821.8517.75
Stage III y 0 0000
x c 887.79914.37906.63885.01
H0.220.490.570.70
w 1 126.55270.01202.78140.70
w 2 36.5433.9143.4432.77
Stage IV y 0 0000
x c 968.79984.911000.971004.98
H0.220.490.750.95
w 1 23.5520.8520.1877.80
w 2 17.8617.4319.3618.74
Table 4. Activation energy based on FWO and KAS.
(a) Stage I and II
Stage I
α
* FWO
E a
R2* KAS
E a
R2Stage II
α
* FWO
E a
R2* KAS
E a
R2
0.30137.0030.98138.6150.980.30240.4650.99260.7910.99
0.35131.3470.97132.5440.970.35227.3441.00247.2411.00
0.40131.1790.99132.4950.990.40219.0261.00238.68551.00
0.45130.2410.96131.0970.960.45212.0881.00231.5441.00
0.50130.4230.98131.3550.970.50208.7791.00228.1730.99
0.55129.3250.96129.9740.960.55206.4561.00225.8201.00
0.60142.8790.98143.4980.990.60201.9861.00221.2251.00
0.70137.3850.97138.5750.970.65200.8990.99220.1491.00
* Ave133.200 134.226 0.70204.3611.00223.8111.00
0.75209.6580.99231.640.99
0.80206.4800.98228.3840.98
* Ave211.635 233.455
(b) Stage III and IV
Stage III
α
* FWO
E a
R2* KAS
E a
R2Stage IV
α
* FWO
E a
R2* KAS
E a
R2
0.30270.8810.90272.6610.930.30457.5310.92454.5450.93
0.40286.0940.93284.7650.920.40403.8060.92403.1050.92
0.50210.5830.94209.7940.930.50427.9630.90425.5150.91
0.60248.0980.95247.1350.960.70457.5310.92454.5450.92
0.70225.6080.96223.9650.970.80403.8060.93403.1050.91
0.80241.1470.97239.1540.96* Ave427.963 425.51
* Ave247.069 246.246
* Ave: Average; FWO: Flynn-Wall-Ozawa method; KAS: Kissinger-Akahira-Sunose method.
Table 5. Calculation results by the CR method.
(a) Stage I
NO. g ( α ) 10 K/min
E a
R220 K/min
E a
R230 K/min
E a
R240 K/min
E a
R2
1 α 13.600.8214.220.8514.640.8415.330.89
2 ln ( 1 α ) 22.250.9623.080.9723.740.9724.480.98
3 α 3 / 2 24.020.8724.970.8925.590.8826.670.92
4 [ ln ( 1 α ) ] 2 51.750.9753.440.9854.740.9856.310.99
5 [ ln ( 1 α ) ] 3 81.250.9883.810.9885.740.9888.150.99
6 [ ln ( 1 α ) ] 4 * 110.75* 0.98* 114.18* 0.98* 116.75* 0.98* 119.98* 0.99
7 1 ( 1 α ) 2 / 3 16.120.8816.800.9017.280.918.000.93
8 1 ( 1 α ) 1 / 4 19.770.9420.540.9521.130.9521.870.97
9 ( 1 α ) 1 / 2 1 27.870.9928.820.9929.650.9930.390.99
10 ( 1 α ) 1 1 34.320.9935.400.9936.440.9937.170.99
11 ( 1 α ) 2 1 49.290.9850.690.9752.190.9852.880.96
12 ( 1 α ) 3 1 49.290.9867.970.9570.000.9670.630.93
13 α 2 34.440.8935.730.9036.540.938.010.93
14 α + ( 1 α ) ln ( 1 α ) 39.190.9240.600.9341.530.9343.050.96
15 [ 1 ( 1 α ) 1 / 3 ] 2 45.240.9546.780.9647.880.9649.440.98
16 1 2 / 3 α ( 1 α ) 2 / 3 41.180.9342.630.9443.620.9445.150.96
17 1 ( 1 α ) 1 / 2 17.510.9118.220.9218.750.9219.470.95
18 1 ( 1 α ) 1 / 3 18.990.9319.740.9420.310.9421.040.97
(b) Stage II
NO. g( α )10 K/min
E a
R220 K/min
E a
R230 K/min
E a
R240 K/min
E a
R2
1 α 54.600.8654.480.9047.860.9259.030.96
2 ln ( 1 α ) 81.950.9481.220.9771.780.9886.230.98
3 α 3 / 2 87.250.8787.140.9177.190.9393.980.96
4 [ ln ( 1 α ) ] 2 174.600.95173.260.97154.360.98183.310.99
5 [ ln ( 1 α ) ] 3 267.250.95265.310.98236.930.99280.390.99
6 [ ln ( 1 α ) ] 4 359.900.95357.350.98319.510.99377.470.99
7 1 ( 1 α ) 2 / 3 62.510.8962.240.9354.810.9466.960.97
8 1 ( 1 α ) 1 / 4 74.070.9373.530.9664.920.9778.450.98
9 ( 1 α ) 1 / 2 1 99.880.9798.650.9887.340.99103.830.98
10 ( 1 α ) 1 1 120.560.98118.710.99105.230.99124.020.97
11 ( 1 α ) 2 1 168.640.98165.300.97146.750.98170.800.93
12 ( 1 α ) 3 1 * 222.93* 0.96* 217.92* 0.95* 203.66* 0.96* 223.60* 0.90
13 α 2 119.900.88119.790.92106.520.93128.920.96
14 α + ( 1 α ) ln ( 1 α ) 134.790.90134.410.94119.630.95143.890.97
15 [ 1 ( 1 α ) 1 / 3 ] 2 153.900.93153.080.96136.320.97162.860.98
16 1 2 / 3 α ( 1 α ) 2 / 3 141.070.91140.550.95125.120.96150.130.98
17 1 ( 1 α ) 1 / 2 66.900.9166.540.9458.660.9671.340.98
18 1 ( 1 α ) 1 / 3 71.600.9271.130.9562.770.9776.000.98
(c) Stage III
NO. g( α )10 K/min
E a
R220 K/min
E a
R230 K/min
E a
R240 K/min
E a
R2
1 α 135.980.82142.190.85166.940.88153.300.89
2 ln ( 1 α ) 222.540.96230.760.97253.150.96244.820.98
3 α 3 / 2 * 240.19* 0.87* 249.74* 0.89* 269.86* 0.89* 266.70* 0.92
4 [ ln ( 1 α ) ] 2 517.530.97534.450.98545.190.97563.140.99
5 [ ln ( 1 α ) ] 3 812.530.97838.140.98837.260.97881.460.99
6 [ ln ( 1 α ) ] 4 1141.830.981387.390.971129.320.971533.350.94
7 1 ( 1 α ) 2 / 3 161.160.88167.980.90192.020.91180.010.93
8 1 ( 1 α ) 1 / 4 197.730.93205.390.95228.420.95218.660.97
9 ( 1 α ) 1 / 2 1 278.700.98288.150.99309.060.98303.940.99
10 ( 1 α ) 1 1 343.200.99354.030.99373.320.99371.710.99
11 ( 1 α ) 2 1 492.920.97506.880.97522.450.98528.790.96
12 ( 1 α ) 3 1 662.170.95679.660.95691.110.96706.330.93
13 α 2 367.110.90357.290.90372.790.9380.100.93
14 α + ( 1 α ) ln ( 1 α ) 391.940.92405.980.93420.110.93430.540.96
15 [ 1 ( 1 α ) 1 / 3 ] 2 452.350.95467.790.96480.280.95494.370.98
16 1 2 / 3 α ( 1 α ) 2 / 3 411.810.93426.310.94439.910.94451.550.96
17 1 ( 1 α ) 1 / 2 175.090.93182.230.92205.880.93194.740.95
18 1 ( 1 α ) 1 / 3 189.940.94197.420.94220.670.94210.440.97
(d) Stage IV
NO. g( α )10 K/min
E a
R220 K/min
E a
R230 K/min
E a
R240 K/min
E a
R2
1 α 136.760.94325.760.91209.490.89232.060.93
2 ln ( 1 α ) 214.440.90468.740.98323.630.94333.680.98
3 α 3 / 2 213.460.96496.810.91330.160.92356.330.93
4 [ ln ( 1 α ) ] 2 445.540.91953.820.98679.090.95683.830.98
5 [ ln ( 1 α ) ] 3 676.630.921438.900.981034.590.951033.990.98
6 [ ln ( 1 α ) ] 4 907.720.921923.970.981390.080.951384.140.98
7 1 ( 1 α ) 2 / 3 158.860.89367.330.94242.310.95261.700.95
8 1 ( 1 α ) 1 / 4 191.730.96427.730.96290.570.90304.620.97
9 ( 1 α ) 1 / 2 1 266.720.86561.690.99399.110.89399.360.99
10 ( 1 α ) 1 1 * 327.65* 0.92* 468.51* 1.00* 486.49* 0.92* 474.65* 0.99
11 ( 1 α ) 2 1 470.370.89916.530.99690.440.96649.250.96
12 ( 1 α ) 3 1 631.690.921196.850.97921.190.98846.640.94
13 α 2 290.170.97667.850.91450.850.93480.600.93
14 α + ( 1 α ) ln ( 1 α ) 331.480.91746.240.94512.460.97536.570.95
15 [ 1 ( 1 α ) 1 / 3 ] 2 385.980.97846.060.96592.340.91607.460.97
16 1 2 / 3 α ( 1 α ) 2 / 3 349.340.93779.060.95538.680.88559.900.96
17 1 ( 1 α ) 1 / 2 171.280.92390.320.95260.620.97278.060.96
18 1 ( 1 α ) 1 / 3 184.670.95414.860.96280.250.89295.490.97
* Bold values: indicate the most suitable reaction mechanism function selected based on the closest agreement with the average activation energy.
Table 6. Gas products and functional groups by FTIR.
Gas Products/Functional GroupsWavenumber Band (cm−1)
CO22400–2260, 680–660
H2O4000–3500, 1800–1300
-CH33100–2750, 1380–1350
Disclaimer/Publisher’s Note: The statements, opinions and data contained in all publications are solely those of the individual author(s) and contributor(s) and not of MDPI and/or the editor(s). MDPI and/or the editor(s) disclaim responsibility for any injury to people or property resulting from any ideas, methods, instructions or products referred to in the content.