Article

Effect of Twin-Fluid Mass Ratio on Near-Field Spray Characteristics and Dynamics of a Novel Two-Phase Injector with an Internal Swirl

Department of Mechanical Engineering, Baylor University, One Bear Place # 97356, Waco, TX 76798-7356, USA
*
Author to whom correspondence should be addressed.
Fire 2025, 8(11), 425; https://doi.org/10.3390/fire8110425 (registering DOI)
Submission received: 24 September 2025 / Revised: 24 October 2025 / Accepted: 28 October 2025 / Published: 31 October 2025

Abstract

The present study investigates the influence of atomizing air-to-liquid mass ratio (ALR) on the near-field spray characteristics and stability of a novel twin-fluid injector that integrates bubble-bursting for primary atomization and shear-induced secondary atomization. Unlike conventional injectors, the novel design generates ultra-fine sprays at the exit with low sensitivity to liquid properties. The previous version improved secondary atomization even for highly viscous liquids, showing strong potential in hydrogel-based fire suppression. The current design improves primary atomization, leading to more stable and finer sprays. The near-field spray characteristics are quantified using a high-speed shadowgraph across ALRs ranging from 1.25 to 2.00. This study found that stable and finely atomized sprays are produced across all the tested ALRs. Increasing ALR reduces droplet size, while the spray is the widest at 1.25. Sauter Mean Diameter (SMD) contours show larger droplets at the edges and smaller ones toward the center, with ALR 2.00 yielding the most uniform size distribution. As per the atomization efficiency, ALR of 1.25 shows the best performance. Overall, an optimum ALR of 1.75 is identified, offering balanced droplet size distribution, stability, and atomization efficiency, making the injector potentially suitable for fire suppression and liquid-fueled gas turbines requiring high stability and fuel flexibility.

Graphical Abstract

1. Introduction

The rapid and efficient suppression of fires is a paramount concern in engineering and safety science; a challenge addressed through a multifaceted approach to interrupting the combustion process. Sprinkler systems are among the most commonly used fire suppression methods in buildings and other settings, largely because of their proven ability to control flames and prevent fire from spreading beyond its source [1]. At the same time, concerns remain that their activation can lead to secondary issues, such as water damage to the building and its contents, once the fire is extinguished [2]. A cornerstone of modern fire protection strategy involves the deployment of finely atomized fluids, commonly known as water mist. Water applied in the form of a mist has been shown to serve as an effective fire suppression medium. The NFPA specifies water mist as a spray in which 99% of the droplets have diameters smaller than 1000 µm [1]. Unlike conventional fire sprinkler systems that rely on large droplets to cool a fire, water mist or spray systems leverage the unique thermodynamic properties of a liquid when dispersed into a very fine spray. This atomization technique dramatically increases the total surface area of the water, enabling exceptionally efficient heat transfer.
Upon contact with the heat source, these micron-sized droplets rapidly absorb thermal energy through endothermic vaporization. This swift phase change from liquid to gas is a highly effective cooling mechanism, extracting significant heat from the fire plume and the surrounding hot gases. As the water vaporizes, it undergoes a massive volumetric expansion, with one liter of water expanding to approximately 1700 L of steam [3]. This rapid expansion serves a crucial second purpose: it actively displaces oxygen from the combustion zone, effectively starving the fire of a key component needed to sustain a reaction [1]. This synergistic action of simultaneous cooling and oxygen displacement allows water mist systems to achieve superior suppression capabilities with a minimal volume of water, thereby mitigating collateral damage from waterlogging. The ability to produce such fine and uniform sprays is not only critical for fire safety but also presents a foundational principle for other applications that depend on efficient fluid–gas interactions, such as clean energy systems.
However, studies comparing traditional water-based agents with hydrogel-based fire suppressants show that hydrogels outperform conventional water-based agents, significantly reducing fire extinguishing time and improving effectiveness [4]. The fire suppression performance of liquid-based agents is strongly dependent on their spray and atomization behavior. For conventional water and low-viscosity liquids, pressure-driven nozzles can generate fine droplets [1]. However, for high-viscosity fluids like hydrogels, atomization becomes significantly more difficult due to resistance to breakup, leading to larger droplets, poor cone angle formation, and reduced penetration range [5]. These limitations hinder spray uniformity and diminish the effectiveness of traditional atomization systems. Recent work by Liu et al. [6] demonstrates that employing liquid CO2 as an atomization medium can overcome these challenges by enhancing droplet breakup and reducing average droplet size, thereby improving the delivery efficiency of viscous hydrogel sprays. Parallel to improvements in injection technology, hydrogel-based extinguishing agents have gained attention for their superior adhesion, water retention, and thermal stability compared to water or foams [7]. Thermosensitive hydrogel formulations exhibit viscosity adaptation at elevated temperatures, enabling them to adhere effectively to combustible surfaces while reducing re-ignition risks and enhancing insulation [8]. These materials can rapidly absorb heat, form protective films that isolate oxygen, and maintain moisture content for prolonged cooling.
More recently, hydrogel fire extinguishing technology (HFET) has been explored for high-risk applications such as lithium-ion battery (LIB) fires, where traditional agents like dry powder, foam, and CO2 are insufficient. Zhao et al. [7] summarize that hydrogels suppress fires through a combined mechanism of endothermic cooling, oxygen isolation, and combustion inhibition, while also offering environmental advantages due to their non-toxic and non-corrosive composition. Importantly, hydrogel sprays can delay thermal runaway propagation in battery modules and maintain surface temperatures below critical thresholds, providing longer suppression and re-ignition resistance compared to conventional agents. A comprehensive review by Li et al. [9] further highlights that hydrogel extinguishants, prepared from both natural and synthetic polymers, possess high water content, eco-friendliness, film-forming capability, and degradability. These features, along with their capacity to form adhesive and cooling barriers, make hydrogels promising for disaster prevention, large-scale fire suppression, and protection of life, property, and the environment. Together, these studies underscore that the integration of advanced atomization strategies with the unique physicochemical properties of hydrogels offers a promising pathway toward effective suppression of high-temperature and complex fire scenarios. Optimizing injection conditions for viscous hydrogels, while leveraging their inherent cooling and insulating capabilities, represents a critical direction for developing next-generation fire suppression technologies.
However, conventional atomizers, such as airblast (AB) nozzles, first discharge a jet/sheet core even for low-viscosity water. The jet/sheet disintegrates into ligaments, then large droplets due to shear-layer instabilities between the air stream and liquid fuel under varying velocity and density conditions [10]. The interfacial instabilities governing the sheet/jet breaking-based atomization of conventional atomizers are significantly suppressed even when the viscosity increases slightly (e.g., ~9 times, i.e. 9x, more viscous than water), resulting in deteriorated atomization for the viscous alternative jet fuel C-3 [11,12,13,14]. It is thus expected to yield even worse atomization for highly viscous hydrogels which are usually >100x more viscous than water. Other atomizers using internal two-phase mixing could generate fine atomization by bubble-bursting but they suffer instability and/or low efficiency issues. For instance, dissolved gas atomization nucleates bubbles from gas initially dissolved in the liquid, producing fine sprays even at low dissolved-gas fractions; however, slow bubble-growth kinetics limit its practical applicability [15]. Flash (boiling) atomization occurs when a small fraction of the liquid or one of its components undergoes rapid evaporation, producing bubbles [16]. This process is limited to liquids with high volatility. Effervescent atomization (EA) addresses these drawbacks by producing fine sprays even from highly viscous liquids, achieved by rapidly injecting pressurized gas through aerators into the liquid stream within the mixing chamber before it reaches the injector body [17]. Nevertheless, the upstream bubbly flow may evolve into slug flow, characterized by large bubbles, or into an annular flow pattern, both of which can result in an unstable and pulsating spray [17].
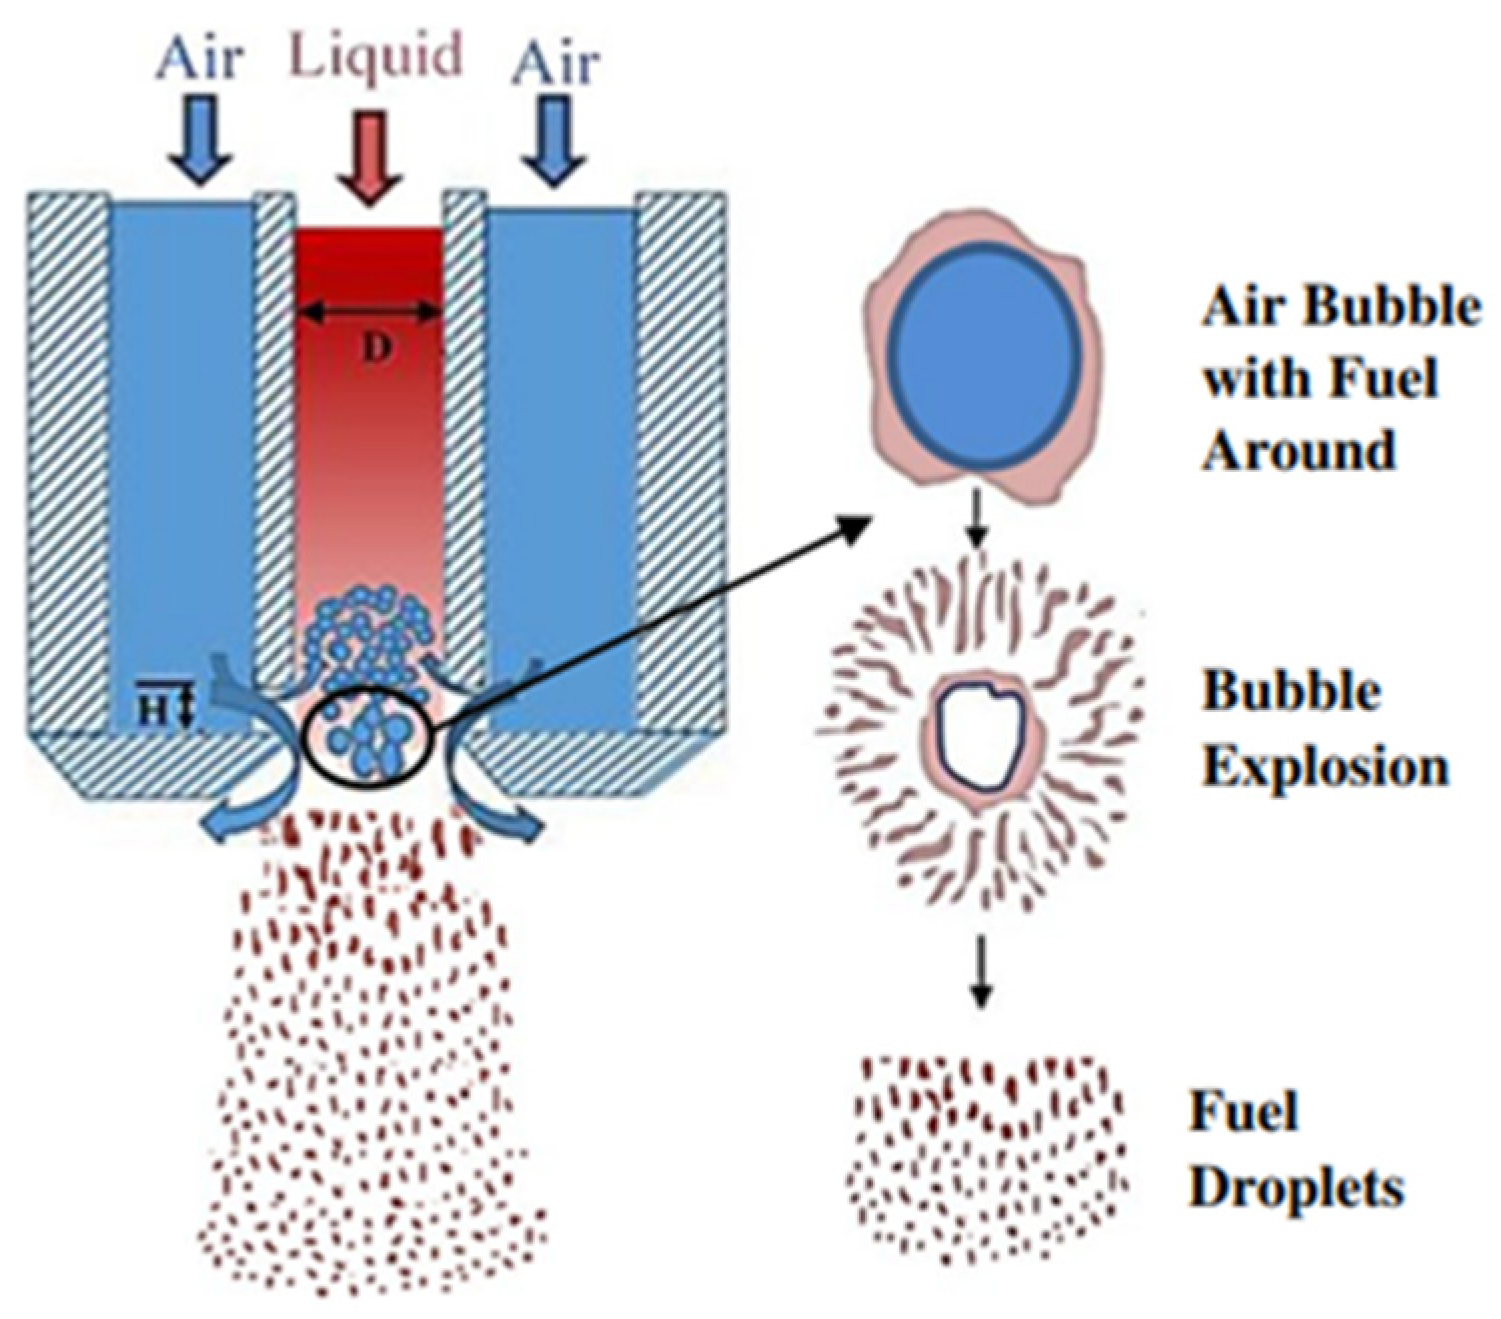
In light of these challenges, flow-blurring (FB) atomization has emerged as a promising alternative with robust atomization performance while overcoming the shortcomings of the other two-phase atomizers. The FB offers immediately fine atomization for liquids with a wide range of properties, even including highly viscous glycerol (~750x more viscous than water) [18,19,20], representing high liquid flexibility. It has a 10x atomization efficiency increase over the AB injector [19,21]. The ultra-fine FB atomization effectuates via a unique internal twin-fluid atomization process in a relatively simple design [22], with significantly lower injection pressure than that of AB atomizers, reducing the overall system complexity and cost and enhancing operation efficiency [23]. As shown in Figure 1, the FB injection concept effectuates when (1) the inner liquid tube diameter coincides with that of the exit orifice; (2) the gap region, H, between the injector exit and internal liquid tube tip width H ≤ 0.25 D [19]. Due to the stagnation point that occurs at the base near the gap region, the atomizing air (AA) bifurcates, with part of it flowing back and going up into the liquid line and the remainder leaving out of the injector [19]. The air and liquid mix inside the liquid line right at the inner liquid tube tip to create air bubbles [19]. Then as the air bubbles leave the injector, they expand and burst directly at the injector exit orifice due to the pressure drop experienced at that location [19]. The bubble-bursting at the injector exit or slightly upstream results in fine liquid sprays, defined as the primary atomization of the two-phase FB injector [19,21]. The liquid droplets travel through the air, away from the injector, undergo further disintegration due to Rayleigh–Taylor instabilities between the liquid phase and the air leaving at high velocity, which is defined as the secondary atomization [19,24]. Unlike the AB jets/films, the FB injector achieved fine sprays immediately at the injector exit [19,25]. Larger droplets tend to form at the periphery of the FB spray [25]. Thus, FB represents an efficient and liquid-flexible atomization method, particularly beneficial for applications requiring fine sprays and effective mixing. FB injectors can also operate effectively at very low liquid flow rates, making them ideal for small-scale applications such as medical inhalers and low-energy burners [26]. However, FB injectors at higher atomizing air-to-liquid mass ratios (ALR) result in a narrower spray angle, which limits liquid dispersion and reduces liquid–air mixing [27]. When using highly viscous liquids, such as straight glycerol, the atomization process also demands a longer completion length [10].
Due to the experimental success of the FB injector and its limitation, the swirl burst injector with enhanced secondary atomization (SBS) was developed by our group [19,28]. It innovatively integrates the FB key geometry and swirled grooves on the chamfered exit orifice of the injector to swirl the air which leaves the injector that does not internally mix with the liquid [19]. The external swirling air accelerates disintegration of the large droplets observed at the spray periphery of the FB atomizer and the ligaments of highly viscous liquid such as glycerol by intensifying the interfacial interaction of the liquid and gaseous phases, i.e., the secondary atomization [20,28]. As a result, the SBS injector achieves wider sprays and smaller droplets at the injector immediate exit compared to the FB injection [19,28]. The SBS injector also generates more uniform droplet distributions, almost halved atomization completion lengths, due to the enhanced secondary breakup through Rayleigh–Taylor instabilities, resulting in superior atomization efficiency compared to FB injectors [29]. The atomization performance of the SBS atomizer is first witnessed in spray combustion that desires fine sprays to evaporate fast and mix more homogenously with the oxidizer and thus burn completely and cleanly. Due to the ultra-fine atomization of various fuels, the SBS has led to a more rapid fuel vaporization and enhanced fuel–air mixing than the FB injection [30]. Without the need for fuel preheating, the ultra-fine and fast SBS atomization has shown significant atomization performance for a variety of sustainable fuels, such as straight algae oil (a biodiesel source oil that is ~50x more viscous than water), high-viscosity aviation blends, and glycerol/methanol combinations [31,32,33]. Yet, the SBS and FB atomizers suffer instabilities at high ALRs due to their shared mechanism of the internal two-phase flow formation that governs the primary atomization [20]. In the FB and SBS atomization, the internal bubble zone length increased axially with an increasing ALR, yielding an internally slug flow or gas voids at a high ALR and consequently an unstable pulsating spray or no spray due to the large gas voids formed [20,34].
These limitations have driven the development of a swirl burst injector with improved primary atomization, called the swirl burst primary (SBP) injector, to improve stability significantly while further enhancing atomization efficiency. The SBP injector, integrating the FB concept, internally swirls the AA that flows back into the liquid line, forcing the air to enter from both the axial and radial directions [12,19]. This creates a more even distribution of air bubbles in the liquid line and prevents them from penetrating too far up the inner liquid line to form a gas void that might offset the spray stability [19]. The more uniform bubble zone with a nearly constant length regardless of the ALR variation minimizes significant gas voids and results in a larger stable working range [12]. Its smaller faster-moving bubbles improve turbulence, resulting in an improved primary atomization, an additional ~22% of small droplets, and thus also enhancing secondary atomization compared to an FB atomizer [12]. These enhancements result in increased spray stability, finer droplets with more uniform size distribution, and hence presumably improved flame coverage and cooling efficiency, making SBP more suitable for effective, reliable fire suppression across a wide range of scenarios [12]. To summarize the progression, a conventional AB injector relies on external two-phase mixing and downstream shear breakup of a jet/film. The EA introduces high-pressure gas for internal mixing in a long mixing chamber to slowly grow bubbles that, however, burst into fine droplets immediately. FB utilizes a simple geometry to rapidly and aerodynamically form an internal two-phase flow, of which bubbles burst the surrounding liquid at the exit, i.e., the primary atomization, forming fine droplets immediately. SBS retains the FB internal geometry and innovatively adds external swirling exit grooves to swirl only the atomizing air externally and intensify secondary atomization. In comparison, the current SBP injector moves the swirl inside with curved internal grooves that swirl the recirculating atomizing air within the inner liquid line to equalize bubble distribution, suppress gas-void growth regardless of increasing ALR, and enhance exit-plane fineness through enhanced primary atomization.
The main novelty of the current study is to quantitatively investigate the unknown influence of ALR on the near-field spray characteristics and dynamics of the novel SBP injector that has shown promise in ultra-fine atomization with high liquid flexibility. The ALR or atomizing gas to liquid mass ratio (GLR) strongly influences droplet formation, atomization efficiency, and spray stability for twin-fluid atomizers [27,34,35]. Optimization of ALR ensures finer droplets, reduces instability, and extends the stable working range, improving overall spray performance. The objective of the current study is to investigate the ALR effect on the spray characteristics, stability, and the atomization efficiency of the SBP injector by taking and comparing qualitative and quantitative information from near-field spray images. The results will provide details for future injector design and computational simulations for various spray applications of the new SBP design.

2. Materials and Methods

2.1. Design of Swirl Burst Injector with Enhanced Primary Atomization

Figure 2 shows the design of the SBP injector with the swirl grooves added on the chamfered outside wall of the inner liquid tube tip of an FB injector (Figure 1). After the bifurcation of the atomizing air at the gap H, the swirl vanes guide the AA back flow to penetrate into the center liquid line in a swirling motion. This intensified the internal two-phase mixing in radial, axial, and tangential directions and thus resulted in a shorter and more stable bubble zone with more evenly distributed smaller bubbles compared to the FB atomization [12]. The injector swirl number (ISN) quantifies the degree of swirl in the flow. It is a dimensionless parameter defined as the ratio of the axial flux of swirl momentum to the axial flux of axial momentum, multiplied by the equivalent nozzle radius [12]. The swirl number (SN) is denoted by Equation (1) [12,19,36]:
S N = 2 3 1 d h d t 3 1 d h d t 2 t a n ϕ
where d h represents the hub diameter, d t represents the diameter of the swirler tip edges, and ϕ represents the vane angle of the curved grooves, which is defined as the angle between the tangent line and the exit of the groove at the inner wall relative to the axis of spray [12,19,36]. Figure 2b,c shows the key geometry of the SBP injector and the dimensions used to calculate the SN [19]. The SBP injector used for this study has an approximated SN of 2.5 and ϕ of 71°, where the inner diameter, D, of the liquid line and exit orifice diameter are both equal to 4.37 mm, and H is equal to 0.20 D, or in this case 0.87 mm [19]. The exit orifice has an angled cut of 120° [19]. The injector used in this study was manufactured using acrylic [19]. For the SBP injector features, the expected dimensional tolerances when printed with acrylic-based resins are approximately ±0.15% of the nominal dimensions. Note that the SN equation used is a geometric parameter originally defined for an axial swirler whose tip diameter does not change along the direction of flow. The present study uses this equation to provide a quantifiable metric to define the key configurations (the vane angle, etc.) of the new SB injectors and quantify the spray feature variations when those configurations vary. Future work will further integrate the physical significance and fluid dynamics dictated by the SB swirl grooves into the equation.

2.2. The Spraying System Setup

Figure 3 shows the overview of the experimental setup for the spray injection and diagnostics system [19]. The SBP injector has two inputs: atomizing air and water used as the working fluid to investigate the effect of ALR [19]. A compressed air tank provided air that was regulated by a 250 SLPM Alicat mass flow controller (MFC) with an accuracy of ±0.8% of the reading and ±0.2% of the full scale [19]. Water was held in a container and regulated by a Cole-Parmer Masterflex L/S Digital Peristaltic Pump (Model 07522-30) with an error of ±0.1% and an in-house built pulsation dampener [19]. The AA and liquid lines both have ProSense DPG1-100 pressure gauges with an accuracy of ±0.5% of the full scale to indicate flow stabilization by showing a constant pressure before data was collected [19]. Table 1 shows the constant liquid flow rate and various air flow rates with corresponding ALRs used in this study [19]. A previous study showed that fully developed sprays, i.e., with onset of fine droplets at the injector immediate exit, were qualitatively identified at ALR > 1.00 for the SBP atomizer [12]. Yet, the effect of ALR on the spray characteristics and dynamics in the SBP near-field remains unknown. The present study quantitatively investigates this impact for ALRs of 1.25–2.00, in which stable and fully developed sprays are acquired for the FB and SBS injections in our previous studies [20,28,34]. In comparison, the present study aims to also gain insight into the effect of ALR in a similar range on near-field spray characteristics and dynamics.

2.3. Experimental Setup of the High-Speed Laser-Driven Shadowgraph Imaging

The shadowgraph imaging technique (SIT) is an advanced diagnostic tool that visualizes density gradients in a transparent medium, like liquid spray [37]. It works by passing a collimated beam of light through the spray. As light encounters a droplet its density changes the refractive index, causing the light rays to refract or bend [38]. A camera positioned behind the spray captures these light intensity variations, creating a “shadowgraph” of light and dark regions that reveal the droplet’s outline [39]. This method fundamentally relies on light refraction, not on diffraction or scattering [40]. Studies by Nasim et al. [29] utilized SIT to investigate the effects of H/D ratio on swirl burst (SB) injectors. Qavi et al. [20] used SIT to investigate the near-field spray characteristics of a high-viscosity alternative jet fuel blend using a FB injector. Breerwood et al. [12] also investigated spray dynamics, i.e., stability, using a time-resolved SIT. These studies demonstrated SIT’s effectiveness in measuring spray characteristics such as droplet size distributions and secondary atomization completion length, as well as spray dynamics.
Figure 3 presents the experimental setup for laser-driven shadowgraph imaging used to investigate the near-field spray characteristics. The system utilizes a Photonics Industries ND:YLF laser (Model DM 30-527-DH, dual head) with a 527 nm wavelength, delivering a maximum energy of 30 mJ per pulse at a 45 A current with a 1 kHz repetition rate [19]. To ensure uniform illumination, an aspherical lens expands the laser beam, which then passes through a frosted glass diffuser [19]. A Rhodamine 6G dye solution (25 mg/L in distilled water) fluoresces when excited by the laser, effectively minimizing speckle noise and enhancing background clarity [19,41]. With a dual-cavity design operating at up to 10 kHz and a 150 ns pulse duration, the laser enables high-speed imaging by freezing the motion of fast-moving droplets and liquid ligaments in the near-field spray region [19].
The camera (Phantom V211) was synchronized with the dual-head laser via DaVis (version 8.4.0) software to sync and capture the laser-driven shadowgraph images [19]. The camera was focused on the spray center plane in the near-field of the injector exit with a field of view (FOV) of ~ 8.25 mm × 13.20 mm at a spatial resolution of 10.3 μm/pixel before image processing [19]. Thus, two pixels are needed to resolve one droplet, yielding the minimum measurable droplet size of 20.6 μm [28,42]. To quantify the spray dynamics, the spray shadowgraph images were captured at 2 kfps, i.e., the dual-head laser repetition rate and the image pair acquisition rate at 1 kHz with an interframe time of 0.7 μs [19]. The laser had a pulse-duration of 150 ns to freeze the fast-moving droplets in the captured images [19]. The aperture f-stop number is f/2.0 and the depth of field of the imaging setup is ∼0.67 mm.

2.4. Image Processing

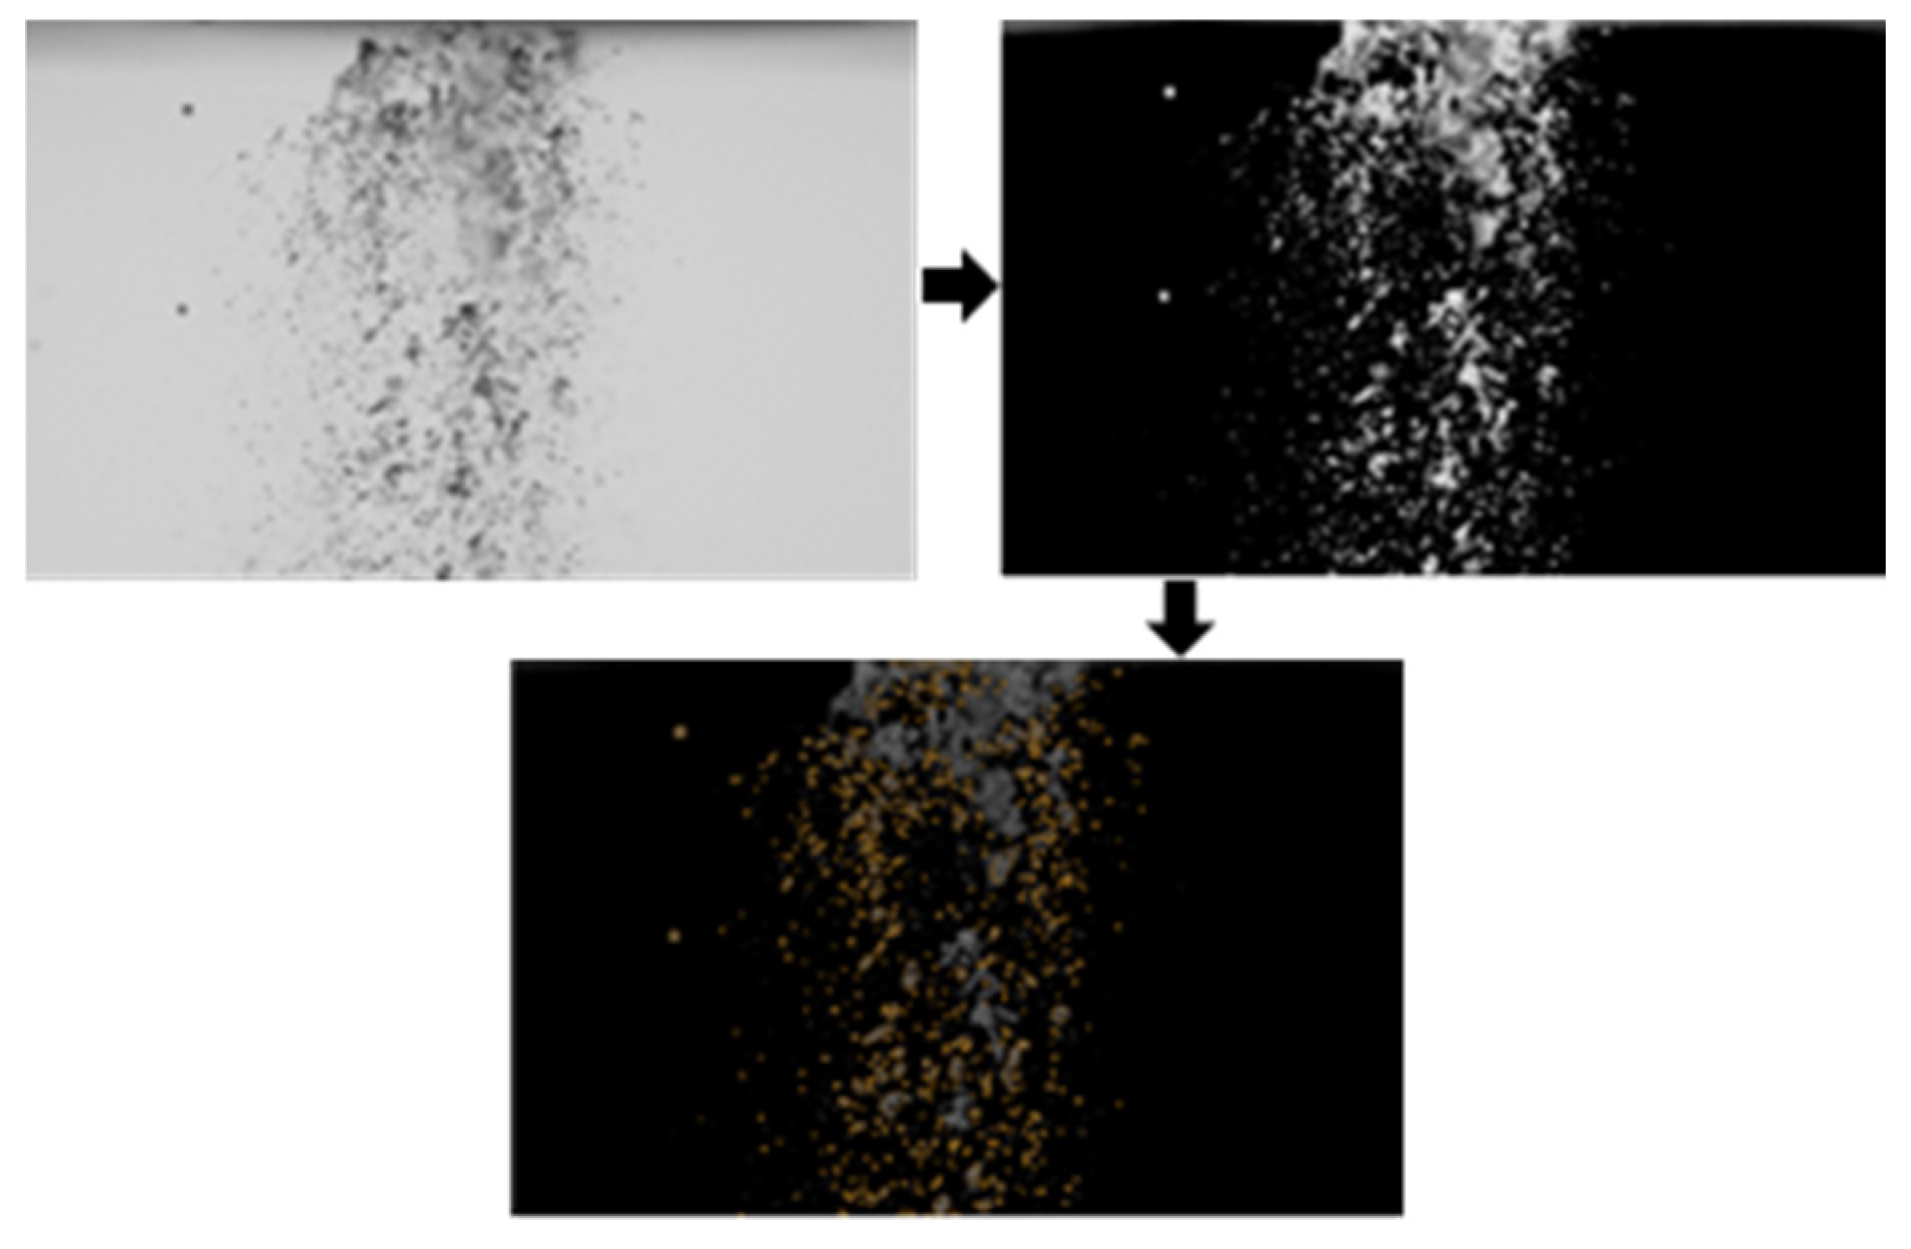
The entire set of 2000 consecutive images at each ALR were processed using Insight 4G software, shown in Figure 4, where a size–shape analysis was conducted using a spatial calibration, field of view, pre-processor, and processor [12,19]. The spatial calibration involved manually setting an origin for all the photos by entering the pixel locations of the exit center of the injector [19]. The field of view (FOV) was chosen by eliminating the part of the photos that showed any part of the injector and only focusing on the near-field of the injector exit [19]. This made the FOV a space of 7.94 mm × 13.20 mm, i.e., the injector near-field [19]. The purpose of the pre-processing is to alter the images in such a way that the processor is best able to accurately detect and measure droplets [19]. This involved performing a grayscale inversion on the images because the Insight 4G software detects white droplets against a black background, while the laser-driven shadowgraph imaging produces the opposite [19]. The pre-processor also subtracted a generated image based on the minimum intensity of all images to get rid of background noise [19]. Then a Laplacian of Gaussian image filter with a kernel size (filter size) of 7 and standard deviation (filter parameter) of 0.5 were implemented to sharpen edges without creating background noise that interferes with edge detection [19]. This operation enhances the contrast between the in-focus droplets and the background, making it easier for the software’s processor to accurately identify the droplet boundaries during binarization. Photos were processed with a binarization threshold of 500 [19]. This value was used to differentiate the focused liquid parts in the spray center plane and those of out-of-plane, due to the difference in grayscale value between in-focus droplets and out-of-plane background values [19]. An 8-connected pixel connectivity was used with minimum and maximum particle diameters of 2 pixels and 16 pixels [19]. Due to the limitation of the Insight 4G software, it cannot simultaneously detect droplets and ligaments. Thus, the present study quantitatively compares the formed droplets of the two injectors at the same flow rates to understand the discrepancy in atomization performance, and the spray characteristics and dynamics.

2.5. Data Analysis

The 2000 images for each ALR were taken subsequentially with each having a time stamp showing 0.0005 s differences [19]. Droplet size distribution was quantitatively evaluated via cumulative volume distribution and spatially resolved Sauter Mean Diameters across the entire image sets (2000 images) for the injector near-field to quantify the spray fineness [19]. In addition, the Sauter Mean Diameters (SMDs) at chosen locations in the injector near-field were calculated for each spray image, which were employed to investigate the local SMD changes over time and thus gain insight into the spray dynamics [19]. A fast Fourier Transform (FFT) was used to analyze the time-resolved SMD using Tecplot, where time was chosen as the independent variable while SMD was chosen as the dependent variable to show the frequency domain [19]. The FFT shows how fast fluctuations occur in the data and where the dominant frequencies were located if there are [19]. The amplitudes indicate the magnitude of the intensity and suggest the stability of the spray based on how much the amplitude fluctuates [19,43].

3. Results and Discussion

3.1. Spray Images and Pressure Change Across Injector Exit

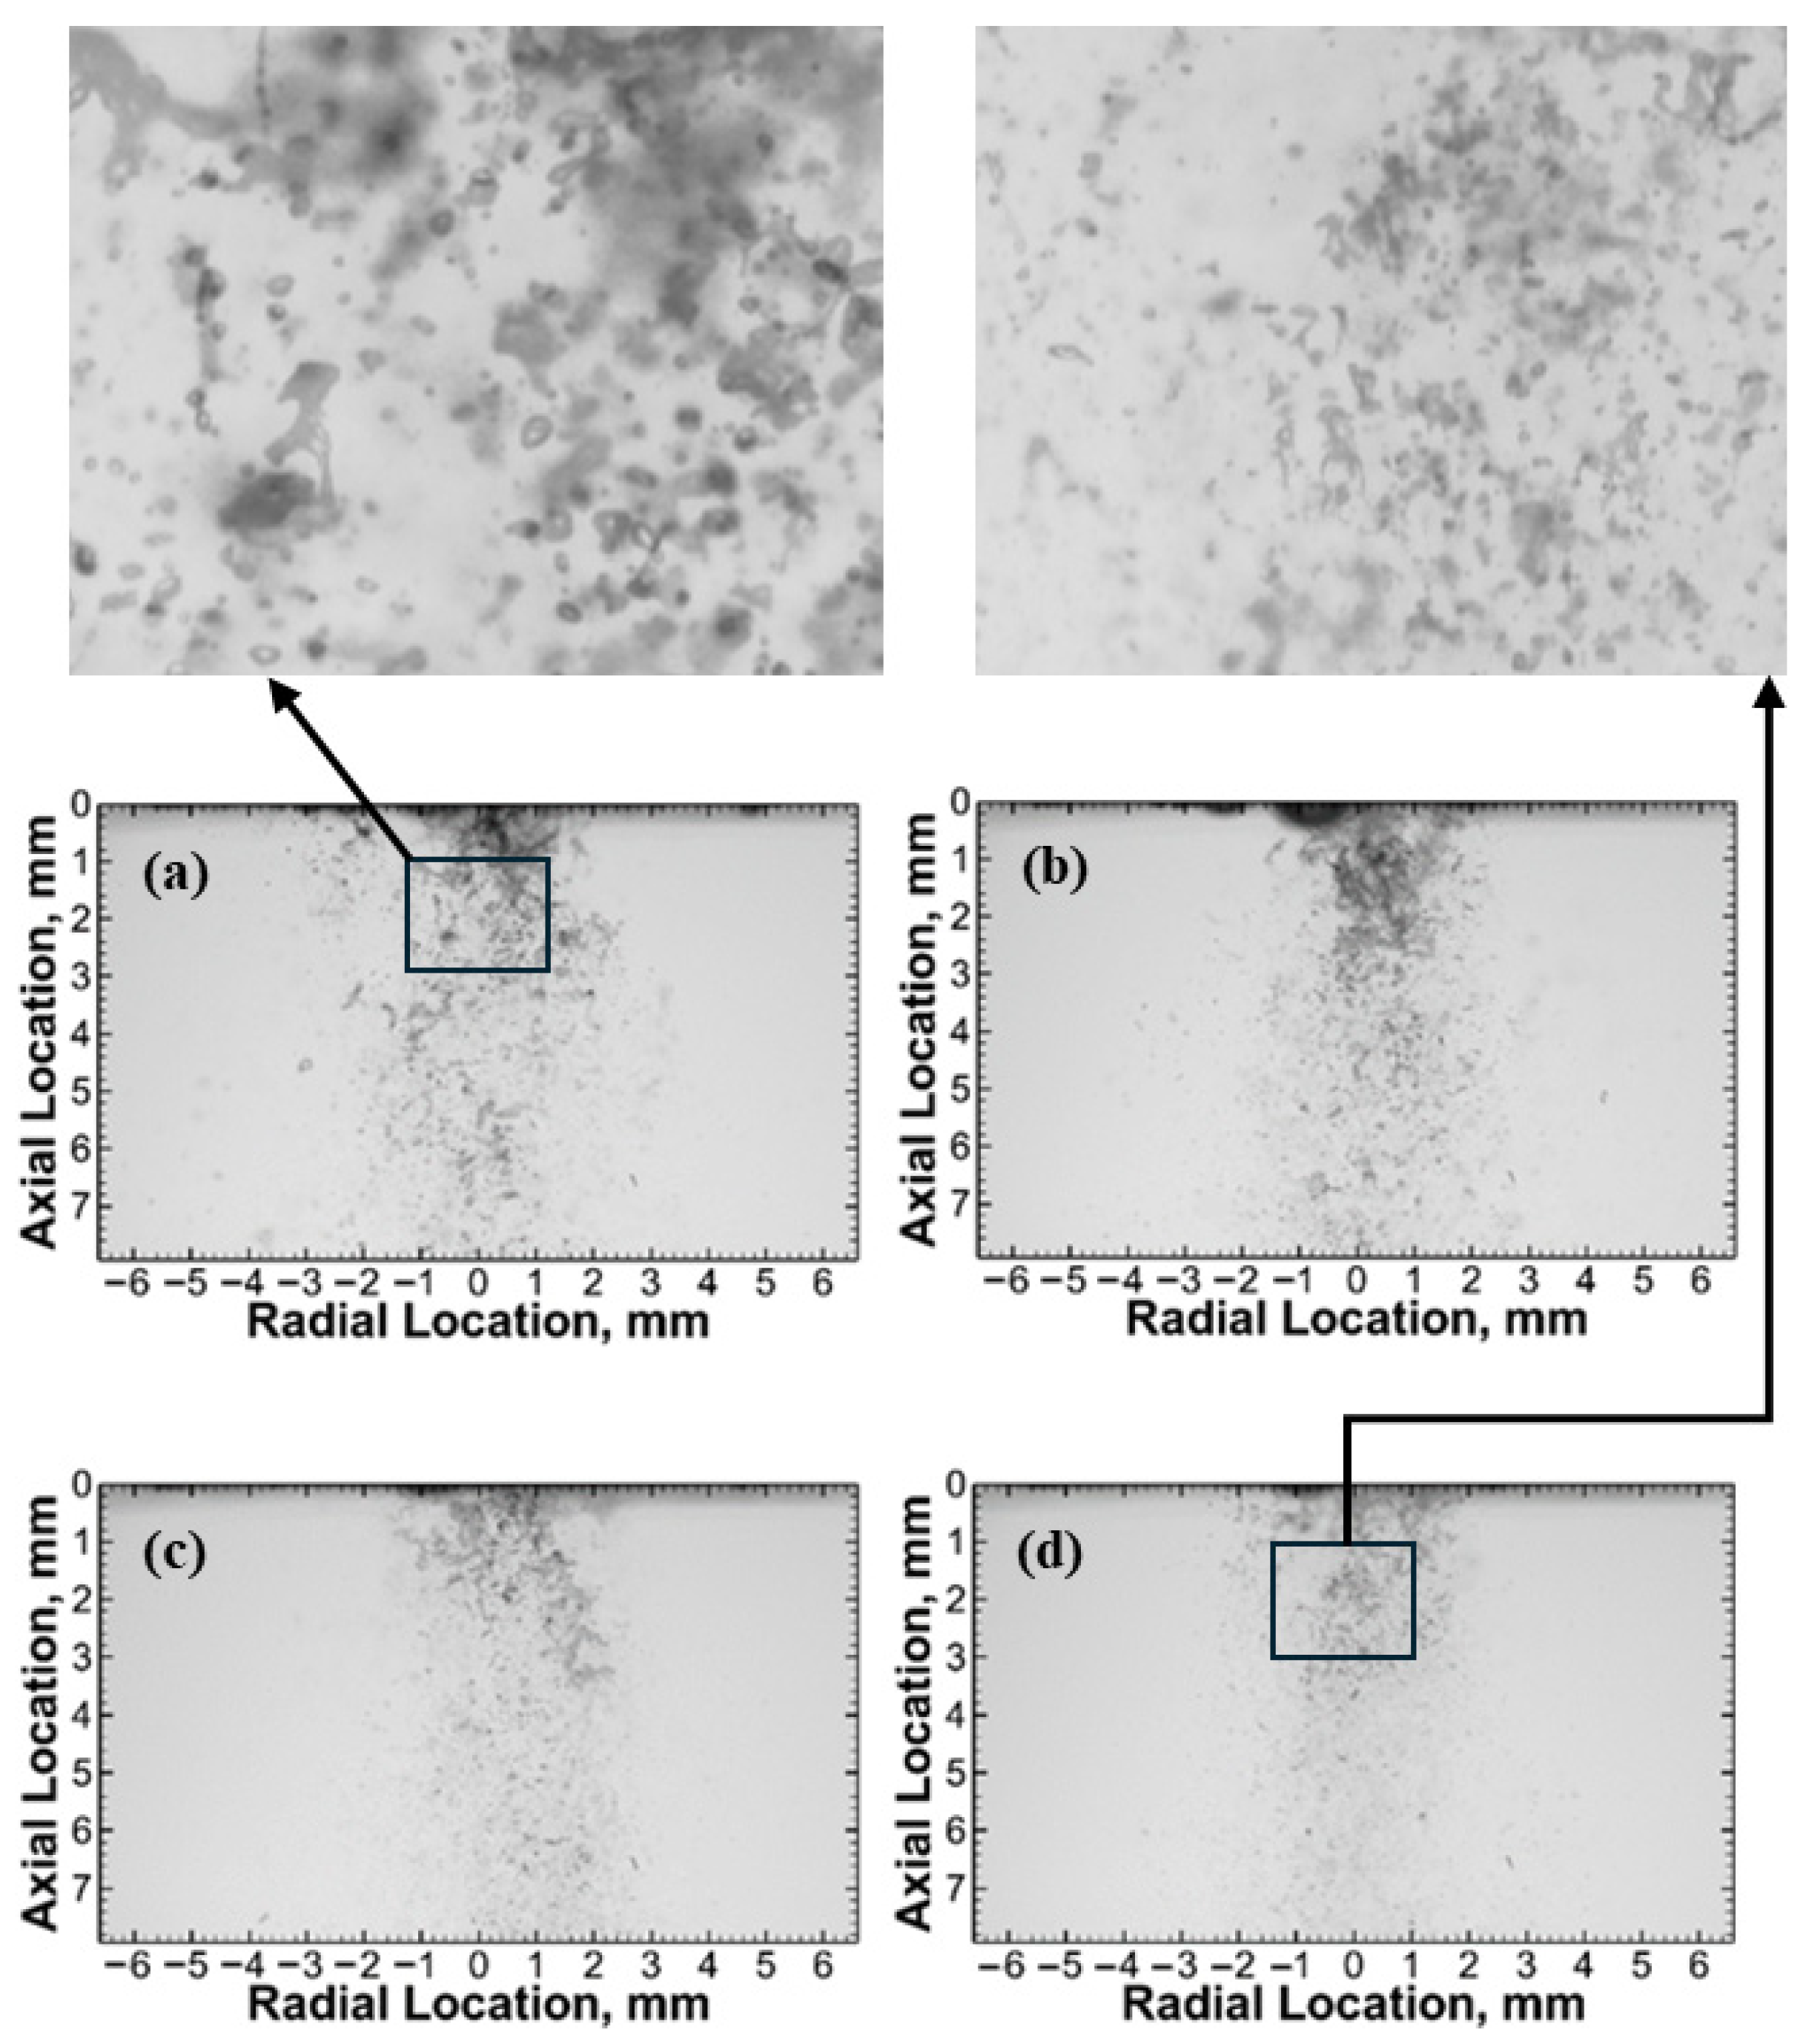
Figure 5 shows the instantaneous spray images at each ALR [19]. The experiment investigated a range of ALRs starting from 1.25 and increasing in increments of 0.25 until reaching a maximum value of 2.00. The sprays appear more dispersed immediately at the injector exit. As the ALR increases, the droplet sizes qualitatively appear smaller, as indicated by the visually reduced number of large, irregular, dark-colored structures in the spray images; consistent with the result of a prior study by Breerwood et al. [12].
The higher ALR leads to improved atomization performance due to increased air velocity at the constant liquid flow rate, which intensifies the Rayleigh–Taylor instabilities at the liquid–air interface. These enhanced interfacial instabilities result in more effective liquid breakup [25]. The spray images from Figure 5 qualitatively demonstrate that atomization progressively improves at higher ALRs.
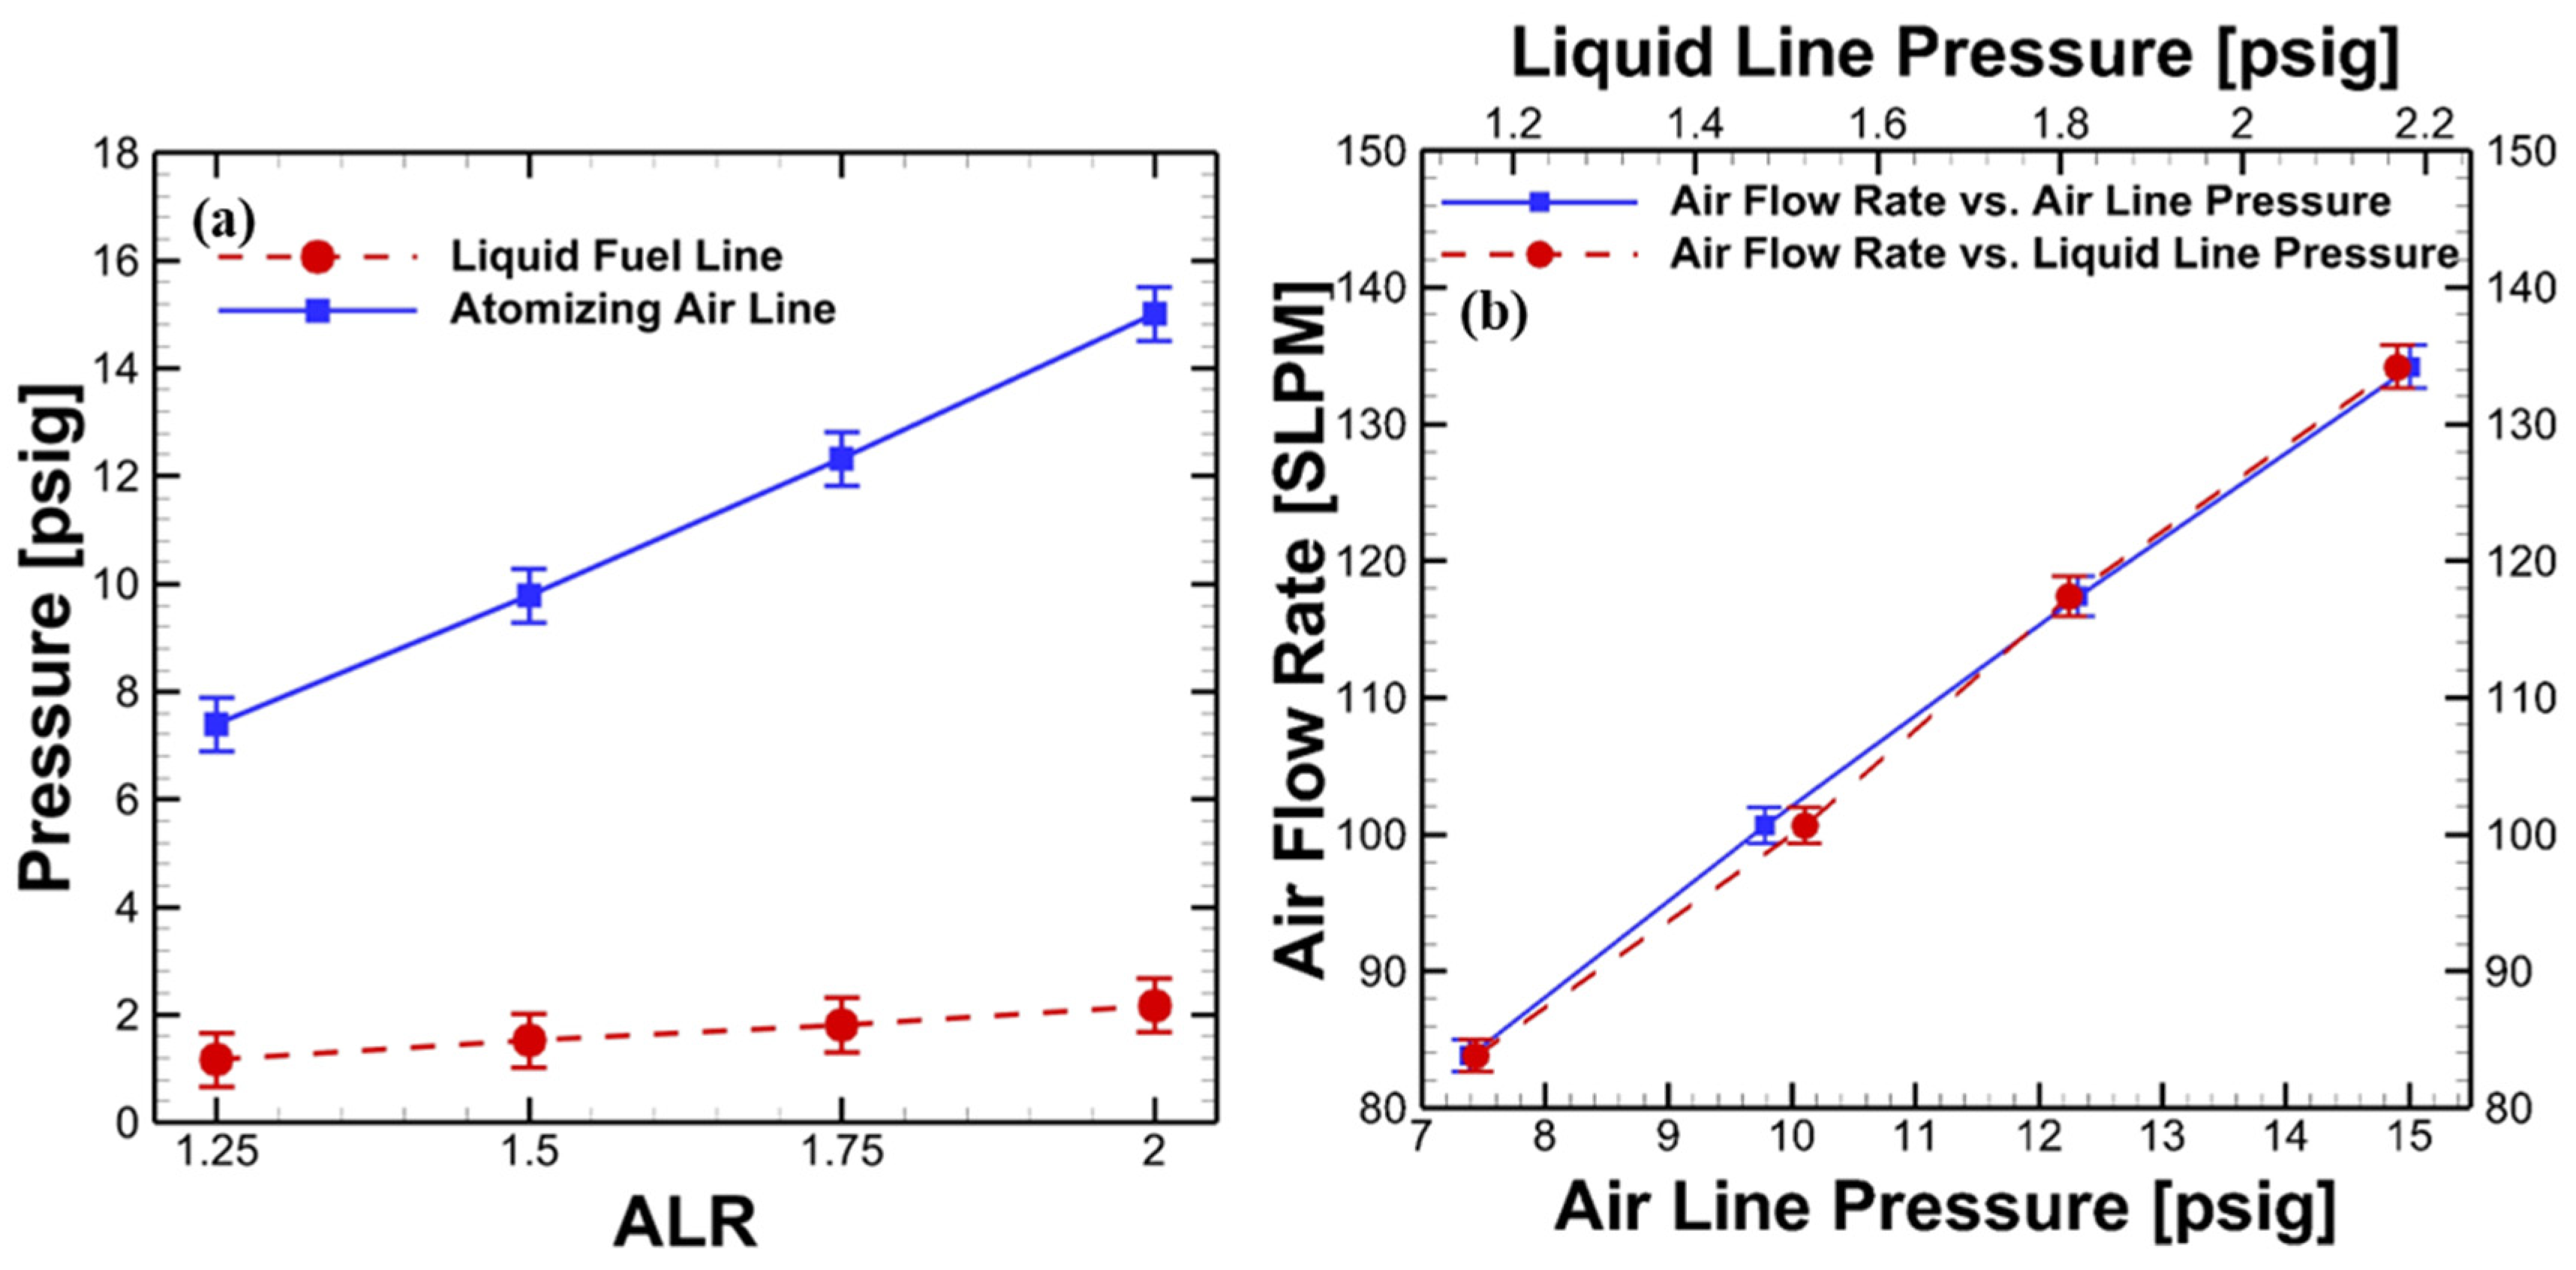
Figure 6a shows the liquid, and air line gauge pressure increase as the ALR increases. Higher ALRs leading to finer atomization of liquid particles is possibly due to the larger pressure drops at the injector exit that cause the bubbles to expand and burst, disintegrating the liquid into droplets. The increased pressure leads to a more rapid expansion and disruptive breakup of the liquid phase. Secondary atomization can further enhance the atomization, and complete atomization can even occur over a shorter distance away from the injector exit as the ALR is increased. The two lines in Figure 6a show distinctly different behaviors: the liquid fuel line (shown in red dashed line) shows a relatively modest increase in pressure from around 1 psig to 2 psig as ALR increases from 1.25 to 2.00, while the atomizing air line (shown in solid purple) demonstrates a much more pronounced linear increase from about 7 psig to 15 psig over the same ALR range. The error bars visible on both lines correspond to the uncertainty values of ±0.5 psig, which is ±0.5% of the full-scale range of the ProSense DPG1-100 pressure gauge used for data collection.
Figure 6b shows the operational characteristics of the SBP injector for the four ALR conditions (1.25, 1.50, 1.75, and 2.00) with a constant liquid flow rate of 80 mLpm. In Figure 6b, air mass flow rate increases linearly with air line pressure, ranging from ~84 SLPM at ~ 7 psig to ~134 SLPM at ~15 psig. Figure 6b also presents the same air flow rates plotted against liquid line pressure, which varies from ~1.1 to 2.2 psig across the ALR range tested. Error bars on each data point are small, indicating stable injector operation. Air flow rate responds predictably to changes in both air and liquid line pressures, increasing systematically across the ALR range to provide the enhanced air momentum necessary for twin-fluid atomization. The air flow rate uncertainty is estimated based on the manufacturer’s specification for the Alicat MFC as ± (0.8% of reading +0.2% of full scale), resulting in an error of approximately ±1.2–1.4% over the tested range of 83.85–134.16 SLPM.

3.2. Droplet Size Distribution

Analysis on spray droplet size distribution was executed to quantitatively investigate the spray characteristics and dynamics [19]. Figure 7 shows the cumulative volume distribution of droplets in the FOV across all ALRs and the entire image set (2000 images) [19]. Although all profiles are very similar, an increase in the percentage of smaller droplets occurs as the ALR increases [19]. More than 95% of droplets by volume are under 120 μm for all spray profiles. For the ALR of 1.25, approximately 90% of droplets are under 80 μm, 81% are under 60 μm, and 61% are under 40 μm [19]. For the ALR of 1.50, approximately 90% of droplets are under 91 μm, 82% are under 60 μm, and 62% are under 40 μm [19]. For the ALR of 1.75, approximately 93% of droplets are under 80 μm, 84% are under 60 μm, and 62% are under 40 μm [19]. For the ALR of 2.00, approximately 94% of droplets are under 80 μm, 86% are under 60 μm, and 64% are under 40 μm [19]. This demonstrates quantitatively that as the ALR increases, the number of smaller droplets in the injector near-field increase due to the increased pressure drop across the injector exit [19]. The increased pressure drop at a higher ALR results in rapid bubble-bursting, i.e., enhanced primary atomization, as well as the improved secondary atomization by the interfacial interaction between the higher-velocity air and the liquid phase [19].

3.3. Droplet Mass Distribution Analysis

Mass flow distribution analysis is conducted to evaluate the effect of ALR on droplet dispersion patterns generated by the SBP injector, operating under standardized conditions at 80 mLpm of the liquid flow rate with various AA flow rates. The spatial mass distribution is quantified using the mathematical relationship in Equation (2) [12]:
Mass   ( % )   =   m a s s   f l o w   r a t e   i n   t h e   r e g i o n   o f   i n t e r e s t o v e r a l l   m a s s   f l o w   r a t e × 100
A MATLAB (R2024a) code is developed to quantify the mass of passing droplets within discrete spatial domains, i.e., ROI of 0.2 mm × 0.2 mm, for the consecutive 1000 images. The total mass of all the droplets for the 1000 images at each of the small ROI ensures the statistical meaning. The small ROI also allows a highly spatially resolved droplet mass and SMD distribution map in the injector near-field. The ROI is chosen to be analogous to a point-wise measurement using a phase Doppler particle analyzer that has a measuring volume diameter of approximately 0.2 mm [12,34,44]. Mass flow rate in the ROI was performed through the integration of fluid density parameters and volumetric measurements of individual droplets aggregated in each ROI through the complete imaging sequence in 1 s. The local liquid mass flow rate is then divided by the total liquid flow rate of 80 mLpm to acquire the local mass percentage and thus the mass distribution of the FOV, i.e., the injector near-field. Although the instantaneous nature of these measurements precludes direct correlation with bulk flow characteristics, the statistical significance of the observed distributions remains robust.
Figure 8 consists of four mass distribution contour maps of the SBP injector exit at different ALRs including 1.25, 1.50, 1.75, and 2.00. Each contour map illustrates the normalized mass distribution in the near region of the injector exit, providing insights into the spatial allocation of the atomized mass into droplets, and thus into the effectiveness of atomization in the near region at each ALR. Note that, due to the limitation of the Insight 4G, its algorithm detects round droplets rather than the thin ligaments that might still undergo breakup. Therefore, less mass (of droplets only) was detected adjacent to the injector exit, compared to the further downstream locations where more droplets are generated. The contour levels are color-coded or shaded to represent different mass concentrations. Yellow-greenish colors indicate higher mass concentrations, while darker purple colors indicate lower concentrations. Notably, all the ALRs exhibit predominant mass concentrations within a symmetric spatial domain of ±3 mm radially relative to the central spray axis. At the ALR of 1.25, the mass distribution is the most spread out, indicating a very wide and even spray pattern with lower concentration at any single point. As the ALR increases progressively from 1.50 and 1.75 to 2.00, several key phenomena become apparent: the spray cone becomes more concentrated with a slight reduction in radial spread, indicating enhanced momentum transfer from the higher-velocity airflow to the liquid phase. This increased air momentum enhances internal bubble formation and subsequent bursting at the injector exit, promoting more effective primary atomization to generate fine droplets immediately. In addition, the increased atomizing air velocity leads to strengthened shear layer instabilities between the liquid and gas phases, also enhancing and quickening the secondary disintegration of larger liquid parts. The formed finer and/or more small droplets at an increased AA flow, i.e., a higher ALR, are carried away by the atomizing air discharged from the injector exit center. As a result, localized regions of higher liquid mass concentration emerge near the spray center, as visualized by the distinct yellow-green zones in the contour plots. The higher ALR conditions (particularly at 2.00) show evidence of enhanced atomization through more detailed contour structures and sharper mass distribution gradients. Higher ALR and swirl increase the Weber number (We) and Reynolds number (Re), promoting droplet breakup through bubble-driven mechanisms and interfacial instabilities. In summary, this can be attributed to intensified air–liquid interaction, which promotes both primary atomization via enhanced bubble formation and bursting, and secondary atomization via interfacial instabilities, resulting in more efficient primary atomization and the generation of finer droplets.

3.4. Sauter Mean Diameter Analyses

The Sauter Mean Diameter (SMD) gives the time-average droplet diameter in a region of interest (ROI) of 0.2 mm × 0.2 mm for the sequential 2000 images, again employing methodology analogous to time-averaged SMD analyses detected by a point-wise measurement using a phase Doppler particle analyzer [12,34]. SMD is the most widely used method to characterize atomization and sprays because of the relation it has between the total surface energy and mass of all the droplets [45]. SMD is calculated by using Equation (3) [46], where n represents the total number of droplets in the ROI, and d i is the diameter of each droplet in the ROI [19].
S M D = i = 1 n d i 3 i = 1 n d i 2
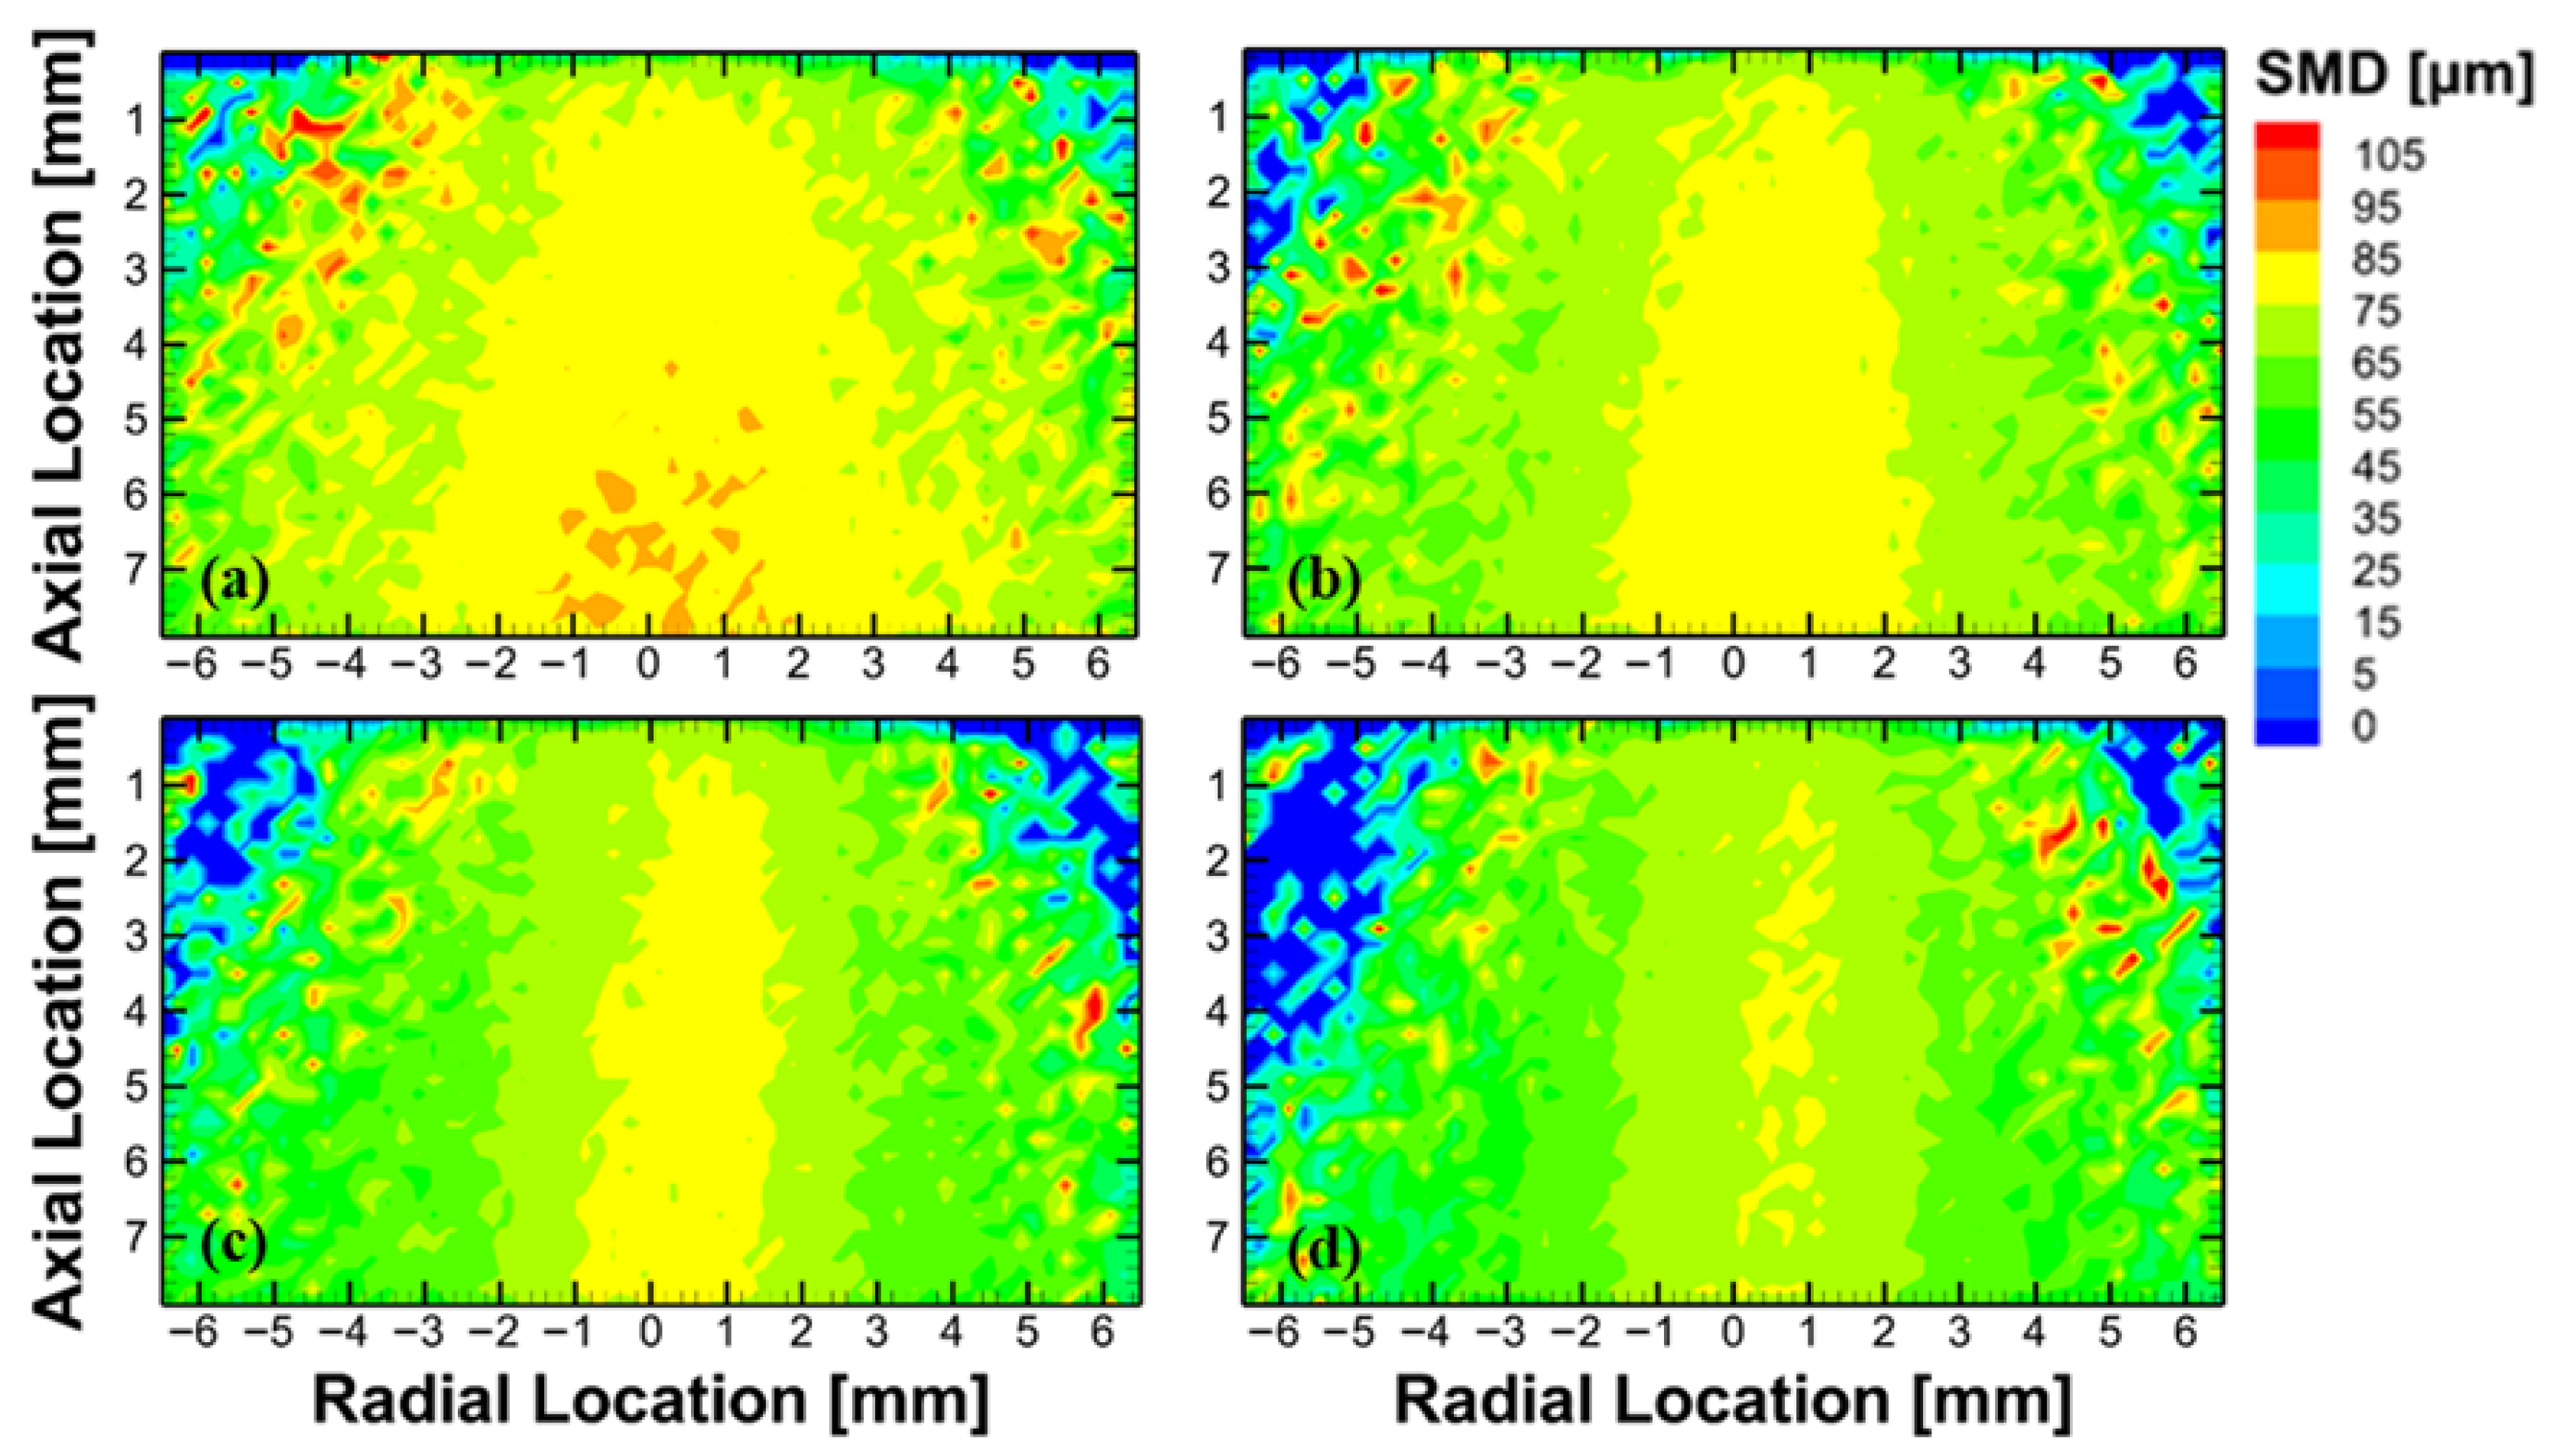
Based on Figure 7, where 95% of the droplets are below 120 μm, the contour maps (Figure 9) were created to show the SMD for each ALR over the 2000 image set [19]. Adjacent to the injector exit, increased ALR resulted in reduced SMD, suggesting improved primary atomization by bubble-bursting when bubbles pass through the injector exit. This, again, can be possibly attributed to the higher pressure drop at the higher ALR, i.e., at the higher air flow for a constant liquid flow rate. The contour maps show that the SMD decreases as it radially moves away from the spray center. The region of larger SMDs also decreases as ALR is increased. For an ALR of 1.25, there is a region of spray that contains an SMD of around 90 μm between the radial location of ±3.5 mm. This region radially decreases to ±2.0 mm as the ALR increases to 1.50. The SMD decreases to around 80 μm in between a radial span of X = ±2.5 mm for an ALR of 1.75, and it decreases furthermore to a region of ±2.0 mm for an ALR of 2.00. This shows that an increase in the ALR leads to an overall decrease in SMD, which is consistent with the qualitative spray images in Figure 5. This consistently indicates that the increased ALR, via increasing the AA, further enhanced both the primary and secondary atomization processes and thus yielded finer droplets. The contour plots in Figure 9 indicate that across all four ALRs, the sprays exhibit the largest droplets at the outer edges, smaller droplets in the center, and the smallest droplets in the regions between. This trend is consistent with observations reported by Breerwood et al. [12], where a similar radial variation in droplet size was noted. Though large SMD appeared at the radial locations of X < −3 mm and X > 3 mm due to occasional large droplets, the mass is negligible as demonstrated in Figure 8 and thus does not have statistical meaning. Overall, for all the ALRs, most droplets are observed, even for the 4.4 mm-D SBP injector, showing the powerful atomization capability of the new two-phase injector. Among the four ALRs tested, an ALR of 2.00 exhibited the smallest SMD in the region between the center and the periphery. Based on the SMD contour analysis, the spray corresponding to ALR 2.00 exhibits the most uniform droplet size distribution, as indicated by the relatively smaller spatial variation in SMD values across the spray region. Note that as the minimum measurable droplet size is ~20 μm, i.e., 2 pixels, the SMD value of <20 μm in Figure 9 represents no droplets captured [28,42]. The uncertainty of the TSI Insight 4G size–shape analysis used for detecting the droplet sizes remains unclear. However, the widely used approach is reasonable as the shadowgraph system forms the droplet “shadow” by the refracted light, thus clearly resolves the droplet’s outline [39], and quantifies the droplet size based on the well calibrated spatial resolution, as discussed above. Thereafter, the repeatability and uncertainty of the SMD value have been estimated using several datasets of the laser-driven shadowgraph measurements coupled with Insight 4G analysis as in our previous studies [34,42]. The Insight 4G SSA for the SMD calculation for shadowgraph measurement has an uncertainty of approximately 2–10% [34,42].

3.5. Time and Frequency Domain Analyses

The temporal variation in the local SMDs in a frame across all the sequential images and the fast Fourier Transform (FFT) analysis were employed to gain insight into the spray stability and frequency of SMD changes at different ROIs of the spray [19]. To assess spray stability, the instantaneous local SMD was computed per frame at each ROI using frame A images from 1000 frame-straddled pairs, maintaining time-resolved variations for further analysis. These images were captured with an interframe time of 700 ns within each image pair (Frames A and B) by a dual-head laser-driven shadowgraph system. Given this brief interframe duration, Frames A and B remain nearly identical in terms of droplet distribution, without droplet disintegration occurring within each pair. Instead, droplet breakups happen between successive image pairs. Therefore, spray steadiness in terms of local SMD is consistently analyzed using Frame A from each pair. It is important to note that the time-resolved local SMD differs slightly from the previously calculated spatially resolved SMD, which was derived from the entire dataset of 2000 images to statistically evaluate spatial spray fineness [12]. FFTs are used to visualize signals and calculate frequency components [19]. An FFT takes a sequence of data from the time domain and transforms it into the frequency domain, thereby showing dominant frequencies and their amplitude [19]. Classical pressure-swirl injectors generate an annular liquid film along with rims and ligaments prior to breakup, and studies such as Machado et al. [47] have analyzed instabilities on this film rather than focusing solely on droplet size. Note that in the SBP injector investigated in this study, the fundamentally different two-phase atomization yields fine droplets directly, without forming the continuous liquid film characteristic of classical swirl sprays.
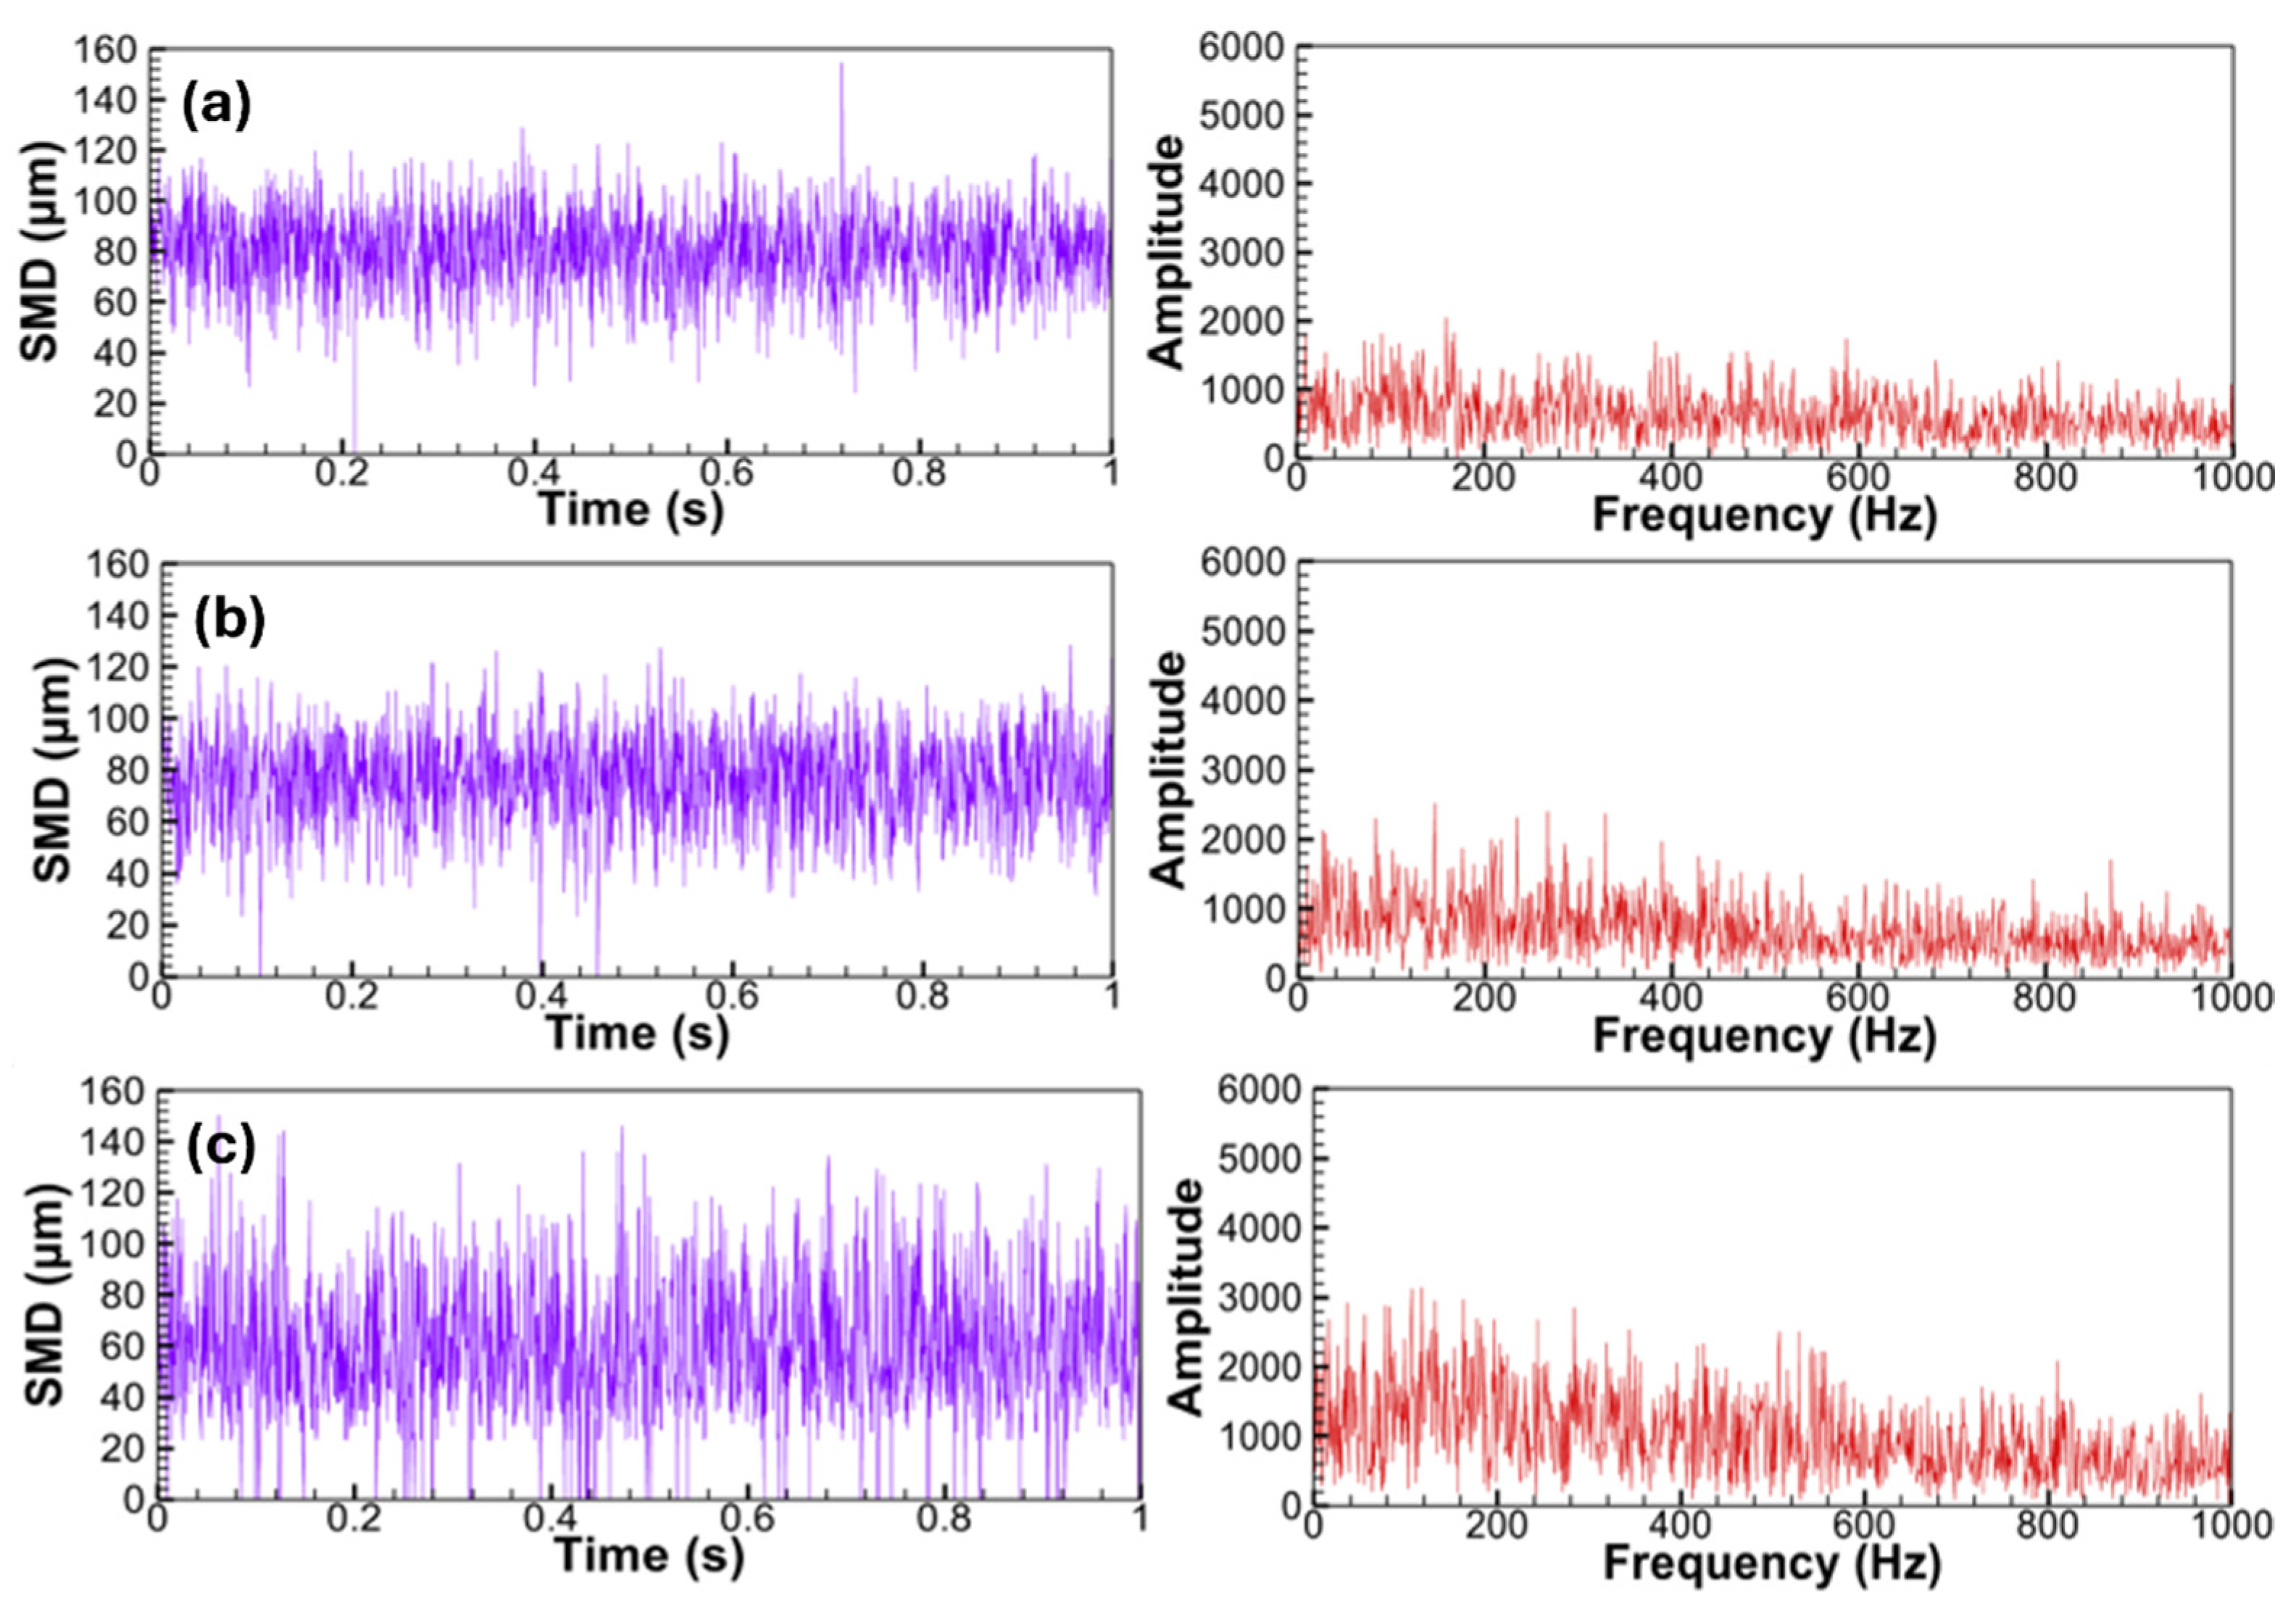
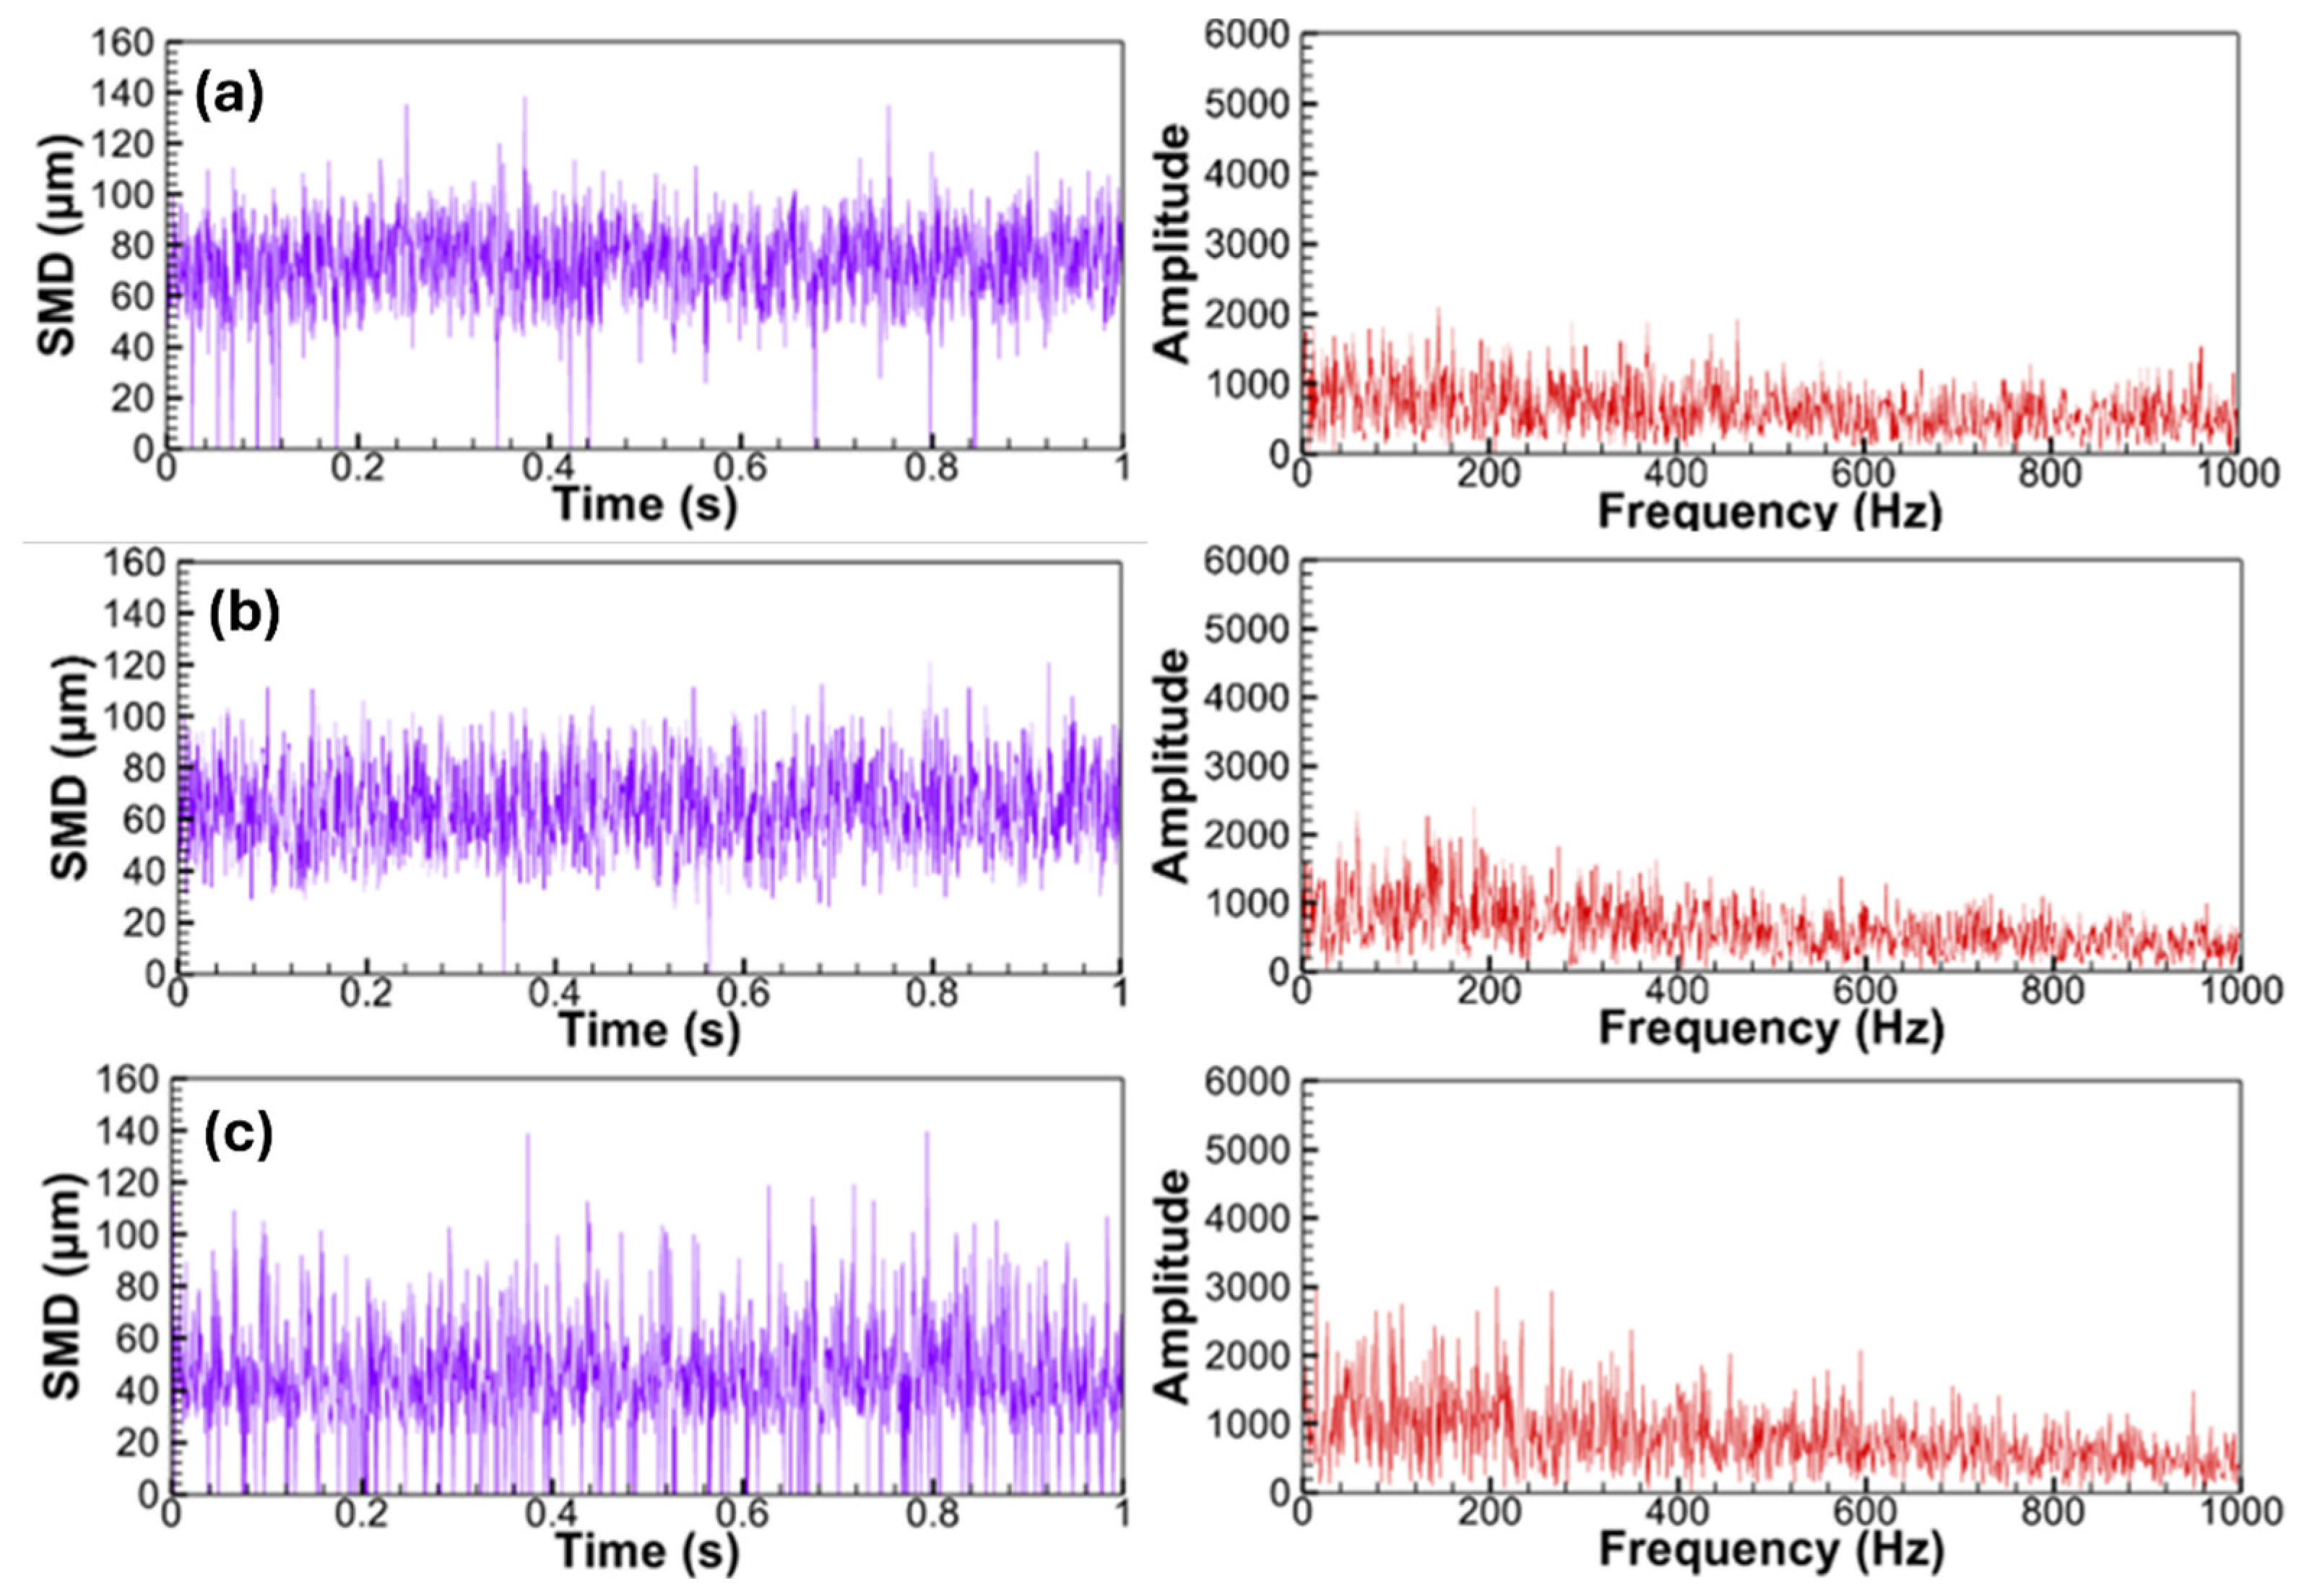
Several different locations of the spray for each ALR were chosen, and the local SMD was calculated for those locations at each point in time that an image was taken [19]. The radial locations of X = 0 mm, X = 1.7 mm, and X = 3.3 mm with an ROI of 1 mm × 1 mm were chosen based on the spray images (Figure 4) suggesting the locations of the spray center, spray periphery, and location in between both [19]. An ROI of 1 mm × 1 mm was chosen since FFT analysis relies on time-series data; a larger ROI would allow the inclusion of sufficient number of droplets, considering the size range discovered, leading to better statistical local averaging. The axial location was chosen at Y = 7 mm where the secondary atomization was accomplished or was about to be completed [19]. As discovered by Nasim et al. [29], the secondary atomization accomplished at ~5 mm downstream of an SBS injector at an ALR of 3.0 with a similar injector exit diameter of ~4 mm and H/D ratio of 0.25. The SBP injector with further improved primary atomization is thus expected to complete the secondary atomization at ~7 mm downstream of the injector exit. Figure 10, Figure 11, Figure 12 and Figure 13 show the local SMD change over time and the FFT for each differing radial location and ALR. At an ALR of 1.25 in Figure 10, SMD oscillates around 80, 76, and 60 µm, respectively, for the spray center, in-between, and spray periphery [19]. In Figure 11, the values are ~78, 64, and 50 µm at the ALR of 1.50, with those of ~70, 60, and 40 µm at the ALR of 1.75 in Figure 12, and ~65, 60, and 38 µm at the ALR of 2.00 in Figure 13 [19]. SMD shows an overall slight decrease from the spray center to the spray peripheries, which is consistent with Figure 8 for all the ALRs, suggesting that most of the atomized mass was in the spray center for the SBP injector [19]. For all the ALRs, the band width of the local SMD increases from the spray center to the spray periphery, reflecting more fluctuation in droplet size at the spray periphery. This is possibly due to the more robust disintegration of droplets at the spray periphery of x = 3 mm. Increase in ALR results in narrower band widths of the local SMD at all locations (center, periphery and in between). For instance, at the ALR of 1.25, x = 3 mm, the local SMD mainly fluctuates within the range of ~30–110 µm, while the SMD band encompasses ~30–60 µm for the ALR of 2.0 at the same location. This is likely attributed to the enhanced and quickened atomization at the higher ALR, leading to quickly formed finer droplets and thus more stable sprays in terms of completed droplet breakup.
The FFTs show a spike or general increase in amplitude where the dominant frequencies are shown [19]. A dominant frequency shows the frequency at which most of the change in the data is occurring, and the amplitude shows the signal strength [19]. Thus, a sharp peak in the frequency spectrum of the local SMD signifies robust, periodic oscillations in droplet size at that frequency which is usually linked to spray pulsing or instability [12]. From Figure 10, Figure 11, Figure 12 and Figure 13 for all the tested ALRs at all the locations, the dominant frequency characteristics (a peak frequency) are overall absent from the spectrum showing the SBP spray stability [19]. One exception is the peak frequency of about 130 Hz that occurred at the spray periphery and between the center and spray edge at the ALR of 1.50 in Figure 11. This indicates localized spray unsteadiness that is not present in other ALR cases or spray regions. Compared to the ALR of 1.50, the FFT amplitudes for the ALR of 1.25 in Figure 10 are more stable and are typically low and dispersed throughout all frequencies for all three radial locations, without any noticeable peak. At ALR = 1.75, Figure 12a–c demonstrate noticeably better overall stability at all the radial locations. There are no noticeable peaks in the FFT amplitudes, and the SMD signals behave more consistently. Although the droplet size distribution at the periphery remains wide, the frequency domain analysis indicates no prominent oscillations. Similarly to the ALR of 1.75, particularly in the 0–100 Hz region, the amplitude spectrum is uniform and low for the ALR of 2.00 in Figure 13 across all radial points. Although the FFT at the periphery of all ALRs shows a comparatively larger amplitude, its effect on the overall spray stability is considered negligible since this region contains very little mass as seen in Figure 8. Among all the ALRs, the ALR of 1.75 appears to be the most stable due to the smaller and fewer fluctuations in amplitude [19]. Combining the improved spray fineness at a higher ALR, the ALR of 1.75 seems to be the best in terms of both spray stability and fineness among the tested ALRs [19]. Overall, the SBP injection generates stable sprays at all the tested ALRs with the optimum ALR of 1.75 having the fine and most stable spray [19].

3.6. Atomization Efficiency Estimation

Atomization efficiency serves as a critical performance metric in spray systems, quantifying the effectiveness of converting bulk liquid into a dispersed spray of droplets through the interaction of high-velocity air with the liquid medium. This parameter fundamentally represents the ratio of energy effectively utilized for droplet formation to the total energy input into the system. In practical applications, higher atomization efficiency indicates more optimal energy utilization in the droplet generation process, while lower values suggest energy losses through various mechanisms such as viscous dissipation, turbulent mixing, or incomplete breakup processes. The efficiency is influenced by multiple operational parameters, including the air-to-liquid ratio (ALR), injection pressure, fluid properties (viscosity, surface tension), and geometric configurations of the atomizer.
The fundamental energy analysis differs between single-fluid and twin-fluid atomization systems. In single-fluid pressure atomizers, the system’s initial energy input (Ei) is solely derived from the liquid phase energy (El) [48]. However, twin-fluid atomization systems incorporate both liquid phase energy (El) and gas phase energy (Eg) in their total input energy calculations. For twin-fluid injection systems, specifically FB and SB configurations, the atomization efficiency (ηa) can be mathematically expressed as Equation (4) [29,49]:
η a = 6 σ V l d P l , i n j P a t m V l + P a t m V g × ln P g , i n j P l , i n j
In Equation (4): Patm represents ambient pressure conditions, Pg,inj denotes the gas injection pressure, Pl,inj indicates the liquid injection pressure, Vl and Vg represent liquid and gas volumetric flow rates, respectively, σ is the surface tension, and d signifies the mean droplet diameter. The atomization efficiency is the ratio of the surface energy required to create new droplet interfaces to the total input energy supplied to both the liquid and gas streams [21]. This formulation reflects the fraction of total input energy effectively utilized for atomization, as opposed to being lost to viscous dissipation or turbulence.
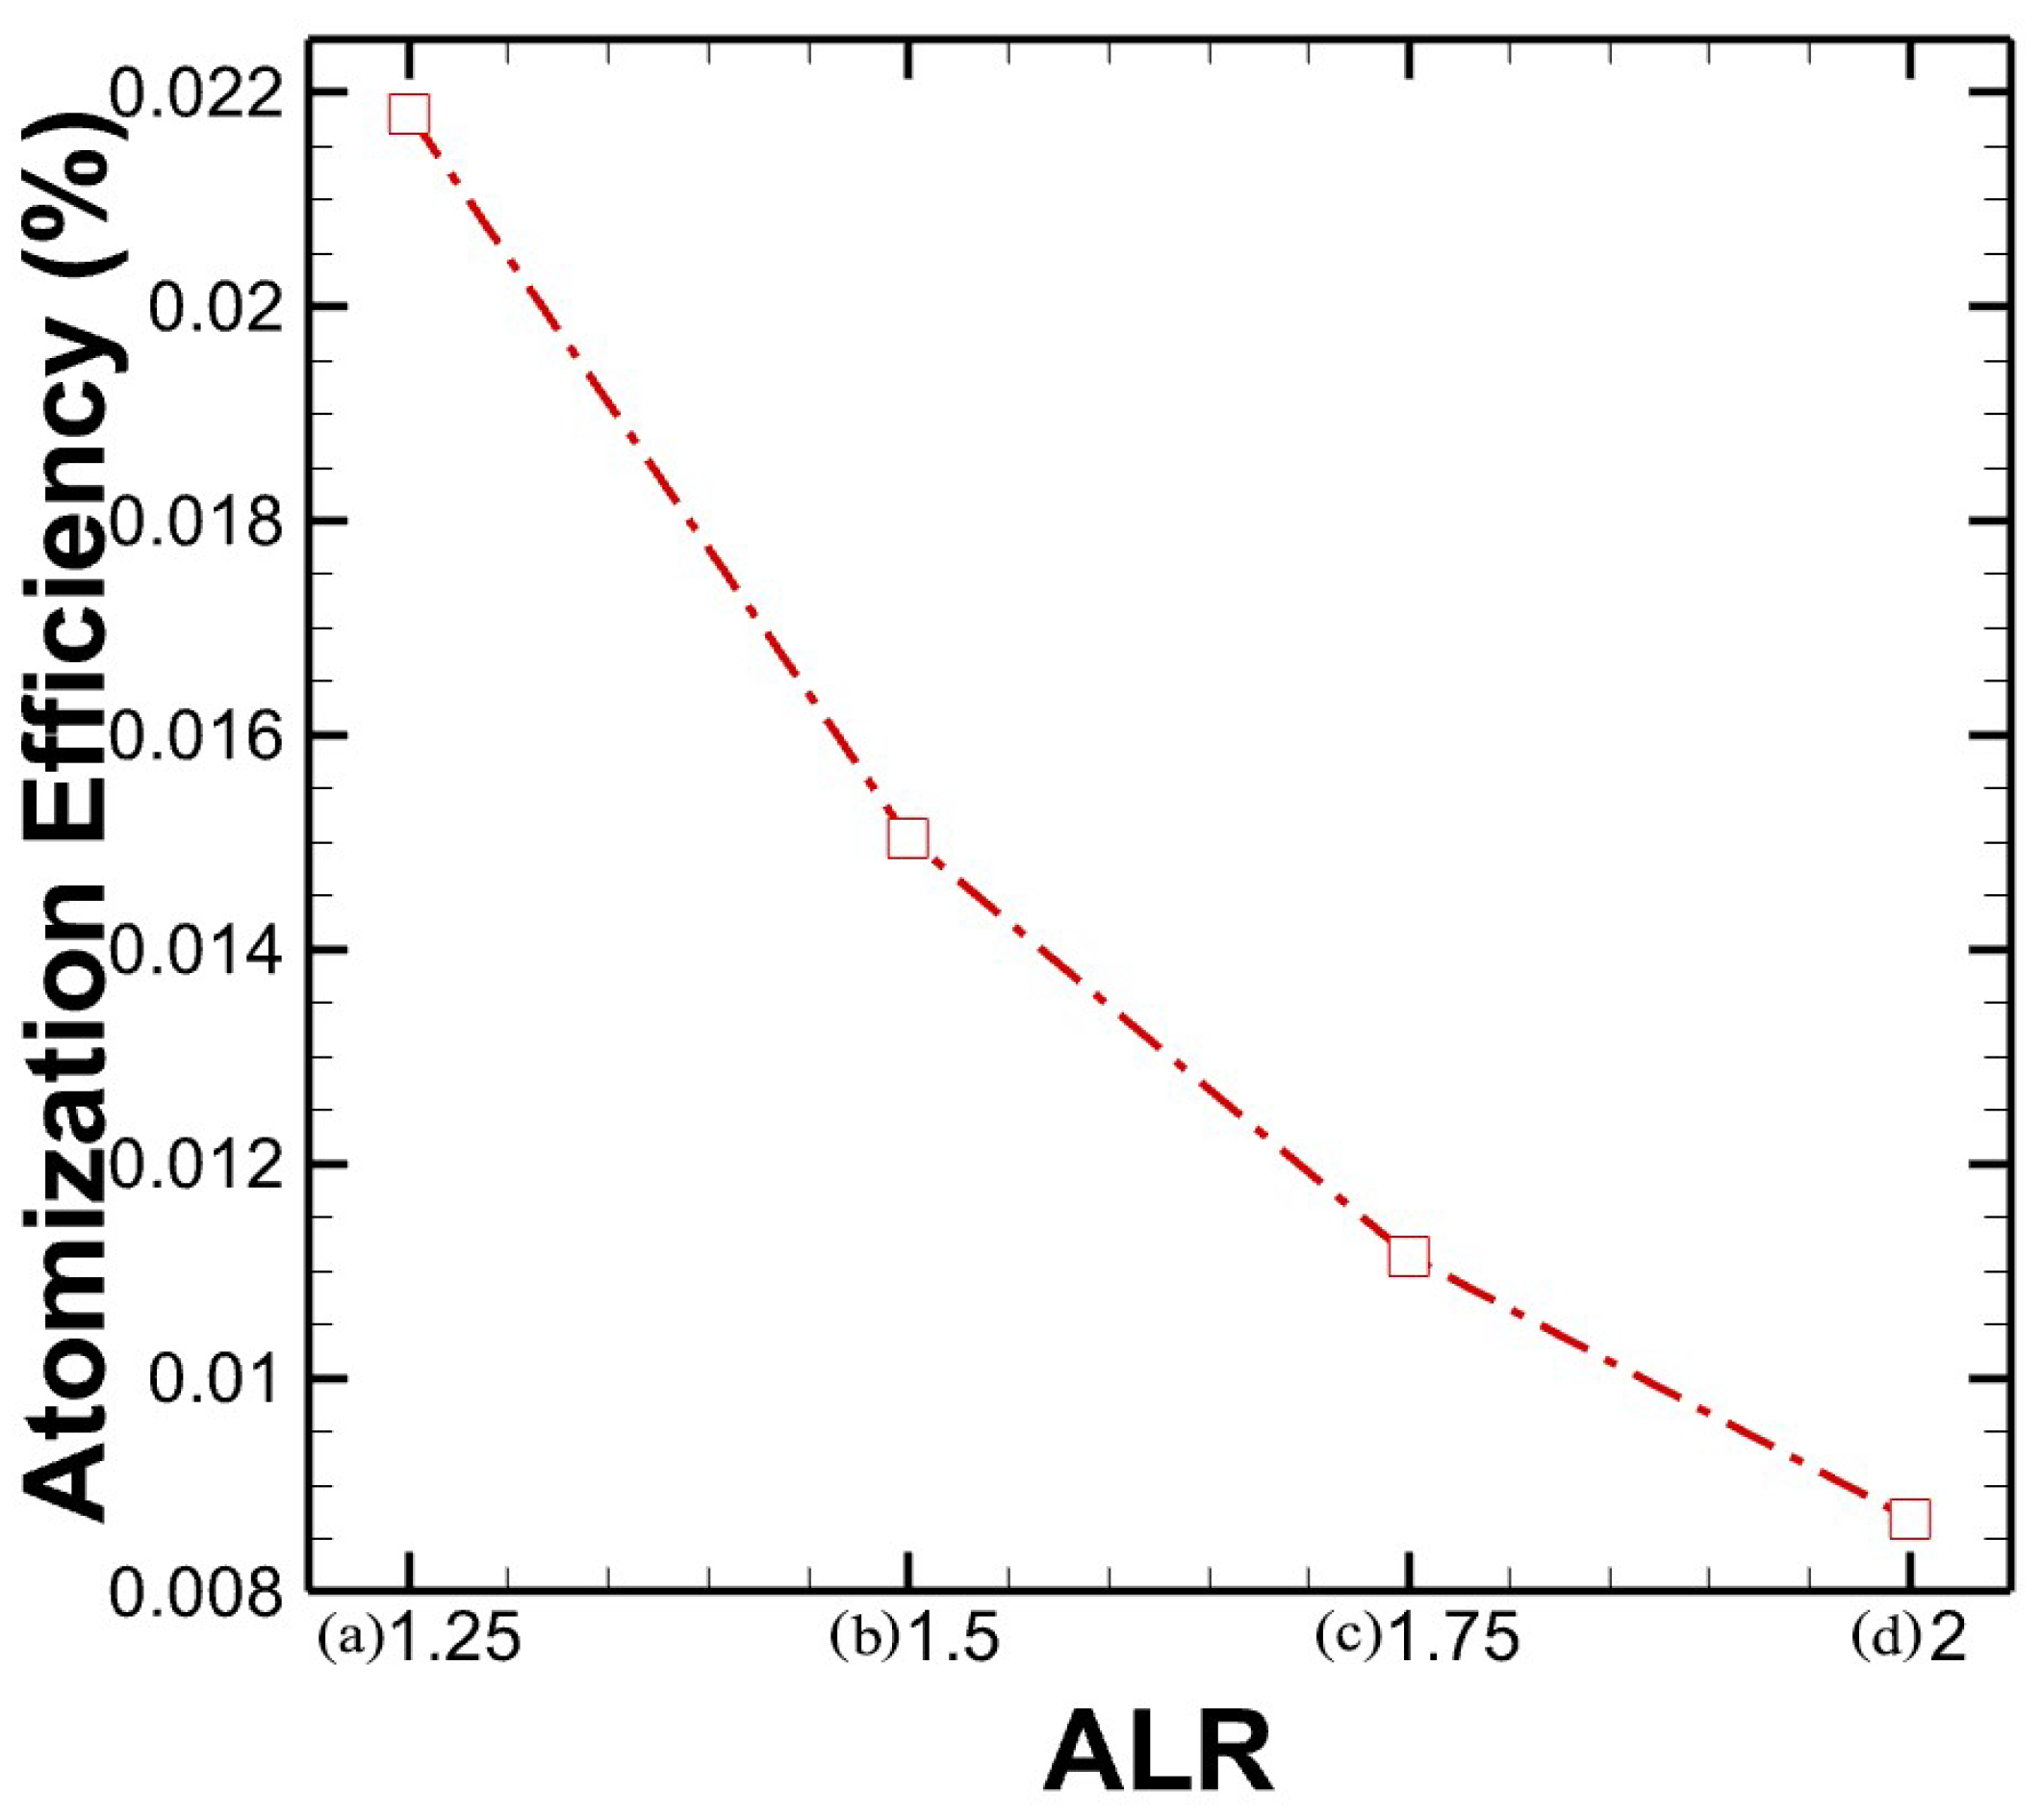
Figure 14 shows the experimental analysis of atomization efficiency as a function of air-to-liquid ratio (ALR), revealing a distinctive inverse relationship, where the efficiency demonstrates its peak value of approximately 0.022% at the lowest tested ALR of 1.25. As the ALR increases, the atomization efficiency exhibits a consistent declining trend, with the most pronounced decrease occurring in the ALR range of 1.25–1.50, suggesting a critical sensitivity zone for the atomization process. The relationship continues its downward trajectory, albeit with a gradually decreasing slope, ultimately reaching its minimum efficiency of about 0.009% at an ALR of 2.00. This is likely attributed to the fact that air swirl improves atomization by enhancing the breakup of liquid into finer droplets through increased shear forces. The swirl creates a tangential velocity component in the air flow which increases the shear interaction between the air and the liquid droplets, particularly in the near-field of the injector. This enhanced shear accelerates the secondary atomization process and improves the atomization efficiency. The efficiency decreases with an increasing ALR because at higher ALRs the gas phase energy input rises substantially, while the marginal gain in surface area (or reduction in mean droplet size) becomes smaller. Hence, a larger portion of the total energy is expended without a corresponding gain in droplet surface area, leading to a net decline in atomization efficiency at higher ALRs.
This behavior of reduced efficiency at decreased ALRs, supported by error bars indicating measurement uncertainty, presents an intriguing trend adverse to the typical fact that higher ALRs lead to enhanced atomization effectiveness, i.e., improved spray fineness [12,34]. The observed trend strongly suggests that optimal atomization performance for this system is achieved at lower ALR values, potentially due to complex interactions between the air and liquid phases that influence energy transfer efficiency during the atomization process. This finding has significant implications for the practical operation and optimization of spray systems, indicating that increasing the air-to-liquid ratio beyond certain thresholds may be counterproductive to achieving efficient atomization. Also, compared to the FB injection, even at the lower ALR of 1.25, the SBP atomization efficiency is 0.022%, higher than that of FB at an ALR of 3, which is around 0.01–0.02% calculated by Khan et al. [49]. A small injector exit diameter is usually used to achieve fine atomization in conventional injectors. Yet, with a large diameter (D ≈ 4 mm), which is four times greater than the diameter of the FB injector (D = 1 mm) tested by Khan et al. [49], the atomization efficiency of the SBP injector is higher than that of the FB injector.

3.7. Energy/Air-Usage Budget Estimation

The practical relevance of the findings of atomization efficiency depends on the application. In hydrogel firefighting sprays and stationary gas turbines, reductions in atomization efficiency have a limited impact on overall performance due to lower sensitivity to droplet size. In aerospace applications, however, higher air-to-liquid ratios (ALRs) can be restrictive because of constraints on air consumption and storage. Energy/air-usage budget is thus estimated as below to provide insight into future potential applications.
From Equation (5), the energy of the atomizing air is given by [50]:
E a = m a U a 2 2
Here, E a is the energy of the atomizing air, m a is mass of atomizing air, and U a is velocity of atomizing air.
The air-to-liquid ratio (ALR) by mass is given by Equation (6):
A L R   = m a m l
where ma is mass of atomizing air, and ml is mass of liquid.
To derive the AA energy per unit mass of liquid flow, the air energy is divided by the liquid mass flow rate:
E a m l = m a U a 2 2 m l = U a 2 2 · A L R
Assuming k = U a 2 2 , this yields Equation (8):
E a = k · A L R
where E a represents the gas phase energy input per unit liquid mass.
For an illustrative energy budget, the liquid phase energy input ( E l ) is taken as a constant baseline of 1.0 energy-unit, representing the work associated with liquid pressurization and injection. The gas phase energy input ( E a ) is assumed to scale linearly with ALR ( E a ALR). For numerical illustration, we set E a = 1 × ALR (in energy-units per unit liquid mass); this normalization is arbitrary but realistic for twin-fluid injection systems where gas input can be comparable to liquid input.
Table 2 demonstrates diminishing returns as the ALR increases at the constant liquid flow: while the ALR increases from 1.25 to 2.00, the total energy rises from approximately 2.25 to 3.00 and the atomization efficiency ( η a ) simultaneously decreases from 0.022 to 0.009; indicating that progressively more energy is required to achieve smaller incremental improvements in atomization. From the mass distribution (Figure 8) and SMD contour plots (Figure 9), it is evident that the majority of the mass is in the region where the SMD value is below 85 μm. Thus, the average SMD in the injector near-field is calculated for the entire FOV where the SMD value is below 85 μm, taking the time-averaged droplet diameter in the ROI of 0.2 mm × 0.2 mm for the sequential 2000 spray images. As the ALR increases from 1.25 to 2.00, the energy consumption rises by approximately 33%, while the average SMD decreases by only about 9%. Furthermore, increasing the ALR from 1.75 to 2.00 results in an additional ~9% rise in energy input but yields only a ~3% reduction in SMD. Beyond moderate ALR values (1.5–1.75), further increases demand disproportionately more compressed air and energy while yielding minimal atomization benefits—a critical constraint for applications with limited energy budgets such as aerospace propulsion systems or portable atomization devices. These illustrative values assume E a = 1·ALR and E l = 1.0; however, the analysis framework remains valid when these parameters are replaced with actual measured energies derived from compressor work calculations for the gas phase and pump work for the liquid phase.

4. Conclusions

The purpose of this study was to investigate the effect of the ALR on spray characteristics and dynamics, and atomization efficiency for a novel SBP injector [19]. The SBP design has been shown in previous and current experimental research to improve the primary atomization mechanism with enhanced stability at a single set of flow conditions when compared to the FB injector [19]. In the present study, the results show the following:
  • Each tested ALR generated stable SBP sprays with fine droplets discharged immediately at the injector near-field even for a scaled-up injector with an exit diameter of 4.37 mm [19].
  • Each ALR seemed to have similar cumulative volume distributions of droplet sizes; however, there was a trend wherein the droplet size and SMD decreased as the ALR increased [19].
  • Mass distribution contour maps revealed the evolution of mass distribution in the SBP injector exit across ALRs, demonstrating a progressive concentration of the spray pattern with increasing ALR. At the ALR of 1.25, the most spread-out mass distribution was seen.
  • The SMD contours revealed that among the tested ALRs, an ALR of 2.00 produced the most consistent droplet size distribution, as evidenced by the relatively uniform SMD values throughout the spray region.
  • Temporal evolution of SMD and the FFT analysis were employed to investigate the spray dynamics at various ALRs [19]. Lack of peak frequencies in the FFT showed the stability of the SBP injection at all the tested ALRs with the optimum ALR of 1.75 having the most stable sprays with fine droplet evolution [19].
  • The experimental analysis revealed a critical inverse relationship between air-to-liquid ratio (ALR) and atomization efficiency, with peak performance observed at the lowest tested ALR of 1.25 in terms of atomization efficiency.
Taking all factors into account, an optimal ALR of 1.75 is recommended based on its balance of droplet size distribution, spray stability, and atomization efficiency. This ALR is identified as the most suitable for achieving consistent and efficient atomization, making it ideal for future applications of the injector in liquid-fueled gas turbine engines. The findings suggest that operating at this ALR can enhance spray stability of the novel SBP atomizer with the more efficient generation of ultra-fine sprays immediately at the injector exit, compared to the FB atomizer with proved liquid flexibility. Future work will quantitatively investigate the agent flexibility of the SBP sprayer for liquids with a wide range of viscosities, including hydrogel-based suppressants. This optimization not only potentially improves flame coverage and cooling effectiveness but also broadens the potential for cleaner, more efficient fire suppression across diverse high-risk scenarios.

Author Contributions

R.S.: Methodology, Investigation, Data Curation, Data Analysis, and Writing. M.S.A.: Methodology, Investigation, Data Analysis, and Writing. L.J.: Conceptualization, Methodology, Resources, Project administration, Funding acquisition, Data analysis, Supervision, and Writing. All authors have read and agreed to the published version of the manuscript.

Funding

The work was funded by the Startup fund of Baylor University, and United States NSF CIVIC award No. 2228311.

Data Availability Statement

Data will be made available on request.

Acknowledgments

The paper is a revised and expanded version of the conference contribution here: https://doi.org/10.2514/6.2023-1058, which was presented at the AIAA SCITECH 2023 Forum, National Harbor, Maryland, 23–27 January 2023.

Conflicts of Interest

The authors declare no conflicts of interest.

Abbreviations

The following abbreviations are used in this manuscript:
AAAtomizing Air
ABAir-Blast
ALRAtomizing Air-to-Liquid Mass Ratio
FBFlow-Blurring
FOVField of View
FFTFast Fourier Transform
MFCMass Flow Controller
ROIRegion of Interest
SBPSwirl Burst Primary
SBSSwirl Burst Secondary
SMDSauter Mean Diameter

References

  1. Farrell, K.; Hassan, M.K.; Hossain, M.D.; Ahmed, B.; Rahnamayiezekavat, P.; Douglas, G.; Saha, S. Water Mist Fire Suppression Systems for Building and Industrial Applications: Issues and Challenges. Fire 2023, 6, 40. [Google Scholar] [CrossRef]
  2. Ko, Y.J.; Elsagan, N. Investigation of the Performance of Fire Suppression Systems in Protection of Mass Timber Residential Buildings. Indoor Built Environ. 2023, 32, 230–241. [Google Scholar] [CrossRef]
  3. Keyes, F.G.; Smith, L.B.; Gerry, H.T. The Specific Volume of Steam in the Saturated and Superheated Condition Together with Derived Values of the Enthalpy, Entropy, Heat Capacity and Joule Thomson Coefficients: Part IV. Steam Research Program. Proc. Am. Acad. Arts Sci. 1936, 70, 319–364. [Google Scholar] [CrossRef]
  4. Xu, M.; Wei, Y.; Qin, A.; Xu, Y.; Xu, M.; Li, B.; Liu, L. Novel Silica Hydrogel-Based Forest Fire Extinguishing Agent: Construction, Fire Extinguishing Performance and Mechanism Study. J. Clean. Prod. 2025, 486, 144490. [Google Scholar] [CrossRef]
  5. Mlkvik, M.; Stähle, P.; Schuchmann, H.P.; Gaukel, V.; Jedelsky, J.; Jicha, M. Twin-Fluid Atomization of Viscous Liquids: The Effect of Atomizer Construction on Breakup Process, Spray Stability and Droplet Size. Int. J. Multiph. Flow 2015, 77, 19–31. [Google Scholar] [CrossRef]
  6. Liu, C.; Peng, S.; Du, X.; Wu, P.; Li, Y.; Feng, Z. Study on the Atomization Characteristics of Gel by Liquid Carbon Dioxide. J. Aerosol Sci. 2025, 184, 106496. [Google Scholar] [CrossRef]
  7. Zhao, Y.; Liang, J.; Xie, Y.; Wu, J.; Huang, W.; Li, W.; Huang, R.; Huang, Y.; Wu, J.; Li, J.; et al. Hydrogel-Based Fire Extinguishing Technology for Lithium-Ion Battery Fires: Mechanisms, Applications, and Future Perspectives. J. Polym. Res. 2025, 32, 250. [Google Scholar] [CrossRef]
  8. Ma, L.; Huang, X.; Sheng, Y.; Liu, X.; Wei, G. Experimental Study on Thermosensitive Hydrogel Used to Extinguish Class A Fire. Polymers 2021, 13, 367. [Google Scholar] [CrossRef]
  9. Li, G.; Wang, Q.; Liu, G.; Yao, M.; Wang, Y.; Li, Y.; Lin, K.; Liu, X. Hydrogel Extinguishants. Nanomaterials 2024, 14, 1128. [Google Scholar] [CrossRef]
  10. Lefebvre, A.H.; McDonell, V.G. Atomization and Sprays, 2nd ed.; CRC Press: Boca Raton, FL, USA, 2017; ISBN 978-1-315-12091-1. [Google Scholar]
  11. Hendershott, T.H.; Stouffer, S.; Monfort, J.R.; Diemer, J.; Busby, K.; Corporan, E.; Wrzesinski, P.; Caswell, A.W. Ignition of Conventional and Alternative Fuel at Low Temperatures in a Single-Cup Swirl-Stabilized Combustor. In Proceedings of the 2018 AIAA Aerospace Sciences Meeting, Kissimmee, FL, USA, 8–12 January 2018; AIAA SciTech Forum; American Institute of Aeronautics and Astronautics: Reston, VA, USA, 2018. [Google Scholar]
  12. Breerwood, J.; Jiang, L.; Ahmed, M.S. Near-Field Spray Characteristics and Steadiness of a Novel Twin-Fluid Injector with Enhanced Primary Atomization. J. Aerosol Sci. 2024, 180, 106402. [Google Scholar] [CrossRef]
  13. Jiang, L.; Agrawal, A.K.; Taylor, R.P. Clean Combustion of Different Liquid Fuels Using a Novel Injector. Exp. Therm. Fluid Sci. 2014, 57, 275–284. [Google Scholar] [CrossRef]
  14. Huber, M.L.; Perkins, R.A.; Laesecke, A.; Friend, D.G.; Sengers, J.V.; Assael, M.J.; Metaxa, I.N.; Vogel, E.; Mares, R.; Miyagawa, K. New International Formulation for the Viscosity of H2O. J. Phys. Chem. Ref. Data 2009, 38, 101–125. [Google Scholar] [CrossRef]
  15. Caputo, G.; Adami, R.; Reverchon, E. Analysis of Dissolved-Gas Atomization: Supercritical CO2 Dissolved in Water. Ind. Eng. Chem. Res. 2010, 49, 9454–9461. [Google Scholar] [CrossRef]
  16. Sher, E.; Bar-Kohany, T.; Rashkovan, A. Flash-Boiling Atomization. Prog. Energy Combust. Sci. 2008, 34, 417–439. [Google Scholar] [CrossRef]
  17. Hong, M.; Fleck, B.A.; Nobes, D.S. Unsteadiness of the Internal Flow in an Effervescent Atomizer Nozzle. Exp. Fluids 2014, 55, 1855. [Google Scholar] [CrossRef]
  18. Jiang, L.; Agrawal, A.K. Investigation of Glycerol Atomization in the Near-Field of a Flow-Blurring Injector Using Time-Resolved PIV and High-Speed Visualization. Flow Turbul. Combust. 2015, 94, 323–338. [Google Scholar] [CrossRef]
  19. Swinney, R.; Jiang, L. Investigation of the Effect of Atomizing Air-to-Liquid Mass Ratio on Spray Dynamics for a Novel Injector Design. In Proceedings of the AIAA SCITECH 2023 Forum, National Harbor, MD, USA, 23–27 January 2023; American Institute of Aeronautics and Astronautics: Reston, VA, USA, 2023. [Google Scholar]
  20. Qavi, I.; Jiang, L.; Akinyemi, O.S. Near-Field Spray Characterization of a High-Viscosity Alternative Jet Fuel Blend C-3 Using a Flow Blurring Injector. Fuel 2021, 293, 120350. [Google Scholar] [CrossRef]
  21. Gañán-Calvo, A. Enhanced Liquid Atomization: From Flow-Focusing to Flow-Blurring. Appl. Phys. Lett. 2005, 86, 214101. [Google Scholar] [CrossRef]
  22. Kourmatzis, A.; Jaber, O.J.; Singh, G.; Masri, A.R. Review of Flow Blurring Atomization: Advances and Perspectives. Energy Fuels 2022, 36, 4224–4233. [Google Scholar] [CrossRef]
  23. Jafari, M.; Jowkar, S.; Morad, M.R. Low Flow Rate Spray Cooling by a Flow Blurring Injector. Int. Commun. Heat Mass Transf. 2021, 122, 105168. [Google Scholar] [CrossRef]
  24. Rayleigh Investigation of the Character of the Equilibrium of an Incompressible Heavy Fluid of Variable Density. Proc. Lond. Math. Soc. 1882, s1-14, 170–177. [CrossRef]
  25. Jiang, L.; Agrawal, A.K. Spray Features in the near Field of a Flow-Blurring Injector Investigated by High-Speed Visualization and Time-Resolved PIV. Exp. Fluids 2015, 56, 103. [Google Scholar] [CrossRef]
  26. Khan, M.A.; Gadgil, H.; Kumar, S. Experimental Investigations into Liquid Breakupmorphology and Spray Characteristics of a Cross-Flow Injector. At. Sprays 2021, 31, 63–86. [Google Scholar] [CrossRef]
  27. Simmons, B.; Agrawal, A. Spray Characteristics of a Flow-Blurring Atomizer. At. Sprays 2010, 20, 821–835. [Google Scholar] [CrossRef]
  28. Danh, V.; Jiang, L.; Akinyemi, O.S. Investigation of Water Spray Characteristics in the Near Field of a Novel Swirl Burst Injector. Exp. Therm. Fluid Sci. 2019, 102, 376–386. [Google Scholar] [CrossRef]
  29. Nasim, M.N.; Qavi, I.; Jiang, L. Effect of Varying Internal Geometry on the Near-Field Spray Characteristics of a Swirl Burst Injector. Flow Turbul. Combust. 2023, 111, 641–674. [Google Scholar] [CrossRef]
  30. Akinyemi, O.S.; Jiang, L. Development and Combustion Characterization of a Novel Twin-Fluid Fuel Injector in a Swirl-Stabilized Gas Turbine Burner Operating on Straight Vegetable Oil. Exp. Therm. Fluid Sci. 2019, 102, 279–290. [Google Scholar] [CrossRef]
  31. Akinyemi, O.; Jiang, L.; Bruno, J. Effect of Fuel Properties and Atomizing Air to Liquid Ratio on Combustion Performance of a Novel Twin-Fluid Injector. In Proceedings of the 2018 Spring Technical Meeting Central States Section of the Combustion Institute, Minneapolis, MN, USA, 20–22 May 2018. [Google Scholar]
  32. Hall, T.; Williams, D.; Islam, S.M.R.; Patel, I.; Chakmakjian, C.; Jiang, L. Clean Co-Combustion of Glycerol and Methanol Blends Using a Novel Fuel-Flexible Injector. Fuel 2024, 371, 132125. [Google Scholar] [CrossRef]
  33. Islam, S.M.R.; Jiang, L.; Swinney, R.; Horn, D.V.; Chakmakjian, C.; Corporan, E. Global Combustion Characteristics of a Viscous Alternative Jet Fuel and Conventional Jet A-2 Using a Novel Twin-Fluid Injector. Fuel 2025, 386, 134303. [Google Scholar] [CrossRef]
  34. Akinyemi, O.; Qavi, I.; Taylor, C.E.; Jiang, L. Effect of the Air-to-Liquid Mass Ratio on the Internal Flow and near-Field Spray Characteristics of a Two-Phase Swirl Burst Injector. J. Aerosol Sci. 2023, 167, 106092. [Google Scholar] [CrossRef]
  35. Lee, S.J.; Kim, J.Y.; Lee, M.H.; Hong, J.G. Experimental Study of Twin-Fluid Flow Differences and Sauter Mean Diameter Prediction According to Y-Jet Nozzle Mixing-Tube Design. Int. J. Multiph. Flow 2025, 183, 105063. [Google Scholar] [CrossRef]
  36. Lilley, D.G. Swirl Flows in Combustion: A Review. AIAA J. 1977, 15, 1063–1078. [Google Scholar] [CrossRef]
  37. Castrejón-García, R.; Castrejón-Pita, J.R.; Martin, G.D.; Hutchings, I.M. The Shadowgraph Imaging Technique and Its Modern Application to Fluid Jets and Drops. Rev. Mex. Fís. 2011, 57, 266–275. [Google Scholar]
  38. Settles, G.S. Schlieren and Shadowgraph Techniques: Visualizing Phenomena in Transparent Media; Springer Science & Business Media: Berlin/Heidelberg, Germany, 2001; ISBN 978-3-540-66155-9. [Google Scholar]
  39. Settles, G.S.; Hargather, M.J. A Review of Recent Developments in Schlieren and Shadowgraph Techniques. Meas. Sci. Technol. 2017, 28, 042001. [Google Scholar] [CrossRef]
  40. Braeuer, A. Chapter 4—Shadowgraph and Schlieren Techniques. In Supercritical Fluid Science and Technology; Braeuer, A., Ed.; Spectroscopic Techniques at High Pressure; Elsevier: Amsterdam, The Netherlands, 2015; Volume 7, pp. 283–312. [Google Scholar]
  41. Jain, S.; Somasundaram, S.; Anand, T. A Fluorescent Laser-Diffuser Arrangement for Uniform Backlighting. Meas. Sci. Technol. 2016, 27, 025406. [Google Scholar] [CrossRef]
  42. Danh, V.; Akinyemi, O.S.; Taylor, C.E.; Frank, J.T.; Jiang, L. Effect of Injector Swirl Number on Near-Field Spray Characteristics of a Novel Twin-Fluid Injector. Exp. Fluids 2019, 60, 80. [Google Scholar] [CrossRef]
  43. Li, G.; Li, C. Experimental Study on the Spray Steadiness of an Internal-Mixing Twin-Fluid Atomizer. Energy 2021, 226, 120394. [Google Scholar] [CrossRef]
  44. TSI Incorporated. Fiber Optic Probes for Ldv/Pdpa Systems; TSI Incorporated: Shoreview, MN, USA, 2019. [Google Scholar]
  45. Panão, M. On the Interpretation of Atomization Efficiency and Application to Air-Assisted Sprays. MOP 2020. [Google Scholar] [CrossRef]
  46. Wang, D.; Fan, L.-S. 2—Particle Characterization and Behavior Relevant to Fluidized Bed Combustion and Gasification Systems. In Fluidized Bed Technologies for Near-Zero Emission Combustion and Gasification; Scala, F., Ed.; Woodhead Publishing Series in Energy; Woodhead Publishing: Cambridge, UK, 2013; pp. 42–76. ISBN 978-0-85709-541-1. [Google Scholar]
  47. Machado, D.A.; Costa, F.S.; Dias, G.S.; Mota, F.A.S. Simultaneous Analysis of Swirl Spray Dynamics Using a Telecentric Shadowgraphy System. Meas. Sci. Technol. 2024, 36, 016047. [Google Scholar] [CrossRef]
  48. Jedelsky, J.; Jicha, M. Energy Considerations in Spraying Process of a Spill-Return Pressure-Swirl Atomizer. Appl. Energy 2014, 132, 485–495. [Google Scholar] [CrossRef]
  49. Khan, M.A.; Gadgil, H.; Kumar, S. Influence of Liquid Properties on Atomization Characteristics of Flow-Blurring Injector at Ultra-Low Flow Rates. Energy 2019, 171, 1–13. [Google Scholar] [CrossRef]
  50. Lefebvre, A.H. Energy Considerations in Twin-Fluid Atomization. J. Eng. Gas Turbines Power 1992, 114, 89–96. [Google Scholar] [CrossRef]
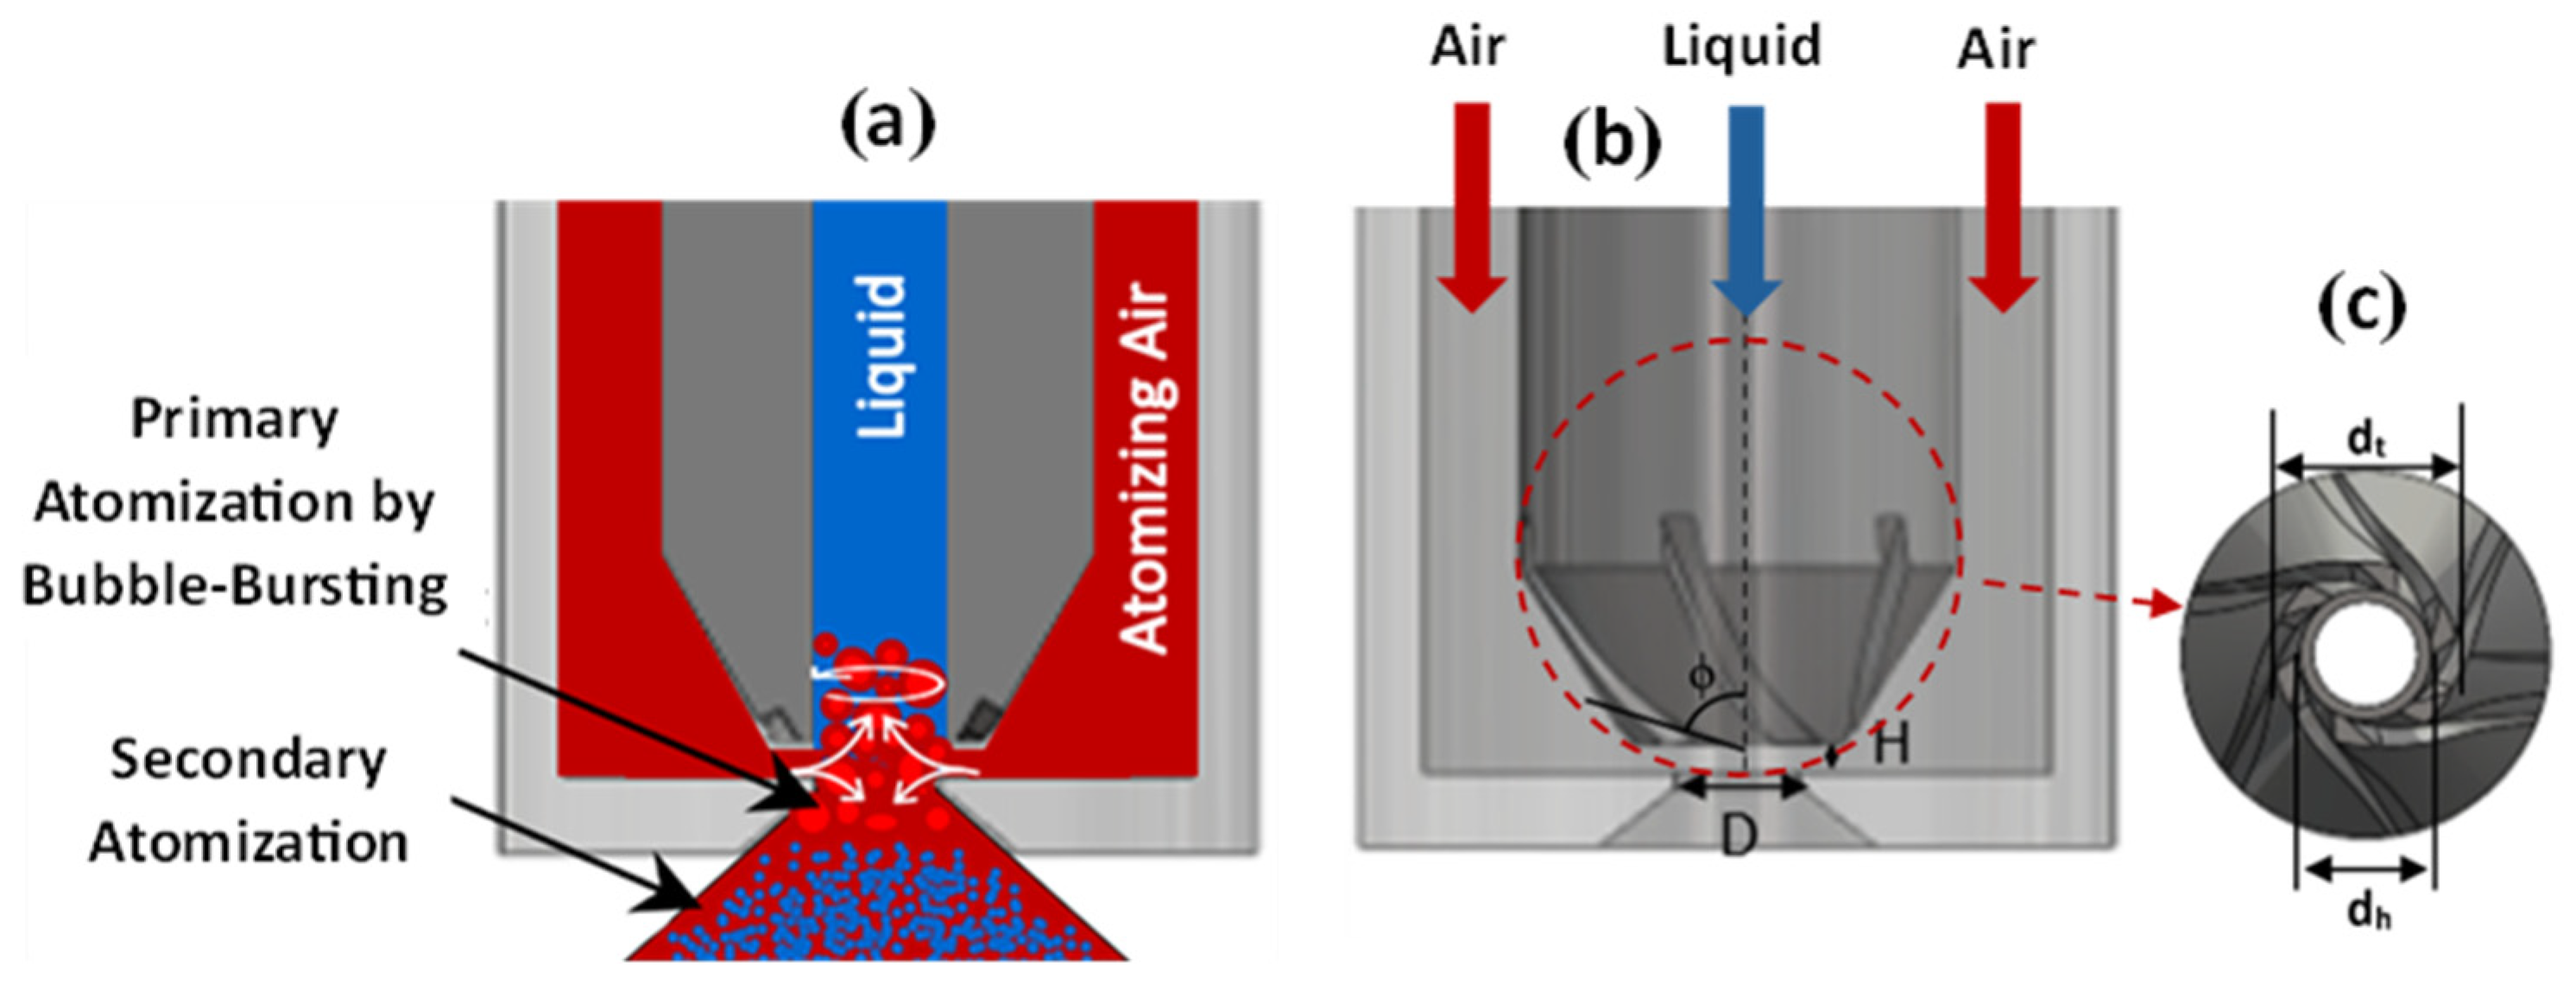
Figure 1. FB working principle [19,25].
Fire 08 00425 g001
Figure 2. (a) Working principle of SBP injector—internal view showing swirling of air bubbles in liquid line; key geometry of SBP Injector including (b) side-view and (c) bottom-up view of internal liquid tube [19].
Fire 08 00425 g002
Figure 3. Experimental setup of the laser-driven shadowgraph imaging for near-field spray investigation [19].
Fire 08 00425 g003
Figure 4. Image processing steps for droplet sizing using Insight 4G [12].
Fire 08 00425 g004
Figure 5. Instantaneous spray images in the near-field of the SBP injector exit at (a) 1.25, (b) 1.50, (c) 1.75, and (d) 2.00 ALRs [19].
Fire 08 00425 g005
Figure 6. (a) Liquid line pressure vs. air line pressure across the SBP injector at the liquid flow rate of 80 mLpm [19], (b) air mass flow rate vs. air line pressure and air mass flow rate vs. liquid line pressure across the SBP injector at four different ALRs and the constant liquid flow rate of 80 mLpm.
Fire 08 00425 g006
Figure 7. Cumulative volume distribution across different ALRs [19].
Fire 08 00425 g007
Figure 8. Mass distribution contour maps of the droplets in the near-field of the SBP injector exit at ALRs of (a) 1.25, (b) 1.50, (c) 1.75, and (d) 2.00.
Fire 08 00425 g008
Figure 9. SMD contour maps at (a) 1.25, (b) 1.50, (c) 1.75, and (d) 2.00 ALRs at location sizes of 0.2 mm × 0.2 mm for 2000 images at spatial and temporal resolutions of 10.3 μm/pixel and 2 kHz, respectively.
Fire 08 00425 g009
Figure 10. Fourier Transform of SMD over time at an ALR of 1.25 at the spray center (a) X = 0 mm, between center and periphery (b) X = 1.70 mm, and spray periphery (c) X = 3.00 mm at an axial location Y = 7.00 mm away from the injector [19].
Fire 08 00425 g010
Figure 11. Fourier Transform of SMD over time at an ALR of 1.50 at the spray center (a) X = 0 mm, between center and periphery (b) X = 1.70 mm, and spray periphery (c) X = 3.00 mm at an axial location Y = 7.00 mm away from the injector [19].
Fire 08 00425 g011
Figure 12. Fourier Transform of SMD over time at an ALR of 1.75 at the spray center (a) X = 0 mm, between center and periphery (b) X = 1.70 mm, and spray periphery (c) X = 3.00 mm at an axial location Y = 7.00 mm away from the injector [19].
Fire 08 00425 g012
Figure 13. Fourier Transform of SMD over time at an ALR of 2.00 at the spray center (a) X = 0 mm, between center and periphery (b) X = 1.70 mm, and spray periphery (c) X = 3.00 mm at an axial location Y = 7.00 mm away from the injector [19].
Fire 08 00425 g013
Figure 14. Atomization efficiency of the SBP injector at (a) 1.25, (b) 1.50, (c) 1.75, and (d) 2.00 ALRs.
Fire 08 00425 g014
Table 1. Experimental conditions.
ALR1.251.501.752.00
Air Flow Rate (SLPM)83.85100.62117.39134.16
Liquid Flow Rate (mLPM)80.00
Table 2. Illustrative energy/air-usage budget (per unit liquid volume).
ALRLiquid Phase Energy Input, El (Fixed) Gas Phase Energy Input, EaTotal Energy
Etotal = El + Ea
Atomization Efficiency,
ηa (%)
Average SMD
(μm)
1.251.001.252.250.02245.80
1.501.001.502.500.01544.17
1.751.001.752.750.01142.88
2.001.002.003.000.00941.59
Disclaimer/Publisher’s Note: The statements, opinions and data contained in all publications are solely those of the individual author(s) and contributor(s) and not of MDPI and/or the editor(s). MDPI and/or the editor(s) disclaim responsibility for any injury to people or property resulting from any ideas, methods, instructions or products referred to in the content.