Article

Small-Scale Experimental Study on Smoke Blocking and Thermal Insulation Performance of Water Mist Sprinkler

1
Graduate School, China People’s Police University, Xichang Road 220, Langfang 065000, China
2
Rescue Command Academy, China People’s Police University, Xichang Road 220, Langfang 065000, China
3
School of Energy and Power Engineering, Xi’an Jiaotong University, No. 28, Xianning West Road, Xi’an 710049, China
*
Authors to whom correspondence should be addressed.
Fire 2025, 8(10), 401; https://doi.org/10.3390/fire8100401
Submission received: 15 September 2025 / Revised: 11 October 2025 / Accepted: 15 October 2025 / Published: 16 October 2025

Abstract

To investigate the performance patterns of high-pressure water mist sprinklers with different flow coefficients in smoke containment and thermal insulation during fire suppression, this study conducted droplet size experiments and small-scale fire tests at 8 MPa pressure using six sprinkler types with flow coefficients (K) of 0.5, 0.7, 1.0, 1.2, 1.5, and 2.0. These findings were systematically analyzed in conjunction with FDS numerical simulations. Droplet size results indicate optimal atomization for K = 1.0, 1.2, and 1.5 sprinklers, producing fine droplets with concentrated distribution. Small-scale experiments and simulations further compared their smoke suppression and heat insulation performance. Findings show K = 1.5 delivers superior smoke suppression and cooling effects, reducing protected area temperatures by 20~45 °C compared to other conditions while minimizing smoke spread. Although visibility was slightly lower than at K = 1.2 due to droplet size and particle count, the overall performance was superior. This study conclusively identified K = 1.5 as the optimal flow parameter, providing experimental evidence and theoretical support for the engineering application of high-pressure water mist sprinklers.

1. Introduction

Fire is one of the most common and destructive disasters, with the high temperatures and toxic smoke it generates being the primary causes of casualties and property damage [1,2]. Effective smoke control and thermal management are crucial for ensuring adequate evacuation time and improving firefighting and rescue conditions [3,4]. Compared to traditional fire suppression techniques, high-pressure water mist technology not only demonstrates superior fire extinguishing performance but also offers critical smoke containment and thermal insulation capabilities. These functions are pivotal in fire prevention and control, playing a vital role in suppressing smoke propagation, lowering ambient temperatures, and creating favorable conditions for personnel evacuation [5,6]. Unlike the water droplets produced by traditional sprinkler systems, the high-pressure fine water mist studied in this paper is generated by specialized sprinklers under elevated pressure, resulting in extremely fine droplet sizes. According to NFPA 750 standards [7], fine water mist is characterized by a diameter Dv0.99 less than 1000 μm. This significant size disparity results in fundamentally different physical properties and fire suppression mechanisms: the minute droplets possess a larger specific surface area, enabling more efficient evaporation and heat absorption, oxygen displacement, and stronger adsorption and settling effects on smoke particles. Consequently, fine water mist not only effectively extinguishes fires but also demonstrates unparalleled superiority in blocking smoke and thermal radiation compared to conventional water droplets.
At the level of mechanism research, Coppalle A et al. [8] established a radiative heat transfer model for water droplets, employing a two-flux radiation model to calculate the attenuation effect of water curtains on thermal radiation. Berour N et al. [9] approached the issue optically, utilizing the mechanisms of light absorption, scattering, and refraction to elucidate the ability of water curtains to attenuate radiant heat. Subsequent research focused on the influence of key parameters. Collin A [10] and Dembele S [11] et al. indicated that smaller droplet diameters and wider widths of water curtains enhance their thermal radiation blocking performance. Numerous scholars validated its effectiveness: Buchlin J M et al. [12] explored its application in industrial buildings; Chang H P et al. [13] demonstrated through model tests that water curtains effectively block thermal radiation from fire sources; other studies [14,15] showed that water mist curtains not only suppress thermal radiation but also impede the spread of high-temperature smoke. In field experiments, Dembele.S et al. [16] found through small-scale tests that the water curtain’s ability to attenuate thermal radiation increases with higher sprinkler flow rates and pressures; Sun J et al. [17] similarly conducted scaled studies demonstrating water mist systems’ effectiveness in preventing smoke propagation. Amano et al. [18] proved through scaled experiments that water curtains can block 70~80% of heat, 60~80% of smoke, and approximately 15% of toxic gases (carbon monoxide). Li Q et al. [19] and Mehaddi R et al. [20] independently validated the effectiveness of water mist curtain systems in smoke containment and thermal radiation attenuation within model tunnels. Concurrently, numerical simulation has become a vital research tool. Yang P et al. [21] utilized fire dynamics simulator (FDS) software to simulate the effects of water curtains on tunnel temperature, smoke, and toxic gases, while De Cachinho Cordeiro et al. [22] compared the spray mechanism and coverage area of fine water mist systems with conventional fire sprinkler systems; Wang, J et al. [23] demonstrated that increasing water flow rate significantly enhances the cooling effect on smoke temperatures.
In summary, while existing research has fully affirmed the smoke-blocking and heat-insulating efficacy of high-pressure water mist (water curtain) systems and has addressed the influence of macro-level parameters such as pressure and flow rate, most studies evaluate the system as a whole. There remains a lack of in-depth comparative and quantitative research on how the flow coefficient (K)—a single core design parameter of the sprinkler itself—systematically influences its atomization characteristics and ultimately its smoke and heat barrier performance. This is precisely the key to achieving precise selection and performance optimization in engineering design.
Based on this, the present study aims to address this research gap by thoroughly investigating the smoke-blocking and heat-insulating mechanisms of high-pressure water mist sprinklers with different flow coefficients under an 8 MPa operating pressure. The study will first identify the optimal range of candidate sprinklers through droplet size testing to select those with the best atomization performance. Subsequently, by integrating experimentally validated FDS numerical simulations, it will systematically analyze the specific influence patterns of different flow coefficient conditions on smoke propagation, temperature distribution, and visibility. Ultimately, the optimal flow coefficient will be selected, providing precise data support and theoretical basis for engineering design.

2. Materials and Methods

2.1. Water Mist Droplet Size Distribution Test Experiment

The droplet size of water mist is a fundamental parameter characterizing its properties, significantly influencing its fire extinguishing effectiveness [24]. Generally, smaller water mist droplets possess greater surface area, absorb more heat from the fire scene during vaporization, exhibit more pronounced vaporization cooling effects, and deliver superior smoke suppression, thermal insulation, and even cooling extinguishment capabilities against fires [25]. While water mist droplets typically vary in size, their distribution follows a regular pattern, characterized by average droplet diameter and cumulative volume percentage. According to NFPA 750 standards [7], water mist is defined as: at the minimum design operating pressure, water mist droplets with a diameter DV0.99 ≤ 1000 μm on the plane 1 m below the sprinkler are classified as water mist. For high-pressure water mist, the droplet requirement is DV0.99 ≤ 200 μm.
Numerous methods exist for measuring droplet size distribution in mist, with laser-based indirect measurement being the most widely applied technique at present [26]. This study employed a particle size analyzer to test the droplet size distribution of six high-pressure water mist sprinklers with different flow coefficients. Photographs of the selected sprinklers are shown in Figure 1.

2.1.1. Mist Droplet Size Distribution Testing Workbench

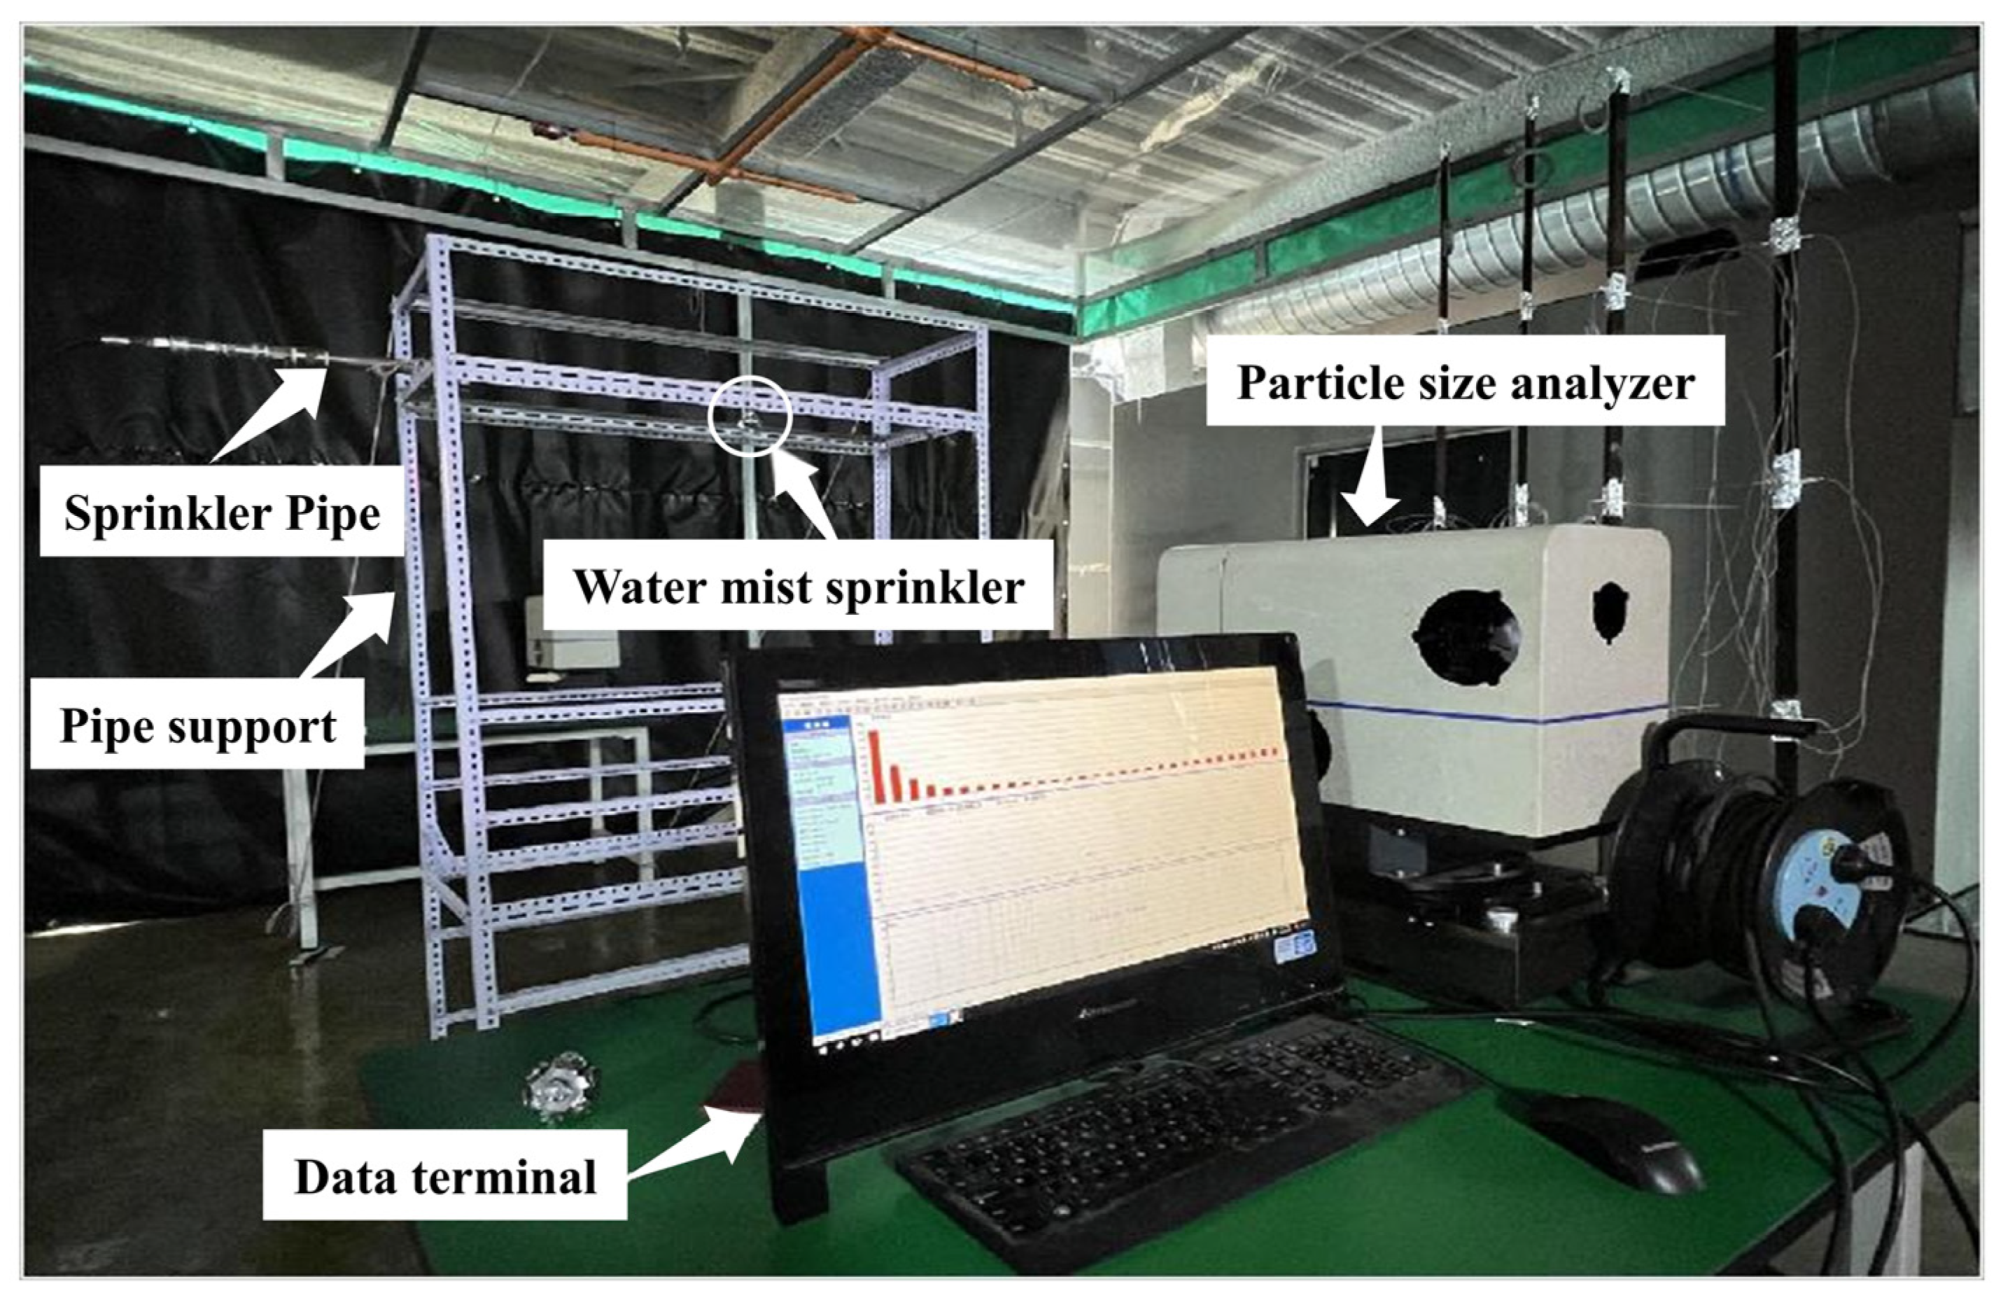
Based on the experimental requirements and objectives, an experimental platform for testing the spray characteristics of water mist sprinklers was constructed. The platform primarily consists of a high-pressure water mist system, test sprinklers, a particle size analyzer with a data terminal, and spray support structures. The experimental platform setup is shown in Figure 2. The pressure was set to 8 MPa (Preliminary experiments and existing research indicate that under this pressure, fine water mist sprinklers can generate dense droplets with Dv0.99 < 100 μm. This serves as the physical foundation for achieving highly effective smoke containment and thermal insulation, and measurements were taken at a position 1 m below the sprinkler on a horizontal plane. The effects of six different flow coefficients on droplet size were analyzed.

2.1.2. Test Results and Analysis of Droplet Size Distribution for Water Mist Sprinkler

The Rosin–Rammler (R-R) distribution curve for aerosol droplet size is a widely used empirical model. It precisely describes the size distribution of droplets in a primary spray through two core parameters: the “characteristic diameter X” and the “distribution exponent N” [27]. The R-R distribution curves obtained at different flow coefficients are shown in Figure 3. The figure reveals significant differences in droplet formation among sprinklers with varying flow coefficients, and droplet size does not consistently decrease with increasing flow coefficient. At low flow coefficients (K = 0.5, 0.7), droplet sizes tend to be larger, with the distribution curve concentrated in the large-droplet range, indicating insufficient atomization. When the flow coefficient reached 1.0, 1.2, and 1.5, the distribution curve shifted overall toward the smaller particle size range. Droplets below 50 μm constituted over 95% of the distribution, with improved particle size concentration, indicating superior atomization performance and greater suitability for forming a uniform, dense water mist layer. However, at K = 2.0, the distribution range begins to expand, with a certain proportion of large-diameter droplets appearing, leading to a decline in overall atomization efficiency.
Analysis of average droplet size further validates the aforementioned patterns. Instrumental measurements yield Figure 4 and Table 1. Figure 4 indicates that the average droplet size of the sprinkler does not exhibit a regular variation with increasing flow coefficient. At flow coefficients of 0.5 and 2, droplet sizes are larger compared to other conditions, suggesting coarser overall droplets. At flow coefficients of 0.7, 1.0, 1.2, and 1.5, droplet sizes reach relatively smaller levels, exhibiting finer droplets that enhance the suspension stability and coverage effectiveness of the water mist in space. However, at K = 0.7, the droplet size curve exhibits significant fluctuations, indicating poorer uniformity in droplet size distribution at this parameter. A flatter curve indicates more uniform droplet size distribution at that parameter. The uniformity of droplet size distribution directly impacts smoke and heat barrier effectiveness. When droplet sizes are evenly distributed, they can more uniformly cover the fire source, increasing collision opportunities with smoke and dust particles. This enhances ash adsorption, oxygen isolation, and temperature reduction [28].
Based on the fitting errors for different droplet size distributions in Table 1, it can be observed that the errors are relatively small when the sprinkler flow coefficients are 1.0, 1.2, 1.5, and 2. This indicates that under these four flow coefficients, the size distribution spans a narrower range and exhibits a relatively concentrated distribution.
Based on the smoke-blocking and heat-insulating requirements for high-pressure water mist sprinklers, priority should be given to those with smaller droplet sizes and a relatively uniform droplet size distribution. In summary, analysis of the average droplet size and overall droplet size distribution test results for these six sprinklers indicates that those with flow coefficients of 1.0, 1.2, and 1.5 exhibit optimal atomization performance. These sprinklers are more suitable for subsequent research into smoke-blocking and heat-insulating performance during fires.

2.2. Smoke and Heat Barrier Test Apparatus and Parameter Measurement Point Layout

2.2.1. Smoke and Heat Barrier Test Bench Setup

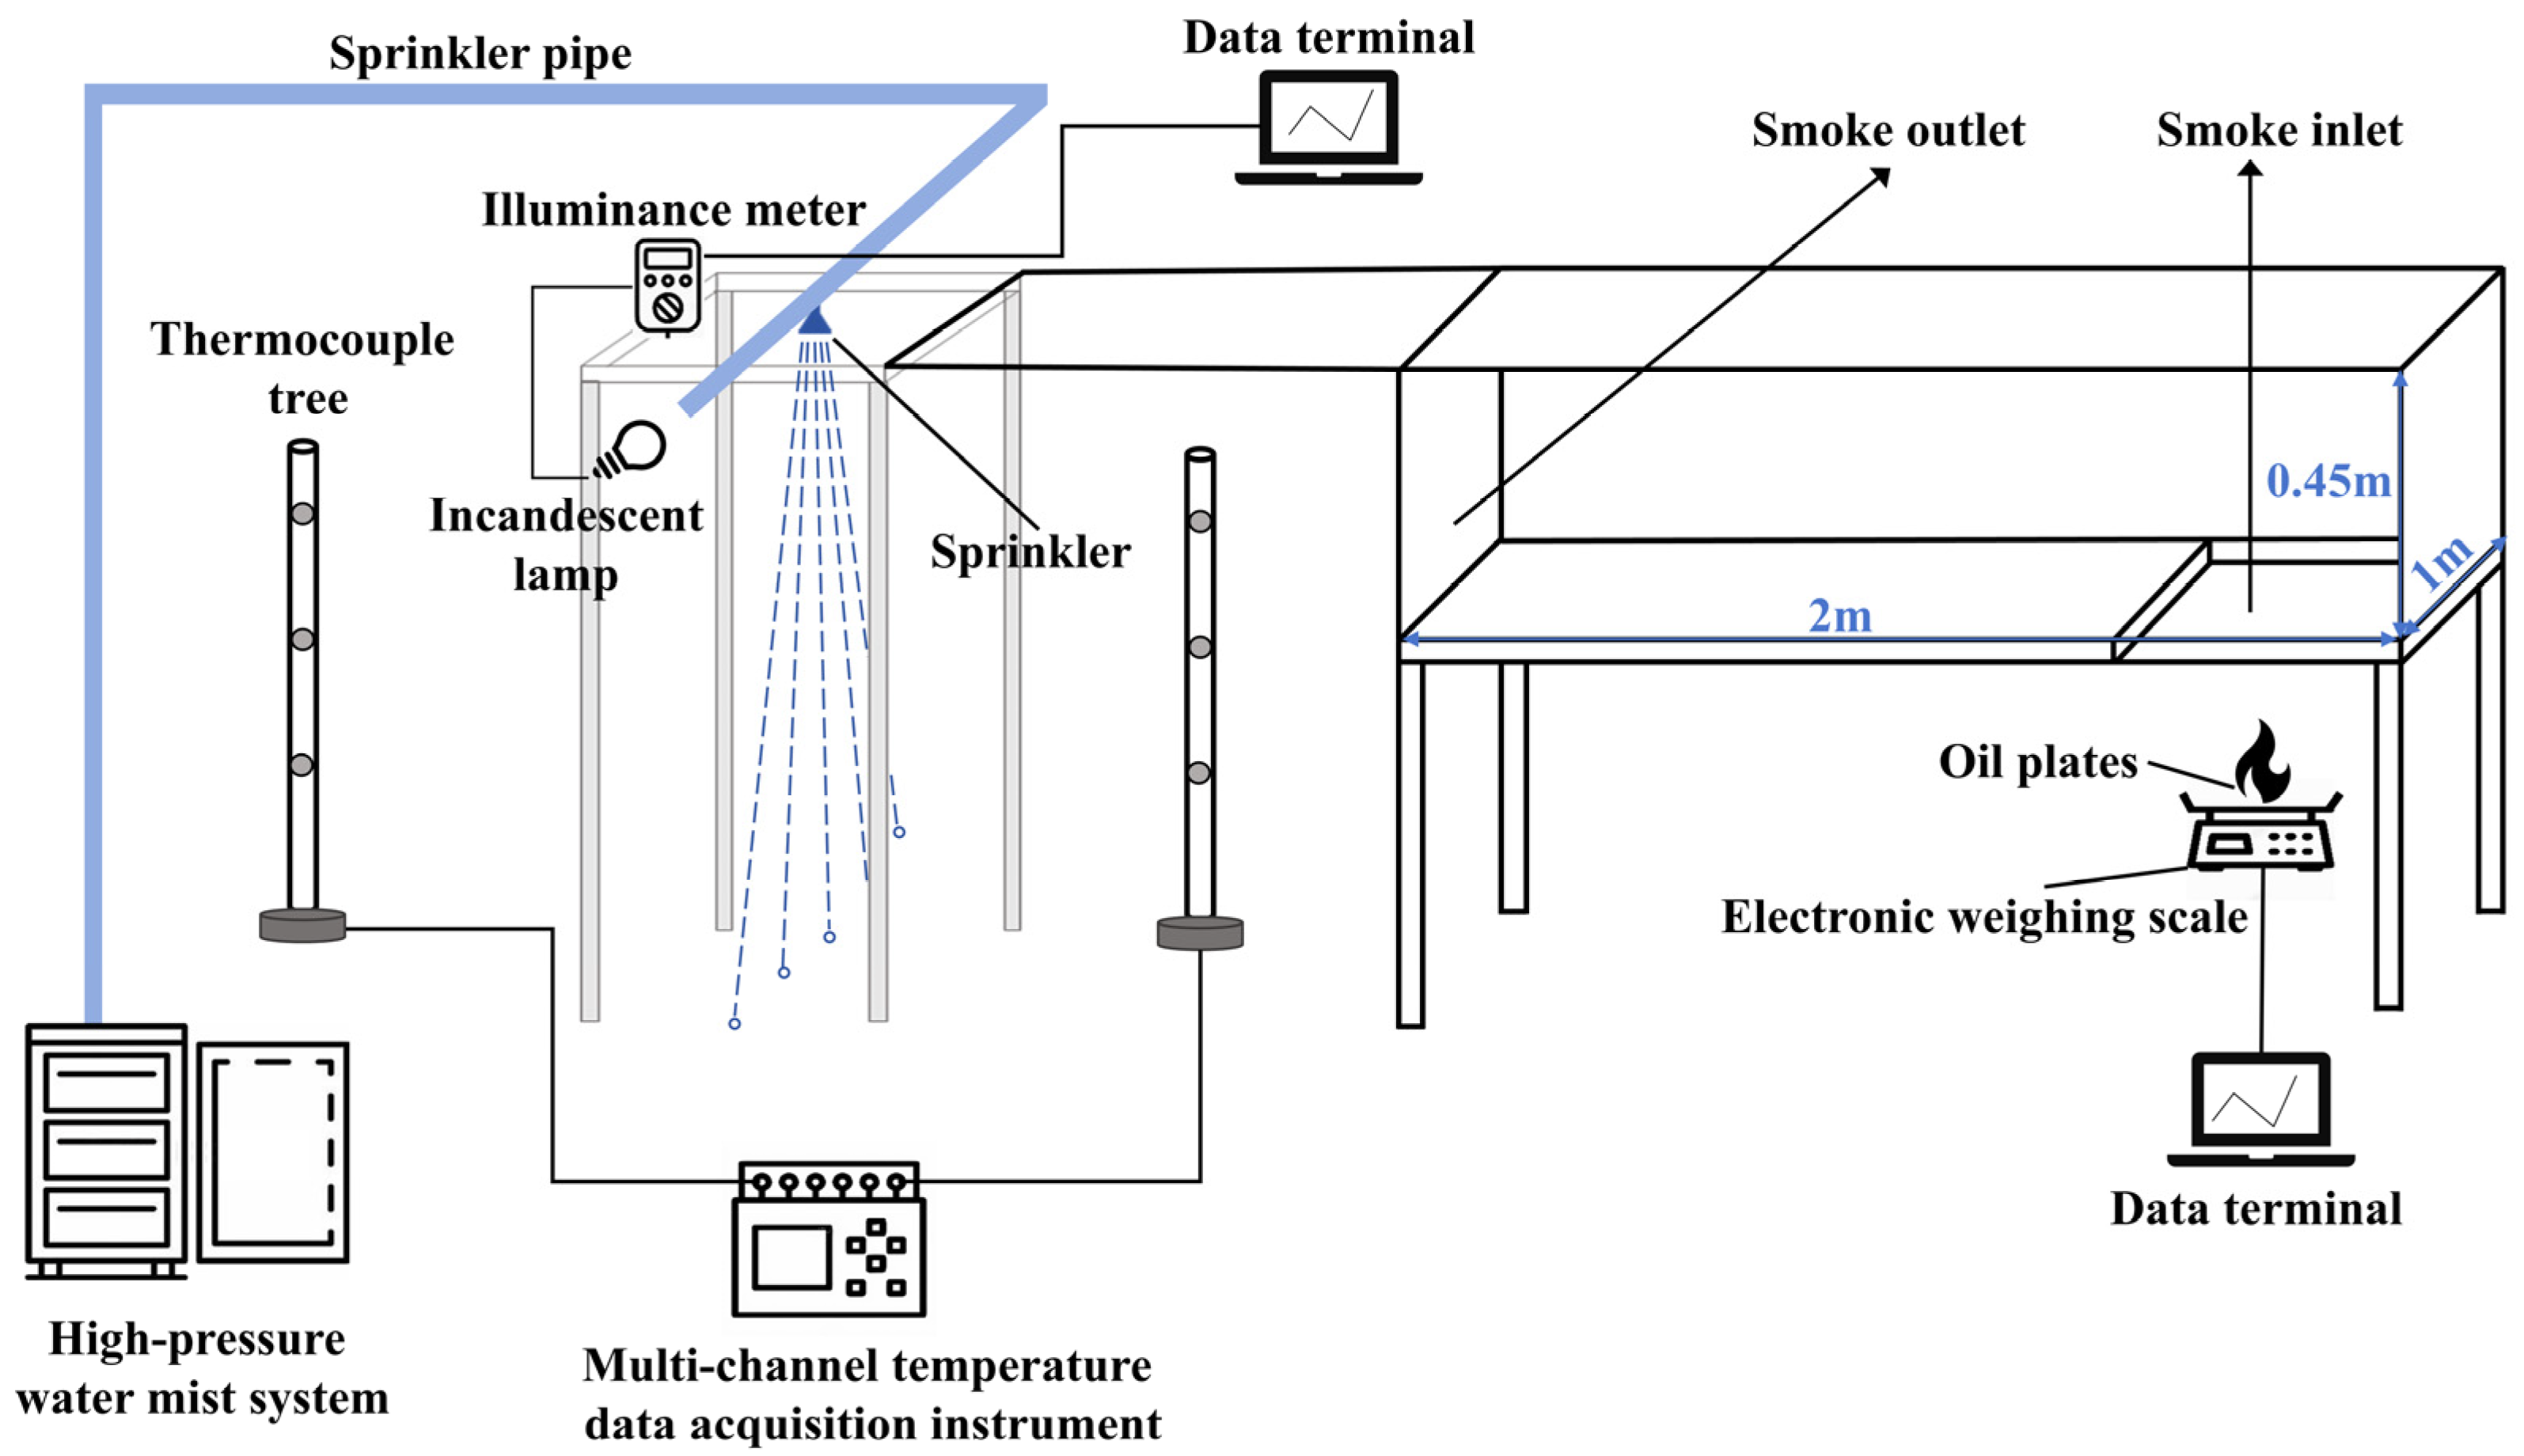
The main component of this experiment is a flue measuring 2 × 1 × 0.45 m in length, width, and height. As shown in Figure 5, a 0.5 × 1 m opening is located at the lower right end of the flue, serving as the inlet for heat and flue gas. The flue inlet is positioned 1.05 m above the ground. An electronic scale (accuracy 0.1 g, capacity 30 kg) is positioned below to measure real-time changes in fuel weight. An insulating plate is placed above the scale, separating the square oil pan (0.34 × 0.34 m) positioned above; A spray pipe was installed 0.5 m from the exhaust outlet and 1.7 m above the ground, with a high-pressure water mist sprinkler mounted at its midpoint. Incandescent lamps and illuminance meters were positioned 0.23 m from the spray pipe, 0.2 m below it on both sides. The sprinkler was activated 20 s after ignition and maintained in a continuous-on state throughout the experiment.

2.2.2. Introduction to Experimental Measurement Equipment

This experiment investigates the smoke propagation patterns, temperature variations on the smoke-facing and non-smoke-facing sides, and changes in light attenuation of water mist sprinklers under a fixed operating pressure (8 MPa) and varying flow coefficients (1.0, 1.2, and 1.5). The study measures how these variables affect smoke containment and thermal insulation performance. Experimental equipment used includes thermocouples, electronic balances, and illuminance meters.
  • Temperature Measurement
Thermocouples were positioned on both sides of the spray pipe and above the fire source to collect temperature variations within the fire scene for analyzing smoke flow patterns. This experiment employed Φ1 mm K-type armored thermocouples with a measurement range of 0~1100 °C. Temperature data was collected and recorded using an Amber multi-channel temperature tester with a sampling interval of 0.2 s. To comprehensively reflect smoke flow and temperature variations across the test bench, a total of 13 thermocouples were deployed as shown in Figure 6. First, thermocouples were arranged symmetrically in a T-shape on both sides of the spray pipe, each positioned 0.5 m from the pipe. The upper row comprised three thermocouples located along the upper edge of the smoke outlet, spaced 0.3 m apart. Below, two thermocouples were spaced 0.2 m apart at 1.05 m above the floor. Five thermocouples were placed on each side, numbered #01~#10. Additionally, three thermocouples were positioned directly above the fire source at 0.1 m intervals, numbered #11~#13.
  • Measurement of Ignition Source Power
Heat release rate is a crucial parameter for evaluating a material’s combustion characteristics and a key indicator of the intensity of the combustion process. It reflects the severity and progression velocity of a fire, determining the temperature distribution and smoke generation within the fire scene. The determination of this parameter forms the foundation of fire experiments [29]. Methods for measuring heat release rate include the loss-on-ignition method, displacement combustion method, and oxygen consumption principle method. For single materials (e.g., fuel oil, wood panels, curtains) undergoing complete combustion, the loss-on-ignition method yields relatively accurate results. Additionally, it offers advantages such as simple equipment, low cost, and straightforward operation. Since this experiment uses n-heptane (500 mL) as the ignition source and the material is simple and uniform, the weight loss method was adopted for this experiment. Multiple measurements of mass loss rate were taken for an oil pan of dimensions 0.34 × 0.34 m, and the corresponding heat release rate was calculated using the formula. This experiment employed an electronic scale (accuracy 0.1 g, capacity 30 kg) connected to a computer for real-time transmission and recording of weight changes during fuel combustion. Based on the real-time weight change data, the mass loss rate could be determined, as shown in Figure 7. A brief increase in mass is observable in the middle section of the mass loss curve. This phenomenon is not caused by an actual increase in fuel but rather by transient errors induced by the measurement system and experimental environmental factors. During combustion, an intense thermal plume forms above the oil pan. The unstable ascent of hot air causes buoyancy disturbances affecting the electronic scale, resulting in transient weighing deviations. Since these variations are small in magnitude and short in duration, their impact on the overall mass loss rate and heat release rate calculations is limited, and they do not compromise the reliability of the computational results.
The heat source power is calculated using the following Equation (1) based on the physical properties of n-heptane itself:
Q = Φ m ˙ H
In the formula:
Q —Heat release rate, kW;
Φ —Combustion efficiency factor, 0.3~0.9;
m ˙ —Fuel quality combustion rate, kg/s;
H —Calorific value of n-Heptane combustion, 44,600 kJ/kg.
The n-heptane used in this experiment exhibits high volatility, a low ignition point, and thorough combustion reactions. Under natural convection conditions, it forms a stable, bright diffusion flame. The small oil pan dimensions (0.34 × 0.34 m) and ample oxygen supply ensured the combustion process remained largely in a state of complete combustion. No significant black smoke or oxygen deficiency was observed. Therefore, the flame combustion efficiency approached the level of complete combustion. Considering factors such as the well-ventilated experimental environment, stable flame, and minimal smoke generation, this study adopted Φ = 0.9 as the combustion efficiency factor, which accurately reflects the actual heat release. Substituting the data, the calculated heat source power for this experiment was 116.406 kW.
  • Measurement of Smoke Opacity
Fire smoke contains a large amount of suspended solid and liquid smoke particles, typically ranging in size from several micrometers to tens of micrometers. These particles are larger than the wavelength of visible light (0.4~0.7 μm), thereby obscuring visible light and significantly reducing visibility within the fire scene. This experiment employed a TES digital illuminance meter (TES-1339R, the manufacturer is Taisi Electronics Industrial Co., Ltd., located in Taipei City, Taiwan), and a 40 W incandescent lamp to measure and record illuminance changes under various operating conditions. This reflected smoke’s light-attenuating properties, thereby evaluating the smoke-blocking effectiveness of water mist sprinklers. The incandescent lamp was mounted on one side of the support, facing the illuminance meter. The illuminance meter (measuring range: 0.01 lux to 999,900 lux; resolution: 0.01 lux, 0.001 fc) measured brightness by receiving light emitted from the incandescent lamp.

2.3. Numerical Simulation of Small-Scale Smoke and Heat Barrier Experiments

2.3.1. Model Establishment

This simulation replicates a small-scale test bench at a 1:1 scale, utilizing Pyrosim 2024.1.0605 for modeling and incorporating water mist sprinklers as shown in Figure 8. The flue dimensions are 2 m × 1 m × 0.45 m, positioned 1.05 m above the floor. The oil pan measures 0.34 m × 0.34 m and is positioned directly below the smoke inlet. The sprinkler is placed directly below the center of the smoke baffle, serving as a boundary that divides the smoke outlet into a near-smoke side (unprotected) and a far-smoke side (protected). Based on the growth trends during fire development, fires can be categorized as steady-state or non-steady-state. Since steady-state fires are overly idealized, this simulated fire is treated as non-steady-state. The simulation calculations are performed based on the fire source power from the small-scale experiment (approximately 117 kW).

2.3.2. Grid Size Settings

Extensive research indicates that the specified grid size significantly impacts simulation results. Generally, in FDS software, smaller grid sizes yield more precise calculations that better approximate reality. However, excessively fine meshes increase computational load and prolong processing time. Therefore, when selecting mesh sizes, factors such as computer performance should be considered to accurately define the grid dimensions. Since the fire source characteristic diameter D * exhibits a strong correlation with mesh size, the fire source characteristic diameter should be calculated first when defining the model’s mesh. This calculation follows the Formula (2) [30].
D * = { Q ρ 0 C p T 0 g } 2 / 5
In the formula:
D * —Fire Source Characteristic Diameter, m;
Q —Fire Source Heat Release Rate, kW;
T 0 —Fire Source Heat Release Rate, K;
ρ 0 —Density of Ambient Air, kg·m−3;
C p —Specific heat capacity of ambient air, kJ/(kg∙K);
g —Gravitational acceleration, m∙s−2.
The simulated fire source power is 117 kW. Calculations based on Equation (2) yield an approximate characteristic diameter D * of 0.4 m for the fire source. Since the droplet particles from fine water sprinklers require finer meshes for accurate simulation, the model employs a multi-level mesh refinement strategy for different regions. According to N. Petterson’s research report [31], when performing numerical simulations of fire processes using software, the grid size near the fire source and its surrounding areas should be controlled between 0.05 and 0.1 D * to achieve good agreement between computational and experimental results. Areas farther from the fire source can employ coarser grids, with the maximum grid size reaching up to 0.5 D * . To optimize computational efficiency, the simulation employs a grid size of 0.04 × 0.04 m from the smoke outlet to the ceiling edge, with 0.2 × 0.2 m grids in other areas, as detailed in Table 2.

2.3.3. Measurement Equipment Layout and Sprinkler Parameter Settings

The parameters of this simulated measurement equipment are set based on data obtained from small-scale experiments. As shown in Figure 9a, the thermocouples are arranged in a 1:1 equivalent configuration to the physical experiment. Temperature, visibility, and smoke velocity slices are installed at the smoke outlet, sprinkler, smoke-back side, and ceiling to visually observe the heat insulation and smoke blocking performance of the water mist sprinklers. The slice configuration is shown in Figure 9b below.
Based on the small-scale experiment, a water mist sprinkler was installed at the midpoint of the ceiling above the smoke outlet. Parameters were configured according to the sprinkler operating conditions from the small-scale experiment, with flow coefficients set to 1.0, 1.2, and 1.5, respectively, all at a pressure of 8 MPa. Simulation parameters for these three operating conditions were then established using measured data on spray pattern characteristics and nozzle performance. Parameters required for Pyrosim include: droplet size, spray angle, atomization cone angle, particle lifetime, and physical properties of the spray medium. First, define the droplet size range by setting the median diameter (DIAMETER). Use the default minimum diameter of 20 μm. Based on experimental measurements, set the MAXIMUM_DIAMETER to 50 μm. Since each particle has its own trajectory, tracking them incurs significant computational overhead. Therefore, set the AEG parameter to 30 s to control the particle lifetime. Tracking ceases after this duration to conserve simulation time. Similarly, the same effect can be achieved by reducing the number of particles demonstrated in the Smokeview file. Setting the SAMPLING_FACTOR parameter to 10 means the animation displays only 10% of the particles. Other relevant simulation parameters for the sprinkler are set based on experimental measurement data, as shown in Table 3 below.

3. Results

3.1. Comparison and Validation of Numerical Simulation Results with Experimental Results

Taking K = 1.0 as an example, experimental results are compared with simulation results. The model’s validity is verified by comparing the spray patterns of water mist sprinklers, smoke propagation patterns, temperature distributions, and visibility distances.

3.1.1. Spray Pattern Characteristics of Water Mist Sprinklers

Whether the simulation results of the water mist sprinkler spray pattern align with experimental data directly impacts subsequent experimental simulations. As shown in Figure 10, the experimental results of the water mist sprinkler spray pattern exhibit high consistency with the FDS simulation outcomes. During the initial phase, pressurized water is ejected through minute orifices in the porous sprinkler, dispersing in multiple directions with a spray angle exceeding 100°. The spray primarily concentrates beneath the sprinkler, with both experiments and simulations gradually forming dense plumes. As the ejection time increases, droplets sink and diffuse outward, progressively developing into conical spray zones in both cases. After reaching the steady-state phase, the water flow rapidly fragmented into minute droplets at the sprinkler outlet due to pressure drop and ambient air resistance. These droplets moved vertically downward for a certain distance until reaching the ground, at which point the spray field contracted and tended toward uniform coverage. The simulation results generally matched the experimental data in overall morphology and expansion range, with only minor differences in local concentration distribution. Overall, the simulation effectively reproduced the formation and evolution patterns of the spray field.

3.1.2. Smoke Spread Conditions

Experimental and simulated images were captured at three key time points: before sprinkler activation, immediately after sprinkler activation, and 40 s post-activation. As shown in Figure 11, the smoke movement trajectories in both experiments and simulations exhibit substantial consistency. Sprinkler: Before sprinkler activation, smoke within the fire scene rises and rapidly accumulates at the ceiling. Both experiments and simulations clearly demonstrate the smoke plume being drawn upward and spreading along the ceiling. Upon activation of the sprinkler, the experiment observed spray droplets rapidly entering the fire scene, mixing with and cooling the high-temperature smoke. The downward movement of the water mist also dragged the smoke toward the ground, suppressing its upward velocity. The simulation similarly showed slowed plume expansion and reduced thickness of the top smoke layer. As the fire progressed into the fully developed stage, after 40 s of continuous sprinkler operation, smoke continued to be generated from the fire source. However, the flushing effect of the water mist mitigated smoke spread on the protected side, causing smoke to accumulate persistently at the fire source. Overall, FDS simulation results aligned with experimental observations regarding smoke spread trends across three critical stages, validating the simulation’s reliability in reproducing the smoke control effects of water mist.

3.1.3. Temperature

To better demonstrate the smoke-blocking and heat-insulating effects of water mist, temperature data from the smoke-facing side (#5) and non-smoke-facing side (#8) of both the experimental and simulated groups were compared. The results are summarized in Figure 12 below. The figure shows that the temperature distributions of the experimental and simulated groups are largely consistent: Before sprinkler activation (0~20 s), temperatures at both measurement points rose rapidly over time, with the smoke-exposed side exhibiting a steeper curve due to its direct exposure to the high-temperature smoke passage, resulting in a more pronounced temperature increase. After activation (20 s), the smoke-facing side remained largely unaffected, while the back-smoke side exhibited a slower rise with a weakened upward trend. By 100 s after activation (120 s), the smoke-facing side reached 220 °C and the back-smoke side reached 60 °C. Both sides then began a descent, stabilizing near ambient temperature by 240 s. Due to the continuous nature of combustion and spray processes, sustained heat accumulation and more complex three-dimensional thermal convection effects occur within the test bench. This leads to localized heat concentration, resulting in elevated temperature readings during experiments. However, overall results indicate that activating fine water mist sprinklers effectively mitigates heat buildup in the fire zone and improves the thermal environment within the protected area. Simultaneously, the experimental and simulated curves largely align in trend and inflection point locations, validating the reliability of FDS simulations for temperature prediction.

3.1.4. Visible Distance

To further validate the consistency between simulation results and experimental data, we compared changes in visibility during the combustion process. However, in small-scale physical experiments, smoke obstruction is represented by changes in illuminance measured in lux (lx), whereas Pyrosim software uses visibility measured in meters (m) to reflect smoke obstruction. Therefore, unit conversion is necessary before data comparison. To convert illuminance data into visibility-based data, the Beer–Lambert law was applied [32], with the calculation formulae shown in Equation (3):
I = I 0 e x p K c L
In the formula:
I 0 —The intensity of light emitted from a light source over a given spatial length, W∙m−2;
I —Light intensity after the beam passes through a given length of smoke, W∙m−2;
K c —Attenuation coefficient;
L —The length of the given space, m.
From (3), the Attenuation coefficient is:
K c = I n I / I 0 / L
The relationship between visibility distance and the light attenuation coefficient is as follows:
S = R K c
where R is the proportional coefficient. For luminous signs, retroreflective signs, and buildings with reflected light, R is set to 5~10, 2~4, and 2~4, respectively. For experimental purposes, during conversion calculations, L is set to 1 m and R is set to 5.
After processing, the result is shown in Figure 13. Observing the curves in the figure reveals that without activated sprinklers, visibility drops sharply from an initial value of 30 m to approximately 3 m. Upon sprinkler activation, visibility experiences a recovery phase, peaking at around 9 m due to water mist washing away smoke particles and enhancing visibility. However, a second decline in visibility follows, caused by the obscuring effect of the water mist droplets themselves. When the number of water droplets exceeds that of smoke particles, visibility within the area begins to slowly recover and fluctuates within a certain range, demonstrating the sustained effect of water mist in diluting smoke and improving visibility. In actual experiments, the interactions between water mist droplets and smoke particles are highly complex. Beyond the already considered inertial collision and interception effects, more significant Brownian motion and electrostatic effects may also occur. These mechanisms promote the coalescence of smaller particles into larger, heavier aggregates, thereby accelerating smoke settling. Numerical models typically simplify these intricate microscopic physical processes, potentially leading to slightly conservative predictions of water spray smoke removal efficiency. This manifests as experimental data being marginally higher than simulated results. However, the overall trends between simulations and experiments align, validating the reliability of FDS in predicting visibility distances.

3.2. Optimal Sprinkler Flow Rate Parameter Selection

After conducting comparative validation between small-scale physical experiments and software simulations, the simulation results for all operating conditions were found to be feasible. Therefore, this section compares the smoke propagation patterns, temperature distributions, and visibility conditions measured under three simulated nozzle flow coefficients—1.0, 1.2, and 1.5—to identify the optimal parameters for the sprinkler in smoke blocking and thermal insulation.

3.2.1. Comparison of Smoke Spread

Comparing simulation results after activating sprinklers for 40 s at three flow coefficients reveals smoke propagation patterns on both the smoke-facing and non-smoke-facing sides. As shown in Figure 14 below, the simulation clearly demonstrates that as the sprinkler flow coefficient increases, smoke volume on the non-smoke-facing side decreases, along with reduced smoke spreading along the ceiling into the air. The flame shape at the fire source also diminishes. This indicates that increasing the sprinkler flow coefficient enhances the smoke blocking and flushing effects. Therefore, for optimal smoke spread prevention, selecting a sprinkler with a flow coefficient K = 1.5 is most suitable.

3.2.2. Temperature Comparison

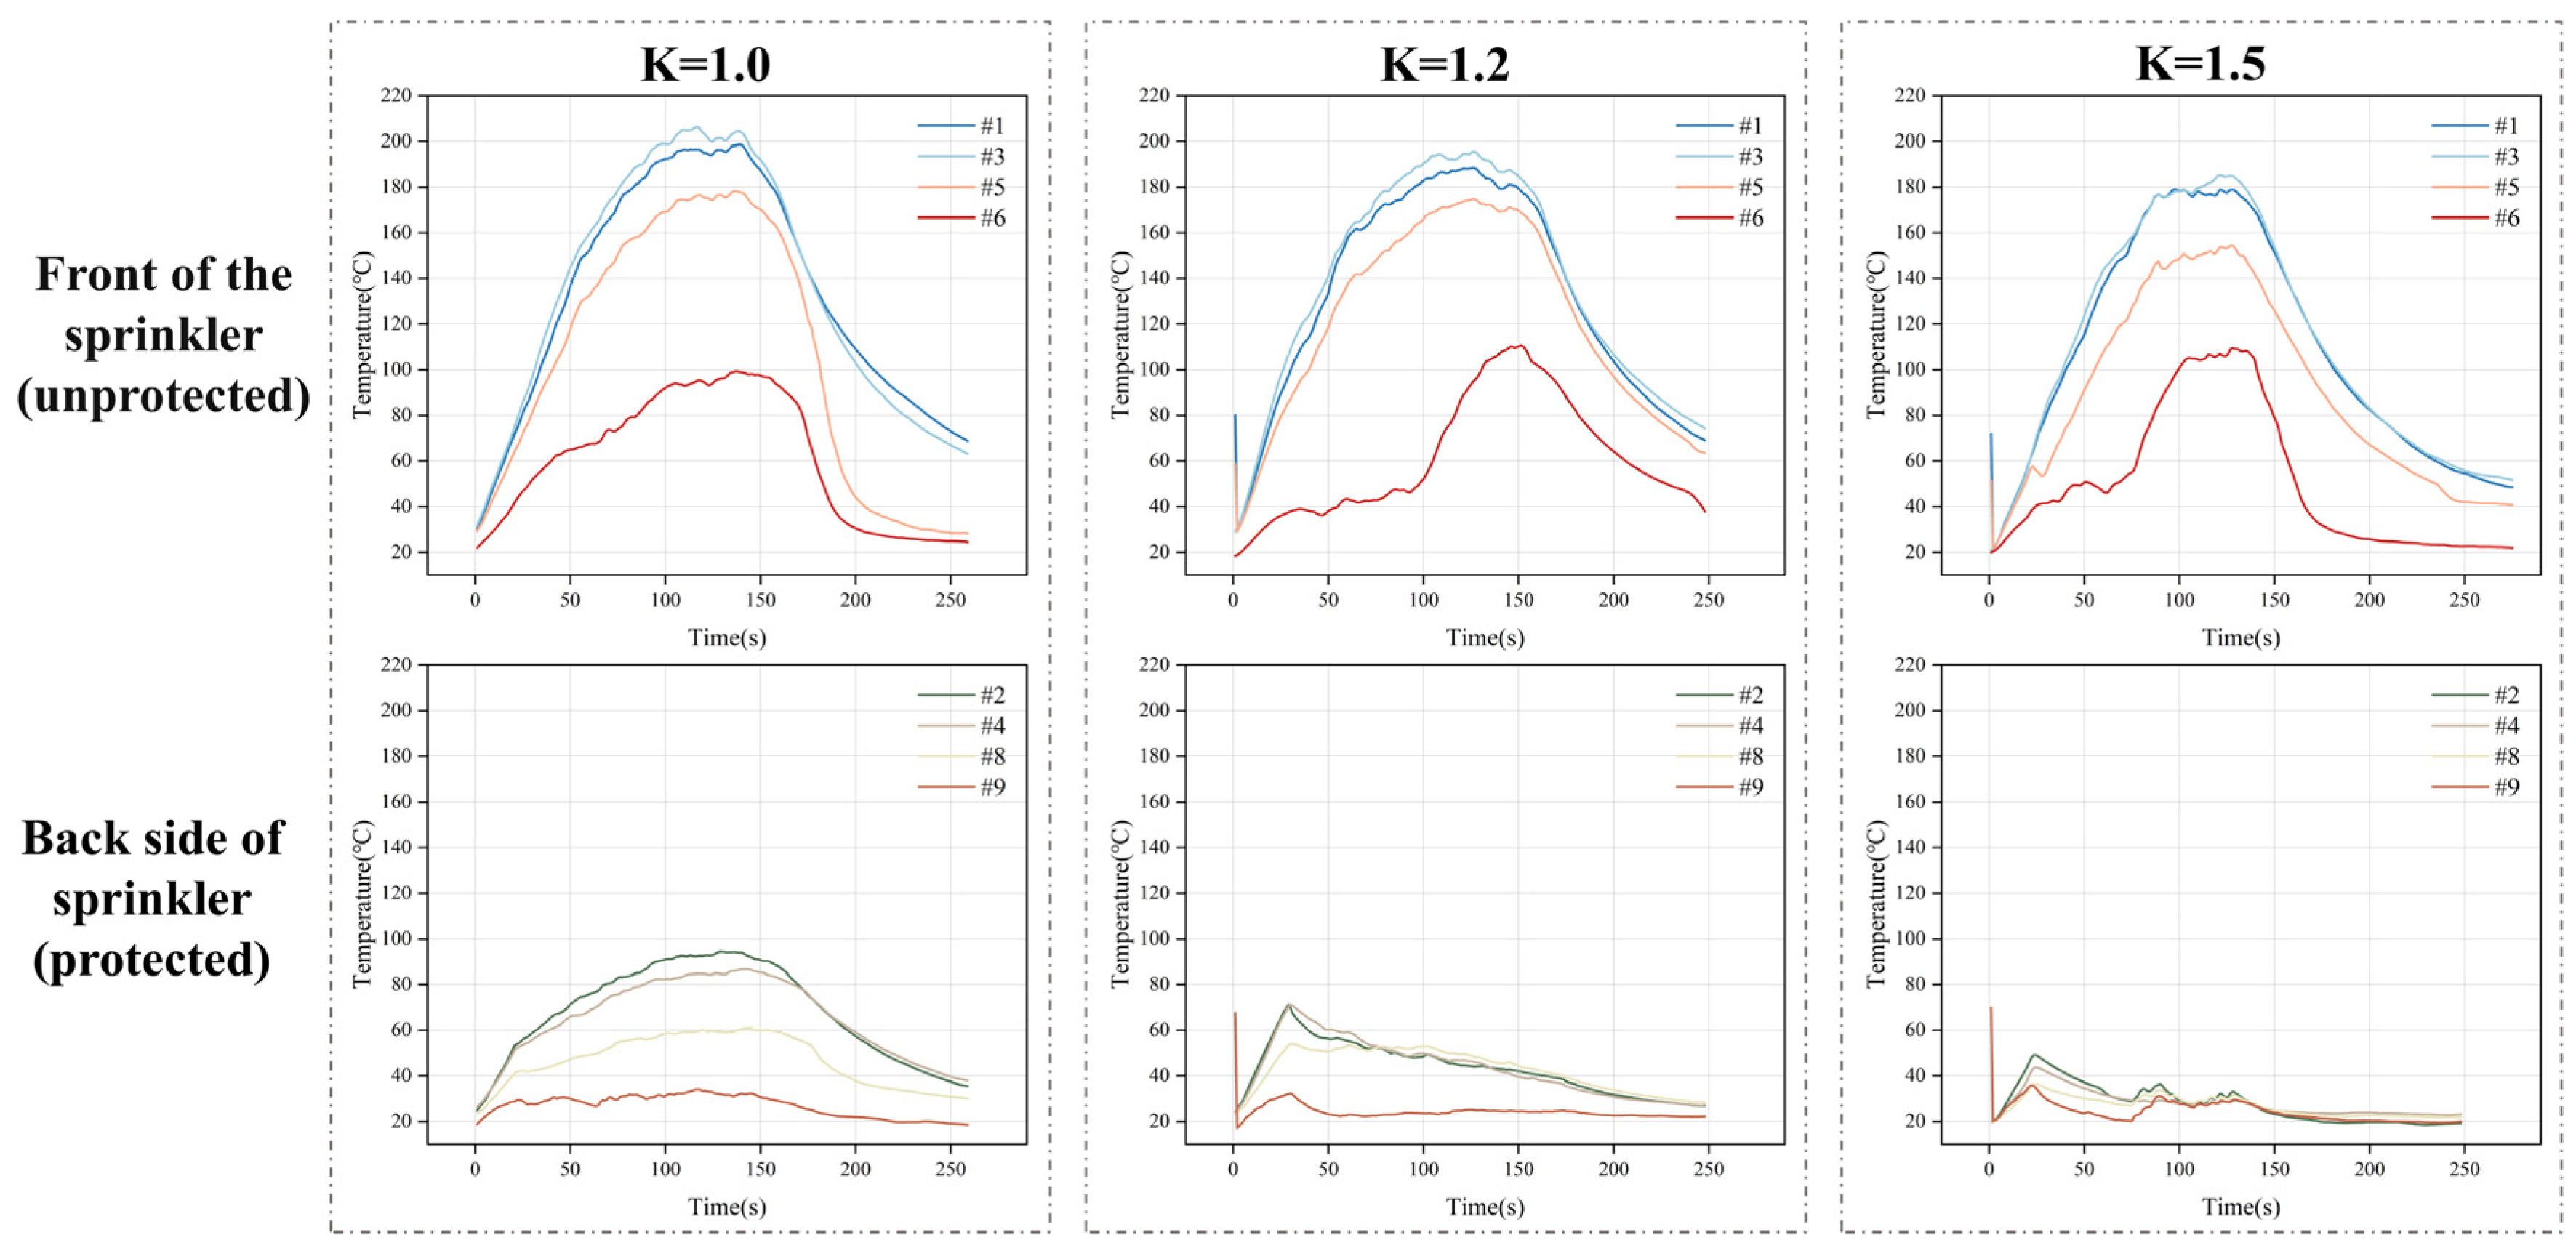
The data provides a more intuitive view of the cooling effect on the protected side smoke under three operating conditions. The temperature distribution values for the smoke-exposed side and the non-smoke-exposed side at different flow coefficients are summarized in Figure 15 below. The temperature curve on the smoke-facing side (unprotected) indicates that the sprinkler’s suppression effect on hot smoke intensifies with increasing flow coefficient. At K = 1.5, temperatures begin to decline around 120 s—30 to 50 s earlier than at K = 1.0 and K = 1.2—demonstrating the most pronounced suppression effect. Observing the smoke-back side (protected side), the best cooling effect is also achieved at K = 1.5. The maximum temperature on the smoke-back side is around 50 °C, representing a reduction of 20~45 °C compared to K = 1.0 and K = 1.2, demonstrating the most pronounced cooling effect. Therefore, through comparison, it is found that K = 1.5 yields the best performance in smoke insulation.

3.2.3. Visibility Comparison

In studies examining the smoke-blocking and thermal insulation performance of sprinkler heads, visibility is a critical parameter directly impacting whether personnel can evacuate safely and quickly from a fire scene and whether firefighters can conduct rescue operations effectively [33]. Therefore, visibility distance data from three operating conditions were compared, yielding the results shown in Figure 16 below. Simulation results for visibility distance indicate a rapid decline in all three operating conditions prior to sprinkler activation, signifying a swift deterioration of fire scene visibility. After sprinkler activation, water mist at all three flow coefficients demonstrated effective restoration of visibility. Smoke obstruction must account not only for the mist’s vaporization cooling and scrubbing effects on smoke but also for the impact of droplet size and concentration on visibility. At K = 1.5, droplet size is minimal, yielding the best smoke-blocking and heat-insulating effects. However, visibility falls between K = 1.0 and K = 1.2. This occurs because the higher number concentration of fine particles, while improving smoke dispersion, also causes light scattering that affects visibility. Therefore, in terms of visibility, the sprinkler operating condition at K = 1.2 holds a certain advantage over that at K = 1.5, demonstrating the most significant effect on visibility recovery.
In summary, after comparing the smoke containment and thermal insulation performance of the three sprinkler types across three aspects, the optimal sprinkler flow rate parameter is determined to be K = 1.5 based on the best overall performance.

4. Discussion and Conclusions

This study systematically analyzed the droplet characteristics and smoke-blocking/heat-insulating performance of high-pressure water mist sprinklers under an operating pressure of 8 MPa, employing a combination of experimental measurements and numerical simulations. Optimal flow parameters were identified for different flow coefficients (K = 0.5, 0.7, 1.0, 1.2, 1.5, 2.0). Key conclusions are as follows:
  • Droplet size analysis indicates that droplet size does not exhibit a regular variation with increasing flow coefficient. Sprinklers with flow coefficients of 1.0, 1.2, and 1.5 demonstrate optimal atomization at 8 MPa, producing fine droplets (D32 ≤ 39.6 μm) and a concentrated distribution (fitting error ≤ 0.072), facilitating the formation of a uniform, dense water mist layer. This provides a foundation for subsequent studies on smoke barrier and thermal insulation performance.
  • Comparison between small-scale experiments and FDS simulations confirmed high consistency in smoke propagation trends, temperature distribution, and visibility changes. This indicates that the established numerical model reliably reflects the smoke barrier and thermal insulation behavior of water mist.
  • Comprehensive comparison of smoke and heat suppression performance across flow coefficients K = 1.0, 1.2, and 1.5 reveals that K = 1.5 sprinklers deliver optimal performance in suppressing smoke spread (minimum spread range) and reducing temperature (maximum protected-side temperature at 50 °C, representing a 20~45 °C reduction compared to K = 1.0 and K = 1.2 sprinklers). Although visibility was slightly lower than the K = 1.2 condition due to the influence of droplet size and particle count on visibility, the overall performance was optimal. Therefore, K = 1.5 was selected as the optimal flow rate parameter.
Although the numerical model established and validated in this study effectively reproduces key phenomena observed in small-scale experiments, several limitations must be noted, which also point to directions for future research. First, this study and its model are only applicable to a fixed operating pressure of 8 MPa. The applicability and predictive accuracy of the model under other pressure conditions require systematic verification. Second, the flow coefficient range examined is concentrated between 0.5 and 2.0. Beyond this range, the model’s predictive capability regarding nozzle performance may be uncertain. Finally, and critically, the model’s validation is entirely based on a specific small-scale experimental setup with relatively idealized and simplified boundary conditions (e.g., ventilation, spatial scale). Therefore, when applying this model to real-world fire scenarios with more complex boundary conditions and larger scales, its universality and predictive accuracy require further validation and calibration through full-scale experiments. Future research will focus on developing more refined models and conducting full-scale experiments to validate and extend the applicability of the current model.

Author Contributions

Conceptualization, J.M. and Q.L.; methodology, J.M., Q.L. and Z.L.; software, Z.L. and J.L.; validation, J.M., Q.L. and H.X.; formal analysis, J.M., X.W. and Z.L.; investigation, J.L. and H.X.; resources, Q.L. and X.W.; data curation, J.M.; writing—original draft preparation, Z.L.; writing—review and editing, J.M. and Q.L.; visualization, X.W. and H.X.; supervision, Q.L. and X.W.; project administration, X.W.; funding acquisition, Q.L. All authors have read and agreed to the published version of the manuscript.

Funding

This research was funded by National Natural Science Foundation of China (NSFC) General Program: Study on transport characteristics of confined space jet and formation mechanism of smoke prevention air curtain in vestibule with jet boundary conditions and wall boundary conditions [Project Number: NSFC 52476142].

Data Availability Statement

Data are contained within the article.

Conflicts of Interest

The authors declare no conflicts of interest.

References

  1. Yao, Y.; Wang, Y.; Chen, L.; Ren, F.; Shi, C. Numerical Study on Coupled Smoke Control Using Longitudinal Ventilation and Naturally Ventilated Shafts during Fires in a Road Tunnel. Fire 2023, 6, 126. [Google Scholar] [CrossRef]
  2. Terrill, J.B.; Montgomery, R.R.; Reinhardt, C.F. Toxic Gases from Fires. Science 1978, 200, 1343–1347. [Google Scholar] [CrossRef] [PubMed]
  3. Ji, J.; Gao, Z.H.; Fan, C.G.; Sun, J.H. Large Eddy Simulation of Stack Effect on Natural Smoke Exhausting Effect in Urban Road Tunnel Fires. Int. J. Heat Mass Transf. 2013, 66, 531–542. [Google Scholar] [CrossRef]
  4. Yao, Y.; Qu, B.; Zhu, H.; Wang, J.; Zhao, S.; Wang, Q. Theoretical and Numerical Study on Critical Velocity and Driving Force for Preventing Smoke Backlayering in a Connection Roadway Fire of Coal Mines. Tunn. Undergr. Space Technol. 2022, 127, 104566. [Google Scholar] [CrossRef]
  5. Liu, Y.; Wang, X.; Liu, T.; Ma, J.; Li, G.; Zhao, Z. Preliminary Study on Extinguishing Shielded Fire with Water Mist. Process Saf. Environ. Prot. 2020, 141, 344–354. [Google Scholar] [CrossRef]
  6. Lu, C.; Liang, W.; Vadim, Y.; Aleksei, N. The Review of the Water Mist Fire Extinguishing Technology. Bull. Sci. Pract. 2019, 5, 197–202. [Google Scholar] [CrossRef]
  7. NFPA 750; Standard on Water Mist Fire Protection Systems. National Fire Protection Association: Quincy, MA, USA, 2019.
  8. Coppalle, A.; Nedelka, D.; Bauer, B. Fire Protection: Water Curtains. Fire Saf. J. 1993, 20, 241–255. [Google Scholar] [CrossRef]
  9. Berour, N.; Lacroix, D.; Boulet, P.; Jeandel, G. Radiative and Conductive Heat Transfer in a Nongrey Semitransparent Medium. Application to Fire Protection Curtains. J. Quant. Spectrosc. Radiat. Transf. 2004, 86, 9–30. [Google Scholar] [CrossRef]
  10. Collin, A.; Lechene, S.; Boulet, P.; Parent, G. Water Mist and Radiation Interactions: Application to a Water Curtain Used as a Radiative Shield. Numer. Heat Transf. Part A 2010, 57, 537–553. [Google Scholar] [CrossRef]
  11. Dembele, S.; Wen, J.X. Analysis of the Screening of Hydrogen Flares and Flames Thermal Radiation with Water Sprays. Int. J. Hydrogen Energy 2014, 39, 6146–6159. [Google Scholar] [CrossRef]
  12. Buchlin, J.M. Mitigation of Industrial Hazards by Water Spray Curtains. J. Loss Prev. Process Ind. 2017, 50, 91–100. [Google Scholar] [CrossRef]
  13. Chang, H.P.; Ho, S.P.; Chen, C.S.; Chien, S.W. Performance of a Spray System in a Full-Scale Tunnel Fire Test. Tunn. Undergr. Space Technol. 2017, 67, 167–174. [Google Scholar] [CrossRef]
  14. Blanchard, E.; Boulet, P.; Fromy, P.; Desanghere, S.; Carlotti, P.; Vantelon, J.P.; Garo, J.P. Experimental and Numerical Study of the Interaction between Water Mist and Fire in an Intermediate Test Tunnel. Fire Technol. 2013, 50, 565–587. [Google Scholar] [CrossRef]
  15. Wang, Z.; Wang, X.; Huang, Y.; Tao, C.; Zhang, H. Experimental Study on Fire Smoke Control Using Water Mist Curtain in Channel. J. Hazard. Mater. 2018, 342, 231–241. [Google Scholar] [CrossRef]
  16. Dembele, S.; Wen, J.X.; Sacadura, J.-F. Experimental Study of Water Sprays for the Attenuation of Fire Thermal Radiation. J. Heat Transf. 2000, 123, 534–543. [Google Scholar] [CrossRef]
  17. Sun, J.; Fang, Z.; Tang, Z.; Beji, T.; Merci, B. Experimental Study of the Effectiveness of a Water System in Blocking Fire-Induced Smoke and Heat in Reduced-Scale Tunnel Tests. Tunn. Undergr. Space Technol. 2016, 56, 34–44. [Google Scholar] [CrossRef]
  18. Amano, R.; Izushi, Y.; Kurioka, H.; Kuwana, H.; Tsuruda, T.; Suzuki, T.; Ogawa, Y. Water Screen Fire Disaster Prevention System. Res. Prod. 2005, 57, 365–369. [Google Scholar] [CrossRef]
  19. Li, Q.; Tang, Z.; Fang, Z.; Yuan, J.; Wang, J. Experimental Study of the Effectiveness of a Water Mist Segment System in Blocking Fire-Induced Smoke and Heat in Mid-Scale Tunnel Tests. Tunn. Undergr. Space Technol. 2019, 88, 237–249. [Google Scholar] [CrossRef]
  20. Mehaddi, R.; Collin, A.; Boulet, P.; Acem, Z.; Telassamou, J.; Becker, S.; Demeurie, F.; Morel, J.-Y. Use of a Water Mist for Smoke Confinement and Radiation Shielding in Case of Fire during Tunnel Construction. Int. J. Therm. Sci. 2020, 148, 106156. [Google Scholar] [CrossRef]
  21. Yang, P.; Shi, C.; Gong, Z.; Tan, X. Numerical Study on Water Curtain System for Fire Evacuation in a Long and Narrow Tunnel under Construction. Tunn. Undergr. Space Technol. 2019, 83, 195–219. [Google Scholar] [CrossRef]
  22. De Cachinho Cordeiro, I.M.; Liu, H.; Yuen, A.C.Y.; Chen, T.B.Y.; Li, A.; Wang, C.; Cao, R.; Yeoh, G.H. On the Large Eddy Simulation Modelling of Water Suppression Systems Droplet Impact and Coverage Area. Fire 2022, 5, 165. [Google Scholar] [CrossRef]
  23. Wang, J.; Gao, D.; Kong, X.; Jiang, X.; Lu, K. Water Spray Effects on Fire Smoke Temperature Distribution beneath a Symmetrical V-Shaped Tunnel Ceiling. Case Stud. Therm. Eng. 2023, 51, 103568. [Google Scholar] [CrossRef]
  24. Mahmud, H.M.I.; Moinuddin, K.A.M.; Thorpe, G.R. Experimental and Numerical Study of High-Pressure Water-Mist Nozzle Sprays. Fire Saf. J. 2016, 81, 109–117. [Google Scholar] [CrossRef]
  25. Chelliah, H.K. Flame Inhibition/Suppression by Water Mist: Droplet Size/Surface Area, Flame Structure, and Flow Residence Time Effects. Proc. Combust. Inst. 2007, 31, 2711–2719. [Google Scholar] [CrossRef]
  26. Zhao, S.; Jin, J.Y.; Han, P.; Yang, X.; Du, X.; Hu, Q. Direct and Indirect Measurement of Liquid Film Thickness by Common Optical Methods. Rev. Sci. Instrum. 2025, 96, 081501. [Google Scholar] [CrossRef]
  27. Jia, D.; Li, C.; Liu, J.; Zhang, Y.; Yang, M.; Gao, T.; Said, Z.; Sharma, S. Prediction Model of Volume Average Diameter and Analysis of Atomization Characteristics in Electrostatic Atomization Minimum Quantity Lubrication. Friction 2023, 11, 2107–2131. [Google Scholar] [CrossRef]
  28. Wu, Z.; Liu, C.; Li, C.; Song, W.; Zhang, S. Establishment of Fog Droplet Distribution Model and Study on Canopy Deposition Uniformity. Phys. Fluids 2024, 36, 077113. [Google Scholar] [CrossRef]
  29. Moinuddin, K.; Mahmud, H.M.I.; Joseph, P.; Gamble, G.; Suendermann, B.; Wilkinson, C.; Bossard, J. Experimental and Numerical Studies on the Efficacy of Water Mist to Suppress Hydrocarbon Fires in Enclosures. Fire 2024, 7, 83. [Google Scholar] [CrossRef]
  30. Dasgotra, A.; Rangarajan, G.; Tauseef, S.M. CFD-Based Study and Analysis on the Effectiveness of Water Mist in Interacting Pool Fire Suppression. Process Saf. Environ. Prot. 2021, 152, 614–629. [Google Scholar] [CrossRef]
  31. Patterson, N.M. Assessing the Feasibility of Reducing the Grid Resolution in FDS Field Modelling; School of Engineering, University of Canterbury: Christchurch, New Zealand, 2002; ISSN 1173-5996. [Google Scholar]
  32. Seike, M.; Kawabata, N.; Hasegawa, M. Experiments of Evacuation Speed in Smoke-Filled Tunnel. Tunn. Undergr. Space Technol. 2016, 53, 61–67. [Google Scholar] [CrossRef]
  33. Wang, Z.; Jiang, X.; Wang, Q.; Wang, B. Numerical Investigation of Water Curtain for Smoke Blocking and Heat Insulation in Urban Underground Road. Therm. Sci. Eng. Prog. 2022, 35, 101468. [Google Scholar] [CrossRef]
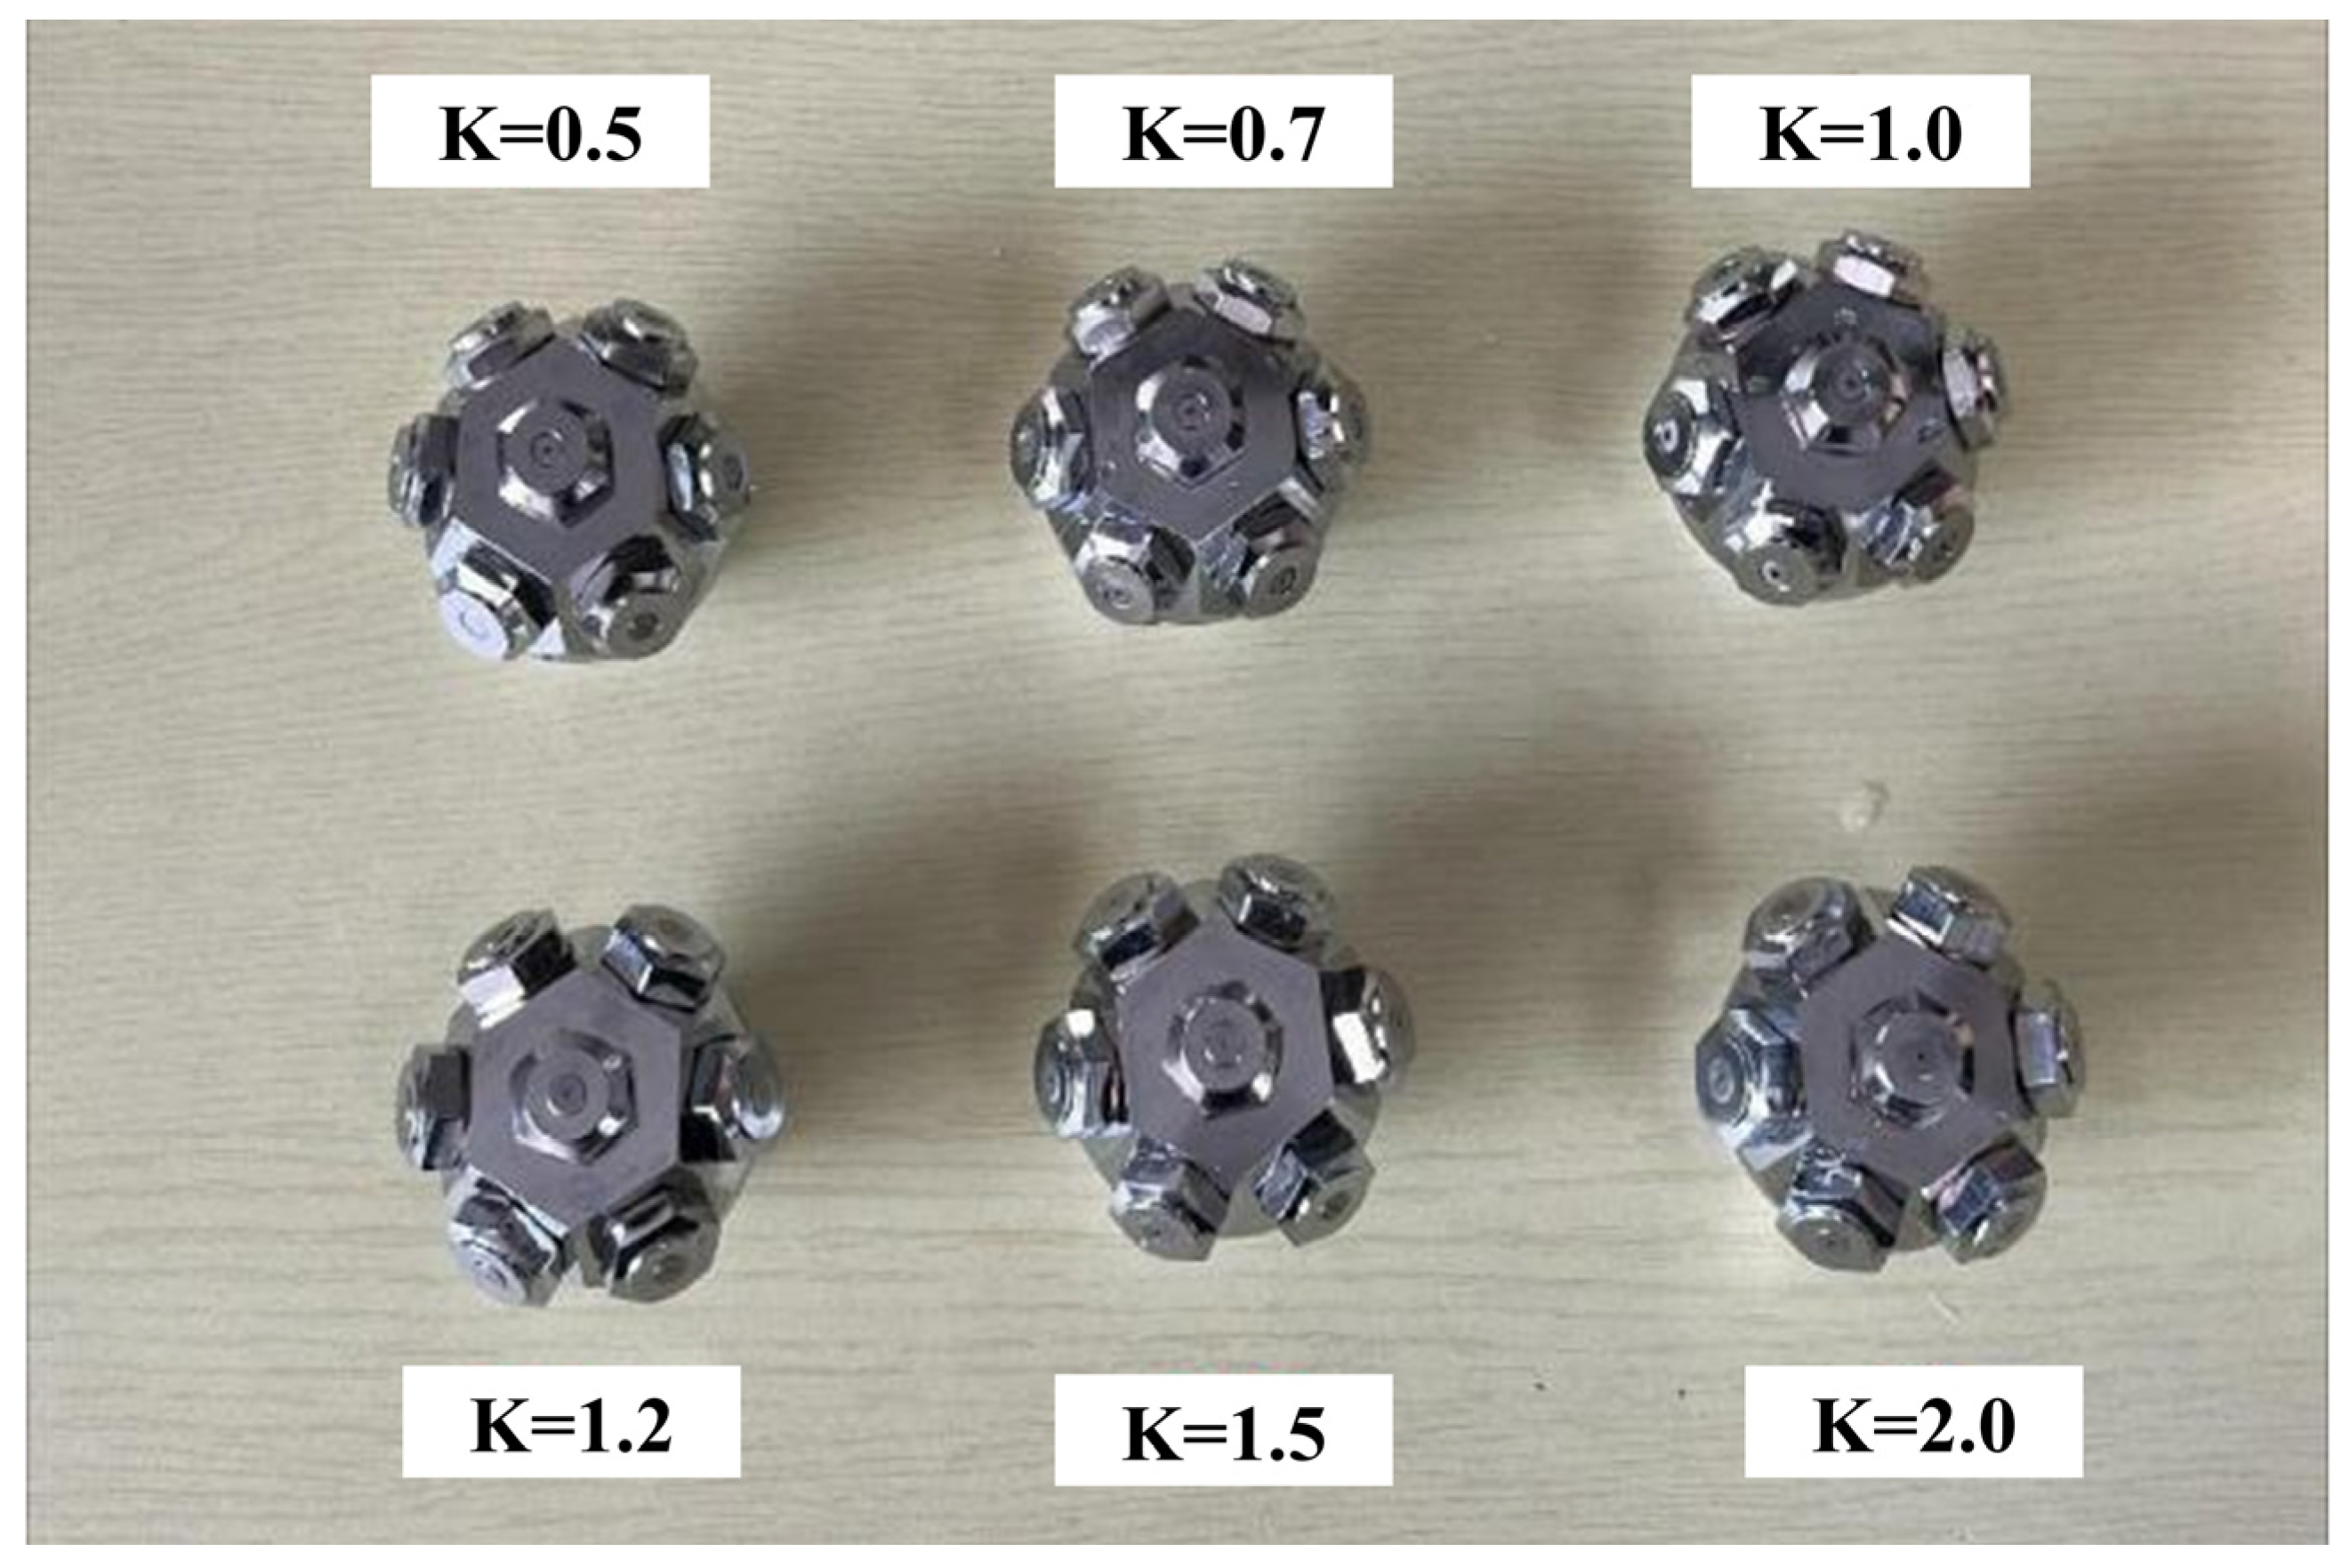
Figure 1. Actual images of water mist sprinklers with different flow coefficients.
Fire 08 00401 g001
Figure 2. Water mist sprinkler spray characteristics testing platform.
Fire 08 00401 g002
Figure 3. R-R interval distribution curves at different flow coefficients.
Fire 08 00401 g003
Figure 4. Average droplet size distribution diagram at different flow coefficients.
Fire 08 00401 g004
Figure 5. Schematic diagram of smoke and heat isolation test for water mist sprinkler heads.
Fire 08 00401 g005
Figure 6. Thermocouple layout diagram.
Fire 08 00401 g006
Figure 7. Mass loss rate curve for n-heptane (500 mL).
Fire 08 00401 g007
Figure 8. Small-scale laboratory bench model.
Fire 08 00401 g008
Figure 9. Model sampling point setup. (a) Thermocouple installation diagram. (b) Slice settings diagram.
Fire 08 00401 g009
Figure 10. Experimental and simulated comparison of mist field generation processes for water mist sprinkler.
Fire 08 00401 g010
Figure 11. Comparison of smoke spread patterns.
Fire 08 00401 g011
Figure 12. Temperature comparison between the smoke-exposed side and the non-smoke-exposed side.
Fire 08 00401 g012
Figure 13. Visibility distance comparison.
Fire 08 00401 g013
Figure 14. Comparison of flue gas spread patterns at different flow coefficients.
Fire 08 00401 g014
Figure 15. Temperature changes at measurement points under different flow coefficients.
Fire 08 00401 g015
Figure 16. Visibility distance comparison at different flow coefficients.
Fire 08 00401 g016
Table 1. Mist droplet size with different flow coefficients.
Flow CoefficientParticle Size (μm)Fitting Error
D10D32D50D90
0.530.63145.31950.41769.3020.096
0.725.26538.95844.98765.0640.153
1.032.62339.60041.30348.1410.055
1.226.94234.46426.94226.9420.072
1.528.98537.36639.27547.8210.054
2.032.35941.13143.48952.6720.072
Table 2. Grid size settings.
GridGrid AreaUnit Grid SizeNumber of Grids
xyz
Mesh1−1.0~0.1−0.5~1.50~20.470,000
Mesh20.1~2.5−0.5~1.50~20.21100
Table 3. Sprinkler pattern characteristics simulation parameter settings.
Work Pressure (Mpa)Flow Coefficient (K)Droplet Size
(μm)
Atomization Cone Angle (°)Initial Velocity of the Droplet (m/s)
81.039.60010030
1.234.464113
1.537.366136
Disclaimer/Publisher’s Note: The statements, opinions and data contained in all publications are solely those of the individual author(s) and contributor(s) and not of MDPI and/or the editor(s). MDPI and/or the editor(s) disclaim responsibility for any injury to people or property resulting from any ideas, methods, instructions or products referred to in the content.