Article

Improved Smoke Exhaust Efficiency Through Modification of Ventilation Fan Orientation in Underground Parking Lots

Department of Safety Engineering, Seoul National University of Science and Technology, Seoul 01811, Republic of Korea
*
Author to whom correspondence should be addressed.
Fire 2025, 8(10), 398; https://doi.org/10.3390/fire8100398 (registering DOI)
Submission received: 8 September 2025 / Revised: 1 October 2025 / Accepted: 10 October 2025 / Published: 13 October 2025

Abstract

With the enlargement of underground parking lots, the risk of massive smoke and toxic gases generated during a fire will be increased, resulting in significant casualties, property damage, and difficulties in firefighting operations. To address these issues, installation of ventilation fans and inducer fans together has been proposed to extract smoke and hazardous gases more efficiently to the outside. However, the disturbance of ventilation caused by simultaneous operation of inducer fans and ventilation fans limits smoke extraction efficiency. In some worst cases, smoke disturbance may even lead to further smoke spread. Therefore, this study aims to suggest an efficient smoke extraction strategy for underground parking lots equipped with ventilation and inducer fans by optimizing the orientation of ventilation fans in the event of vehicle fires. Computational fluid dynamics-based simulation results showed that installing ventilation fan intakes and exhausts perpendicularly (PE, 90° apart) was more effective in controlling smoke than installing them in parallel (PA, horizontally facing each other). In the case of PE, the smoke stagnation area around the intakes decreased markedly from 38.18% to 3.68%. Although the smoke area near the exhausts increased in the PE configuration (53.66%) compared with the PA configuration (26.13%), this indicates that smoke was being effectively transported from the intakes to the exhausts. Furthermore, the overall smoke distribution across the entire space decreased by 4.5% under the PE setup compared with the PA setup. As the intake and exhaust flow rates of the fans increased, the efficiency of smoke removal was enhanced under the PE configuration. Consequently, in environments equipped with both ventilation and inducer fans with given conditions, perpendicular installation of fan intakes and exhausts is more efficient. These results are expected to provide practical design guidelines for ensuring effective smoke extraction in underground parking facilities.

1. Introduction

Urban architecture is increasingly dominated by high-rise, multi-functional complexes that integrate commercial spaces, residential units, and underground parking facilities. Due to high population density and limited land availability, these buildings often require large underground parking structures. In some cases, more than seven basement levels are needed to meet parking demand. Such deep underground spaces pose severe challenges during vehicle fires, making evacuation for occupants and access for firefighters extremely difficult. The limited operating duration of self-contained breathing apparatuses, typically less than 10 min in practice, further constrains firefighting operations in these environments [1,2]. Accordingly, effective and rapid smoke removal in deep underground parking lots is essential for safeguarding occupant evacuation.
However, vehicle fires remain a frequent and growing risk. Between 2009 and 2016, over 200,000 vehicle fires were reported annually in the United States and China [3]. With the increasing use of plastics in vehicles, the fire load and toxicity of smoke continue to rise [4]. Most vehicle fires are triggered by electrical faults [5,6,7,8], and when such fires occur underground, the resulting smoke severely hinders evacuation and obstructs firefighter entry. Moreover, according to the Society of Fire Protection Engineers (SFPE) Handbook, gasoline vehicle fires can reach peak heat release rates (HRRs) exceeding 8500 kW—more than twice the HRR of typical stall fires in commercial facilities [9,10]. Such extreme heat can elevate temperature to over 1100 °C and potentially lead to additional smoke generation by burning nearby vehicles and structures [10,11].
Given these risks, smoke management is very critical in underground parking lots. Smoke not only contains toxic gases but also carries high thermal energy that accelerates fire spread [12]. Accumulation of smoke in deep underground facilities quickly reduces visibility, blocks evacuation routes, and increases the likelihood of casualties. Previous research has investigated various strategies for smoke control, including sprinklers, compartmentalization, and the use of ventilation and inducer fans, as summarized in Table 1 [13,14,15,16,17,18,19,20,21]. While sprinklers can delay fire growth, their effectiveness in large-scale underground fires is limited and uncertain. Compartmentalization may restrict smoke propagation but can also accelerate smoke descent in confined spaces, increasing the risk of spread. Fan-based approaches are effective to extract smoke at the fire accidents in underground spaces. Jet inducer fans encourage the quick removal of smoke from tunnels and under parking lots [17,18,19,22,23]. The optimization of installation orientation and operating speed of inducer fans play an important role in defining smoke exhaust efficiency [18,23]. Additionally, the combination of ventilation fans, sprinklers, and inducer fans maximizes smoke exhaust efficiency for fires in underground parking lots [24]. As a result, the combination of inducer and ventilation fans has been widely accepted in underground parking lots to minimize the loss caused by fire.
However, the combination of inducer and ventilation fans has not been intensively studied. Since the improper operation of ventilation and inducer fans may disturb smoke flow or even cause reverse flow toward intakes, careful consideration of the direction and capacity of ventilation fans is required. Moreover, increased speed of inducer fans might disturb smoke extraction [17]. Although an inducer fan could enhance the smoke extraction in a limited area, it sometimes creates vortex turbulence and causes poor ventilation efficiency in a large area. Despite extensive studies, clear design guidelines remain lacking—particularly regarding the proper installation, orientation, and operational capacity of ventilation in deep underground parking lots with inducer fans. This gap creates significant uncertainty for engineers and designers tasked with ensuring smoke safety in such facilities. As previous studies have only been conducted considering a fixed condition of the ventilation fans, it is necessary to analyze the effect of ventilation fans’ condition on smoke extraction efficiency.
Therefore, this work investigates smoke movement under different fan configurations in deep underground parking lots. Using computational fluid dynamics (CFD)-based simulations, we analyze how fan intake and exhaust orientation influence airflow stability, and evaluate the effects of increased intake and exhaust capacity on smoke control performance. The findings provide evidence that perpendicular orientation of ventilation fan intakes and exhausts reduces turbulence and improves overall effectiveness compared to parallel layouts. We believe that the results are expected to contribute to the development of future design guidelines and performance standards for fire safety in deep underground parking environments.

2. Simulation and Methods

2.1. Geometry and Fire Model

The movement of smoke from vehicle fires is calculated based on the Fire Dynamics Simulator (FDS), developed by the Building and Fire Research Laboratory (BFRL) under the U.S. National Institute of Standards and Technology. FDS provides detailed insights into how smoke flows during fire events through the finite element method. As a result, it is one of the most widely used fire simulation programs. For better understanding of the visibility of occupants, PyroSim, which integrates FDS with Smokeview—a program specifically developed for visualizing simulation outputs—was also employed to analyze smoke flow in underground parking lots.
To describe the smoke flow during a fire with in an underground parking lot with a ventilation system, we used the following equations. Equation (1) represents an empirical correlation for the thickness of the smoke layer (lT) due to a ceiling jet, which describes the horizontal flow of hot combustion products that rise in the fire plume, impinge on the ceiling, and subsequently spread outward as a thin buoyancy-driven layer immediately beneath the ceiling surface. According to the Society of Fire Protection Engineers (SFPE) Handbook of Fire Protection Engineering, lT is defined as the ceiling height (H) where the gap between smoke temperature (T) and ambient temperature (T) decreases to 1/e (approximately 37%) of its maximum value. Based on this definition, lT is generally reported to be about 10–12% of H [25]. The correlations of lT, H, and radial distance to detector (r) are widely employed as empirical formulas in CFD simulations to predict smoke movement.
l T H = 0.112 1 exp 2.24 r H  
Through Equations (2) and (3), simplified correlations for predicting T and velocity of the smoke (U) were achieved. These correlations are widely applied in fire hazard analysis for a ceiling jet flow with an HRR of Q [25]. Furthermore, the correlations distinguish between the plume impingement region—where the vertical fire plume strikes the ceiling—and the radial region beneath the ceiling where the flow subsequently spreads outward. Thus, they enable the prediction of both the reduction in T with r and the corresponding variation in U. We continuously monitored the distribution of smoke controlled by T, U, and lT under different Q for 1000 s as shown in Figure 1, where the ventilation and inducer fans were operating.
T T = 16.9   Q 2 H 5 1 3 ,   ( r H   0.18 ) = 5.38   ( Q 2 H 5 ) 1 3 ( r / H ) 2 3 ,   ( r H > 0.18 )  
U = 0.947   Q H 1 3   ,   (   r H   0.15 ) = 0.197   ( Q / H ) 1 / 3 ( r / H ) 5 / 6   ,   ( r H > 0.15 )
Meanwhile, D*, serving as the basis for grid sensitivity analyses and mesh resolution decisions in the FDS simulation, can be expressed as an Equation (4) [26]. D* provides a more representative measure of the fire size than the physical diameter and is derived from Q and the thermophysical properties of the surrounding fluid (density (ρ), specific heat (Cp), gravitational acceleration (g), and T).
D * = ( Q ρ C P T g ) 2 5  
For FDS simulation, we set the grid size as 0.3 m × 0.3 m × 0.3 m, an appropriate resolution for examining airflow at the ventilation fan intakes and exhausts and for evaluating smoke movement. A smaller size of grid might achieve more accurate analysis, but the grid size used in this work was sufficiently small to precisely analyze the smoke distribution with small errors [27]. According to the FDS guidelines (NIST Special Publication 1019-5, Fire Dynamics Simulator (Version 5) User’s Guide, page 30) [28] and Verification and Validation of Selected Fire Models for Nuclear Power Plant Applications (NUREG-1824) [26], the recommended size of grid (dx) is determined by the characteristic fire diameter (D*). The desirable ratio between D* and dx (D*/dx) is 4–16 in the case of isotropic fire. Since we used a grid size of 0.3 m in the calculation, D*/dx was 7.5, within the desirable range, and the size of space we considered was sufficiently large to use a 0.3 m grid size [29]. Moreover, the result with a small grid size (0.15 m × 0.15 m × 0.15 m, not shown here) was similar to that with a 0.3 m × 0.3 m × 0.3 m grid, so we conducted all simulations with a 0.3 m × 0.3 m × 0.3 m grid considering the accuracy and calculation time.
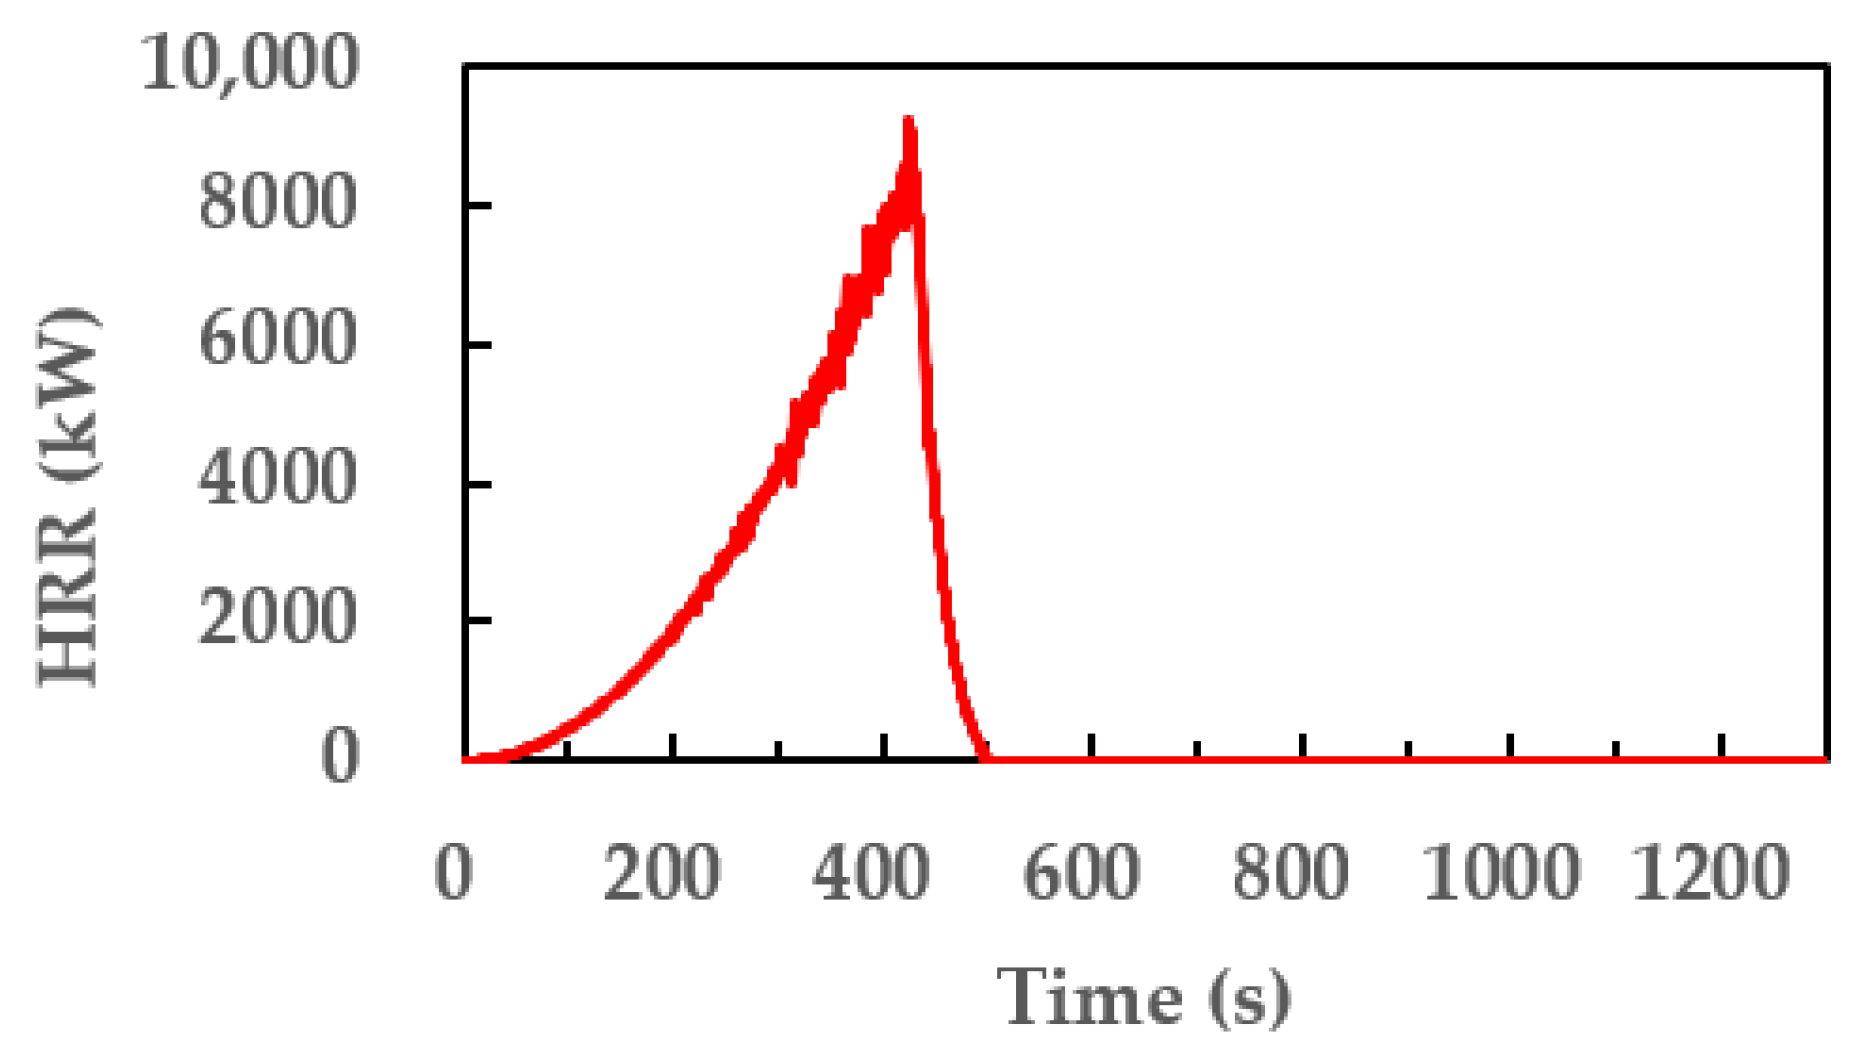
Regarding the materials of conventional combustion engine-based vehicles, it was assumed that two vehicles were burning simultaneously during the fire scenario, with polyurethane—commonly used as an interior material in vehicles—considered the primary combustible source of smoke [20]. Furthermore, we assumed that the amount of smoke from the two vehicles was mainly attributed to the polyurethane, similarly to the previous report [20]. The HRR of the vehicles during the simulation was determined by comparing values presented in the SFPE Handbook [9,25], as shown in Table 2 and Figure 1. While the HRR of electric vehicle fires tends to be slightly higher than that of gasoline vehicles, with a longer burning duration, no significant difference was observed in terms of peak HRR [30]. Therefore, in this study, an HRR of 8500 kW—corresponding to the simultaneous burning of two vehicles, as specified in the SFPE Handbook [25]—was adopted, and the grid sensitivity was set as 7.53 following previous studies [20,26,28,29]. The fire scenario was modeled under conditions similar to experimental data, with combustion rapidly being extinguished after the fire reached its target HRR. This assumption was made to enable comparison of the time required for smoke to be exhausted following fire suppression, which would be difficult to assess under continuous burning conditions. As shown in Figure 1, the HRR rose to 8500 kW and then quickly decayed after reaching the peak value. The fire location was assumed to be at the center of the parking lot, representing the most disadvantageous position for ventilation. In this study, the fire scenario did not account for fire spread to adjacent vehicles after approximately five minutes [31].
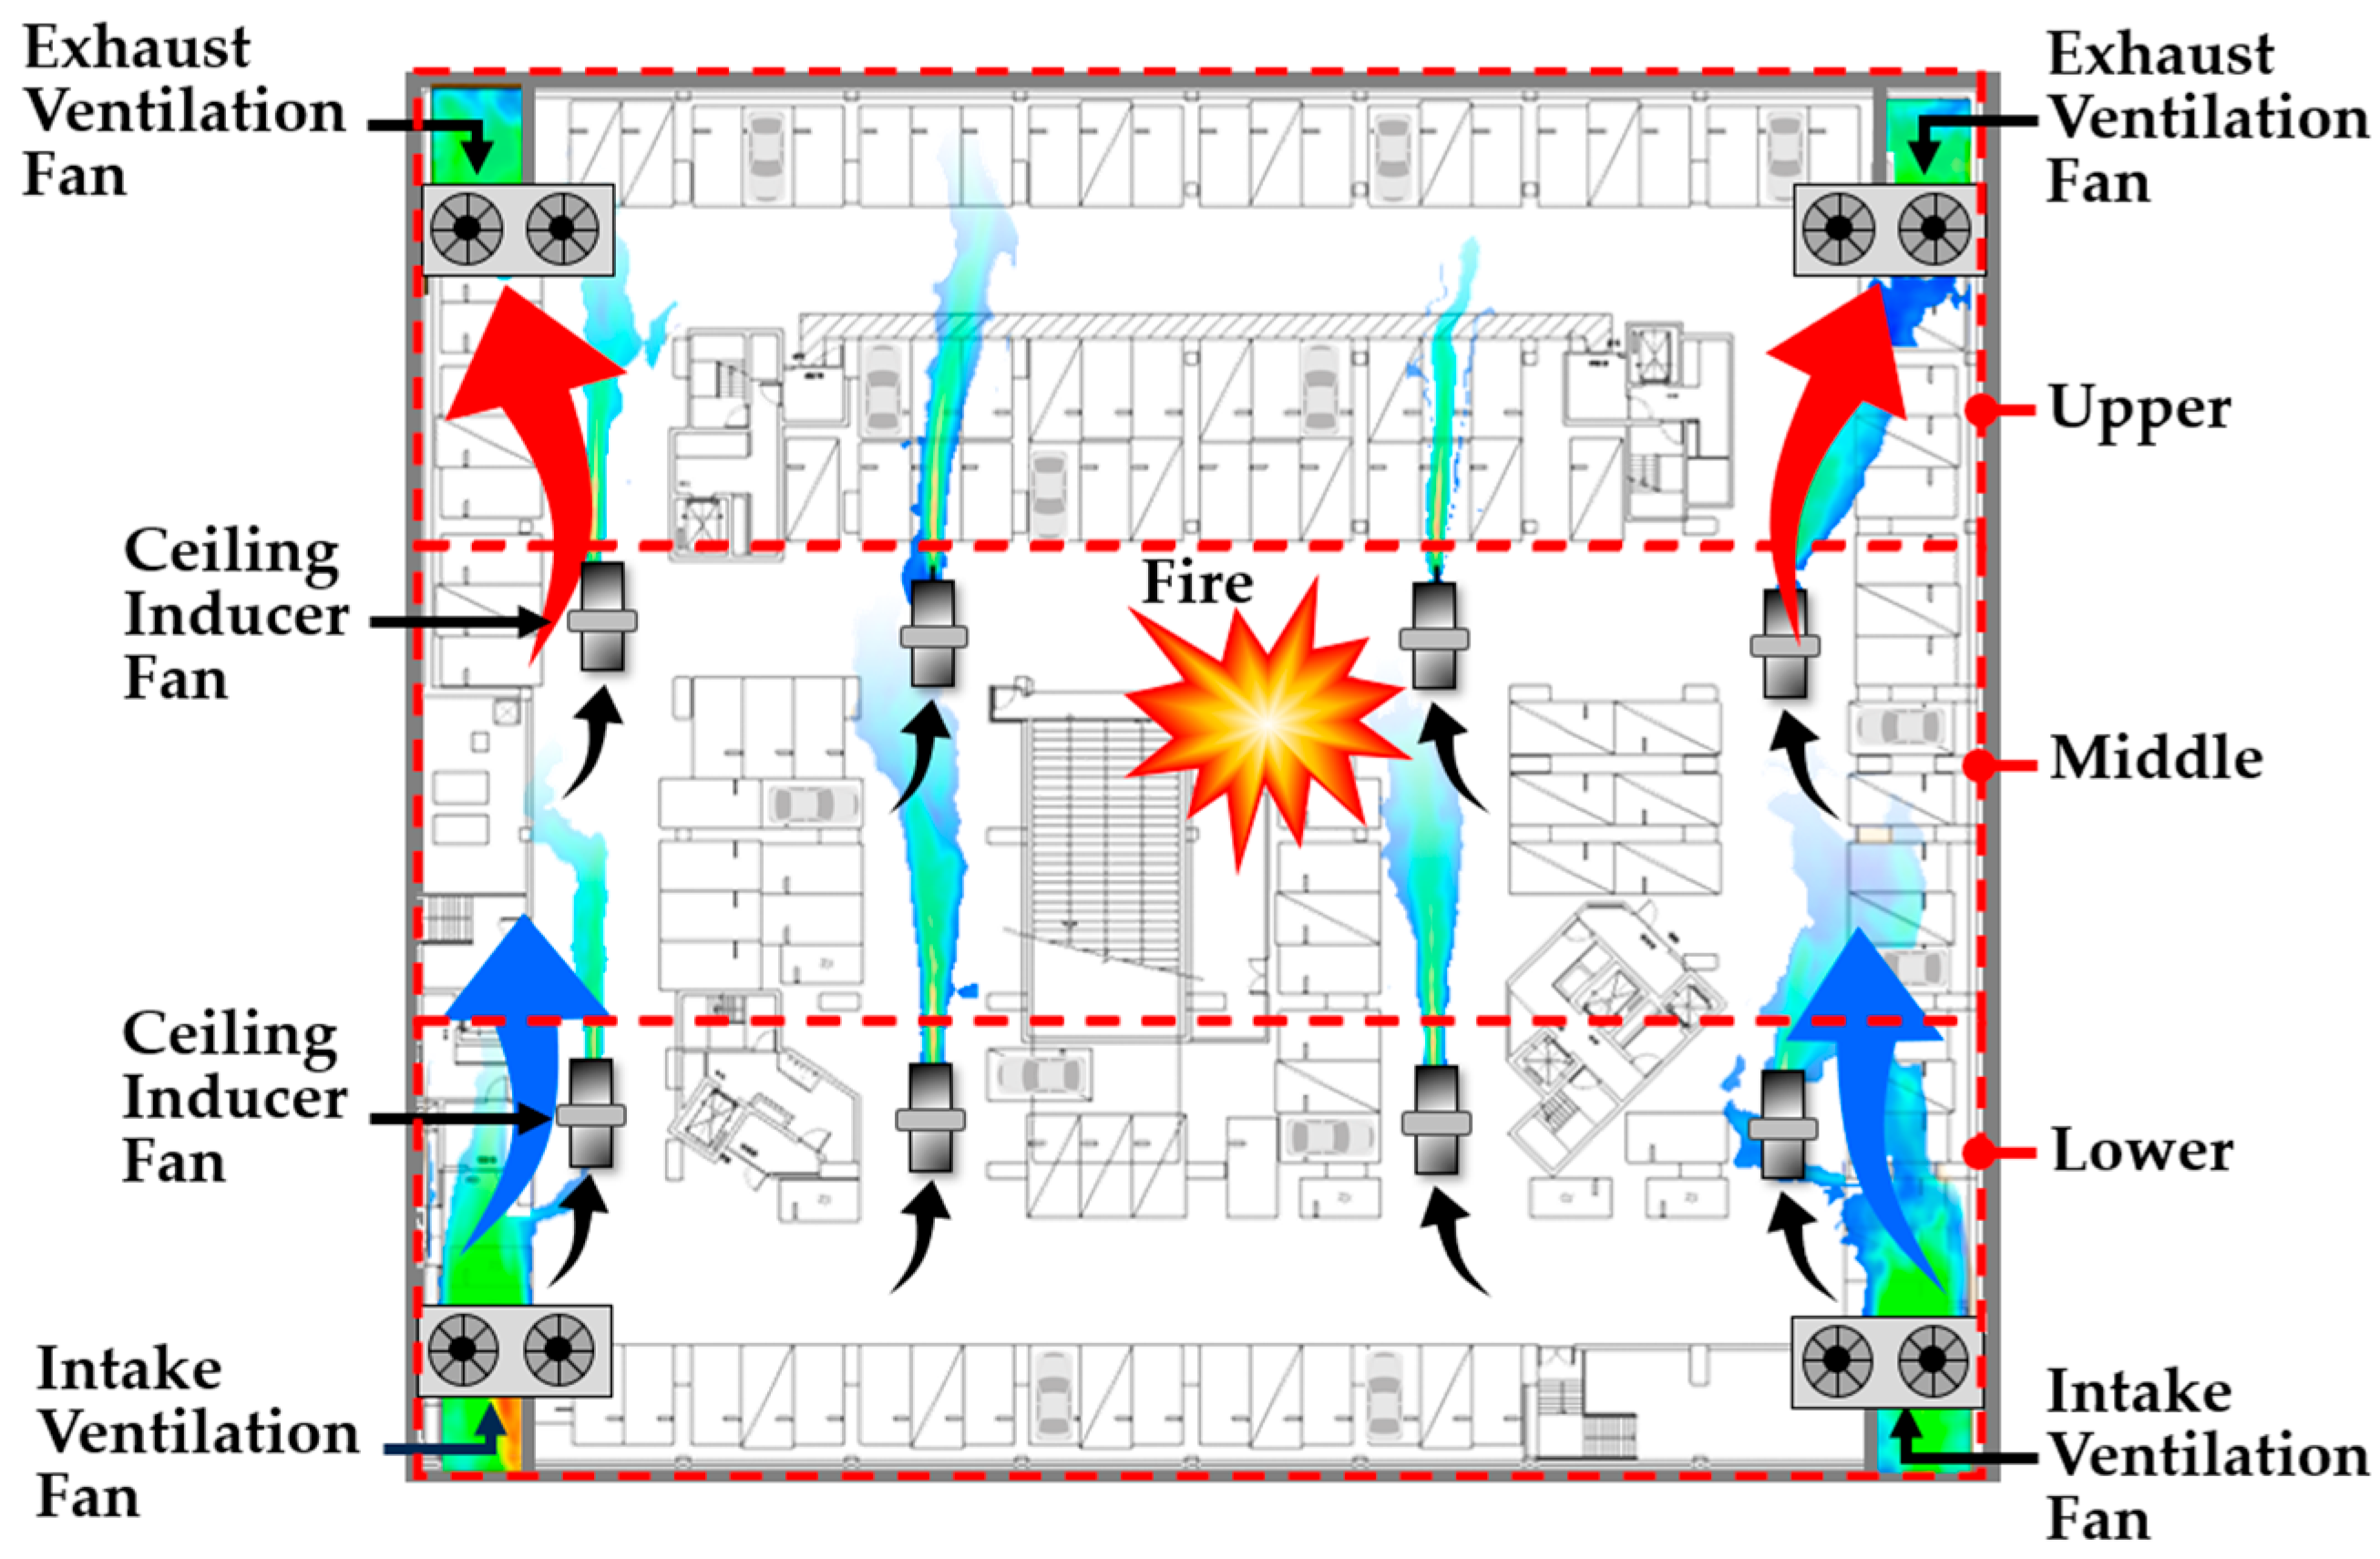
The simulation was conducted in a widely used model of a deep underground parking lot, as summarized in Table 2. The parking lot had a total floor area of 4700 m2 and a floor-to-ceiling height of 3.5 m, yielding a total volume of 16,450 m3. As illustrated in Figure 2, the parking lot included vertical connections to the ground at the left, right, upper, and lower central areas. Elevators and staircases were located at the center, enabling people to move to the ground level.

2.2. Ventilation Fan Configuration

For smoke extraction in the simulations, the ventilation capacity of the parking lot fans was determined according to the strictest regulatory standard among various national codes [32,33], namely the UK British Standards Institution (BSI), which prescribes 10 air changes per hour [34]. This criterion was selected with reference to comparative data on smoke exhaust ventilation rates and practical design guidelines [14]. The intake and exhaust flow rates of the inducer fans were fixed at 1 m3/s, reflecting the most commonly applied value in current practice. This constraint was necessary because excessive inducer airflow may contribute to reverse smoke spread due to the increased flow rate [35]. The inducer fans were positioned between the intake and exhaust fans to facilitate airflow during a fire event. The ventilation fan intakes and exhausts were assumed to be installed at opposite ends of the underground parking lot, as illustrated in Figure 2, with smoke measurement areas defined as upper (near exhaust fan), middle (fire source area), and lower (near intake fan), in accordance with commonly applied design rules.
As summarized in Table 3, two configurations of ventilation fans were analyzed: parallel (PA) and perpendicular (PE). In cases PA1 through PA3, the intakes and exhausts of ventilation fans were installed in parallel with the same horizontal direction to facilitate smoke flow, as shown in Figure 2. On the other hand, in cases PE1 through PE3, the intakes and exhausts of ventilation fans were installed in perpendicular directions, as shown in Figure 3 In addition, for each configuration, the ventilation capacity was increased incrementally to determine the optimal smoke exhaust conditions in the presence of inducer fans, depending on the orientation of the ventilation fan intakes and exhausts. The fan airflow rates were set to exhaust conditions of 10 air changes per hour (23 m3/s), 15 air changes per hour (34 m3/s, 1.5 times the regulation amount according to the BSI), and 20 air changes per hour (46 m3/s, twice the regulation amount according to the BSI). Under these conditions, the intake and exhaust capacities were gradually increased to evaluate the resulting smoke flow and the extent to which visibility could be maintained. To measure the smoke-covered areas and visibility of occupants accurately, quantitative analysis based on simulation results was performed using image analysis software (ImageJ version 1.54, National Institutes of Health, Bethesda, Maryland).
3. Results and Discussion

3.1. Smoke Distribution and Visibility with Parallel Installation of Intake and Exhaust Fans

As illustrated in Figure 1, this study simulated fire conditions in which the heat release rate (HRR) reached its peak at 400 s and the fire was extinguished at 500 s. At 400 s, the smoke layer had already developed significantly, making it difficult to clearly observe the effectiveness of smoke flow. In contrast, at 200 s, stratification of the smoke layer was distinctly formed, allowing the smoke movement from the intake to the exhaust to be more explicitly identified. Therefore, 200 s was selected as the most appropriate time point for evaluating the performance of the ventilation fans, which represents the primary objective of this study.
Smoke distribution and visibility of occupants were assessed at 200 s after the fire, where smoke flow was most clearly observed. The smoke distributions for cases PA1 through PA3 are shown in Figure 4, and the distribution levels in the upper, middle, and lower zones of the underground parking lot are summarized in Table 4. Figure 4 shows that in all PA cases, a large smoke mass remains near the lower vents at 200 s.
Analysis of images extracted from the three cases, in which smoke (including blackened areas) was classified into upper (exhaust), middle (fire zone), and lower zones (intake), indicated that after ignition, smoke tended to migrate downward toward the intake region and remain there. This phenomenon occurred because the intake fan pressurized air directly toward the upper exhaust, thereby discharging fresh air rather than transporting smoke, which caused smoke to stagnate in the lower (intake) zone instead of moving upward toward the exhaust.
When analyzed by dividing the zones into upper and lower regions, the area covered by smoke in the upper zone showed a decreasing trend as the intake and exhaust capacities increased, from 29.76% to 25.17% and further to 23.47% (see Figure 5 and Table 4). In contrast, smoke in the lower zone increased markedly, from 28.91% (PA1) to 44.37% (PA3), as the airflow rates of the intake and exhaust fans increased. These results indicate that merely increasing the intake and exhaust capacities is insufficient to achieve the proper smoke control condition of lower-level intake and upper-level exhaust. Although greater airflow effectively removed smoke near the exhaust (upper zone), smoke generated in the central fire region continued to stagnate in the lower zone without being transported upward toward the exhaust. The middle zone, corresponding to the fire source itself, consistently exhibited the highest smoke concentration regardless of the airflow rate, since combustion was continuously occurring in this region.
Smoke stagnation in the lower region prevented effective exhaust, and as a result, the overall smoke-covered area progressively increased from PA1 to PA3. This indicates that when the intake and exhaust fans are installed parallel facing each other, the air discharged from the intake fan only pushes away smoke in limited regions where the intake and exhaust directly oppose each other, while failing to achieve effective smoke control across the entire space. Furthermore, because overall pressure was not adequately formed at the lower intake, smoke that should have remained in the upper region instead diffused downward due to turbulence, resulting in reverse flow. Consequently, the smoke-covered area was considerably larger in the middle (47.27–50.36%) and lower (28.91–44.37%) regions compared to the upper (23.14–29.76%) region, as summarized in Table 4 and illustrated in Figure 5. Therefore, simply increasing intake and exhaust capacities did not improve smoke exhaust performance in the PA cases. In cases PA2 and PA3, the smoke-covered area in the lower regions increased despite higher ventilation speeds compared to PA1, providing direct evidence of the poor performance of the PA ventilation system under the given conditions.
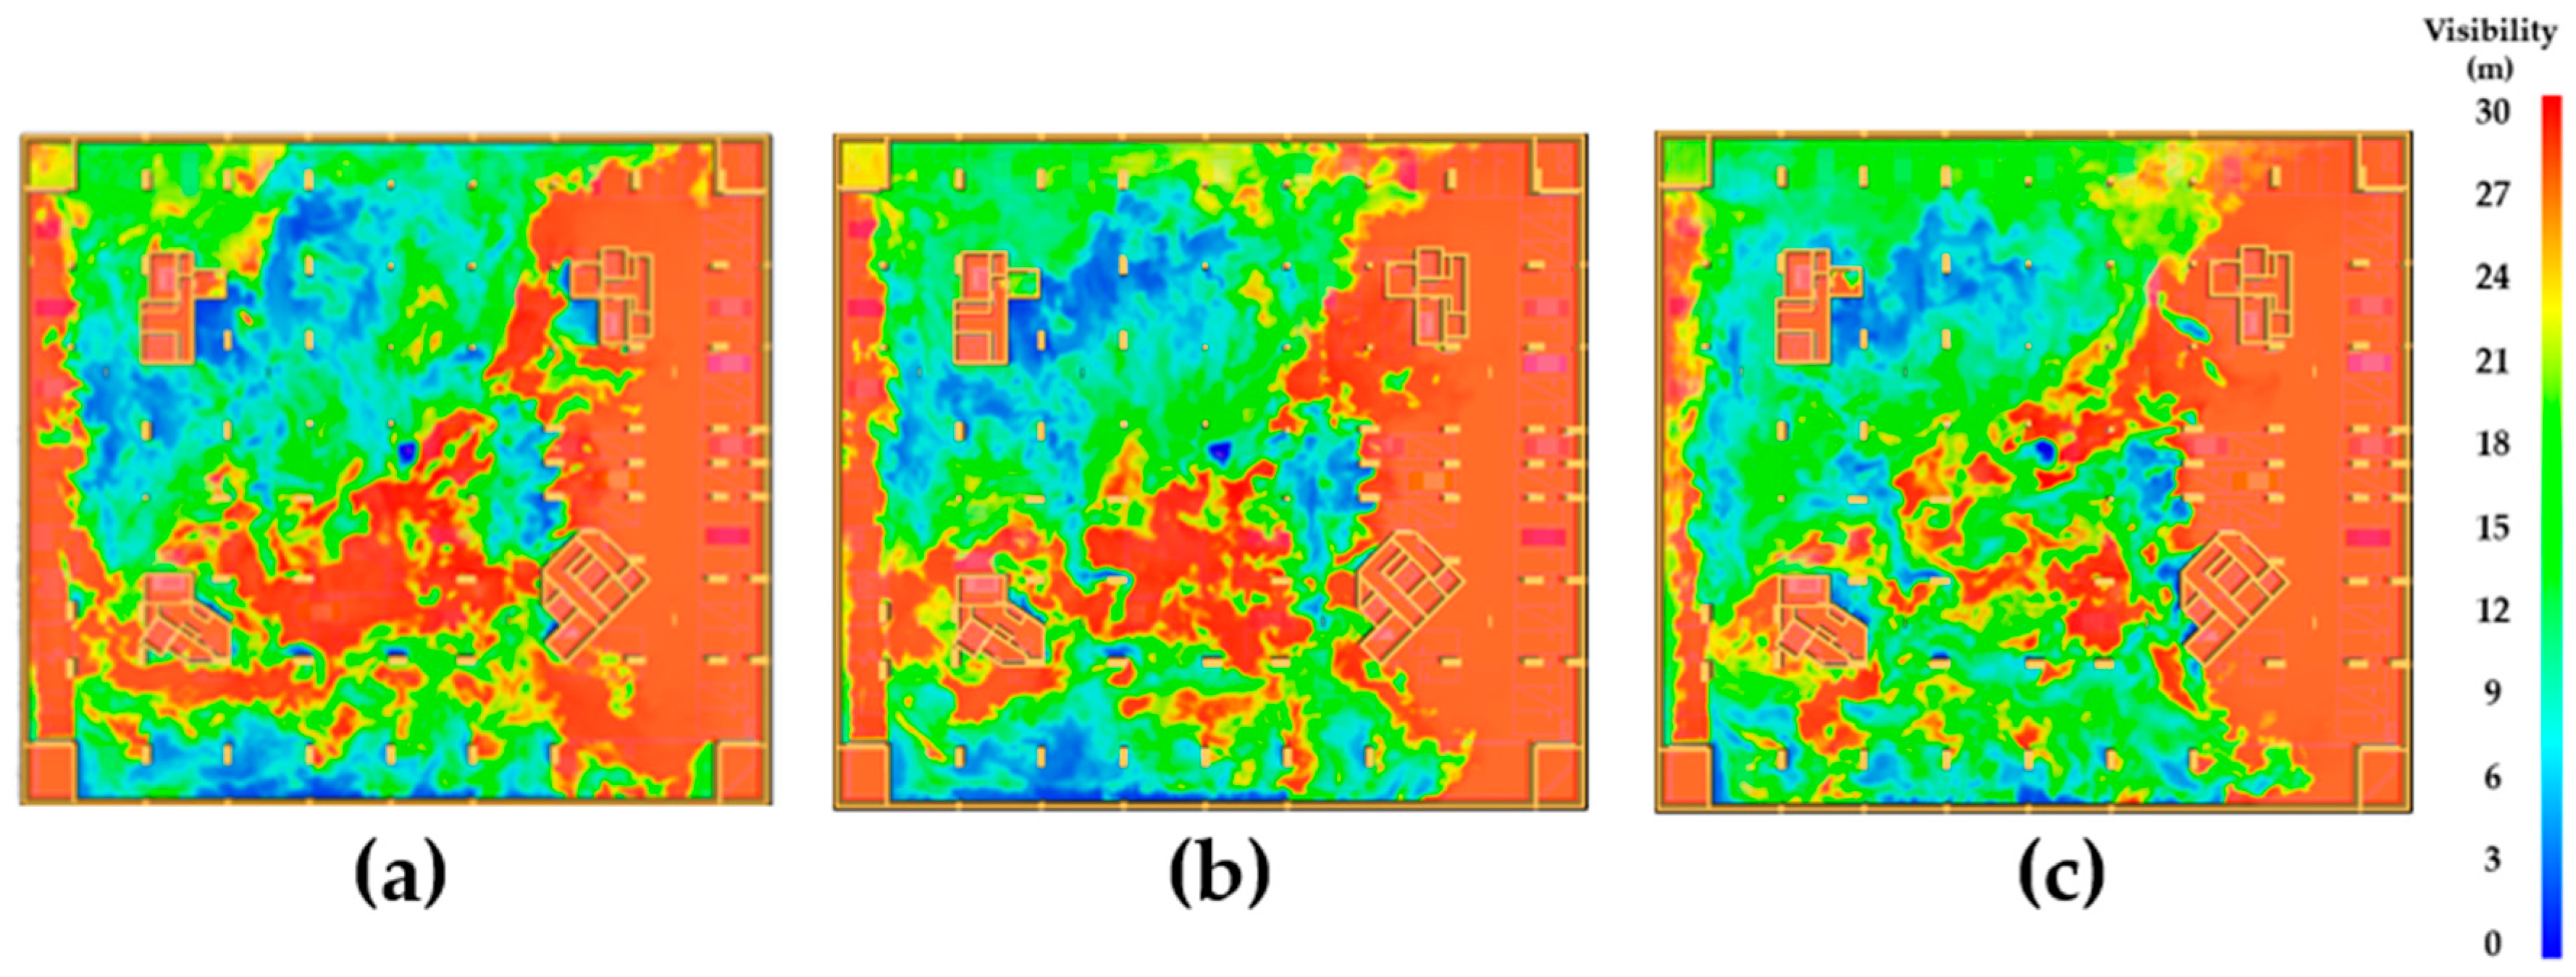
Visibility analysis for evacuees yielded results consistent with the smoke distribution analysis. Figure 6 presents the distribution of evacuee visibility expressed by colors: blue represents areas with visibility less than 5 m, green indicates visibility between 5–10 m, and red corresponds to visibility greater than 30 m, which signifies highly favorable conditions. According to the NFPA regulation, visibility greater than 30 m is required to escape from a closed space without any obscurity under fire conditions [33]. On the other hand, low visibility, especially below 5 m, hinders evacuees from recognizing the situation and finding the emergency exit route. The distribution of these visibility zones across the upper, middle, and lower regions is summarized in Table 5, Table 6 and Table 7.
The proportion of blue zones (visibility ≤ 5 m), which are critical for evacuees, was nearly uniform across the entire area and showed a slight decrease from PA1 (10 cycles) to PA3 (20 cycles). Similarly, the green zones (visibility 5–10 m) were evenly distributed throughout the regions. This distribution pattern indicates that smoke remained accumulated across the entire underground parking lot. In contrast, the proportion of red zones (visibility > 30 m) in the upper regions was lower than in the middle and lower regions. Although the operation of the ventilation fans improved evacuee visibility along both sides of the parallel walls, their effectiveness was substantially limited in the central areas of the parking lot. Zones where evacuee visibility was maintained were primarily located in the middle and lower regions as well as along the side walls, and this tendency persisted regardless of increases in fan capacity, highlighting a critical risk for evacuees situated in the central areas. Consistent with the earlier smoke analysis, this demonstrates that the ventilation fans in the parallel configuration caused smoke to spread across the upper and lower regions without being efficiently exhausted.
This suggests that external air supplied from the lower intakes ventilated the interior of the parking lot but was ineffective in removing smoke uniformly, instead clearing only localized regions in the case of PA. Moreover, increasing airflow capacity did not improve smoke removal but rather intensified turbulence, causing smoke to reverse-flow toward the intake side. Consequently, even from a visibility perspective, the PA configuration of intake and exhaust fans demonstrated that airflow disturbance occurred regardless of capacity, thereby maintaining significant risks to occupants within the underground parking lot.

3.2. Smoke Distribution and Visibility with Perpendicular Installation of Intake and Exhaust Fans (PE1–PE3)

To compare the effect of ventilation fan orientation, we conducted same calculations under PE conditions, where the ventilation fan intakes and exhausts were installed perpendicularly facing each other, and their operation was simulated to examine smoke flow (see Figure 3). The airflow conditions for intake and exhaust were set identically to those used in PA1–PA3, in order to directly compare the effects of intake and exhaust orientation. The smoke distributions for PE1 through PE3 are presented in Figure 7 and summarized in Table 8.
At 200 s after the fire ignition, the PE configuration was more efficient at removing the smoke from the underground parking lot. Images extracted from three regions (upper, middle, and lower) are analyzed in Figure 8, with smoke (blackened areas) quantitatively measured using image analysis summarized in Table 8. The results showed that smoke gradually migrated upward after ignition and was exhausted through the upper exhausts. Compared with the PA configuration, the PE installation exhibited more efficient smoke removal. This was because the intake fans at the lower level induced airflow that created positive pressure throughout the lower zone, while the exhaust fans at the upper level formed negative pressure in the upper zone, thereby transporting smoke upward from the lower intakes to the upper exhausts.
In particular, smoke concentration in the upper region accounted for more than 50% on average, while in the lower (intake) region it remained below 7%, as shown in Figure 8. Moreover, as intake and exhaust capacities increased, the smoke-covered area at the lower intakes decreased significantly—from 6.85% in PE1 to 2.66% in PE2, and further to 1.52% in PE3. This confirms that smoke was being effectively driven upward due to the pressure differential created by the intake and exhaust fans. Unlike the PA1–PA3 cases, where smoke stagnated at the lower zone, the PE configuration exhibited very low smoke concentrations in the intake region. These results demonstrate that under the PE configuration, the intended smoke control condition—lower intake and upper exhaust—was operating effectively.
The overall smoke-covered area showed a significant decreasing trend as the intake and exhaust flow rates increased from 10 (PE1) to 20 cycles per hour (PE3). This result indicates that when the ventilation fan intakes and exhausts are installed perpendicularly facing each other, the airflow discharged from the intakes effectively pushes smoke upward toward the exhaust fans. Even in environments equipped with inducer fans, positive pressure was generated at the lower intakes, allowing smoke to be efficiently exhausted through the upper exhausts by the action of the fans.
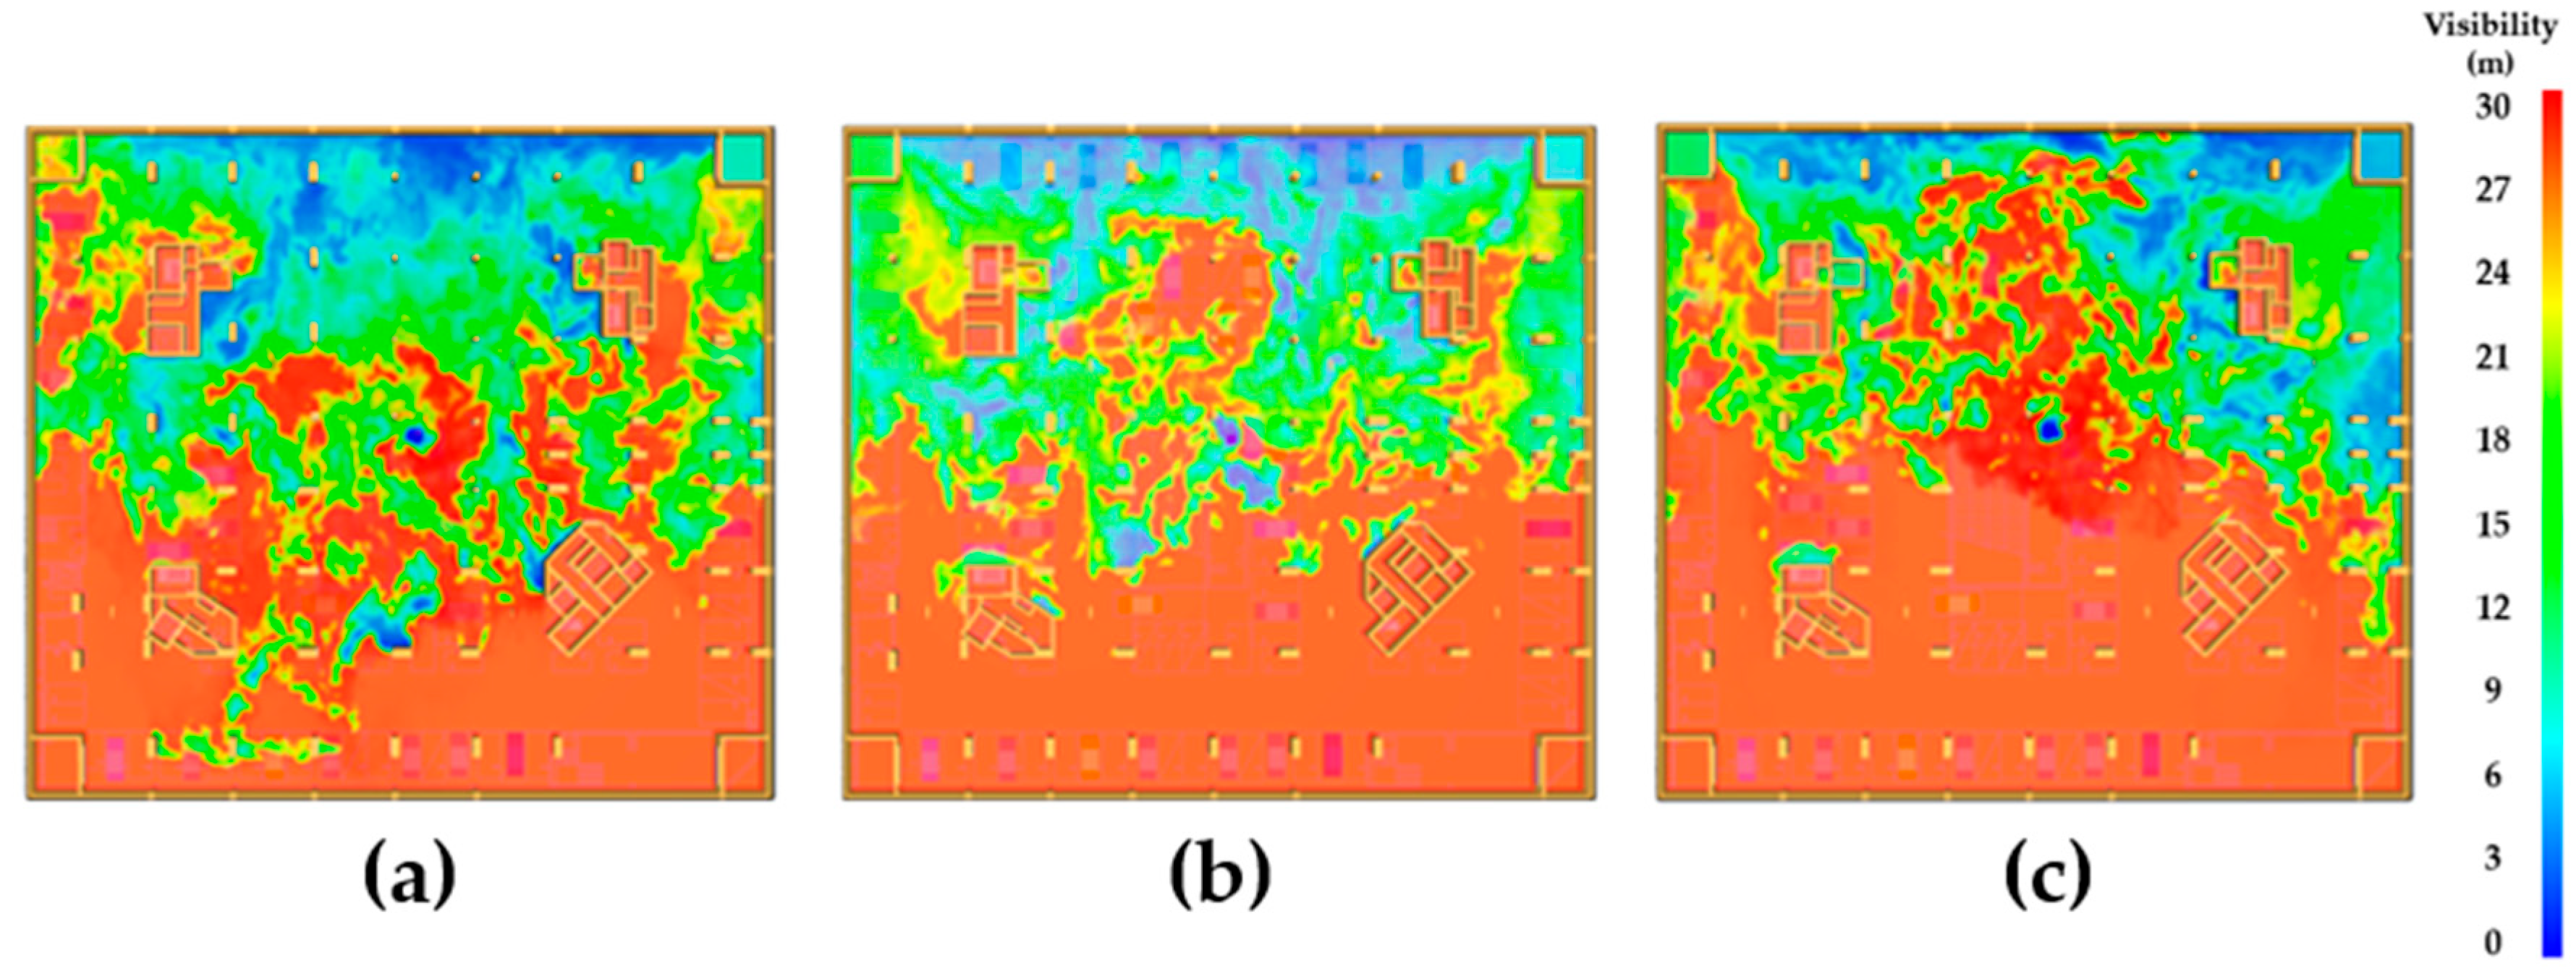
The analysis of evacuee visibility further demonstrated that the PE configuration provided superior performance compared with the PA configuration, as shown in Figure 9 and summarized in the Table 9, Table 10 and Table 11. Figure 9 illustrates the visibility distribution at 200 s, quantitatively analyzed for the upper (exhaust), middle (fire origin), and lower (intake) zones. Unlike the PA cases, the proportion of blue zones (visibility ≤ 5 m) in PE cases was concentrated primarily near exhaust fans, and this proportion did not change substantially from PE1 (10 cycles) to PE3 (20 cycles). This is mainly attributed to smoke being exhausted through the upper exhausts, causing localized reductions in visibility near the exhaust side. Green zones (visibility 5–10 m) were also concentrated in the upper region and showed a decreasing trend as intake and exhaust capacities increased. Consistent with the smoke distribution results, the concentration of both blue (≤5 m) and green (5–10 m) zones in the upper region indicates that smoke was being effectively transported from the lower intakes to the upper exhausts under the PE configuration. Conversely, red zones (visibility ≥ 30 m) expanded across larger portions of the parking lot as smoke was removed. In all PE cases, the lower regions were dominated by red zones, confirming that the PE installation of ventilation fans offers significant advantages in maintaining favorable evacuation visibility in underground parking fire scenarios compared with the PE configuration. Therefore, under the PE configuration, increases in intake and exhaust capacity reduced the influence of inducer fans and consistently improved visibility conditions.

3.3. Time to Reach Visibility Limits of 5 m and 10 m

Based on the above simulation results, the times at which visibility decreased to 5 m and 10 m, directly related to the possible evacuation of occupants, were compared for all cases in both the lower and upper regions of the underground parking lot. As shown in Figure 10, analysis of visibility near the lower intake fans in the cases of PA1–PA3, the maximum time to reach 10 m visibility was 249 s, while the maximum time to reach 5 m visibility was 274 s. As discussed previously, with increasing exhaust capacity, turbulence was induced, and the available visibility duration was shortened.
In contrast, visibility performance improved significantly in the case of PE1–PE3 near to intake fans. For PE1–PE3, the maximum time to reach 10 m visibility was extended to 456 s, while the maximum time to reach 5 m visibility was 556 s. These results confirm that under perpendicular installation, and particularly with increased intake and exhaust capacities (PE2 and PE3), visibility was better maintained, as illustrated in Figure 10.
However, the change in ventilation fan configuration did not lead to significant change in visibility of occupants near the exhaust fans. Under the PA installation (PA1–PA3), the maximum times to reach 10 m and 5 m of visibility were 198 s and 255 s, respectively. Although slightly longer times for reaching 5 and 10 m of visibility were derived in the case of PE3 (229 s for 10 m visibility and 305 s for 5 m visibility), the results of these cases are similar to those of the PA cases. Since airflow pressurization at the intake continuously drove smoke toward the exhaust, smoke tended to concentrate near the exhausts. Consequently, differences in visibility at the exhaust region were relatively small between the two configurations. Overall, the results demonstrate that perpendicular installation of intake and exhaust fans, combined with positive pressurization, is markedly more effective in maintaining visibility by promoting efficient smoke exhaust in underground parking fire scenarios.

3.4. Smoke Analysis After Fire Extinguishment

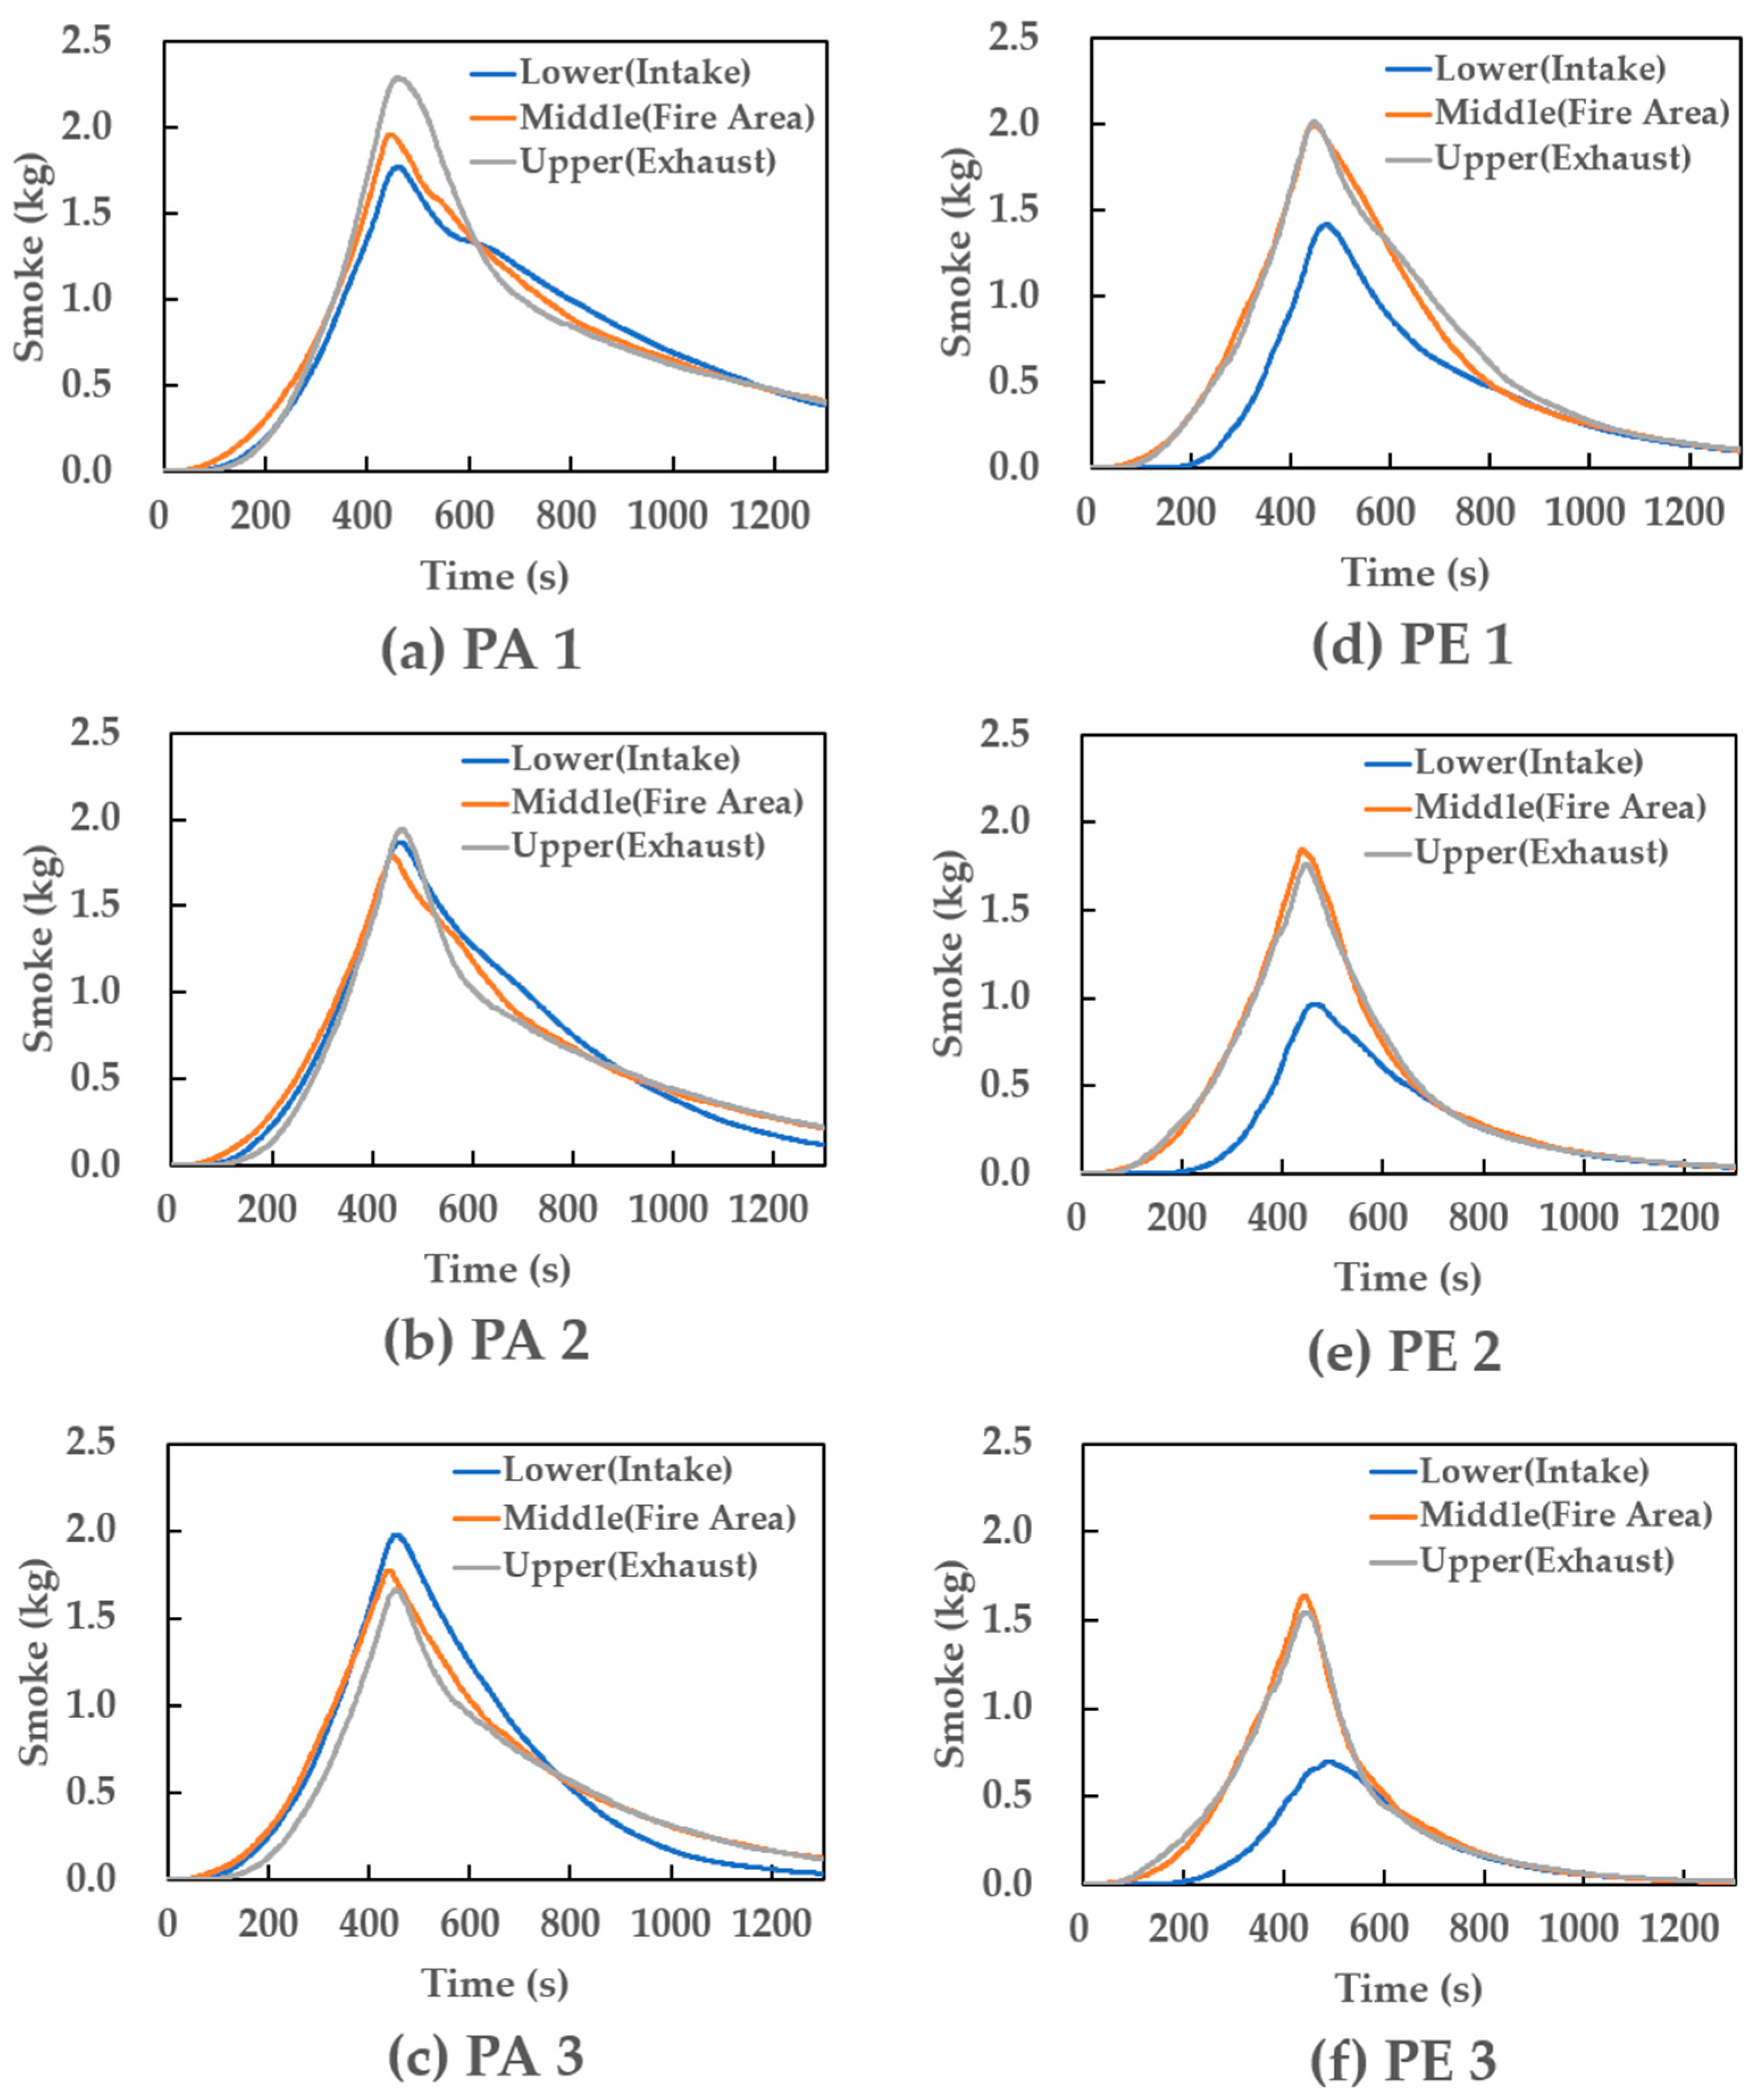
From the results obtained at 200 s, it was confirmed that the PE configuration of ventilation fans is more effective than the PA configuration. The PE configuration of ventilation fans also exhibited better smoke exhaust characteristics than that of ventilation fans with PA configuration after 1000 s of fire ignition. In the smoke density analysis, 1000 s was selected based on the assumption that the fire was extinguished at 500 s, using the most favorable condition, the PE3 case, as the reference. As shown in Figure 11 and Figure 12f, at approximately 1000 s after fire extinguishment, smoke was almost completely removed by the intake and exhaust fans, clearly demonstrating that the PE1–3 conditions exhibited improved performance compared with the PA1–3 conditions. Therefore, 200 s and 1000 s were identified as the most appropriate time points for quantitatively evaluating smoke behavior and exhaust efficiency in this study.
For precise evaluation, the fire space was also divided into three zones: the upper region (exhaust), the middle region (fire area), and the lower region (intake). Smoke distribution was measured in each zone after 1000 s, and variations of smoke across the entire area were compared to each other. As shown in Figure 11, as the capacity of ventilation fan increased, the smoke was more effectively removed from the underground parking lot regardless of orientation of ventilation fans. However, it is clear that the smoke effectively moved to the exhaust fans in the case of PE. The smoke declined in the PE cases over the entire area of the parking lot compared to their corresponding PA conditions with the same capacity of ventilation fans. Particularly, this effect was more dominant near to exhaust fans, revealing that the PE configuration is also more efficient at removing smoke after fire extinguishment.
Similarly, Figure 12 illustrates that smoke progressively declined across these cases, with the most pronounced reductions observed near the intake fans in the case of PE compared to PA. During the entire fire process from ignition of the fire to fire extinguishment, the distribution of smoke was suppressed in the case of PE due to improved ventilation. Figure 13 presents the smoke distribution for the entire space, confirming this trend. Thus, it is apparent that PE configuration is not only beneficial to remove smoke from underground parking lots during a fire, but also effective to extract residual smoke after fire extinguishment.
It should be noted that the present study analyzed a fire scenario occurring at the center of a square-shaped building, as illustrated in Figure 2. If the fire location were different or the building geometry were altered, the results might vary accordingly. Furthermore, if an additional ventilation path, such as a vehicle ramp or compartment wall, had been added in this work, the result might be different. Nevertheless, the findings of this study are expected to be broadly applicable to most underground parking lots equipped with inducer fans and intake/exhaust ventilation systems. Specifically, the results demonstrate that perpendicular fan orientation minimizes distortion of smoke flow and enables more efficient exhaust, providing a design approach that can be applied across diverse spatial configurations.

4. Conclusions

In this study, smoke flow and visibility in an underground parking lot of a large-scale building were analyzed using simulations under conditions with inducer fans, where ventilation fan intakes and exhausts were installed either parallel or perpendicularly. The effects of intake and exhaust capacities on smoke movement and visibility were compared.
When the intake and exhaust fans were arranged in parallel, smoke tended to disperse throughout the entire space. Even with increased intake and exhaust capacities, no significant improvement in smoke removal was observed. This was attributed to airflow distortion, which caused smoke to spread back toward the intake side. As a result, the time during which visibility was maintained was shortened, and the area affected by smoke remained similar regardless of increased airflow.
In contrast, when the intakes and exhausts were installed perpendicularly, smoke was effectively transported toward and concentrated around the exhausts. With increased intake and exhaust capacities, smoke movement toward the exhausts became more pronounced. This behavior was attributed to the uniform pressurization generated at the intake fans, which gradually drove smoke upward toward the exhausts. Although improvements in visibility time and smoke distribution near the exhausts were less pronounced compared with the parallel case, the effectiveness of smoke removal and visibility maintenance near the intake regions was significantly enhanced, particularly as intake and exhaust capacities increased. Furthermore, analysis of residual smoke after fire extinguishment confirmed that perpendicular installation substantially reduced the amount of remaining smoke.
Therefore, this study demonstrates through simulation that perpendicular installation of ventilation fan intakes and exhausts, combined with pressurization, provides a more effective method of smoke control during vehicle fires in underground parking lots. Considering that ventilation fans are widely used for smoke exhaust in current practice, the results of this research are expected to provide valuable guidance for enhancing safety in underground parking fires.

Author Contributions

Conceptualisation, T.-J.L. and H.-J.S.; methodology, T.-J.L. and E.-Y.O.; software, T.-J.L. and E.-Y.O.; investigation T.-J.L.; data curation, T.-J.L. and H.-J.S.; writing—original draft preparation, T.-J.L. and H.-J.S.; writing—review and editing, T.-J.L., E.-Y.O. and H.-J.S.; visualisation, T.-J.L. and H.-J.S. All authors have read and agreed to the published version of the manuscript.

Funding

This work was supported by the Human Resources Development of the Korea Institute of Energy Technology Evaluation and Planning (KETEP) grant funded by the Korea government Ministry of Trade, Industry and Energy (No. RS-2023-00266248).

Data Availability Statement

The data presented in this study are available on request from the corresponding author.

Conflicts of Interest

The authors declare no conflicts of interest.

References

  1. Moreira, S.R.; Gurjão, A.L.D.; Costa, F.L.O.; Araujo, F.S.; Simões, H.G.; Moraes, J.F.V.N. Aerobic fitness predicts the air consumption time in the self-contained breathing apparatus during physical task of firefighters. Rev. Andal. Med. Deporte 2019, 12, 88–92. [Google Scholar] [CrossRef]
  2. National Institute for Occupational Safety and Health (NIOSH). Evaluation of Chemical and Particle Exposures During Vehicle Fire Suppression Training; HHE Report No. 2008-0241-3113. In Department of Health and Human Services; Centers for Disease Control and Prevention: Cincinnati, OH, USA, 2010. Available online: https://www.cdc.gov/niosh/hhe/reports/pdfs/2008-0241-3113.pdf (accessed on 30 August 2025).
  3. Zhang, D.L.; Xiao, L.Y.; Wang, Y.; Huang, G.Z. Study on Vehicle Fire Safety: Statistic, Investigation Methods and Experimental Analysis. Saf. Sci. 2019, 117, 194–204. [Google Scholar] [CrossRef]
  4. Boehmer, H.R.; Klassen, M.S.; Olenick, S.M. Fire Hazard Analysis of Modern Vehicles in Parking Facilities. Fire Technol. 2021, 57, 2097–2127. [Google Scholar] [CrossRef]
  5. Park, J.-Y.; Ban, S.-B.; Ko, Y.-H. Study of the Characteristics and Crystal Growth of a Shorted Wire by Overcurrent. Fire Sci. Eng. 2017, 31, 83–90. [Google Scholar] [CrossRef]
  6. Choi, M. Root Cause Analysis of Electric Fires and Risk Diagnosis of Parked Vehicles. J. Korean Soc. Hazard Mitig. 2020, 20, 245–250. [Google Scholar] [CrossRef]
  7. Lee, E.-P. A Study on Analysis on an Automotive Fire Case that Broke Out due to an Electrical Cause during Engine Stopping. Trans. KSAE 2013, 21, 9–16. [Google Scholar] [CrossRef]
  8. Park, N.-K.; Kim, J.-P.; Nam, J.-W.; Sa, S.-H.; Song, J.-Y. Analysis on the Fire Accident of Vehicle Due to Damage of the Vehicle’s Electrical Components. J. Korean Soc. Saf. 2015, 30, 32–38. [Google Scholar]
  9. Sun, P.; Bisschop, R.; Niu, H.; Huang, X. A Review of Battery Fires in Electric Vehicles. Fire Technol. 2020, 56, 1361–1410. [Google Scholar] [CrossRef]
  10. Zhang, Y.; Wang, Z.; Li, Y.; Ma, H.; Guo, Z. Structural Performance of Outdoor Mechanical Garages under Combustion Conditions. Fire 2024, 7, 116. [Google Scholar] [CrossRef]
  11. Annerel, E.; Taerwe, L.; Merci, B.; Jansen, D.; Bamonte, P.; Felicetti, R. Thermo-mechanical Analysis of an Underground Car Park Structure Exposed to Fire. Fire Saf. J. 2013, 57, 96–106. [Google Scholar] [CrossRef]
  12. Choi, J.H.; Chae, S.U.; Hwang, E.H.; Choi, D.M. Fire Propagation Characteristics and Fire Risks of Polyurethanes: Effects of Material Type (Foam & Board) and Added Flame Retardant. Fire 2022, 5, 105. [Google Scholar] [CrossRef]
  13. Yuan, J.-P.; Fang, Z.; Tang, Z.; Sun, J.-Y. Numerical Simulations on Sprinkler System and Impulse Ventilation in an Underground Car Park. Procedia Eng. 2011, 11, 634–639. [Google Scholar] [CrossRef]
  14. Youn, H.K.; Kim, H.J. Optimal Measures for Smoke Control Performance for an Underground Parking Lot. J. Korean Soc. Hazard Mitig. 2020, 20, 251–256. [Google Scholar] [CrossRef]
  15. Lee, J.M. A Study on the Method of Smoke Control Using Fire Dynamic Simulation in Large Scale Underground Parking Lot. Master’s Thesis, Graduate School of Industry & Environment Gachon University, Seongnam-si, Republic of Korea, 2016. [Google Scholar]
  16. Alianto, H.; Astari, N.; Nareshwara, D.; Nugroho, Y.S. Modeling of Smoke Control in Underground Parking-Garage Fires. Int. J. Technol. 2017, 8, 876–885. [Google Scholar] [CrossRef]
  17. Çakir, M.T.; Ün, Ç. CFD Analysis of Smoke and Temperature Control System of Car Park Area with Jet Fans. J. Eng. Res. Rep. 2020, 13, 27–40. [Google Scholar] [CrossRef]
  18. Wang, Z.; Zhou, X.; Zhu, X.; Liu, J. Numerical Simulation of the Ventilation and Fire Conditions in an Underground Garage with an Induced Ventilation System. Buildings 2023, 13, 2074. [Google Scholar] [CrossRef]
  19. Rahif, H.; Attia, M. CFD Assessment of Car Park Ventilation System in Case of Fire Event. Appl. Sci. 2023, 13, 10190. [Google Scholar] [CrossRef]
  20. Anderson, J.; Sjöström, J.; Temple, A.; Charlier, M.; Dai, X.; Welch, S.; Rush, D. FDS simulations and modelling efforts of travelling fires in a large elongated compartment. Fire Mater. 2021, 45, 699–707. [Google Scholar] [CrossRef]
  21. Burlacu, D.; Anghel, I.; Popa, C.; Cășaru, I. Fire Safety Evaluation of an Underground Car Park Using Numerical Simulation. Math. Model. Civ. Eng. 2018, 14, 1–12. [Google Scholar] [CrossRef]
  22. Thien Khieu, H.; Lee, Y.M.; Kim, J.T.; Ryou, H.S. Numerical Study of the Effects of the Jet Fan Speed, Heat Release Rate and Aspect Ratio on Smoke Movement in Tunnel Fires. Energies 2020, 13, 1206. [Google Scholar] [CrossRef]
  23. Kazemipour, A.; Afshin, H.; Farhanieh, B. Numerical–Analytical Assessment of Fire and Ventilation Interaction in Longitudinally Ventilated Tunnels Using Jet Fans. Heat Transf. Eng. 2016, 38, 523–537. [Google Scholar] [CrossRef]
  24. Gutiérrez-Montes, C.; Sanmiguel-Rojas, E.; Viedma, A.; Rein, G. Experimental Data and Numerical Modelling of 1.3 and 2.3 MW Fires in a 20 m Cubic Atrium. Build. Environ. 2009, 44, 1827–1839. [Google Scholar] [CrossRef]
  25. SFPE Handbook of Fire Protection Engineering. In Society of Fire Protection Engineers; Hurley, M.J., Ed.; Springer: Berlin/Heidelberg, Germany, 2016. [Google Scholar]
  26. U.S. Nuclear Regulatory Commission (NRC). Verification and Validation of Selected Fire Models for Nuclear Power Plant Applications (NUREG-1824). In Fire Dynamics Simulator (FDS); NRC: Washington, DC, USA, 2007; Volume 7. [Google Scholar]
  27. Khalil, E.E.; Gomaa, S.M. Smoke Clearance in an Underground Car Park using the Jet Fan System. Int. J. Therm. Environ. Eng. 2017, 14, 95–101. [Google Scholar] [CrossRef]
  28. McGrattan, K.; Hostikka, S.; Floyd, J.; Baum, H.; Rehm, R.; Mell, W.; McDermott, R. Fire Dynamics Simulator (Version 5) User’s Guide. In NIST Special Publication 1019-5; National Institute of Standards and Technology: Gaithersburg, MD, USA, 2007. [Google Scholar]
  29. Liao, L.; Li, H.; Li, P.; Bao, X.; Hong, C.; Wang, D.; Xie, X.; Fan, J.; Wu, P. Underground Evacuation and Smoke Flow Simulation in Guangzhou International Financial City during Fire. Fire 2023, 6, 266. [Google Scholar] [CrossRef]
  30. Kang, S.; Kwon, M.; Choi, J.Y.; Choi, S. Full-scale fire testing of battery electric vehicles. Appl. Energy 2023, 332, 120497. [Google Scholar] [CrossRef]
  31. Noordijk, L.; Lemaire, T. Modelling of Fire Spread in Car Parks. Heron 2005, 50, 209–218. [Google Scholar]
  32. National Fire Protection Association (NFPA). NFPA 88A: Standard for Parking Structures; NFPA: Quincy, MA, USA, 2019. [Google Scholar]
  33. National Fire Protection Association (NFPA). NFPA 92: Standard for Smoke Control Systems; 2024 ed.; NFPA: Quincy, MA, USA, 2024. [Google Scholar]
  34. British Standards Institution (BSI). BS 7346-7: Components for Smoke and Heat Control Systems—Part 7: Code of Practice on Functional Recommendations and Calculation Methods for Smoke and Heat Ventilation Systems for Covered Car Parks; British Standards Institution: London, UK, 2006. [Google Scholar]
  35. Jevtić, R. Evacuation from a parking garage. Saf. Eng. 2019, 9, 75–80. [Google Scholar] [CrossRef]
Figure 1. Heat Release Rate (HRR) of vehicle fires for the simulation.
Fire 08 00398 g001
Figure 2. Layout of installation positions and orientations of intake and exhaust ventilation fans under parallel configurations (PA1–PA3) with the fire origin area at the underground parking lot. Here, the arrow indicates the direction of airflow by ventilation and inducer fans.
Fire 08 00398 g002
Figure 3. Layout of installation positions and orientations of intake and exhaust ventilation fans under perpendicular configurations (PE1–PE3) with the fire origin area at the underground parking lot. Here, the arrow indicates the direction of airflow by ventilation and inducer fans.
Fire 08 00398 g003
Figure 4. Smoke distribution in the underground parking lot at 200 s after fire ignition: (a) PA1, (b) PA2, and (c) PA3.
Fire 08 00398 g004
Figure 5. Rate of smoke distribution by areas in the PA1, PA2, and PA3 cases: (a) upper, middle, and lower regions, and (b) the overall area.
Fire 08 00398 g005
Figure 6. Evacuee visibility distribution in cases (a) PA1, (b) PA2, and (c) PA3. Here, the red color indicates that the visibility of occupants exceeds 30 m, while the blue zone is where the occupant’s visibility is limited below 5 m. The visibility of occupants gradually increases from blue (<5 m) to red (>30 m).
Fire 08 00398 g006
Figure 7. Smoke distribution in the underground parking lot at 200 s after fire ignition: (a) PE1, (b) PE2, and (c) PE3.
Fire 08 00398 g007
Figure 8. Rate of smoke distribution by areas in the PE1, PE2, and PE3 cases: (a) upper, middle, and lower regions, and (b) the overall area.
Fire 08 00398 g008
Figure 9. Evacuee visibility distribution in cases (a) PE1, (b) PE2, and (c) PE3. Here, the red color indicates that the visibility of occupants exceeds 30 m, while the blue zone is where the occupant’s visibility is limited below 5 m. The visibility of occupants gradually increases from blue (<5 m) to red (>30 m).
Fire 08 00398 g009
Figure 10. Times for limiting the visibility of occupants below 5 and 10 m at each case: (a) intake and (b) exhaust.
Fire 08 00398 g010
Figure 11. Smoke distribution at 1000 s for cases (a) PA1, (b) PA2, (c) PA3, (d) PE1, (e) PE2, and (f) PE3.
Fire 08 00398 g011
Figure 12. Smoke distribution–time characteristics for 1000 s in the cases (a) PA1, (b) PA2, (c) PA3, (d) PE1, (e) PE2, and (f) PE3.
Fire 08 00398 g012
Figure 13. Smoke distribution–time characteristics for the entire parking lot in each case.
Fire 08 00398 g013
Table 1. Recent literature concerning smoke exhaust systems in enclosed areas.
ReferencesMain Research TopicDifference from This Work
This workEffect of ventilation fans’ orientation and capacity on smoke exhaust efficiency-
Youn, H.K (2018) [14]Smoke distribution in compartmentalized underground parking lotsFocused on inducer fans; did not analyze ventilation fan orientation and capacity
Çakir & Ün (2020) [17]Effect of inducer fan orientation and capacity on smoke exhaust efficiency and temperature change
Wang et al. (2023) [18]CO concentration and smoke exhaust efficiency with modified inducer fan
Rahif & Attia (2023) [19]Effect of jet fan–axial fan combinations on ventilation performance
Anderson et al. (2021) [20]Thermal and smoke effects of travelling fires on large-scale structuresVentilation and inducer fan conditions were fixed
Alianto et al. (2017) [16]Finding the optimal conditions of inducer fans with a sprinkler system in an enclosed spaceAnalyzed smoke distribution with sprinklers; however, ventilation fans were fixed
Burlacu et al. (2018) [21]
Table 2. Simulation information used in this study.
ContentsSimulation Conditions
Parking Lot SizeFloor Space 4700 m3 (68 m × 69 m), Height 3.5 m
Heat Release Rate8500 kW
Reaction MaterialPolyurethane GM21
Grid Sensitivity7.53
Grid Size0.3 m × 0.3 m × 0.3 m
Visibility Device1.8 m from bottom
Statistics DeviceUpper, Middle, Lower, Volume area (Soot)
Fire Ramp-up TimeFast 150 s (1 MW)
Soot Yield0.131
Ambient Temperature20 °C
Relative Humidity40%
Intake and Outlet Fan Position1.8 m from bottom
Inducer Fan Position2.4 m from bottom
Ramp ShutterClosed (blocking from outside)
Door to StairsOpen (1 m × 2.1 m), 4 areas
Table 3. Simulation conditions of the optimal smoke exhaust conditions in each case. Here, the inducer fan velocity was fixed at 1 m3/s.
CaseVentilation Fan DirectionVentilation Cycles
PA1Parallel10 cycles (23 m3/s)
PA2Parallel15 cycles (34 m3/s)
PA3Parallel20 cycles (46 m3/s)
PE1Perpendicular10 cycles (23 m3/s)
PE2Perpendicular15 cycles (34 m3/s)
PE3Perpendicular20 cycles (46 m3/s)
Table 4. Ratio of smoke distribution areas in each zone at 200 s after fire ignition under the conditions of PA1, PA2, and PA3.
CaseUpper (Exhaust) (%)Middle (Fire Area) (%)Lower (Intake) (%)
PA129.7650.3628.91
PA225.1747.2741.13
PA323.4748.3244.37
Table 5. Ratio of evacuee visibility below 5 m (blue zones).
CaseUpper (Exhaust) (%)Middle (Fire Area) (%)Lower (Intake) (%)
PA15.264.143.72
PA26.134.034.78
PA34.531.921.94
Table 6. Ratio of evacuee visibility of 5–10 m (green zones).
CaseUpper (Exhaust) (%)Middle (Fire Area) (%)Lower (Intake) (%)
PA129.0024.2816.38
PA235.3429.2726.18
PA337.6436.0536.73
Table 7. Ratio of evacuee visibility over 30 m (red zones).
CaseUpper (Exhaust) (%)Middle (Fire Area) (%)Lower (Intake) (%)
PA124.0536.5937.93
PA228.4839.6936.20
PA325.5734.3329.85
Table 8. Smoke distribution areas in each zone at 200 s after fire ignition under the conditions of PE1, PE2, and PE3.
CaseUpper (Exhaust) (%)Middle (Fire Area) (%)Lower (Intake) (%)
PE152.1244.076.85
PE255.6941.742.66
PE353.1731.971.52
Table 9. Ratio of evacuee visibility below 5 m (blue zones) in the case of PE.
CaseUpper (Exhaust) (%)Middle (Fire Area) (%)Lower (Intake) (%)
PE111.630.740.65
PE215.482.120.02
PE38.821.880.00
Table 10. Ratio of evacuee visibility of 5–10 m (green zones) in the case of PE.
CaseUpper (Exhaust) (%)Middle (Fire Area) (%)Lower (Intake) (%)
PE129.7027.852.24
PE222.5920.110.11
PE328.0216.070.10
Table 11. Ratio of evacuee visibility over 30 m (red zones) in the case of PE.
CaseUpper (Exhaust) (%)Middle (Fire Area) (%)Lower (Intake) (%)
PE18.5031.7573.79
PE29.6931.3282.80
PE313.6649.0882.90
Disclaimer/Publisher’s Note: The statements, opinions and data contained in all publications are solely those of the individual author(s) and contributor(s) and not of MDPI and/or the editor(s). MDPI and/or the editor(s) disclaim responsibility for any injury to people or property resulting from any ideas, methods, instructions or products referred to in the content.