Article

Investigation of the Impact of Coal Fires on Soil: A Case Study of the Wugong Coal Fire Area, Xinjiang, China

1
Center for Underground Coal Fire, School of Ecology and Environment, Xinjiang University, Urumqi 830017, China
2
School of Civil, Mining, Environmental and Architectural Engineering, University of Wollongong, Wollongong 2500, Australia
*
Authors to whom correspondence should be addressed.
Fire 2025, 8(10), 385; https://doi.org/10.3390/fire8100385
Submission received: 7 March 2025 / Revised: 26 June 2025 / Accepted: 8 July 2025 / Published: 26 September 2025

Abstract

This study focused on the Wugong coal fire area in the Zhunnan coalfield of Xinjiang, analyzing 41 soil samples extending from the fire center outward. The key parameters included pH, soil organic carbon (SOC), total nitrogen (TN), total phosphorus (TP), available potassium (AK), various ions (Ca2+, Na+, Mg2+, SO42−, CO32−, HCO3, and Cl), and heavy metal concentrations (As, Cr, Hg, Ni, Cd, Cu, Zn, and Pb). The primary objectives were to evaluate heavy metal pollution levels and potential ecological risks using the single factor pollution index (Pi), the Geo-accumulation index (IGeo), Nemero’s pollution index (Pn), the pollution load index (PLI), and the ecological risk factor (Eri) and risk index (RI). Spatial distribution analysis indicated higher heavy metal concentrations in the southwestern and central regions. The heavy metals Cr, Ni, Cd, Cu, and Zn reached mild pollution levels, while Hg exhibited high pollution, with Pi, IGeo, and Pn values of 3.27, 0.61, and 9.68, respectively. Hg (Eri = 111.07) and Cd (Eri = 45.91) emerged as the primary ecological risk factors. The overall ecological risk index (RI) of 184.98 indicated a moderate ecological risk. The results demonstrate that soils surrounding the coal fire zone are significantly impacted by coal fire, characterized by severe heavy metal contamination and nutrient deficiency.

1. Introduction

Coal fires occur as an eco-environmental and safety issue induced by coal mining activities [1,2,3,4]. Coal fires lead to loss of coal resources and cause negative impacts like air pollution, vegetation destruction, contamination of both surface and groundwater, land degradation, and other soil contamination [5,6,7]. The coal fires exacerbate the risk of surface subsidence, soil erosion, and land desertification in the surrounding areas [8]. Therefore, an investigation of the coal fire’s impact on soil is a necessary task. The continuous combustion of coal fires promotes the ongoing release of toxic metal elements from the coal, which then enter the surrounding soil of the mining area through processes such as air diffusion and ash deposition [9]. Due to their high toxicity, bio-accumulation potential, and non-degradability [10], the concentration of these heavy metals in the soil continues to rise, posing a threat to environmental quality and human health in the vicinity of coal fire areas [11]. Furthermore, pollutants concentrated in the soil around fire zones can become a source of groundwater contamination due to natural factors like rain, snow, and runoff, thereby increasing their ecological toxicity [12,13,14].
Recent studies mainly revealed that mining and associated activities discharge toxic metals into surrounding soils, leading to contamination of agricultural land, surface water, and riparian zones [15,16,17,18]. Zhang [19] utilized a linear regression model to analyze the pollution characteristics of heavy metals in the Zhundong mining area of Xinjiang, and the results indicated that mercury poses the high ecological risk. Dong [20] accurately depicted the spatial distribution of heavy metals using a semi-variogram model and ordinary kriging interpolation, revealing that the soil in the mining area is severely contaminated by Mn, Cr, and Ni. Lin [21] studied the levels of heavy metal pollution and ecological risks in the soil surrounding the Tongling typical mining area, identifying cadmium and mercury as the primary pollutants. In the study of heavy metals in soils around coal fire areas, Wang and Liang [16,22] measured the concentrations of mercury and other heavy metals in the soil surrounding the Wuda coalfield fire in Inner Mongolia. Zeng [23,24] previously studied the distribution of heavy metals in the soils of the Shuixigou and Daquanhu coalfield fire zones.
Furthermore, the combustion of coal fires significantly raises the temperature of the surrounding soil. High temperatures can lead to the decomposition and loss of soil organic matter [23,25], thereby reducing soil fertility. Additionally, the thermal effects of coal fires can alter the original structure of the soil in the fire zone, resulting in reduced soil moisture [26], deteriorated texture, weakened nutrient cycling, and uneven distribution. Ultimately, this leads to a decrease in the content of soil organic matter and essential nutrients such as nitrogen, phosphorus, and potassium [27,28]. The impact of combustion-induced subsidence could also contribute to the decline in total nitrogen and organic matter content in the soil [29]. However, to date, research on the effects of coal fire combustion on soil chemical properties, as well as its correlation with heavy metal distribution, has no detailed discussion, and detailed descriptions of quantitative methods are relatively scarce [30].
This study investigates the Wugong coal fire area in the Zhunnan coalfield of Xinjiang, where soil environmental quality faces multifaceted threats. The occurrence and development of coal fires are influenced by a variety of factors, including coal seam characteristics, mining technology, ventilation conditions, geological conditions, human activities, and external environment. The extent of soil disturbance from coal fires, the link between heavy metal distribution in surrounding soil and soil chemical properties, and ecological risk trends remain unclear, raising concerns about soil environmental quality. This research aims to clarify the impact of thermal effects from fire zones on soil chemical properties through soil sampling and analysis. We then examine the spatial distribution of heavy metals, explore the correlation between soil chemical properties and heavy metal distribution, and assess the pollution and ecological risk of heavy metals in the fire zone. This study seeks to support soil quality monitoring and ecological risk management of heavy metals in coal fire areas.

2. Materials and Methods

2.1. Study Area

The study area is located in the Wugong coal fire region of the Zhunnan coalfield in Xinjiang, situated at the foothills of the southern edge of the Junggar Basin, which falls within a temperate continental climate zone. The maximum elevation in the area is 1226 meters, while the minimum elevation is 730 m. The dominant wind direction is northwest, with an average wind speed of 2.4 m/s and a peak wind speed of 29 m/s. The coal seams generally trend east–west and dip to the south, exhibiting significant variations in dip angle due to faulting. In the northern section, the dip angle ranges from 60° to 75°, while the southern section is nearly vertical, with angles between 78° and 85° and a maximum combustion depth of 123 m.

2.2. Soil Sample Collection and Treatment

The Wugong coal fire area contains a total of four combustion zones, with the geographic coordinates of the centers of these zones serving as reference points. The sampling area is located at the center of this region, with latitude and longitude ranges of 88.15° to 88.16° E and 44.07° to 44.08° N. A total of 41 surface soil samples (0–20 cm) were collected in the study area, with GPS coordinates recorded for each location, as shown in Figure 1. During sampling, a wooden shovel was used, and each sample was created by mixing five subsamples (500 g each) taken from the four corners and the center of a 10 m × 10 m square. The mixed soil was then reduced using the quartering method to a final weight of 500 g and stored in polyethylene bags. The sampling method adhered to the “Technical Specifications for Soil Environmental Monitoring” (HJ/T 166-2004). All samples were free of plant roots, stones, and other impurities, and were air-dried in the bags. The soil samples were then sieved through 20 and 100 mesh nylon sieves to determine their chemical properties and heavy metal content.

2.3. Sample Analysis

2.3.1. Soil Chemical Properties

Soil pH was assessed using a potentiometric approach with a 5:1 soil-to-water ratio, following the method outlined in ISO 10390:2005 (Leici PHSJ-6, Shanghai Yidian Scientific Instrument Co., Ltd., Shanghai, China). Soil organic carbon (SOC) content was determined via the potassium dichromate heating method, as outlined in Section 6 of “Soil Testing” (NY/T 1121.6-2006). Total nitrogen (TN) was measured using the Kjeldahl method, based on the “Determination of Total Nitrogen in Soil (Semi-Micro Kjeldahl Method)” (NY/T 53-1987). Total phosphorus (TP) was analyzed using the sodium hydroxide fusion–molybdenum antimony colorimetric method, according to NY/T 88-1988. The primary soil ions (available potassium (AK), Ca2+, Na+, Mg2+, Cl, SO42−, HCO3, and CO32−) were examined following the “Methods for Agricultural Chemical Analysis of Soils”.

2.3.2. Heavy Metal

Following the “Determination of Copper, Zinc, Lead, Nickel, and Chromium in Soil and Sediments by Flame Atomic Absorption Spectrophotometry” (HJ491-2019), soil samples underwent microwave digestion using a mixed method involving hydrochloric acid, nitric acid, hydrofluoric acid, and hydrogen peroxide to determine the content of chromium (Cr), lead (Pb), nickel (Ni), cadmium (Cd), copper (Cu), and zinc (Zn). Mercury (Hg) and arsenic (As) concentrations were determined using atomic fluorescence spectrometry [31]. All reagents used were of analytical grade, and deionized water was employed throughout the process. To ensure test accuracy and precision, each sample included three replicates. Standard soil samples (ERM-S-510203) were utilized for quality control, maintaining measurement deviations within ±10%.

2.4. Methods for Evaluating Soil Heavy Metal Pollution

2.4.1. Single Factor Pollution Index Method

The single factor pollution index method evaluates pollution by comparing the measured concentration of heavy metals to a standard value. The level of pollution is determined by the magnitude of this ratio. The formula for calculation is as follows:
P i = c i s i
Here, P i denotes the pollution index for the individual pollutant [32]; C i is the measured concentration of the pollutant (mg/kg); and Si is the standard evaluation value for the pollutant (mg/kg). Referencing the soil background levels of heavy metals in Xinjiang, the pollution classification criteria are detailed in Table 1.

2.4.2. Nemero’s Pollution Index Method

This approach is widely used for evaluating pollution indices, taking into account the impact of both the maximum and average values of the single factor pollution index. It effectively reflects the pollution levels of various heavy metals in the soil environment. The formula is expressed as follows:
P n = P i 2 max + P i 2 a v g 2
Here, P n represents Nemero’s pollution index, which is dimensionless [33]; P i 2 max is the highest value of the single factor pollution index, which is also dimensionless. P i 2 a v g is the mean value of the single factor pollution index, which is dimensionless as well. The pollution classification can be found in Table 1.
Table 1. Specifications of the pollution index applied in pollution and risk assessment.
IndexClassificationSpecificationReferences
Single factor pollution index
(Pi )
Pi < 1Non-pollution (I)[34,35]
1 ≤ Pi < 2Mild pollution (II)
2 ≤ Pi < 3Moderate pollution (III)
3 ≤ Pi < 4High pollution (IV)
4 ≤ Pi < 5Heavy pollution (V)
Geo-accumulation index
(IGeo)
Igeo < 0Non-pollution (I)[10]
0 ≤ Igeo < 1Light to moderate pollution (II)
1 ≤ Igeo < 2Moderate pollution (III)
2 ≤ Igeo < 3Moderate to heavy pollution (IV)
3 ≤ Igeo < 4Heavy pollution (V)
4 ≤ Igeo < 5Heavy to strong pollution (VI)
Igeo ≥ 5Extreme pollution (VII)
Nemero’s pollution index
(Pn)
Pn < 0.7Non-pollution (I)[33]
0.7 ≤ Pn < 1Mild pollution (II)
1 ≤ Pn < 2Moderate Pollution (III)
2 ≤ Pn < 3High pollution (IV)
Pn ≥ 3Heavy pollution (V)
Pollution load index
(PLI)
PLI < 1Non-pollution (I)[36,37]
1 < PLI ≤ 2Mild pollution (II)
2 < PLI ≤ 3Moderate pollution (III)
PLI > 3Heavy pollution (IV)
Ecological risk
factor (Eri) and risk index (RI)
Eri < 40, RI < 150Low risk (I)[34,38,39]
40 ≤ Eri < 80, 150 ≤ RI < 300Moderate risk (II)
80 ≤ Eri < 160, 300 ≤ RI < 600Considerable risk (III)
160 ≤ Eri < 320, RI ≥ 600High risk (IV)
Eri ≥ 320Significantly high risk (V)

2.4.3. Geo-Accumulation Index Method

The Geo-accumulation index, introduced by Muller in 1969 and often referred to as the Muller index, is extensively utilized by researchers worldwide to assess heavy metal contamination in soil. The formula for its calculation is as follows:
I G e o = L o g 2 c i 1.5 B i
Here, IGeo denotes the Geo-accumulation index [10]; Ci is the measured concentration of the soil element; and Bi is the background value of the soil element, referencing the heavy metal background levels in Xinjiang. Soil heavy metal pollution is categorized into seven levels based on the Geo-accumulation index, with the classification results detailed in Table 1.

2.4.4. Pollution Load Index

The pollution load index (PLI) is used to assess the degree of contamination from multiple heavy metal elements in the soil of the study area, considering their toxicity. The formula is expressed as follows:
P L I = c 1 B 1 × c 2 B 2 × × c n B n n
Here, PLI represents the pollution load index at a sample point, which is dimensionless [36,37]; Ci is the measured concentration in mg·kg−1; Bi is the chosen background value in mg·kg–1; and n is the number of elements. The standards for pollution classification are detailed in Table 1.

2.4.5. Analysis of Potential Ecological Risks

The potential ecological risk index evaluates the ecological risk of specific pollutants by integrating toxicological, environmental, and ecological factors into an index-based grading system. This approach assesses the ecological risks of toxic metals by considering both the individual impacts of each metal and their combined effects. As a result, it offers a comprehensive evaluation of the pollution levels and potential risks of toxic metals in the soil. The formula for calculation is as follows:
E r i = T r i × P i
R I = i = 1 n E r i
Here, Eri is the potential ecological risk factor for toxic metal i [34], Tri is the toxicity response coefficient for toxic metal i [40], Pi denotes the pollution index for the individual pollutant, and RI is the potential ecological risk index [41]. Based on the standardized toxicity coefficients for toxic metals established by Hakansson, the evaluation standards for the ecological risk factor of Eri and the risk index RI are detailed in Table 1.
SPSS21 was used to calculate descriptive statistics such as mean, median, standard deviation, and variance for all variables. Graphs of the experimental data were created using Origin 2024 and used for data visualization and basic statistical analysis, and Suffer 23 software was used for spatial interpolation and mapping of soil properties.

3. Results and Discussion

3.1. Descriptive Statistics of Soil Chemical Properties

Descriptive statistics are tools used to summarize and describe data. In this study, we applied descriptive statistics to analyze soil pH, SOC, TN, TP, and soil ion composition (including Cl, CO32−, HCO3, SO42−, AK, Ca2+, Mg2+, and Na+) in the study area (Table 2).
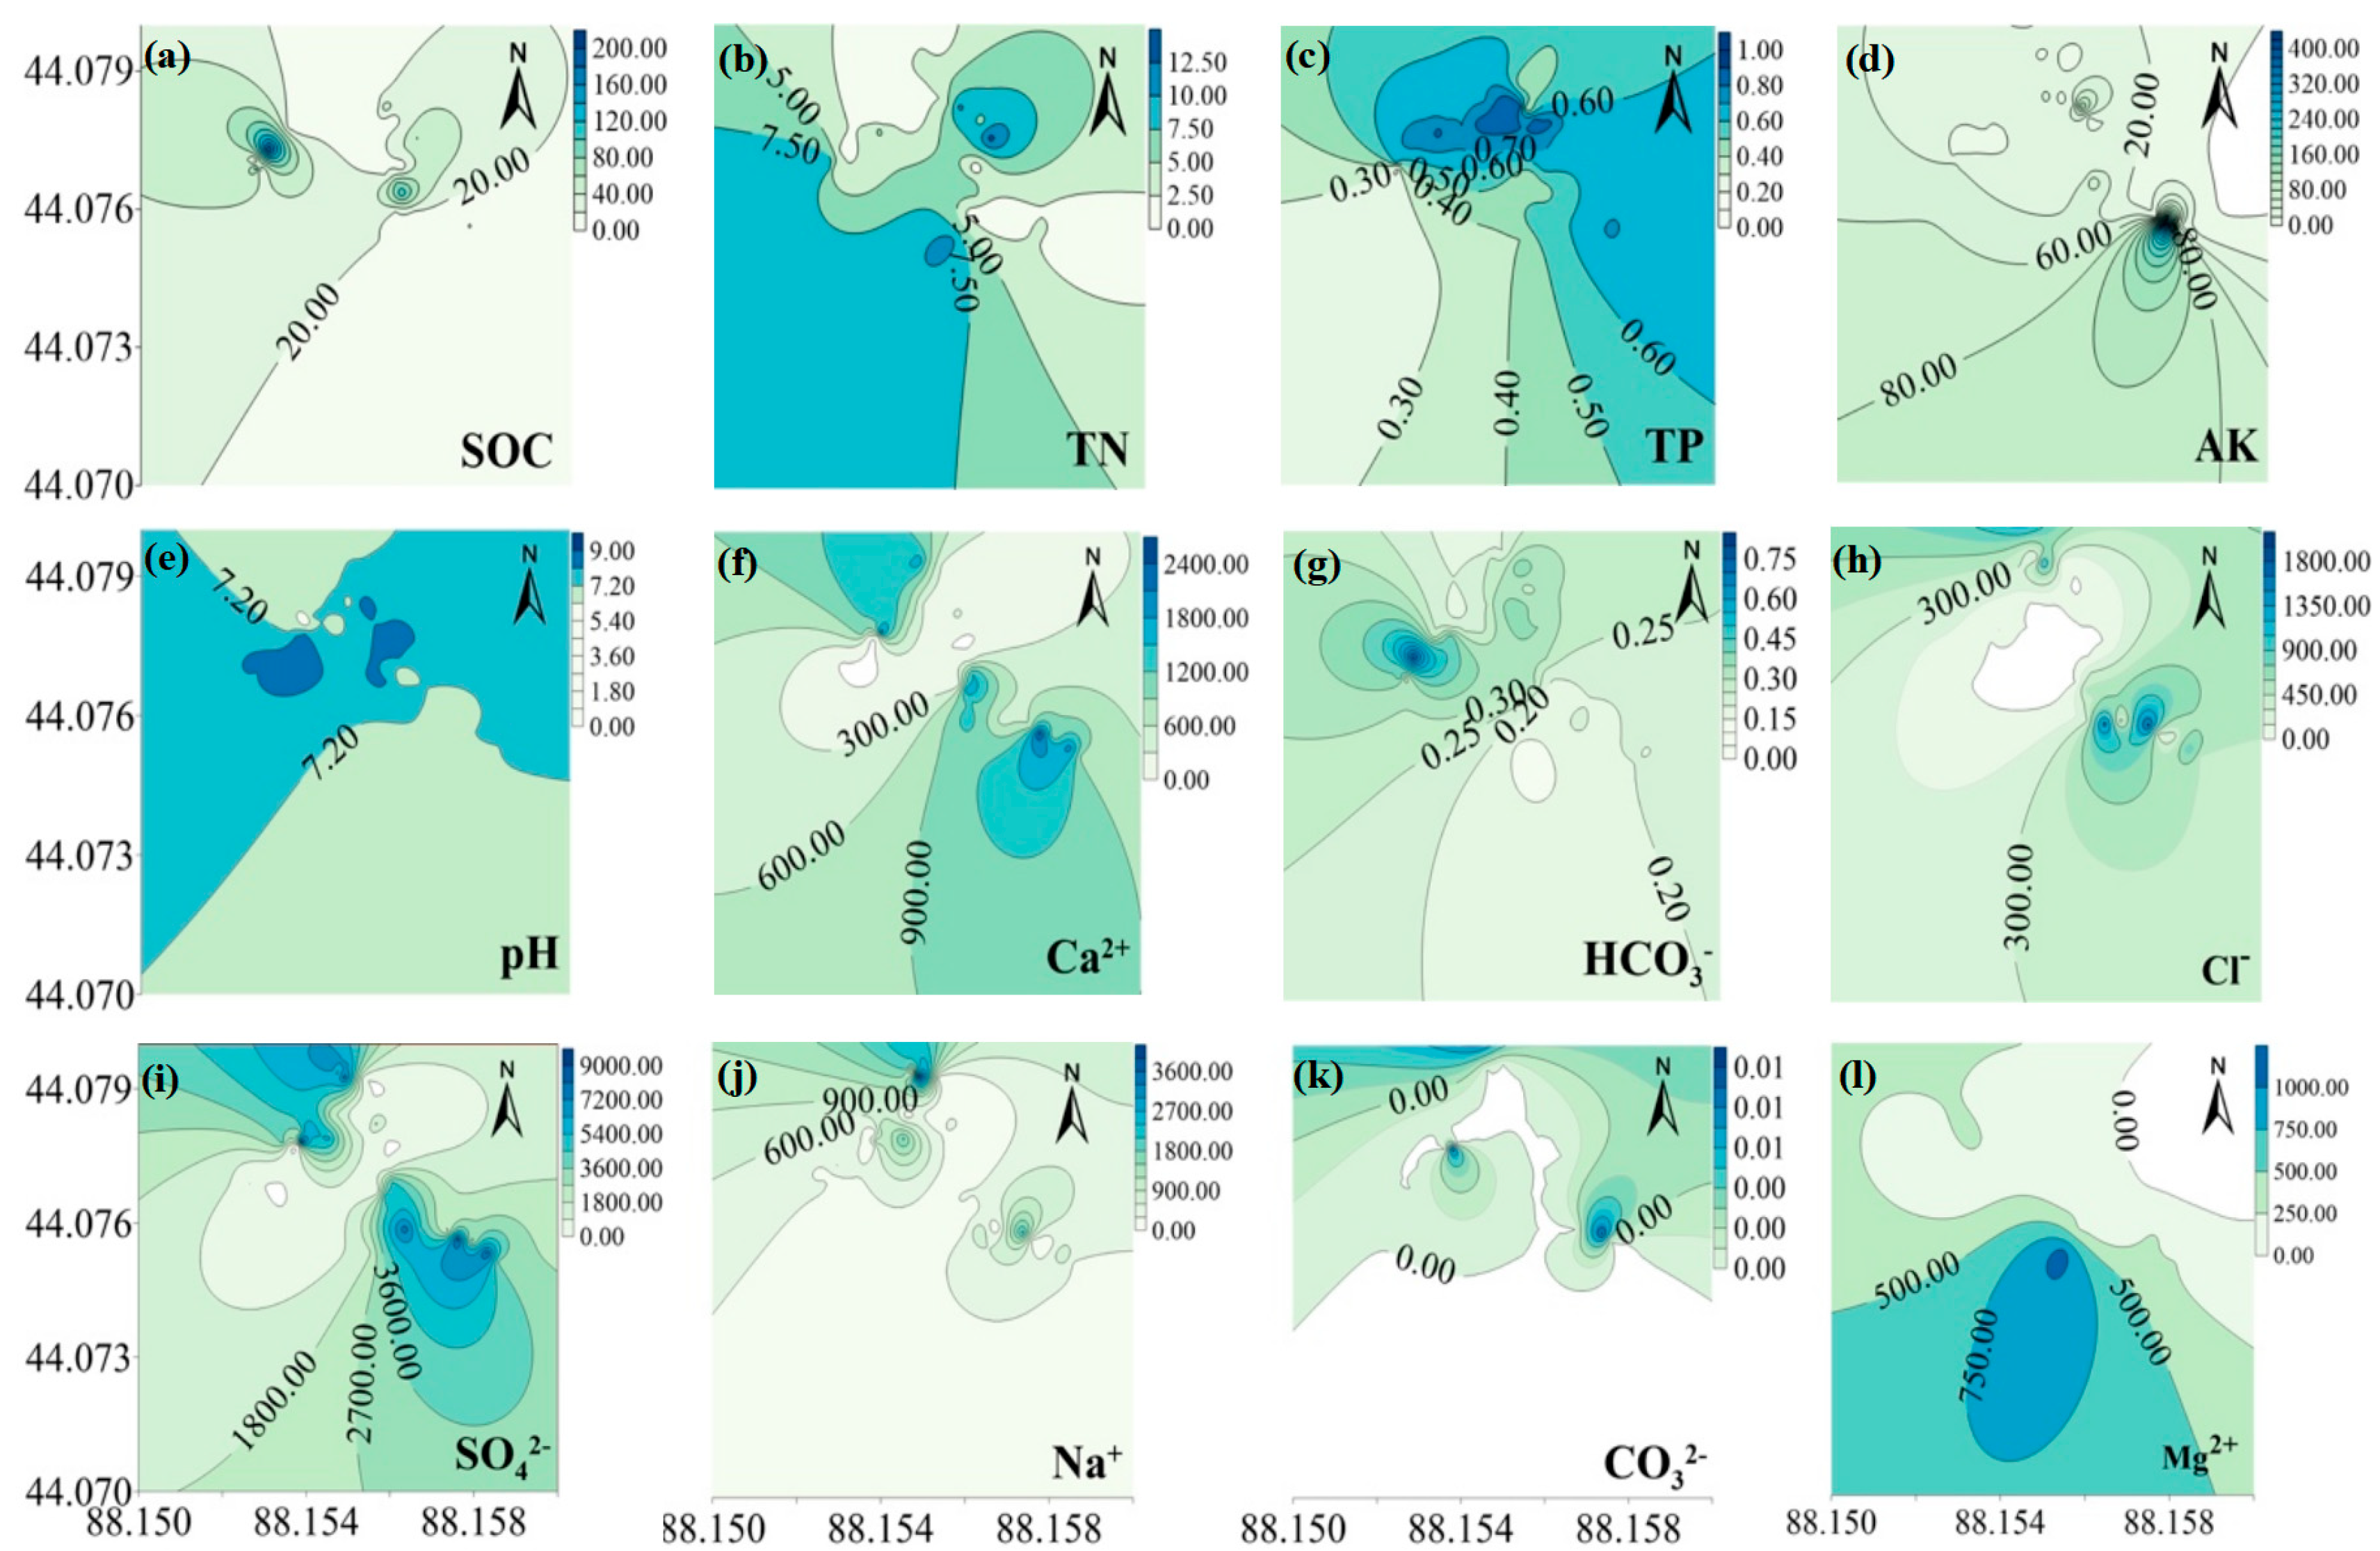
Soil pH impacts vegetation growth and is crucial for soil fertility, especially regarding nutrient availability and microbial activity. Studies show that pH significantly affects the mobility and solubility of toxic metal cations [42,43,44]. In the study area, the average soil pH is 7.46, with a range of 5.60 to 8.52 and a coefficient of variation of 0.09. In contrast, the soil pH in Urumqi is 8.3 [45], and the average soil pH in the Zhundong coalfield is 8.34 ± 0.54 [46]. In general, the soil pH around the fire area is slightly lower. The process of coal fire combustion could introduce acidic substances into the soil, resulting in a decrease in soil pH.
Soil total organic carbon (SOC) is a vital component of soil, enhancing nutrient availability and aiding in the formation of soil aggregates, which improves physical properties. SOC serves as a key indicator for ecological restoration [47]. The SOC levels in the study area are very low, ranging from 1.60 to 199.99 mg/kg, with an average of just 24.10 mg/kg. Based on the nutrient classification standards from the second national soil survey [48], this is classified as the sixth nutrient level (<6 g/kg). In the Zhundong coalfield area, soil organic carbon content ranges from 3.28 to 253.88 g/kg, with an average of 69.5 g/kg [46]. It can be inferred that the thermal effect of coal fires significantly reduces the organic matter content in soil.
Total nitrogen (TN) and total phosphorus (TP) are crucial for plant growth and development, helping to maintain ecological nutrient balance, promote root growth, and enhance soil quality, making them key indicators of soil fertility. In the study area, TN and TP levels are generally very low, averaging 3.88 mg/kg and 0.63 mg/kg, respectively, both classified within the sixth nutrient level (TN < 0.5 g/kg, TP < 0.2 g/kg), indicating very poor conditions. Soil available potassium is another vital indicator, as it is more easily absorbed and utilized by plants. The average available potassium content in the study area is 42.32 mg/kg, categorized as the fifth nutrient level (poor level), with a range from 12.30 to 403.80 mg/kg.
The ionic composition in soil, in particular the cations (Ca2+, Mg2+, K+, and Na+) and the anions (Cl, SO42−, HCO3, and NO3), has a vital effect on soil fertility, pH, water retention, and crop growth. The contents of Na+, Ca2+, and SO42− in soil were all higher than 500 mg/kg, which dramatically affects soil secondary salinization [49], especially SO42−, with an average concentration of 3168.13 mg/kg. The high concentration of SO42− in the soil may originate from the decomposition of sulfur-containing minerals in the fire-affected soil. The low levels of SOC, TN, TP, and AK in the mining area soil limit the establishment of vegetation and sustainable productivity, indicating significant soil degradation due to underground coal combustion. Additionally, the coefficient of variation (CV) for all soil physical and chemical indices in the study area is below 10% (Table 2 and Figure 2), suggesting minimal spatial distribution differences and limited disturbance from human activities.

3.2. Characteristics of Heavy Metal Pollution

The chemical analysis of eight heavy metals from 41 soil samples in the study area is summarized in Table 3. The average concentrations of As, Hg, Cr, Cd, Ni, Pb, Zn, and Cu were 8.45, 0.06, 62.67, 0.18, 29.08, 17.24, 83.38, and 34.68 mg·kg−1, respectively. Compared to the soil background values in Xinjiang, all metals except for Pb and As were slightly below the background levels. In contrast, Ni, Cd, Cr, Cu, Zn, and Hg exceeded the background values by 1.15, 1.50, 1.27, 1.30, 1.21, and 3.00 times, respectively. This suggests an accumulation of these six heavy metals in the soil, indicating a potential pollution risk. The coefficient of variation (CV) for the metals was as follows: As > Cr > Hg > Ni > Cd > Cu > Zn > Pb. Among them, As, Cr, and Hg exhibited moderate variation [50] with CVs of 73.27%, 45.96%, and 32.43%, respectively. This irregular spatial distribution suggests significant external influences.
According to previous studies, the reference values for heavy metals in surface soil are Cr (153 mg/kg) [52], As (22 mg/kg) [53], Ni (287.15 mg/kg) [54], Cu (36 mg/kg) [55], Hg (0.037 mg/kg) [56] Pb (85 mg/kg), Cd (0.15 mg/kg) [56] and Zn (50 mg/kg) [57]. These reference values are based on global standards from various regions. It is clear that background reference values can differ greatly between locations, making it difficult to establish a uniform assessment standard. Therefore, aligning with local environmental regulations is crucial.
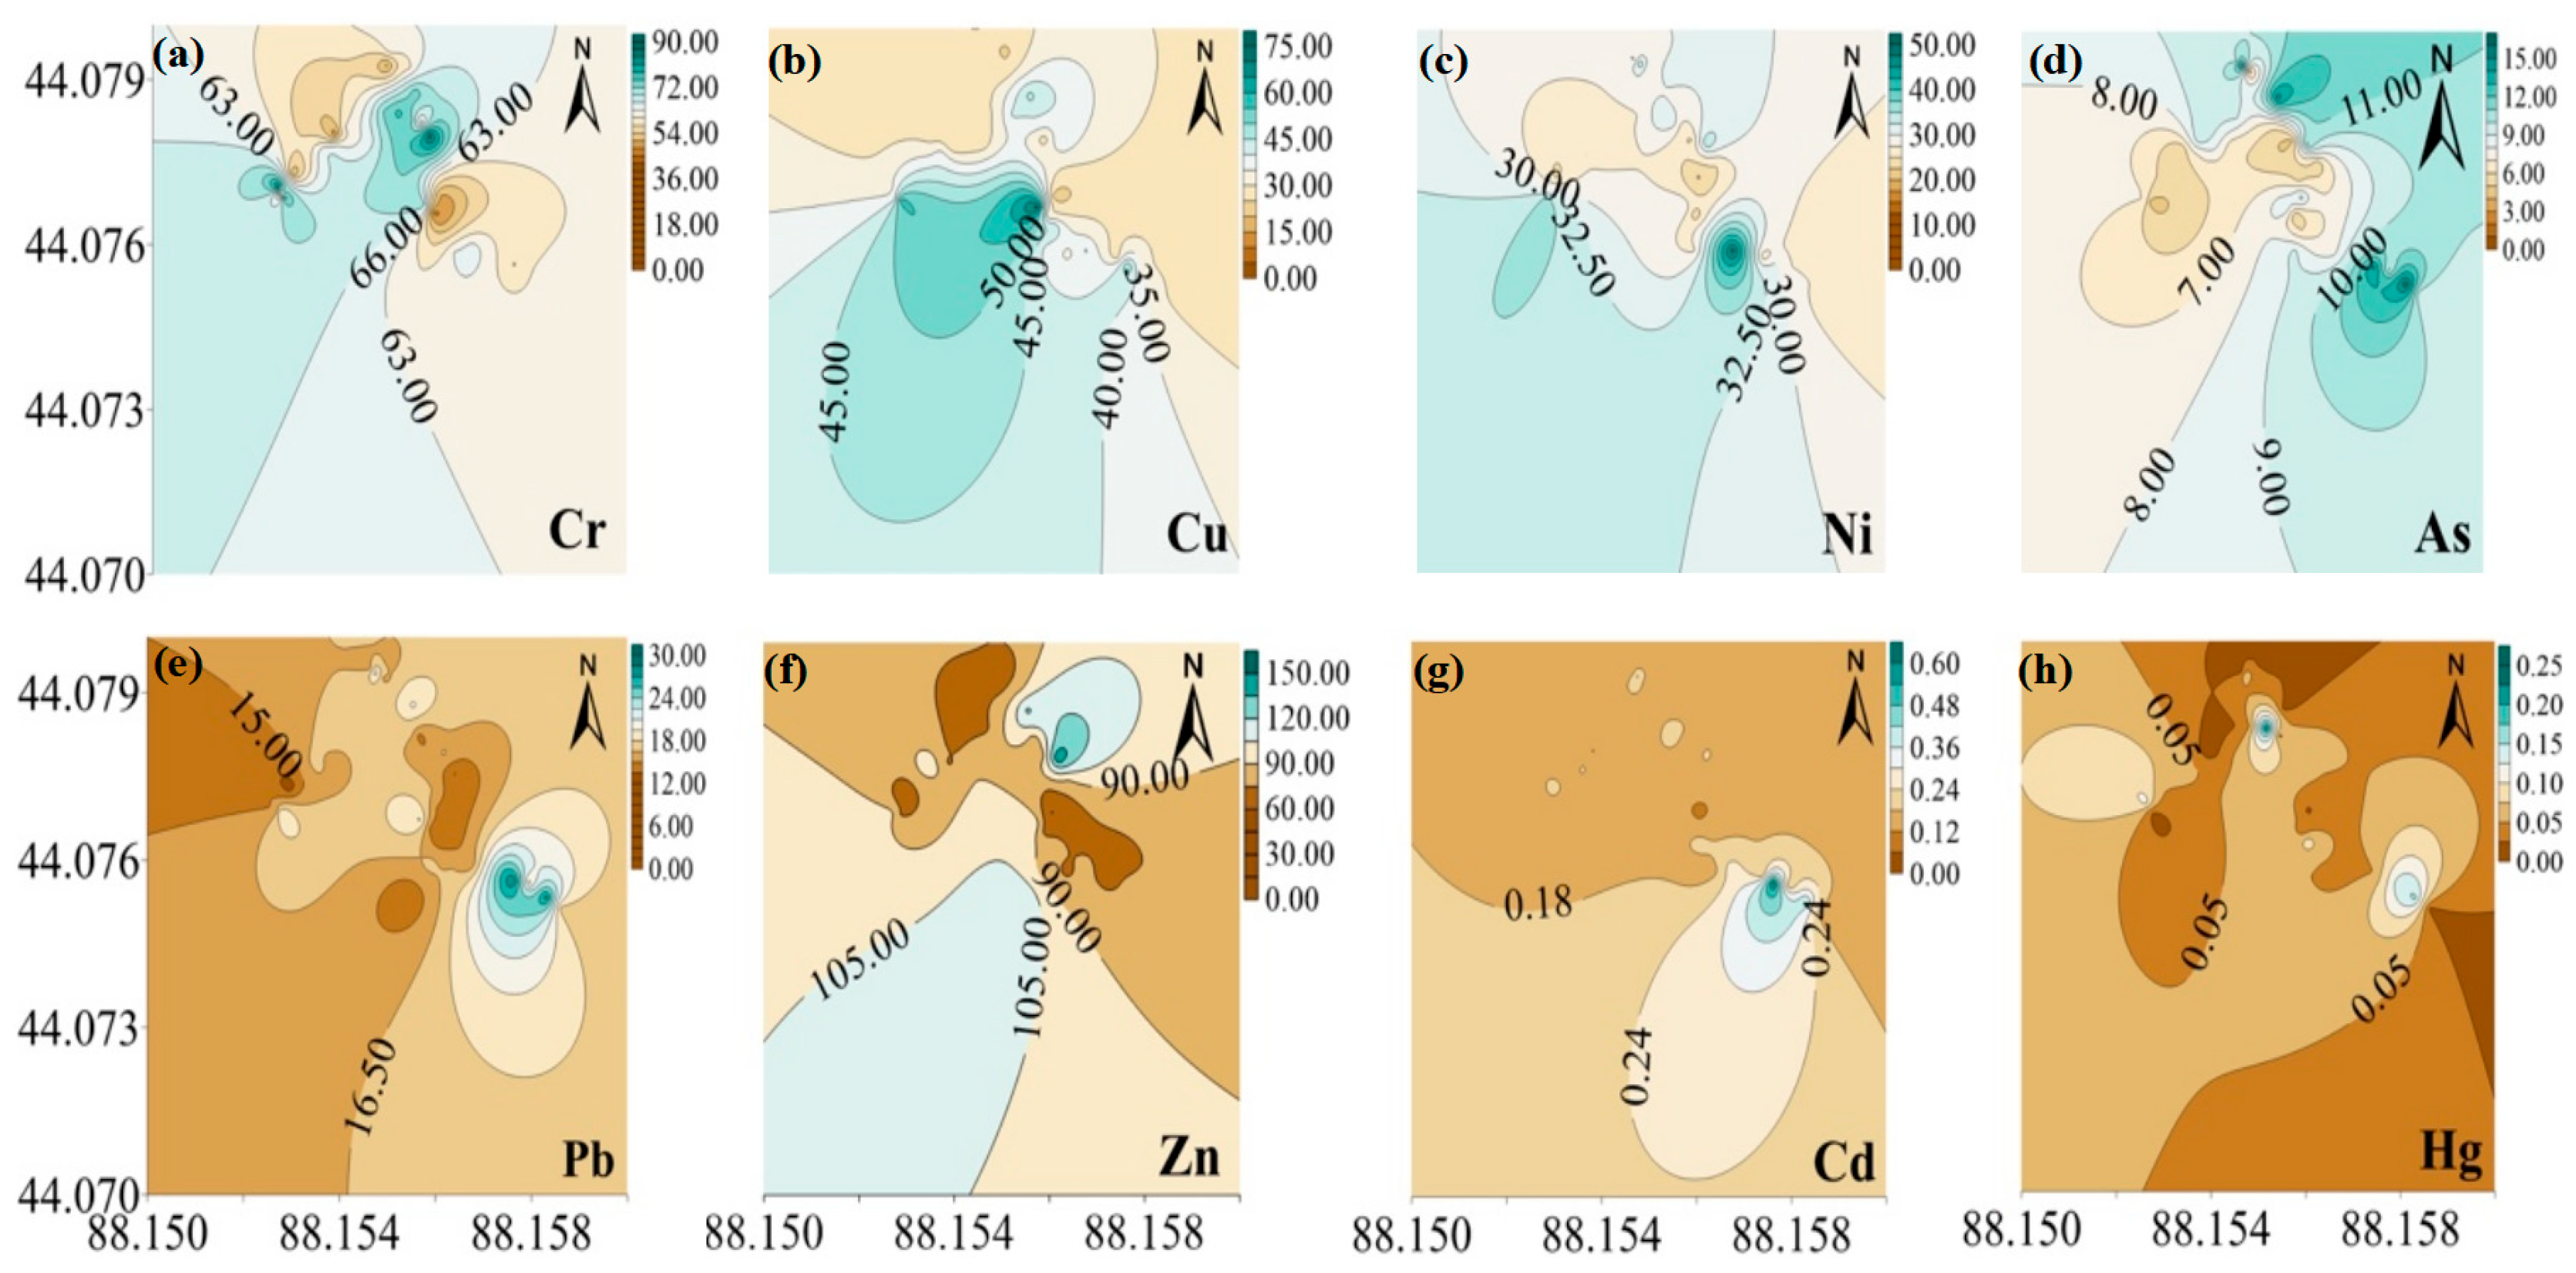
The spatial distribution of soil heavy metal concentrations was created using Surfer software V15 (Figure 3). The analysis reveals substantial variations in the high-value areas of different elements. Excluding Pb and As, which are below background levels, Cr, Cu, and Ni exhibit a distinct patchy aggregation effect. Among these, the distributions of Cu and Ni are remarkably similar, with concentrations concentrated in the southwest (Figure 3b,c). Zn, Cd, and Hg also show some similarities in spatial distribution, with their high-value areas concentrated in a point-like distribution in the central parts (Figure 3e–h).

3.3. Correlation Analysis of Soil Chemical Properties and Heavy Metals

Soil nutrients and ions are not independent of one another; rather, they are interconnected and influence each other while following certain intrinsic patterns. The correlation between soil nutrients and the eight major ions is shown in Figure 4a. It is evident that the correlation between Ca2+ and SO42− is the highest, reaching 0.89. This may be due to the release of sulfur from the coal seam in the form of hydrogen sulfide during coal combustion. When these hydrogen sulfide gases are not completely burned, they can produce sulfur, which can then be oxidized to sulfate ions in the presence of microorganisms, high temperatures, or alkaline conditions, significantly increasing its concentration in the soil. Additionally, in coal fire areas, minerals in the soil (such as gypsum or other calcium-containing minerals) may dissolve due to high temperatures or chemical reactions, releasing both calcium ions and sulfate ions. This phenomenon may lead to a simultaneous increase in the concentrations of both ions. Furthermore, soil pH is negatively correlated with Ca2+, Na+, Mg2+, Cl, and SO42− ions, while it demonstrates a strong positive correlation with HCO3, TN, and SOC content. Moreover, SOC content is significantly positively correlated with HCO3 and TN. This may be attributed to the thermal effects of coal fires, which cause soil organic matter to release organic acids during decomposition. These organic acids can react with minerals in the soil to form bicarbonate ions.
The soil’s chemical properties can affect the adsorption, migration, and availability of heavy metals [58,59]. To investigate the relationship between heavy metal distribution and soil chemical properties, a correlation analysis was performed. The correlations among the eight heavy metals are primarily positive, with correlation coefficients for As-Cd, Pb-Cd, and Pb-As all exceeding 0.5, indicating a strong positive correlation (p < 0.05) (Figure 4b). This suggests a significant link between these elements during their movement in environmental media, possibly pointing to a common source. Soil pH shows a positive correlation with the concentrations of Cr, Cu, Zn, and Hg in the soil (Figure 4c). Soil pH significantly influences the activity of heavy metals, making it a key factor in soil fertility and plant growth [60,61]. Moreover, soil pH affects the solubility of soil minerals and the adsorption behavior of various ions in both the soil solution and solid phase [61,62]. The activity of Cd and As is primarily affected by soil organic carbon (SOC). SOC can influence metal concentrations through various mechanisms; as its levels rise, it alters the soil colloidal structure and enhances adsorption. Figure 4d shows that the correlation between Cd and available potassium (AK) is 0.77. Additionally, Figure 3d and Figure 4d reveal that their distributions are similar. In areas impacted by fire, plants may be affected by both potassium and cadmium. While absorbing potassium, plants might also take up cadmium, especially when soil cadmium levels are high. This co-absorption could strengthen the correlation between these two elements.

3.4. Risk Assessment

3.4.1. Soil Heavy Metal Pollution Assessment

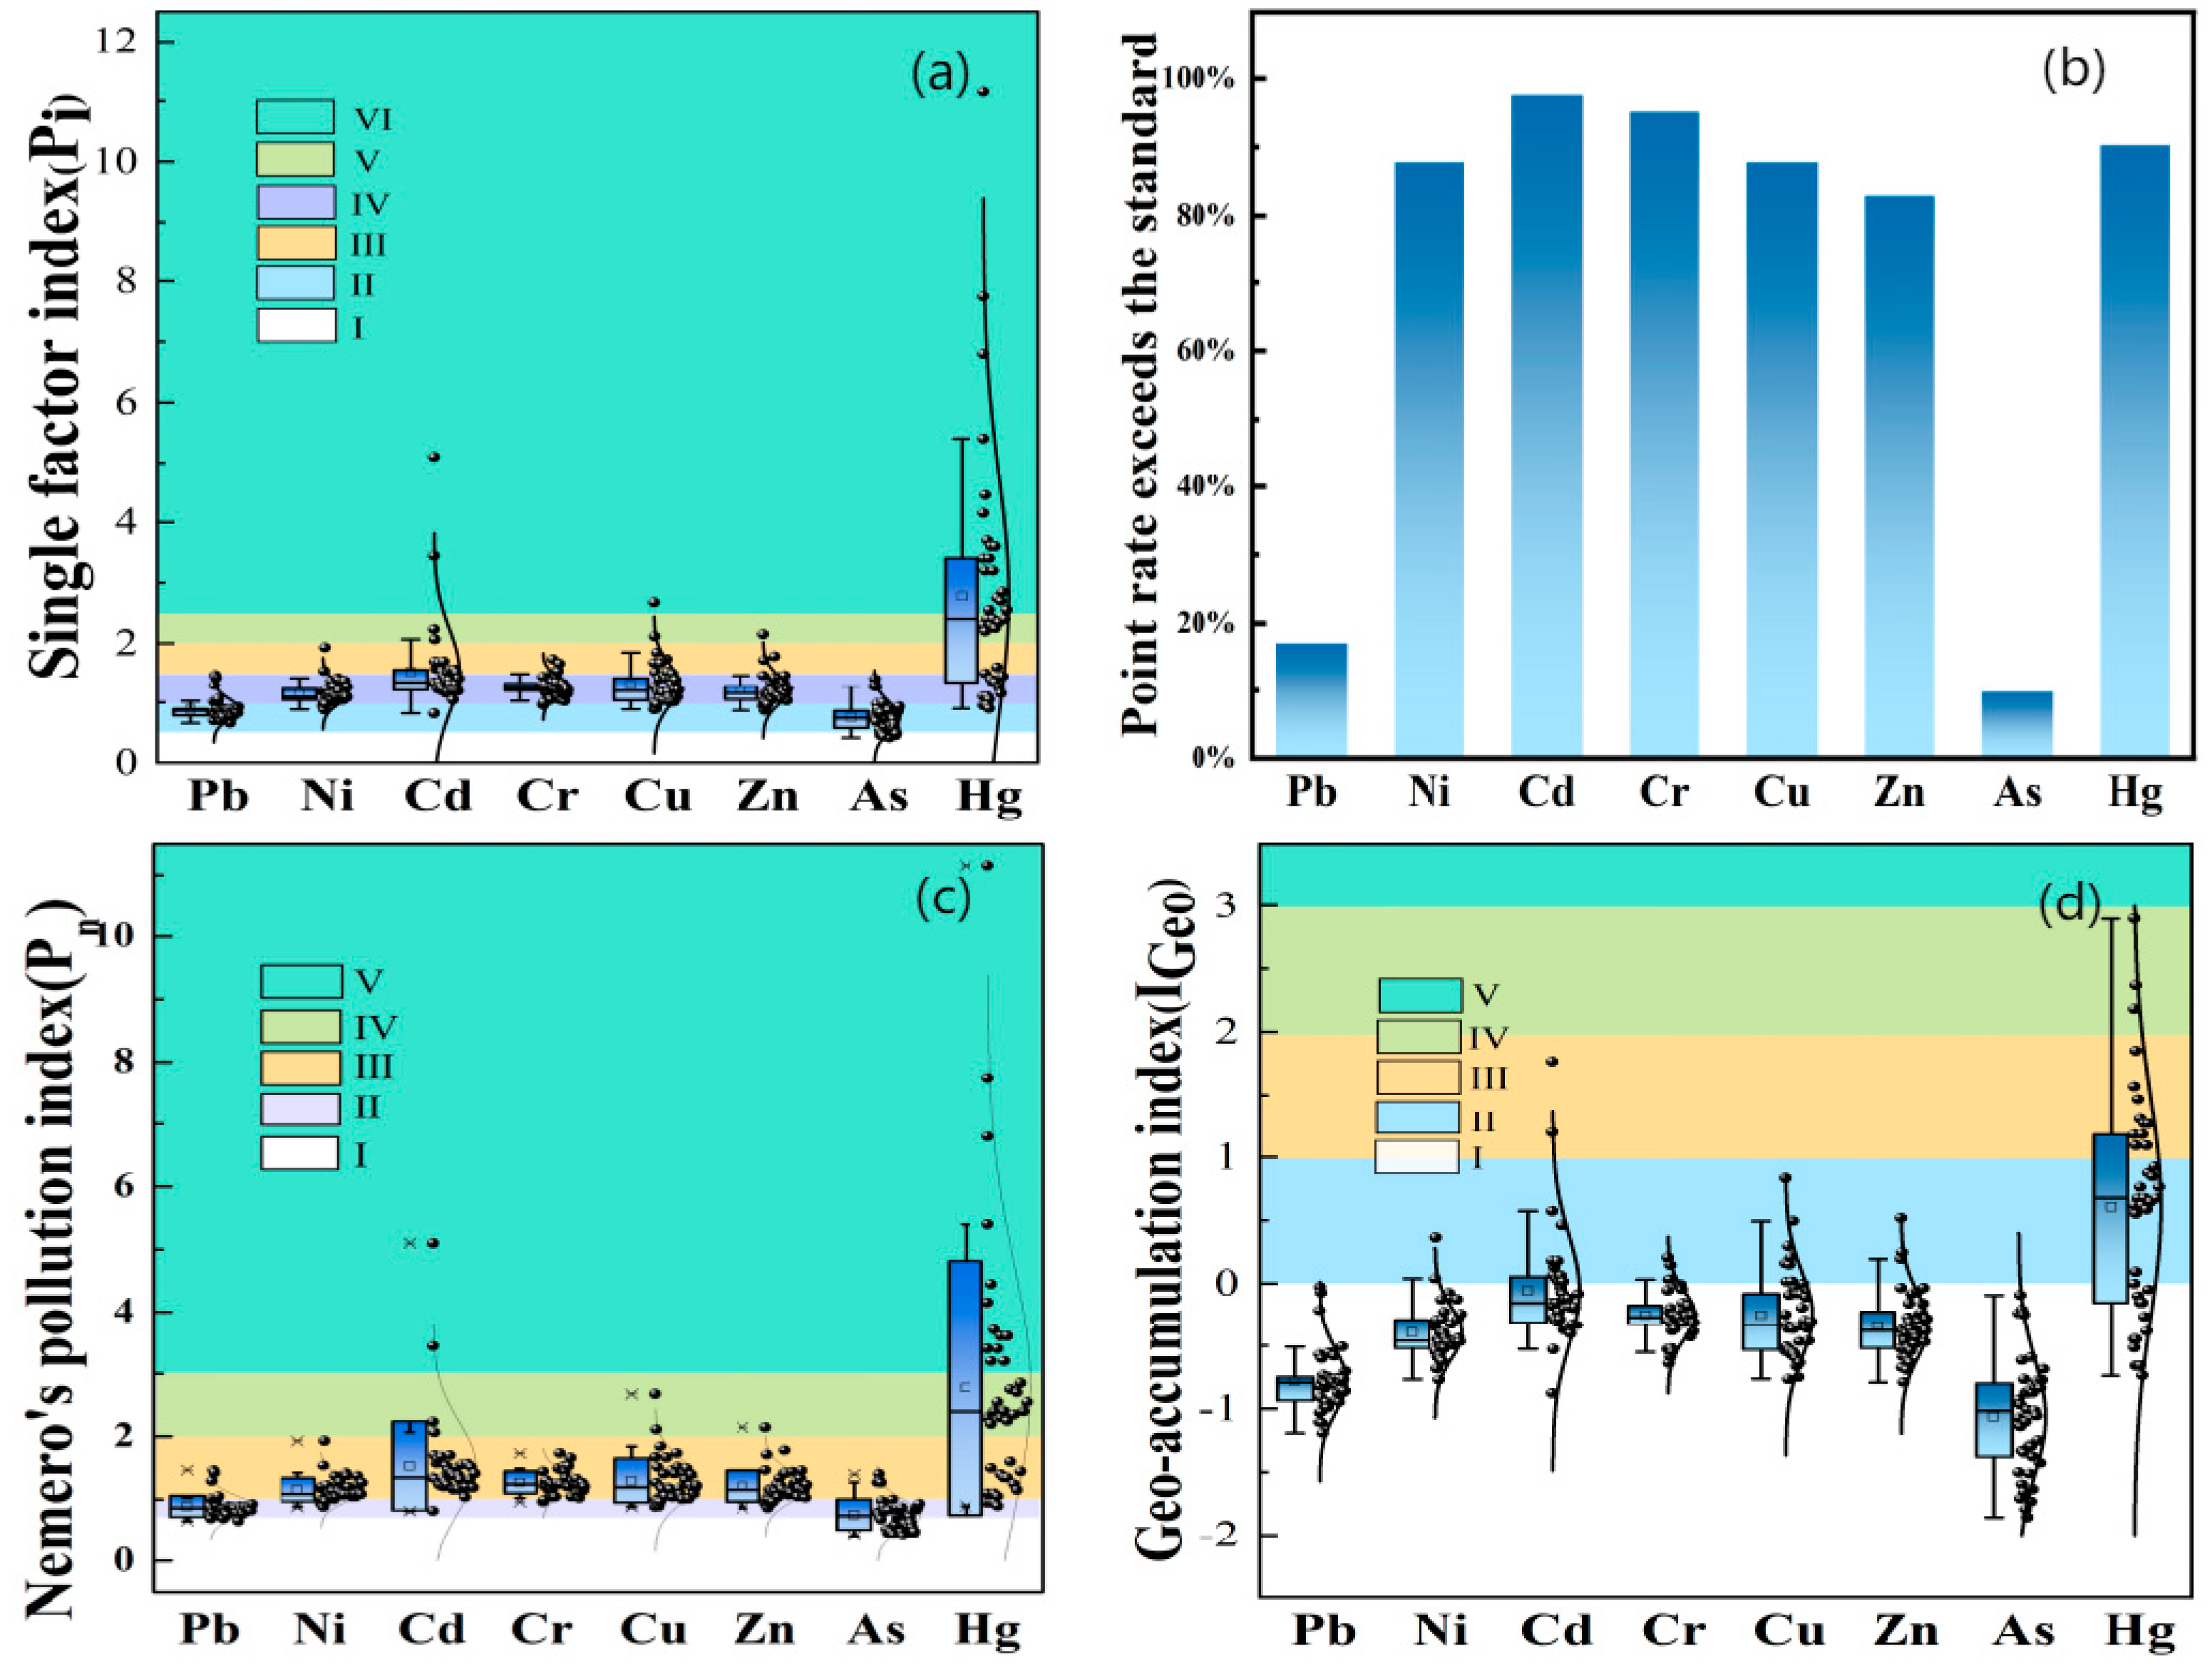
The single factor pollution index (Pi) results reveal that the average concentrations of heavy metals in the soil, from highest to lowest, are as follows: Hg (3.27) > Cd (1.53) > Cr (1.27) > Cu (1.30) > Zn (1.21) > Ni (1.09) > Pb (0.89) > As (0.75) (Figure 5a). Except for Pb and As, the average exceedance factors for Ni, Cd, Cr, Cu, Zn, and Hg are all above 1 (Table 4), with exceedance rates at sampling locations surpassing 80% (Figure 5b). This indicates a considerable potential for pollution from these six heavy metals. Among them, Hg shows the most severe pollution, with an exceedance rate of 90.20%, surpassing the background value by 10.15 times, indicating high pollution levels. The next are Cd, Cr, Cu, Zn, and Ni, indicating a mild pollution level.
Based on the average Geo-accumulation index (Igeo) values (Figure 5d), the pollution levels of the eight heavy metals, from highest to lowest, are as follows: Hg (0.61) > Cd (−0.05) > Cr (−0.25) = Cu (−0.25) > Zn (−0.33) > Ni (−0.39) > Pb (−0.78) > As (−1.06). Hg is categorized as lightly polluted, with some sampling points showing moderate to heavy pollution, while the average Igeo values for the other seven heavy metals are all below 0, indicating no pollution. This suggests that Hg in the soil of the study area exhibits varying degrees of pollution.
When comparing the two pollution evaluation methods mentioned above, it becomes clear that while the single factor pollution index (Pi) and the Geo-accumulation index (Igeo) provide different results regarding pollution levels, they both consistently identify Hg as the primary contaminant in the soil. This consistency arises because Pi reflects the current pollution status directly, whereas Igeo considers both human impacts and natural factors, which can moderate the pollution assessment, resulting in Igeo values that are slightly lower than those of Pi [63]. Overall, Hg pollution in the study area’s soil is notably severe.
To gain a clearer understanding of the spatial patterns of the primary pollutants, Hg and Cd, in the soil of the study area, spatial distribution maps of their pollution indices (Pi) were generated using Surfer software (Figure 6). The spatial distribution of the two elements shows significant similarity, with the exceedance areas concentrated near the center of the fire zone. This indicates a close relationship between coal combustion activities and the elevated levels of mercury and cadmium. Furthermore, within the boxed area in the figure, the regions of mild pollution for Cd and high pollution for Hg overlap, suggesting a potential common source of contamination for these two elements.
The findings from Nemero’s pollution index (Pn, Figure 5c) reveal that Pn values range from 1.14 to 9.68 (Table 4), with an average of 2.86, indicating an overall high pollution level. Among the sampling locations, 62.5% exhibit moderate pollution, 12.5% show high pollution (Cu), and 25% indicate heavy pollution (Cd, Hg) (Table 4). The pollution load index (PLI) results range from 0.79 to 2.66, with an average of 1.51 (Table 4), suggesting a mild pollution level. Overall, the results from Pn and PLI differ, with the pollution assessment from Pn appearing more severe. This discrepancy arises because Pn emphasizes the concentration of the most significant pollutants (such as heavy metals) in the soil, allowing for a more accurate reflection of their direct impact on the environment. In contrast, PLI is based on the average levels of multiple pollutants, which may dilute the effects of certain severe contaminants.
Additionally, areas with mild or lower pollution levels are mainly concentrated in the upwind or sidewind zones of the fire area. Soil pollution levels in the downwind region are significantly higher than in the upwind region, likely due to the continuous accumulation of heavy metals driven by prevailing winds.

3.4.2. Potential Ecological Risk Assessment

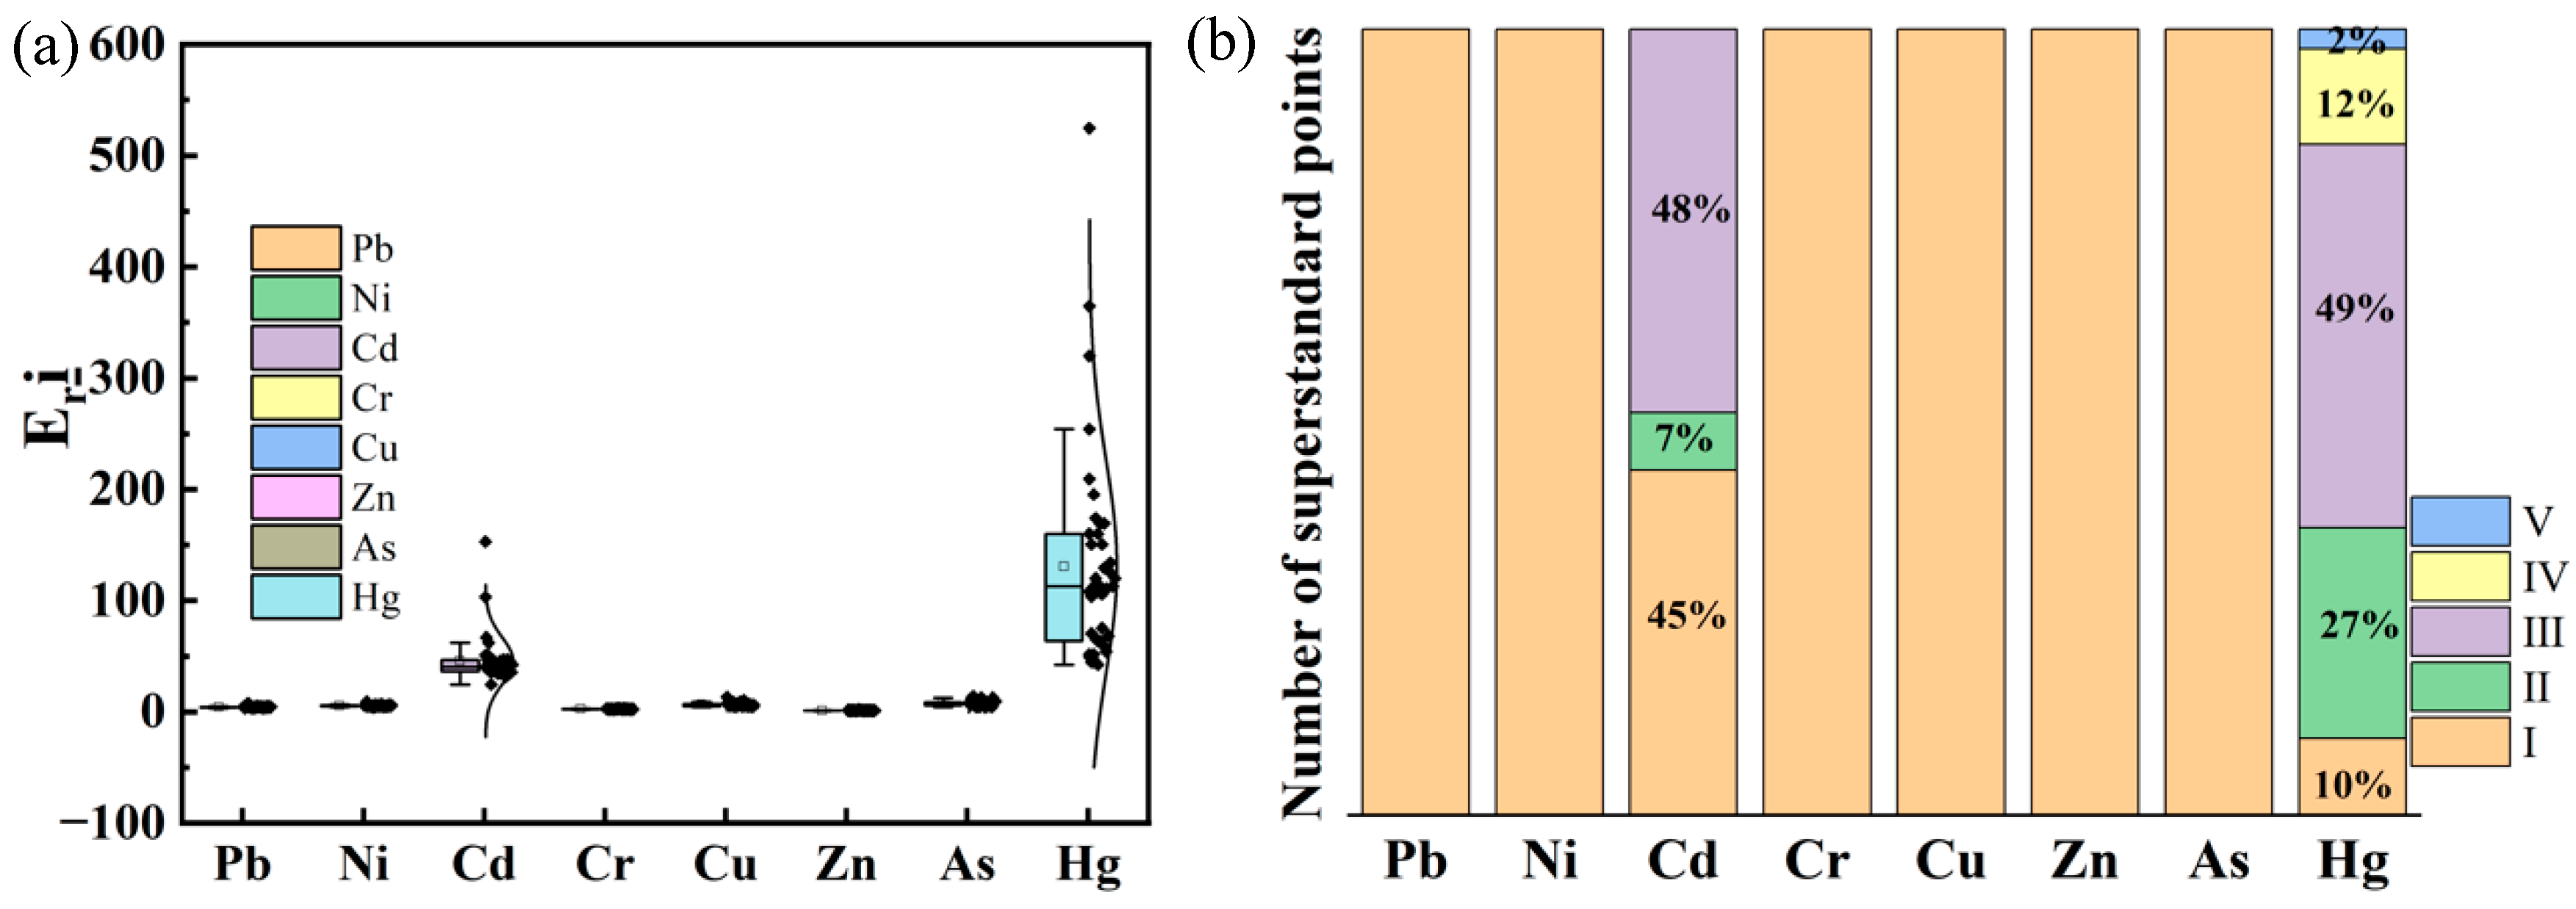
According to the evaluation results of the potential ecological risk factor (Eri) (Table 4, Figure 7a), the total Eri scores for As, Cr, Zn, Ni, Pb, and Cu in the study area are all below 40, indicating low ecological risk. In contrast, the Eri values for Hg and Cd are 111.07 and 45.91, respectively, categorizing them as high ecological risk and moderate ecological risk factors. Among all sampling points, the proportion of sites with mild ecological risk for these two heavy metals is 10% for Hg and 45% for Cd, while the proportions of sites with moderate ecological risk are 27% for Hg and 7% for Cd. The proportion of sampling points with high ecological risk is approximately 48% to 49%. Notably, for Hg (Figure 7b), 12% of the sampling points are categorized as having high ecological risk, while 2% are classified as having significantly high ecological risk. The RI value stands at 184.98; this finding indicates that the ecological risk induced by heavy metals in the soil of the Wugong coal fire area has reached a moderate level.
Overall, Hg and Cd emerge as the primary ecological risk factors in the study area’s soil, with their risk levels reaching high and moderate risks, respectively, which is consistent with previous research [64]. The high ecological toxicity coefficients of Hg and Cd are the primary drivers behind the elevated ecological risk index. Moreover, most soil samples in the study area exhibited Hg and Cd concentrations exceeding background levels, consequently raising the regional risk index to a moderate risk level.

4. Conclusions

This study investigated the nutrient levels, concentrations of eight primary ions, heavy metal content, and their interrelationships in soil samples from the Wugong coal fire area, along with potential pollution and ecological risk assessments. The soil was predominantly alkaline, with extremely low levels of TN, TP, SOC, and AK. The average contents of Cu, Cr, Ni, Hg, Cd, and Zn exceeded the background values for heavy metals in local soils. Soil pH showed positive correlations with Cr, Cu, Zn, and Hg contents, while organic carbon primarily influenced the activity of Cd and As. The eight heavy metals demonstrate overall positive correlations, indicating a common pollution source. Heavy metals exhibited a patchy distribution associated with Cr, Cu, and Ni, with Zn, Cd, and Hg concentrated in specific locations. Pollution assessment revealed contamination of Hg, Cd, Cr, Cu, Zn, and Ni in the coal fire area soils, with Hg pollution being the highest, reaching a severe contamination level. The risk evaluation identified Hg and Cd as the primary ecological risk factors, with risk levels classified as high and moderate, respectively. The risk index (RI) assessment concluded that heavy metal ecological risks in the Wugong coal fire area have reached a moderate level. This research provides valuable insights for future coalfield environmental management, risk control, and ecological restoration.
The findings provide actionable insights for ecological restoration, where the risk hierarchy (Hg > Cd) and spatial contamination patterns enable prioritized remediation zoning. The pH–metal correlations and nutrient stoichiometric imbalances inform targeted strategies for alkaline soil amendment and organic fertilization. However, surface sampling limits understanding of vertical contaminant transport dynamics. Future studies should address deep soil profiling to quantify leaching risks, while extending to heavy metal speciation analysis and isotopic source tracing to optimize remediation protocols in coal fire-impacted area.

Author Contributions

R.H.: Conceptualization, Methodology, Writing—Original Draft. Q.Z.: Conceptualization, Supervision, Funding Acquisition, Writing—Review and Editing. T.R.: Supervision, Writing—Review and Editing. S.W.: Data Processing. H.L.: Supervision. All authors have read and agreed to the published version of the manuscript.

Funding

This research was supported by the Tianshan Leading Talent Project (grant number 2023TSYCLJ-0003), the key R&D Project (grant number 2022B03025-4), and the Tianshan Innovative Team Project “Control of Coal Fire” (grant number 2021D14018) funded by the Xinjiang Department of Science and Technology of China and the China Scholarship Council. And the APC was funded by Xinjiang Department of Science and Technology of China.

Institutional Review Board Statement

Not applicable.

Informed Consent Statement

Not applicable.

Data Availability Statement

The raw data supporting the conclusions of this article will be made available by the authors on request.

Conflicts of Interest

The authors declare that they have no known competing financial interests or personal relationships that could have appeared to influence the work reported in this paper.

References

  1. Song, Z.; Kuenzer, C. Coal fires in China over the last decade: A comprehensive review. Int. J. Coal Geol. 2014, 133, 72–99. [Google Scholar] [CrossRef]
  2. Liang, Y.; Yang, Y.; Guo, S.; Tian, F.; Wang, S. Combustion mechanism and control approaches of underground coal fires: A review. Int. J. Coal Sci. Technol. 2023, 10, 24. [Google Scholar] [CrossRef]
  3. Zeng, Q.; Dong, J.; Zhao, L. Investigation of the potential risk of coal fire to local environment: A case study of Daquanhu coal fire, Xinjiang region, China. Sci. Total Environ. 2018, 640–641, 1478–1488. [Google Scholar] [CrossRef] [PubMed]
  4. Bian, Z.; Inyang, H.I.; Daniels, J.L.; Otto, F.; Struthers, S. Environmental issues from coal mining and their solutions. Min. Sci. Technol. 2010, 20, 215–223. [Google Scholar] [CrossRef]
  5. Guo, J.; Wen, H.; Zheng, X.; Liu, Y.; Cheng, X. A method for evaluating the spontaneous combustion of coal by monitoring various gases. Process Saf. Environ. Prot. 2019, 126, 223–231. [Google Scholar] [CrossRef]
  6. Sun, R.; Cao, F.; Dai, S.; Shan, B.; Qi, C.; Xu, Z.; Li, P.; Liu, Y.; Zheng, W.; Chen, J. Atmospheric Mercury Isotope Shifts in Response to Mercury Emissions from Underground Coal Fires. Environ. Sci. Technol. 2023, 57, 8638–8649. [Google Scholar] [CrossRef]
  7. Zhang, Y.; Hu, S.R.; Yue, T.; Zhang, X.Q.; Yu, M.D.; Li, X.F. Environmental effect analysis of coalfield fire in Xinjiang and its preventive. Adv. Mater. Res. 2014, 1010, 601–605. [Google Scholar] [CrossRef]
  8. Kamran, M.; Wattimena, R.K.; Armaghani, D.J.; Asteris, P.G.; Jiskani, I.M.; Mohamad, E.T. Intelligent based decision-making strategy to predict fire intensity in subsurface engineering environments. Process Saf. Environ. Prot. 2023, 171, 374–384. [Google Scholar] [CrossRef]
  9. Zerizghi, T.; Guo, Q.; Tian, L.; Wei, R.; Zhao, C. An integrated approach to quantify ecological and human health risks of soil heavy metal contamination around coal mining area. Sci. Total Environ. 2022, 814, 152653. [Google Scholar] [CrossRef]
  10. Saha, A.; Sen Gupta, B.; Patidar, S.; Hernández-Martínez, J.L.; Martín-Romero, F.; Meza-Figueroa, D.; Martínez-Villegas, N. A comprehensive study of source apportionment, spatial distribution, and health risks assessment of heavy metal(loid)s in the surface soils of a semi-arid mining region in Matehuala, Mexico. Environ. Res. 2024, 260, 119619. [Google Scholar] [CrossRef]
  11. Shen, C.; Huang, S.; Wang, M.; Wu, J.; Su, J.; Lin, K.; Chen, X.; He, T.; Li, Y.; Sha, C.; et al. Source-oriented health risk assessment and priority control factor analysis of heavy metals in urban soil of Shanghai. J. Hazard. Mater. 2024, 480, 135859. [Google Scholar] [CrossRef]
  12. Qiao, P.; Wang, S.; Li, J.; Zhao, Q.; Wei, Y.; Lei, M.; Yang, J.; Zhang, Z. Process, influencing factors, and simulation of the lateral transport of heavy metals in surface runoff in a mining area driven by rainfall: A review. Sci. Total Environ. 2023, 857, 159119. [Google Scholar] [CrossRef]
  13. Singh, V.; Singh, N.; Rai, S.N.; Kumar, A.; Singh, A.K.; Singh, M.P.; Sahoo, A.; Shekhar, S.; Vamanu, E.; Mishra, V. Heavy Metal Contamination in the Aquatic Ecosystem: Toxicity and Its Remediation Using Eco-Friendly Approaches. Toxics 2023, 11, 147. [Google Scholar] [CrossRef]
  14. Wang, F.; Huo, L.; Li, Y.; Wu, L.; Zhang, Y.; Shi, G.; An, Y. A hybrid framework for delineating the migration route of soil heavy metal pollution by heavy metal similarity calculation and machine learning method. Sci. Total Environ. 2023, 858, 160065. [Google Scholar] [CrossRef]
  15. Chen, Y.; Liu, D.; Ma, J.; Jin, B.; Peng, J.; He, X. Assessing the influence of immobilization remediation of heavy metal contaminated farmland on the physical properties of soil. Sci. Total Environ. 2021, 781, 146773. [Google Scholar] [CrossRef] [PubMed]
  16. Chen, Y.; Zhao, H.X.; Xie, Z.H.; Huang, H.Y.; Zang, S.Y.; Lian, B. Heavy Metal Pollution Characteristics in the Kaili Coal Mining Region, Guizhou Province, China. J. Residuals Sci. Technol. 2015, 12, S123–S131. [Google Scholar] [CrossRef]
  17. Nuralykyzy, B.; Wang, P.; Deng, X.; An, S.; Huang, Y. Heavy Metal Contents and Assessment of Soil Contamination in Different Land-Use Types in the Qaidam Basin. Sustainability 2021, 13, 12020. [Google Scholar] [CrossRef]
  18. Zhang, Y.; Wang, F.; Zhu, L.; Zhuo, J.; Hu, S. Analysis of the Environmental Impact of Coalfield Fires. Coal Saf. 2024, 55, 132–142. [Google Scholar]
  19. Zhang, H.; Zhang, F.; Song, J.; Tan, M.L.; Kung, H.-T.; Johnson, V.C. Pollutant source, ecological and human health risks assessment of heavy metals in soils from coal mining areas in Xinjiang, China. Environ. Res. 2021, 202, 111702. [Google Scholar] [CrossRef] [PubMed]
  20. Dong, Y.; Lu, H.; Lin, H. Comprehensive study on the spatial distribution of heavy metals and their environmental risks in high-sulfur coal gangue dumps in China. J. Environ. Sci. 2024, 136, 486–497. [Google Scholar] [CrossRef]
  21. Lin, M.L.; Hu, Z.Q.; Peng, W.H.; Ye, W.L.; Zhang, C.L.; Huang, X.R.; Chen, S.; Gui, H.R. Pollution Assessment and Source Apportionment of Heavy Metals in the Surrounding Soil of Typical Mining Areas in Tongling, Anhui Province. Environ. Sci. 2024, 45, 5494–5505. [Google Scholar]
  22. Liang, Y.; Liang, H.; Zhu, S. Mercury emission from coal seam fire at Wuda, Inner Mongolia, China. Atmos. Environ. 2014, 83, 176–184. [Google Scholar] [CrossRef]
  23. Zeng, Q.; Nie, J.; Pu, Y. Characteristics of the distribution of typical heavy metals in the soils of underground coal fire. J. China Coal Soc. 2016, 41, 1989–1996. [Google Scholar]
  24. Zeng, Q.; Tiyip, T.; Wuttke, M.W.; Kurban, B. Characteristics of the heavy metal distribution in the soils of underground coal fire and the evaluation of its impact on environment. J. China Univ. Min. Technol. 2014, 43, 695–700. [Google Scholar]
  25. Sazawa, K.; Sugano, T.; Kuramitz, H. High-heat Effects on the Physical and Chemical Properties of Soil Organic Matter and Its Water-soluble Components in Japan’s Forests: A Comprehensive Approach Using Multiple Analytical Methods. Anal. Sci. 2020, 36, 601–605. [Google Scholar] [CrossRef]
  26. Zhang, T.; Xu, J.; Zeng, J.; Lou, K. Diversity of prokaryotes associated with soils around coal-fire gas vents in MaNasi county of Xinjiang, China. Antonie Van Leeuwenhoek 2013, 103, 23–36. [Google Scholar] [CrossRef]
  27. Yang, D.; Bian, Z.; Lei, S. Impact on soil physical qualities by the subsidence of coal mining: A case study in Western China. Environ. Earth Sci. 2016, 75, 652. [Google Scholar] [CrossRef]
  28. Yi, Q.; Xie, K.; Sun, P.; Kim, Y. Characterization of phosphorus in the sedimentary environments of inundated agricultural soils around the Huainan Coal Mines, Anhui, China. Sci. Total Environ. 2014, 472, 538–549. [Google Scholar] [CrossRef] [PubMed]
  29. Liu, X.; Bai, Z.; Zhou, W.; Cao, Y.; Zhang, G. Changes in soil properties in the soil profile after mining and reclamation in an opencast coal mine on the Loess Plateau, China. Ecol. Eng. 2017, 98, 228–239. [Google Scholar] [CrossRef]
  30. Zhang, C.; He, F.; Wang, Z.Y.; Yuan, M.Y.; Lai, P.M.; Guo, J.K. Pollution Characteristics, Source Analysis, and Health Risk Assessment of Heavy Metals in Soil and Crops in a Typical molybdenum Mining Area of Qinling Mountains. Environ. Sci. 2024, 45, 5526–5537. [Google Scholar]
  31. Ma, J.; Ni, Q. Determination of Copper, Zinc, Lead, Nickel, and Manganese in Soils by Microwave Digestion-Flame Atomic Absorption Spectrometry. Guangzhou Chem. Ind. 2006, 34, 2. [Google Scholar]
  32. Gyamfi, E.; Appiah-Adjei, E.K.; Adjei, K.A. Potential Heavy Metal Pollution of Soil and Water Resources from Artisanal Mining in Kokoteasua, Ghana. Groundw. Sustain. Dev. 2019, 8, 450–456. [Google Scholar] [CrossRef]
  33. Lai, S.-Y.; Dong, Q.-Y.; Song, C.; Yang, Z.-J. Distribution Characteristics and Ecological Risk Assessment of Soil Heavy Metals in the Eastern Mountainous Area of the Nanyang Basin. Environ. Sci. 2021, 42, 5500–5509. [Google Scholar]
  34. Hakanson, L. An ecological risk index for aquatic pollution control.a sedimentological approach. Water Res. 1980, 14, 975–1001. [Google Scholar] [CrossRef]
  35. Li, H.; Qian, X.; Hu, W.; Wang, Y.; Gao, H. Chemical speciation and human health risk of trace metals in urban street dusts from a metropolitan city, Nanjing, SE China. Sci. Total Environ. 2013, 456–457, 212–221. [Google Scholar] [CrossRef] [PubMed]
  36. Ferreira, S.L.C.; da Silva, J.B.; dos Santos, I.F.; de Oliveira, O.M.C.; Cerda, V.; Queiroz, A.F.S. Use of pollution indices and ecological risk in the assessment of contamination from chemical elements in soils and sediments—Practical aspects. Trends Environ. Anal. Chem. 2022, 35, e00169. [Google Scholar] [CrossRef]
  37. Tomlinson, D.L.; Wilson, J.G.; Harris, C.R.; Jeffrey, D.W. Problems in the assessment of heavy-metal levels in estuaries and the formation of a pollution index. Helgoländer Meeresunters. 1980, 33, 566–575. [Google Scholar] [CrossRef]
  38. Kowalska, J.B.; Mazurek, R.; Gąsiorek, M.; Zaleski, T. Pollution indices as useful tools for the comprehensive evaluation of the degree of soil contamination–A review. Environ. Geochem. Health 2018, 40, 2395–2420. [Google Scholar] [CrossRef] [PubMed]
  39. Maurya, P.; Kumari, R. Toxic metals distribution, seasonal variations and environmental risk assessment in surficial sediment and mangrove plants (A. marina), Gulf of Kachchh (India). J. Hazard. Mater. 2021, 413, 125345. [Google Scholar] [CrossRef] [PubMed]
  40. Xu, Z.; Ni, S.; Tu, X.; Zhang, C. Calculation of Heavy Metal Toxicity Coefficients in the Potential Ecological Hazard Index Method. Environ. Sci. Technol. 2008, 2, 112–115. [Google Scholar]
  41. Cheng, H.; Li, K.; Li, M.; Yang, K.; Liu, F.; Cheng, X. Geochemical Background and Baseline Values of Chemical Elements in Urban Soils of China. Earth Sci. Front. 2014, 21, 265–306. [Google Scholar]
  42. Niu, S.; Gao, L.; Zhao, J. Distribution and Risk Assessment of Heavy Metals in the Xinzhuangzi Reclamation Soil from the Huainan Coal Mining Area, China. Hum. Ecol. Risk Assess. Int. J. 2015, 21, 900–912. [Google Scholar] [CrossRef]
  43. Yu, Q.; Wen, J.; Zhang, S.; Wu, C.; Ouyang, H.; Hu, N.; Li, X.; Qiu, X. The coupling of sulfide and Fe-Mn mineral promotes the migration of lead and zinc in the redox cycle of high pH floodplain soils. J. Hazard. Mater. 2024, 472, 134546. [Google Scholar] [CrossRef]
  44. Zhong, X.; Chen, Z.; Li, Y.; Ding, K.; Liu, W.; Liu, Y.; Yuan, Y.; Zhang, M.; Baker, A.J.M.; Yang, W.; et al. Factors influencing heavy metal availability and risk assessment of soils at typical metal mines in Eastern China. J. Hazard. Mater. 2020, 400, 123289. [Google Scholar] [CrossRef]
  45. Zhang, Z.; Sui, W.; Wang, K.; Tang, G.; Li, X. Changes in Particle Size Composition under Seepage Conditions of Reclaimed Soil in Xinjiang, China. Processes 2018, 6, 201. [Google Scholar] [CrossRef]
  46. Mao, X.-R.; Wang, M.-L.; Yang, J.-J.; Ding, Z.-L.; Cao, Y.-E. Effect of coal mining activities on soil properties and erodibility. Southwest China J. Agric. Sci. 2020, 33, 2537–2544. [Google Scholar]
  47. Wang, Z.; Wang, H.; Feng, X.; Wang, X.; Zhang, L.; Fu, B. Evaluation index system of comprehensive benefits of ecological restoration in key ecologically vulnerable regions. Acta Ecol. Sin. 2019, 39, 7356–7366. [Google Scholar] [CrossRef]
  48. Wang, N.; Liu, Z.; Sun, Y.; Lu, N.; Luo, Y. Analysis of soil fertility and toxic metal characteristics in open-pit mining areas in northern Shaanxi. Sci. Rep. 2024, 14, 2273. [Google Scholar] [CrossRef] [PubMed]
  49. Zhu, Z.; Yao, B.-L.; Li, N.; Cai, G.-X.; Han, Q.-S. Effects of soil film residue on seedling emergence rate and salinity of cotton under brackish water irrigation. Water Sav. Irrig. 2021, 3, 7–11. [Google Scholar]
  50. Shen, W.; Hu, Y.; Zhang, J.; Zhao, F.; Bian, P.; Liu, Y. Spatial distribution and human health risk assessment of soil heavy metals based on sequential Gaussian simulation and positive matrix factorization model: A case study in irrigation area of the Yellow River. Ecotoxicol. Environ. Saf. 2021, 225, 112752. [Google Scholar] [CrossRef]
  51. Yuan, T.; Wang, Z.-Q.; Wang, X.-Y.; Ma, Y.; Han, Y.; Zhang, Z. Buffer analysis of heavy metal ecological risk in the Hongshaquan mining area of East Junggar Basin. Chin. J. Soil Sci. 2020, 51, 227–233. [Google Scholar]
  52. Alfaro, M.R.; Montero, A.; Ugarte, O.M.; do Nascimento, C.W.A.; de Aguiar Accioly, A.M.; Biondi, C.M.; da Silva, Y.J.A.B. Background concentrations and reference values for heavy metals in soils of Cuba. Environ. Monit. Assess. 2014, 187, 4198. [Google Scholar] [CrossRef]
  53. Martínez-Villegas, N.; Hernández, A.; Meza-Figueroa, D.; Sen Gupta, B. Distribution of Arsenic and Risk Assessment of Activities on Soccer Pitches Irrigated with Arsenic-Contaminated Water. Int. J. Environ. Res. Public Health 2018, 15, 1060. [Google Scholar] [CrossRef]
  54. Gjoka, F.; Duering, R.-A.; Siemens, J. Background concentrations and spatial distribution of heavy metals in Albania’s soils. Environ. Monit. Assess. 2022, 194, 115. [Google Scholar] [CrossRef]
  55. Saha, A.; Gupta, B.S.; Patidar, S.; Martínez-Villegas, N. Evaluation of Potential Ecological Risk Index of Toxic Metals Contamination in the Soils. Chem. Proc. 2022, 10, 59. [Google Scholar] [CrossRef]
  56. Alloway, B.J. Heavy Metals in Soils: Trace Metals and Metalloids in Soils and Their Bioavailability; Springer Science & Business Media: Berlin/Heidelberg, Germany, 2012. [Google Scholar]
  57. Ogundele, D.; Adio, A.; Oludele, O. Heavy metal concentrations in plants and soil along heavy traffic roads in North Central Nigeria. J. Environ. Anal. Toxicol. 2015, 5, 1. [Google Scholar]
  58. Zhao, K.; Zhang, L.; Dong, J.; Wu, J.; Ye, Z.; Zhao, W.; Ding, L.; Fu, W.J. Risk assessment, spatial patterns and source apportionment of soil heavy metals in a typical Chinese hickory plantation region of southeastern China. Geoderma 2020, 360, 114011. [Google Scholar] [CrossRef]
  59. Bian, F.; Zhong, Z.; Zhang, X.; Yang, C. Phytoremediation potential of moso bamboo (Phyllostachys pubescens) intercropped with Sedum plumbizincicola in metal-contaminated soil. Environ. Sci. Pollut. Res. 2017, 24, 27244–27253. [Google Scholar] [CrossRef]
  60. Friedlova, M. The influence of heavy metals on soil biological and chemical properties. Soil Water Res. 2010, 5, 21–27. [Google Scholar] [CrossRef]
  61. Lü, J.; Jiao, W.-B.; Qiu, H.-Y.; Chen, B.; Huang, X.-X.; Kang, B. Origin and spatial distribution of heavy metals and carcinogenic risk assessment in mining areas at You’xi County southeast China. Geoderma 2018, 310, 99–106. [Google Scholar] [CrossRef]
  62. Delle Site, A. Factors affecting sorption of organic compounds in natural sorbent/water systems and sorption coefficients for selected pollutants. A review. J. Phys. Chem. Ref. 2001, 30, 187–439. [Google Scholar] [CrossRef]
  63. Jia, H.; Liu, J.-X.; Wang, X.-G.; Ju, L.-X.; He, X.; Zhou, J.-W.; Zhang, Y. Pollution characteristics and sources of heavy metals in soil of a typical pyrite concentrated mining area in Anhui Province. Environ. Sci. 2023, 44, 5275–5287. [Google Scholar]
  64. Liu, Z.; Dong, Y.; Zhang, X.; Qing, C. Contamination and ecological risk assessment of heavy metals in the soil of agricultural land in Weining Plain, northwest China. Ecol. Environ. Sci. 2022, 31, 2216–2224. [Google Scholar]
Figure 1. Study area and distribution of sampling sites.
Fire 08 00385 g001
Figure 2. Spatial distribution of soil chemical parameters ((a) soil organic content, (b) total nitrogen, (c) total phosphorus, (d) available potassium, (e) pH value, (f) Ca2+, (g) HCO3−, (h) CI, (i) SO42−, (j) Na+, (k) CO32-, (l) Mg2+).
Fire 08 00385 g002
Figure 3. Spatial distribution maps of heavy metals in the study area ((a) Cr, (b) Cu, (c) Ni, (d) As, (e) Pb, (f) Zn, (g) Cd, (h) Hg).
Fire 08 00385 g003
Figure 4. Correlation analysis between heavy metals and soil chemical properties ((a) correlation within soil nutrients and chemical properties, (b) correlation within heavy metals, (c) correlation between soil nutrients and heavy metals, (d) correlation between soil chemical properties and heavy metals).
Fire 08 00385 g004
Figure 5. Evaluation results of soil heavy metal pollution ((a) Pi index, (b) exceedance of heavy metals at sampling sites, (c) Pn index, (d) Geo index).
Fire 08 00385 g005
Figure 6. Spatial distribution of the single factor pollution index evaluation of major heavy metal pollutants in soil ((a) distribution of Pi index for heavy metal Hg, (b) distribution of Pi index for heavy metal Cd).
Fire 08 00385 g006
Figure 7. (a) Statistical map of ecological risk assessment results; (b) histogram of the number of points exceeding the background value; I–V is the grades evaluated by ecological risk assessment.
Fire 08 00385 g007
Table 2. Descriptive statistics of the chemical properties of soil.
IndexMinimumMaximumMedianMean (Measured)Standard Deviation (SD)Coefficient of Variation (CV, %)
AK12.30403.8029.0042.3261.171.45
Ca2+29.902472.00769.10763.58679.690.89
Na+22.903881.20216.40621.75866.881.39
Mg2+6.001105.7088.00131.39183.351.40
CO32−0.000.010.000.000.003.60
HCO30.130.770.250.280.110.40
Cl0.001860.0054.30228.05410.051.80
SO42−67.808560.002380.003168.132873.190.91
TP0.160.890.650.630.150.24
TN0.1513.412.653.883.230.83
SOC1.60199.9910.5324.1037.421.55
pH5.608.527.337.460.640.09
Table 3. Descriptive statistics of the heavy metals.
IndexPbNiCdCrCuZnAsHg
Minimum12.7522.20.147.4623.5859.644.640.02
Maximum28.5248.640.6185.4771.4147.7915.770.22
Median16.8227.510.1661.4131.8879.438.30.05
Mean 17.2429.080.1862.6734.6883.388.450.06
Standard deviation (SD)3.314.70.088.559.417.12.740.04
Coefficient of variation (CV, %)13.6427.1220.5145.9619.2216.1573.2732.43
Background value (Xinjiang) [51]19.426.60.1249.326.768.811.20.017
Toxic response factor55302511040
Table 4. Heavy metal pollution and risk assessment by pollution indices.
MetalPbNiCdHg
IndicesPiIGeoPnEriPiIGeoPnEriPiIGeoPnEriPiIGeoPnEri
Mean0.89−0.781.224.441.09−0.391.515.771.27−0.053.7945.913.270.619.68111.07
Median0.87−0.791.214.331.03−0.461.495.461.25−0.153.7340.502.820.689.4996.00
Minimum0.66−1.191.143.290.83−0.771.424.400.96−0.883.6524.501.06−0.749.3136.00
Maximum1.47−0.031.477.351.830.361.839.651.731.775.10153.0013.122.8913.12446.00
SD0.170.240.070.850.180.210.070.930.170.440.2421.102.390.890.6881.38
MetalCrCuZnAs
IndicesPiIGeoPnEriPiIGeoPnEriPiIGeoPnEriPiIGeoPnEri
Mean1.53−0.251.522.541.30−0.252.116.491.21−0.331.751.210.75−1.061.147.54
Median1.35−0.271.512.491.19−0.332.075.971.15−0.381.731.150.74−1.021.137.41
Minimum0.82−0.641.401.930.88−0.761.994.410.87−0.791.640.870.41−1.861.044.14
Maximum5.100.211.733.472.670.832.6713.362.150.522.152.151.41−0.091.4114.08
SD0.700.190.070.350.350.340.131.760.250.270.100.250.240.450.092.45
MeanMedianMinimumMaximumStandard deviation (SD)
PLI1.511.410.792.661.56
RI184.97163.3179.54649.06109.07
Disclaimer/Publisher’s Note: The statements, opinions and data contained in all publications are solely those of the individual author(s) and contributor(s) and not of MDPI and/or the editor(s). MDPI and/or the editor(s) disclaim responsibility for any injury to people or property resulting from any ideas, methods, instructions or products referred to in the content.