Article

Numerical Investigation of the Combustion Characteristics of a Hydrogen-Fueled Engine with Water Injection

1
School of Aeronautics and Astronautics, Sun Yat-Sen University, Shenzhen 518107, China
2
School of Integrated Circuits, Sun Yat-Sen University, Shenzhen 518107, China
3
School of Advanced Energy, Sun Yat-Sen University, Shenzhen 518107, China
*
Author to whom correspondence should be addressed.
Fire 2024, 7(8), 289; https://doi.org/10.3390/fire7080289
Submission received: 9 July 2024 / Revised: 3 August 2024 / Accepted: 6 August 2024 / Published: 19 August 2024
(This article belongs to the Special Issue Hydrogen Safety: Challenges and Opportunities)

Abstract

:
The quest for clean, efficient engine technologies is imperative in reducing transportation’s environmental impact. Hydrogen, as a zero-emission fuel, offers significant potential for internal combustion engines but faces challenges such as optimizing engine performance and longevity. Water injection is proposed as a solution, yet its effects on engine performance require thorough investigation. This study bridges the knowledge gap by examining various water injection ratios (WIRs) and their impact on engine performance, focusing on the balance between power output and engine longevity. We identified the existence of an optimum WIR (e.g., 10% in this study), which provides peak performance with minimal adverse effects on engine performance and health. Computational simulations of a single-cylinder engine revealed how WIRs influence in-cylinder temperature, pressure, and IMEP, emphasizing the nuanced benefits of water injection. Additionally, our analysis of turbulence, through TKE and dissipation rate, deepens the understanding of combustion and fuel efficiency in hydrogen engines. This research provides valuable guidance for optimizing engine operations and paves the way for advanced water injection systems in hydrogen engines, marking a significant step towards cleaner engine technology.

1. Introduction

In the face of escalating global climate change and pervasive air pollution [1,2], the imperative for clean fuel alternatives in the transportation sector has never been more pronounced [3,4,5,6]. The urgency to transition from conventional fossil fuels to sustainable energy sources is paramount, as it directly impacts our environment, health, and the long-term viability of our planet. As opposed to petroleum, which powers conventional vehicle engines, hydrogen is considered one of the most promising zero-emission fuels for internal combustion engines [7]. Using hydrogen as a fuel can effectively optimize the engine performance, including an enhanced engine fuel economy, higher diffusion speed, wide flammability, and low ignition energy. The combustion product of hydrogen is water, without any carbon emissions [8,9,10,11,12]. Although hydrogen combustion provides less energy efficiency than the electrochemical reaction of hydrogen in fuel cells [13,14], hydrogen combustion is still valuable for using a carbon-free fuel, generating near-zero emissions of hydrocarbons [15] and easily reusing the same gasoline or diesel engine. Moreover, fuel cells typically require complex auxiliary systems, such as hydrogen storage systems, air supply systems, active thermal systems, and control electronics, to support their operations, which increases the costs of the manufacture and maintenance of fuel cells [16,17,18,19,20]. Therefore, manufacturers and institutions began to develop hydrogen combustion engines for automobiles, for example, the Musashi Series from Tokyo City University, the Ford P2000 experimental vehicle [21,22], and the BMW Hydrogen 7 Mono-Fuel demonstration vehicle [23]. Despite the advantages mentioned above, hydrogen-fueled engines have several particular issues, such as higher in-cylinder temperatures, growth of N O emissions, violent vibrations, and weaker stability of the engines, which affect passengers’ comfort while reducing the service lives of engine components [17,18,19,24]. The reason for these issues is simply that hydrogen combustion releases much greater energy per volume than conventional fuels like diesel and gasoline, which leads to a high flame speed and violent combustion inside the cylinder [25,26,27,28].
Water injection systems are included in gasoline and diesel engines to effectively reduce the combustion temperature inside the cylinder and decrease the NO emissions of the exhaust gas while improving the engine’s performance [29,30,31,32]. The combustion dynamics inside a piston engine are typically non-linear and involve a complex formulation; therefore, numerical simulation methods are widely used in this area. Nour et al. [33] implemented water injection in the exhaust manifold of a diesel engine, and they concluded that water injection elevates an engine’s in-cylinder pressure while decreasing the NOX emissions. F Berni et al. [34] performed numerical simulations to analyze the injected water–fuel mixture inside the combustion chamber of a high-performance, turbocharged, gasoline direct-injection (GDI) engine. Here, the optimum water injection ratio (WIR) was obtained by using chemical reactors, to evaluate the effects of charging dilution and mixture modification on both the autoignition delay and laminar flame speed. Ma et al. [35] developed numerical models to study the dilution, thermal, and chemical effects of intake manifold flooding on the combustion and emission characteristics of four-stroke direct-injection and turbocharged diesel engines. Arabaci et al. [36] experimentally studied the effects of the water injection volume and time, which impact the engine performance and exhaust emissions of six-stroke engines.
Generally, most research studies in this area are based on gasoline or diesel engines, focusing on knock suppression and NOx emissions. Bozza et al. [37] studied the effect of water injection on engine knock resistance and fuel consumption by using a one-dimensional simulation model, and the results showed that the introduction of inert gas in the cylinder could reduce the knocking tendency while leading to an early combustion phase and reducing or even avoiding the possibility of over-fueling the mixture. Yu et al. [38] directly injected water into the cylinder of a high-performance port gasoline injection engine by using modified low-flow direct injectors, and the experiment indicated that water predominantly influences the later combustion phases due to its rapid vaporization and high specific heat capacity, meaning water injection can effectively suppress knocks in the SI (spark ignition) mode. Ianniello et al. [39] designed an experimental test campaign to assess the potential of SWI (supercritical water injection) for improving the engine performance and emissions, and the results showed that water injection has a remarkable NOx reduction impact proportional to the quantity.
Water injection is a potentially viable solution for hydrogen engines, which provides a higher in-cylinder temperature, pressure, and flow instability, allowing the engines to be operated safely and run for longer. Taghavifar et al. [40] used CFD simulation to investigate water injection with hydrogen, diesel, and mixed fuels, utilizing parametric sweeps to find the optimum WIR. Their research focused primarily on the effects on the in-cylinder temperature and pressure, while the dilution effect (decrease in inlet oxygen concentration), thermal effect (high latent heat of vaporization and specific heat capacity of injected water), and chemical effects of intake manifold water injection (IMWI) have been studied in diesel engines, for instance, by Ma et al. [35]. Furthermore, cases for hydrogen combustion engines, which provide a higher energy density, are worthy of further study.
This study presents our analysis of the effect of water injection on a pure hydrogen combustion engine, focusing on internal flow characteristics. Specifically, a port fuel injection (PFI)-based hydrogen combustion engine’s cylinder is simulated using a CFD model developed in AVL-FIRE. Here, the variation in turbulent kinetic energy (TKE) and turbulence dissipation in the engine cylinder are carefully analyzed to describe the in-cylinder turbulence intensity [41]. The connection between these flow characteristics including in-cylinder temperature, pressure, and indicated mean effective pressure (IMEP) is established. Among them, the IMEP shows the indicated power output, which symbolizes the engine performance [42], and the in-cylinder turbulent kinetic energy and dissipation rate is used to quantify the engine’s fuel efficiency. Ultimately, the effect of water injection on engine performance and energy efficiency is comprehensively analyzed to obtain the optimum WIR.

2. System Modelling

The CFD simulation is based on the JH600 engine (Jialing industry Co., Ltd., Chongqing, China), which powers the Jialing commercial motorcycle. The engine’s parameters necessary for the numerical modelling are shown in Table 1 [43]. In this work, a single cylinder of this engine is focused on for simplicity, so that the effect of water injection can be easily quantified.

2.1. Numerical Model

Figure 1a displays an image of the JH600 engine and the geometrical model of a PFI hydrogen internal combustion engine cylinder, which is utilized for CFD simulation in this study, as depicted in the isometric view of Figure 1b. the cylinder’s working cycle encompassed the intake stroke, compression stroke, power stroke, and exhaust stroke, all of which can be comprehensively analyzed through CFD simulation. Hydrogen is initially premixed with a specified amount of water before entering the cylinder via an injection device, positioned in front of a specific cylinder’s intake port. This mixture then enters the chamber during the intake stroke with air, while the other intake port supplies pure air. Subsequently, the combustion reaction occurs inside the cylinder, leading to changes in temperature, pressure as well as velocity distribution, causing the piston to move. Ultimately, the products of the combustion reaction are expelled from the cylinder through the exhaust strokes, signifying the completion of an entire working cycle. Figure 1c presents a frontal two-dimensional (2D) view of the engine cylinder, with the geometric characteristics of the liner and piston being highlighted. The piston’s instantaneous position in the cylinder is described by the crank angle (CA), which is measured in degrees relative to a zero reference point, coinciding with the piston’s movement to the top dead center at the start of the intake stroke. The CA value also directly represents the volume of the combustion chamber, which undergoes consistent variation due to the piston’s reciprocating motion during the engine’s operation.
This study is conducted using a numerical method to investigate the effects of water injection on the internal flow stability of hydrogen combustion engines. The numerical model comprises turbulence, combustion, and spray sub-models. In the turbulence sub-model, the k-zeta-f model is adopted due to its lower computational cost, higher numerical stability, and greater accuracy. The combustion sub-model employs the coupled flame model (CFM), which assumes that the thin area between the flame and fuel surfaces involves laminar flow, simplifying the calculation process. Compared to the G equation and rapid chemical reaction processes, the CFM model offers high computational efficiency. The WAVE model is utilized as the spray model.
The following assumptions were made in the simulation model to simplify the analysis:
(1) This work focuses on the combustion stage of hydrogen. Therefore, it is assumed that the intake fuel and air are already well mixed, adequately react, and the equivalent ratio at the initial time is 1.
(2) The cylinder is properly designed to withstand the combustion process; thus, the walls of the cylinder are always assumed to be rigid, regardless of the actual temperature, pressure, and level of vibration during the combustion process.

2.2. Boundary Conditions

The simulation includes five stationary boundary surfaces, which are the liner, piston, cylinder head surface, exhaust valves, and intake valves (Figure 1). The boundary condition settings for temperature are presented in Table 2.
To investigate how water injection influences combustion and energy transformation in a hydrogen-fueled engine, four WIRs are implemented in the simulation: 0%, 5%, 10% and 15%. The WIR is defined as the volume fraction of water in the water–fuel–air mixture when the intake flow is closed [40]. Engine performance and efficiency are researched. The engine’s CA position, pressure, and temperature are initially set at 220°CA, 0.1 MPa, and 400 K, respectively. The WAVE module is used to simulate water injection, which begins at 361°CA and ends at 365°CA. The temperature of the injected water is 60 °C, based on the conclusions of Taghavifar et al. [40]. To make the conclusions more convincing and universal, two different engine speeds, 1100 r/min and 2500 r/min, are investigated in this work. The specific initial conditions and water injection parameters are shown in Table 3.

2.3. IMEP Calculation

The IMEP defines the work of one displacement cycle through the engine cylinder’s volumetric space. It is mathematically defined as the work on the piston divided by the volume displacement. The IMEP is calculated by the following equation, which was proven to be both computationally efficient and reliable by Brunt and Emtage in 1996 [44].
IMEP = 1 V S P dV
VS is the swept volume per cylinder in cubic meters, V is the volume of the combustion chamber in cubic meters, P is the in-cylinder pressure in Pascal.
IMEP represents the engine’s power capacity and is commonly used to address engine stability issues [45]. The IMEP shows the indicated power output, which symbolizes engine performance and efficiency [42].

2.4. Validation and Mesh Independence

The simulation is calculated using AVL-FIRE V2014. The model uses a hexahedral mesh, the maximum cell size of the main part is 2.0 mm, and the number of refinements to the minimum cell size is level 1. The surfaces of the inlet and exhaust valve seats are treated with mesh refinement, with the refinement level being 3. A refinement treatment at level 1 is also introduced at the boundary of the inlet, exhaust, and combustion chambers. Comparisons and simulations are applied to verify the model’s applicability and mesh independence.
Wang et al. [45] and Yang et al. [46] studied CFD simulations of hydrogen engines, the former demonstrating the reliability of the simulation through experiments. Taghavifar et al. [40] investigated water injection in a hydrogen-fueled 1.8 L Ford engine using numerical simulation with AVL FIRE. This research indicates that with the appropriate setup, AVL FIRE can reliably simulate a CI engine (compression ignition engine). Although the JH600 engine studied in this paper is an SI engine (spark ignition engine), the difference in operating style between a CI engine and an SI engine only exists during the ignition phase. Once the combustion inside the cylinder begins, the starting air of the CI engine and the spark plug of the SI engine cease to function. Therefore, AVL FIRE can be used to simulate a water-injected SI engine with uniform speed, as in this study.
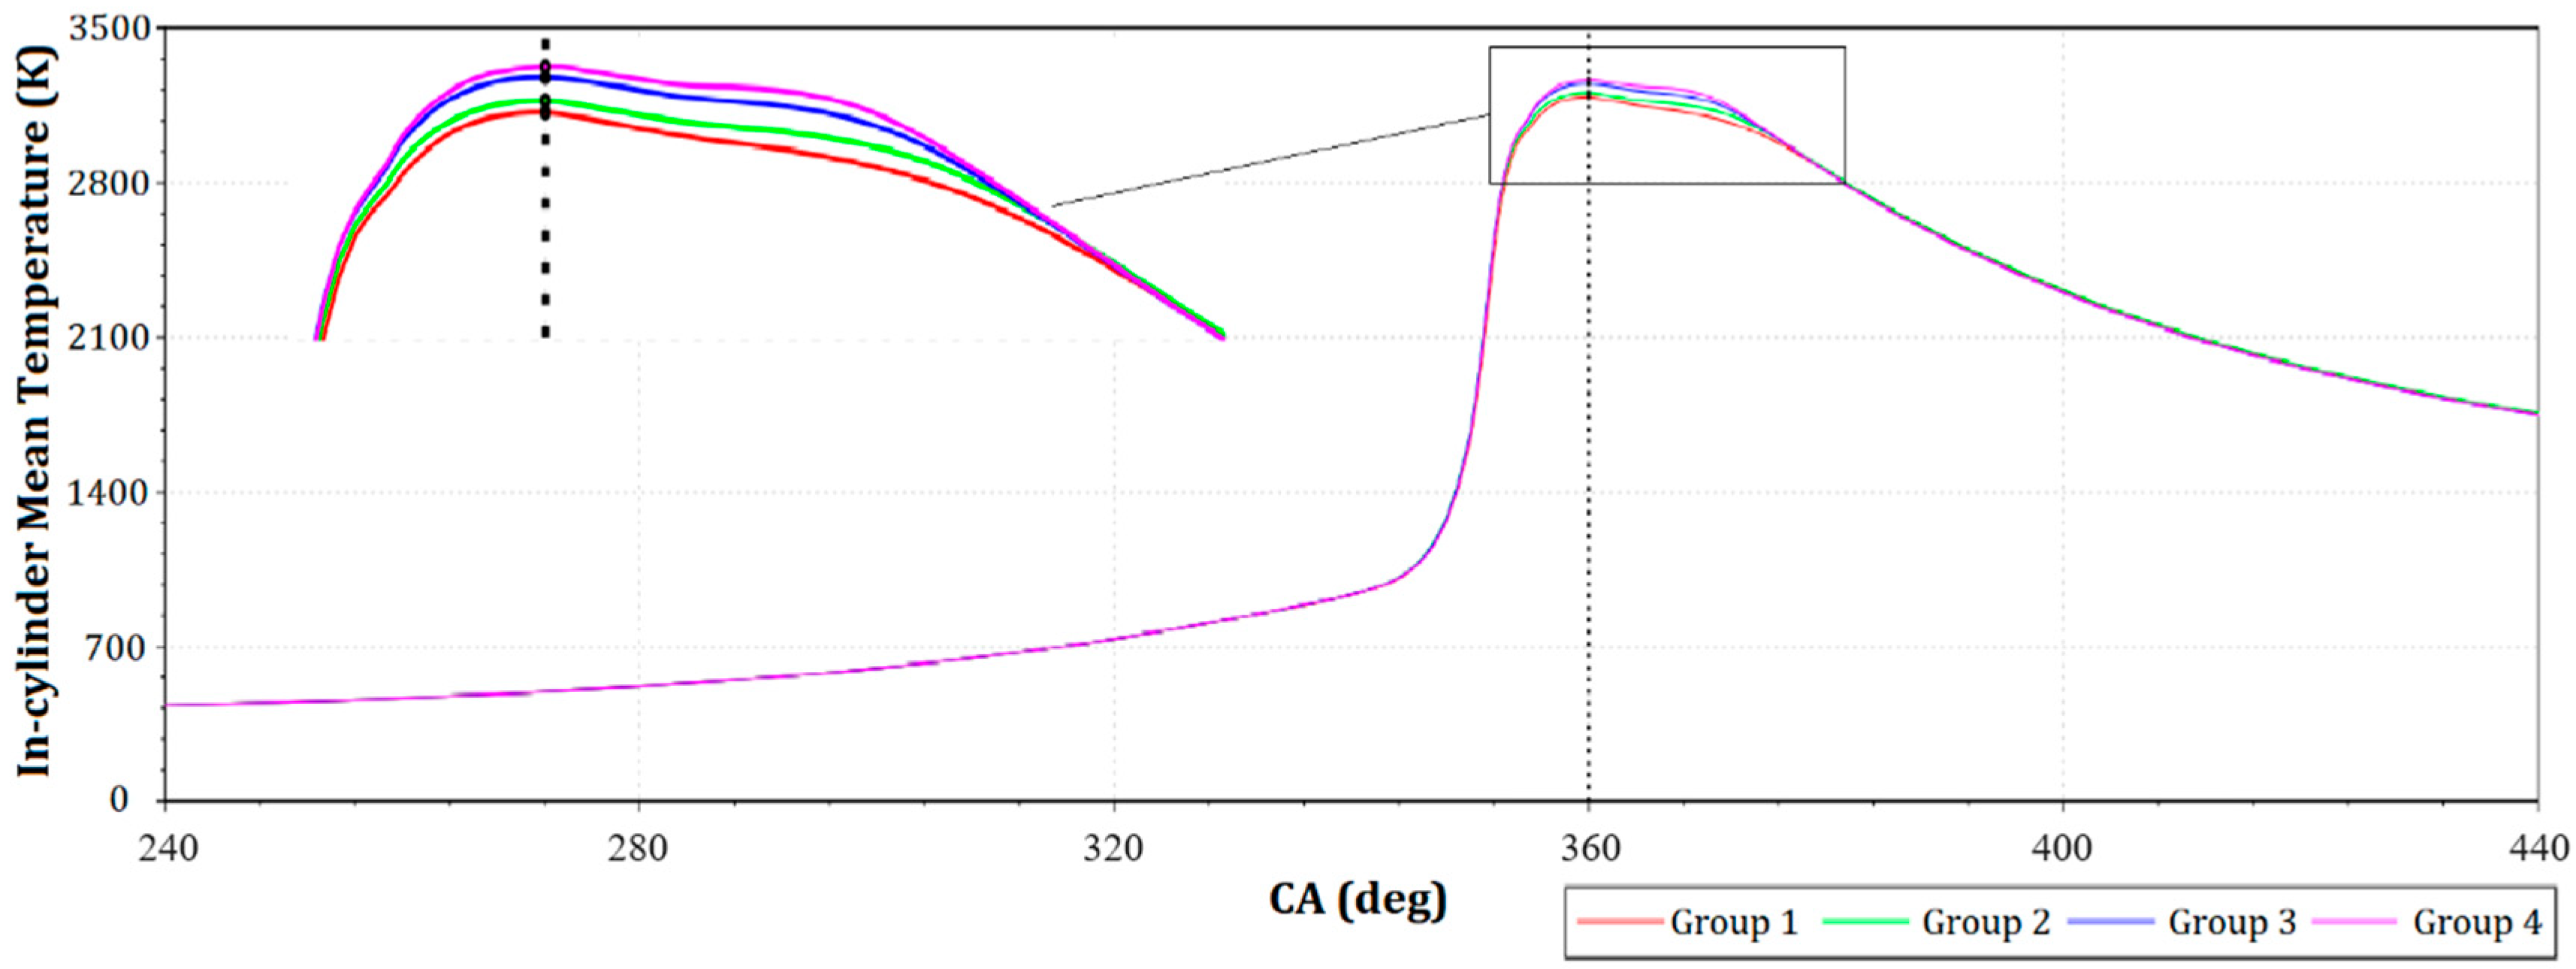
The in-cylinder temperature and pressure of the JH600 engine are simulated to demonstrate the mesh independence of this model. Four groups of meshes with different average cell sizes are created and calculated using the same boundary conditions and initial settings to determine the appropriate mesh size for this simulation. The details of these meshes are shown in Table 4. Groups 1 through 4 contain 57,912, 42,780, 35,364, and 29,660 cells, respectively. Based on the given initial conditions, the peak values of the in-cylinder mean temperature occur at 360°CA. Further details of the calculations are shown in Table 4.
As shown in Figure 2, the results for Group 1 and Group 2 are relatively close, with the deviation being less than 1%. Comparatively, the proportion of time spent between the two groups is 70.42%, which indicates that Group 2 can maintain a balance between computational efficiency and accuracy. Therefore, the mesh of Group 2 is selected for the subsequent calculations.

3. Simulation Results

3.1. Temperature Profiles

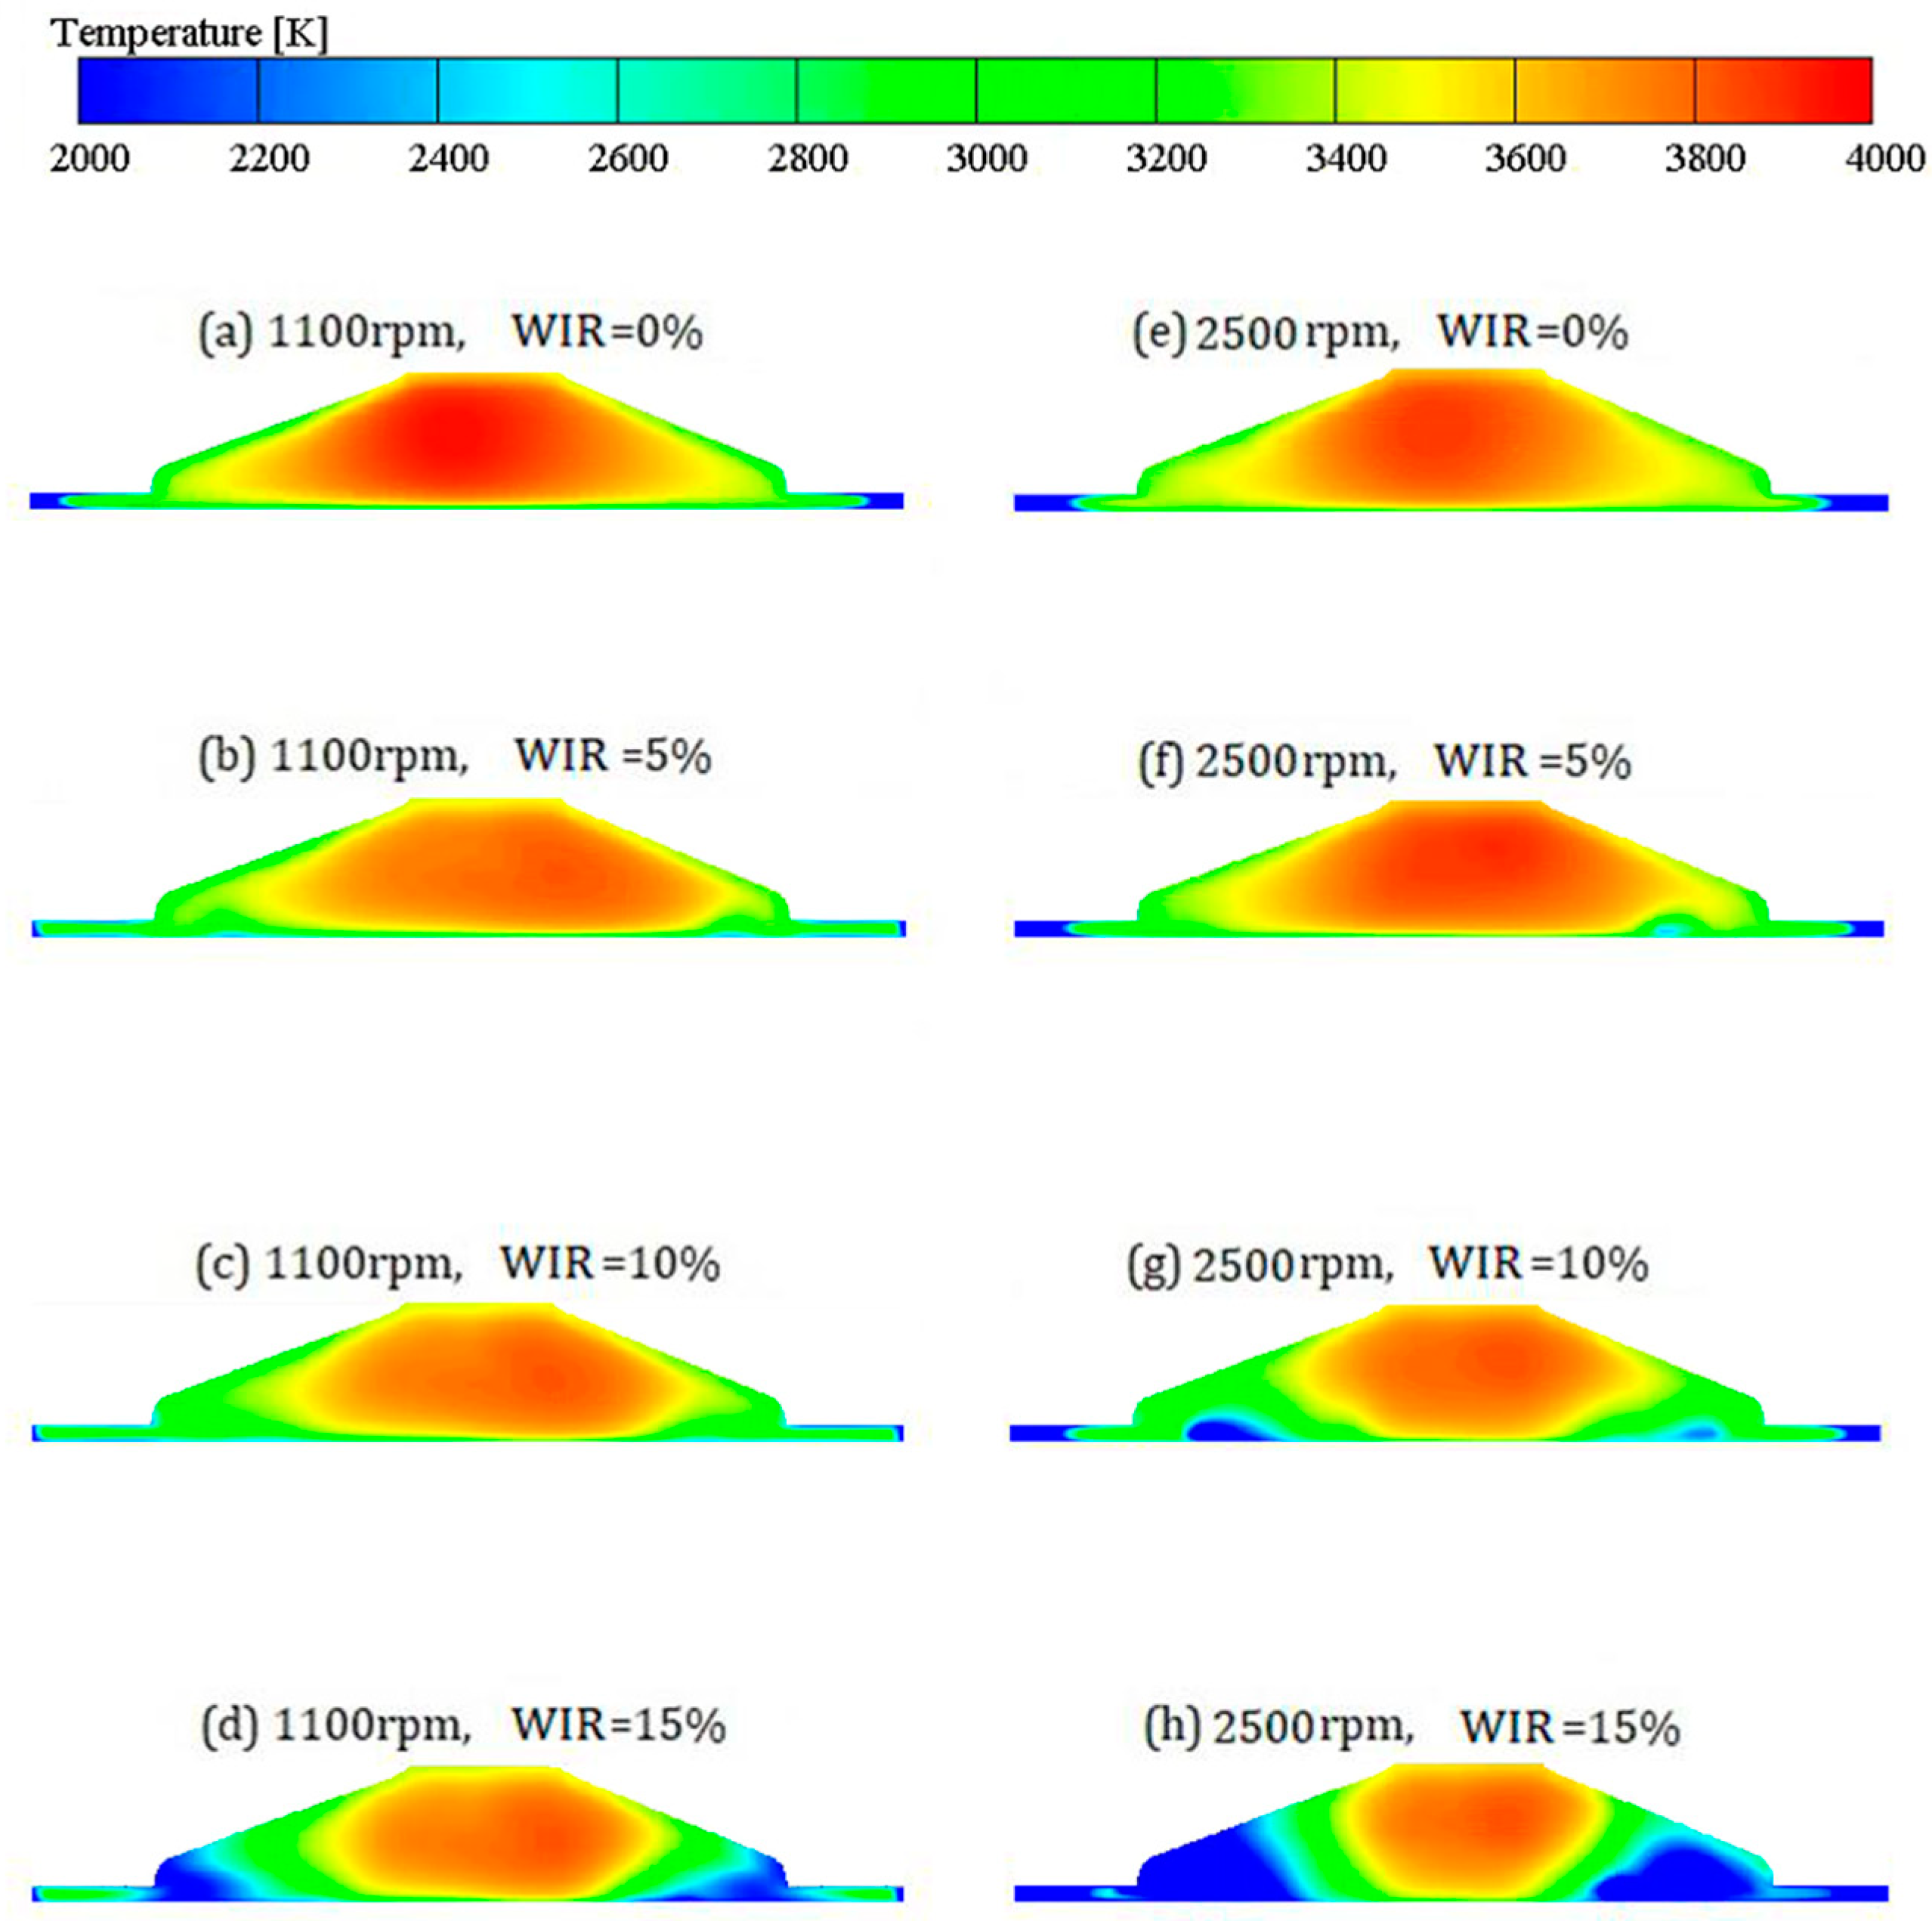
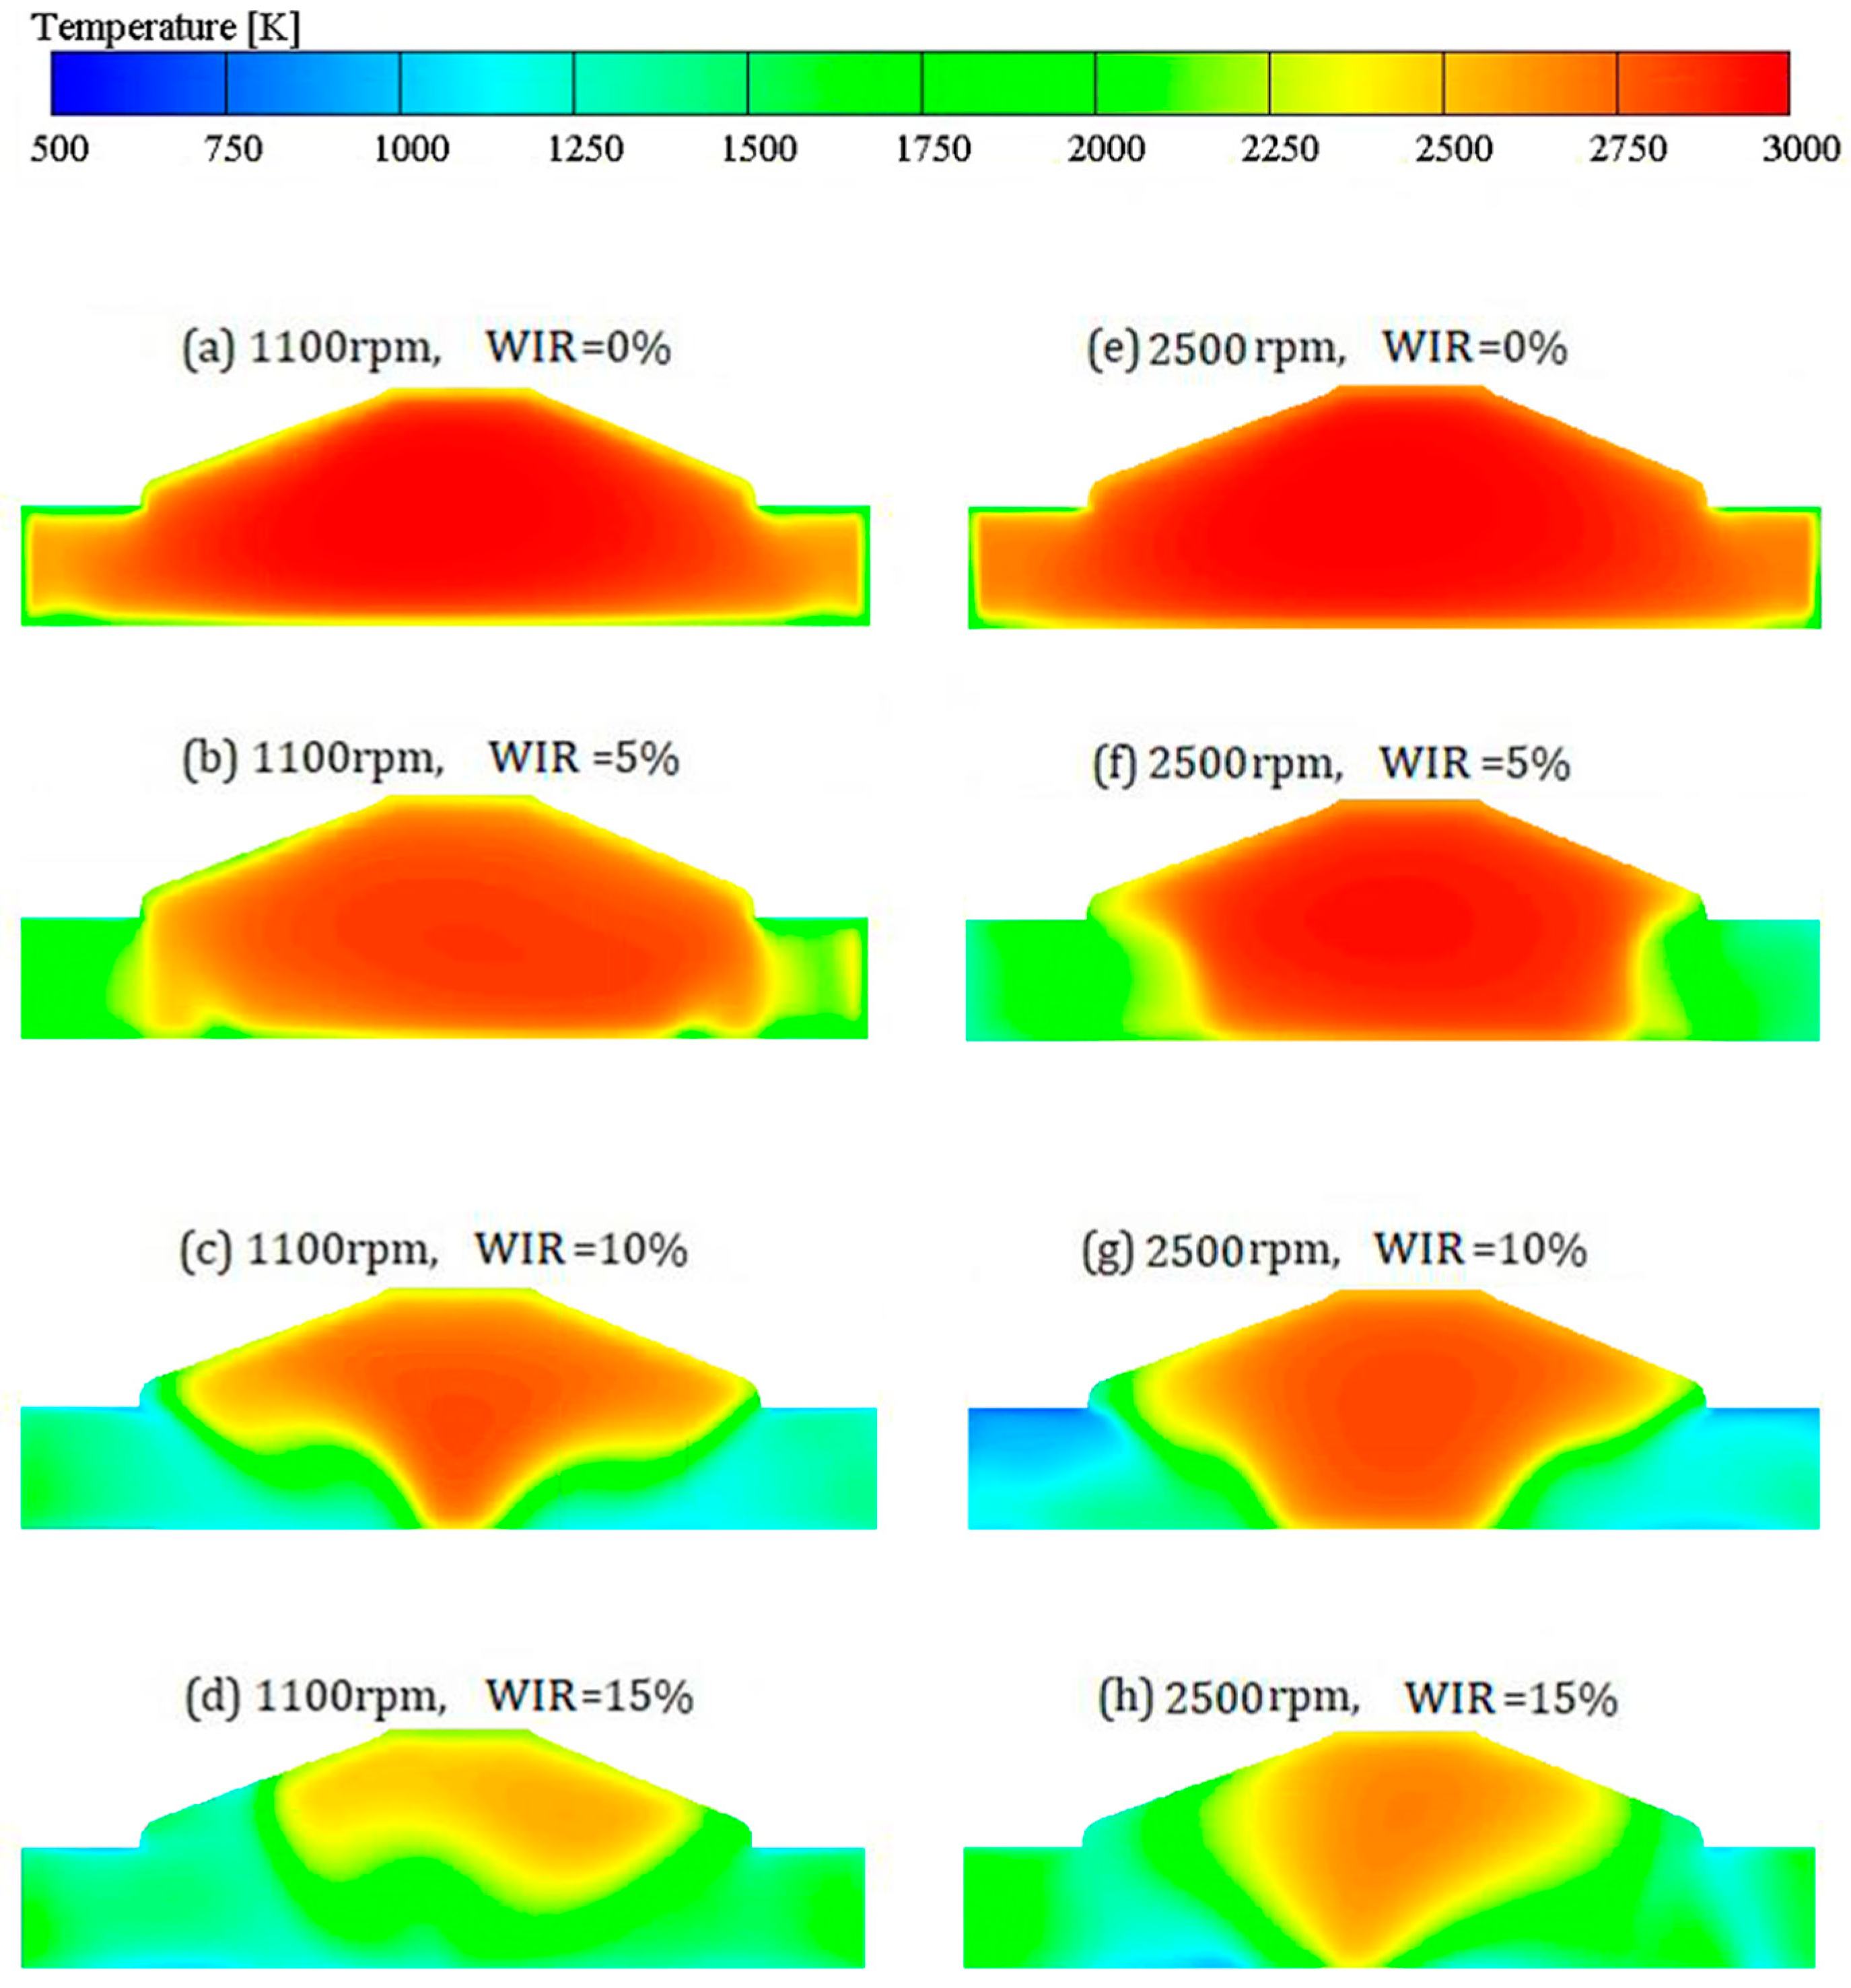
The in-cylinder temperature distribution after water injection, from 366°CA to 396°CA, is calculated to study the impact of water injection on hydrogen-fueled engines, and the results are presented in Figure 3 and Figure 4.
As shown in Figure 3, at the point immediately after water injection, the volume of the combustion chamber is relatively small since the piston’s position is close to the top dead center. As the water injection increases from 0 to 15%, the trends in temperature distributions are similar between 1100 rpm and 2500 rpm. The maximum temperature reaches as high as 3800 K, which is located in the core area of the combustion chamber. The peripheral zone inside the cylinder is noticeably cooler than the center. Since the set temperature for water injection is 60 °C, which is significantly lower than the in-cylinder temperature, this results in an effective cooling effect. As the WIR rises, the high-temperature area decreases and the in-cylinder mean temperature drops. When comparing the results at the same WIR, once the WIR increases, the cold zone at 2500 rpm expands more rapidly than at 1100 rpm. The calculation results indicate that the water injection has a cooling effect on hydrogen-fueled engines, and this cooling effect is enhanced as the WIR increases.
At 396°CA, as in Figure 4, the combustion chamber’s volume is enlarged due to the downward motion of the piston, and the in-cylinder temperature is lower than 366°CA. This is because the gas mixture within the cylinder expands and exerts work on the piston, causing its downward movement. This movement expands the volume of the combustion chamber, which results in a decrease in the in-cylinder temperature. The highest in-cylinder temperature dropped to 3000 K but was still located in the core area of the combustion chamber. Similar to the situation at 366°CA, the high-temperature area decreases and the in-cylinder temperature drops as the WIR increases from 0% to 15%. However, at 396°CA, the cooling effect at 1100 rpm is better than at 2500 rpm, which is the opposite of the situation at 366°CA. This is due to the longer duration from 366°CA to 396°CA when the engine is at a lower speed, allowing for a longer diffusion of water in the combustion chamber and optimizing the cooling effect. Combining these phenomena, the calculation results indicate that although the instantaneous cooling effect of water injection varies with different engine speeds, the overall effect is constant.
Figure 5a illustrates the changes in the mean temperature inside the cylinder at 1100 rpm. Throughout the entire calculation period, the peak value of the in-cylinder mean temperature occurs at approximately 365°CA without water injection, and this peak is increased by water injection. Analyzing the curves in Figure 5, the peak value of the in-cylinder mean temperature hovers around 3250 K, and water injection increases the peak value slightly. However, with water injection, the in-cylinder mean temperature curve exhibits an accelerated descending section, which becomes steeper as the WIR increases. The high-slope section of the in-cylinder mean temperature curve persists for less than 20°CA, after which the effect of water injection diminishes, and the right half of the curves displays a similar slope regardless of the WIR.
At 2500 rpm, as shown in Figure 5b, the in-cylinder mean temperature curve without water injection corresponds to that at 1100 rpm. As the WIR changes, both the peak value and the time of occurrence shift synchronously. The advancement of the peak point at 2500 rpm is more pronounced than at 1100 rpm. Once the WIR increases by 5%, the peak point shifts noticeably to the left. The peak value of the in-cylinder mean temperature at 2500 rpm decreases gradually with an increase in WIR, which is in contrast to the situation at 1100 rpm. As the WIR rises from 0 to 15%, the peak value drops from 3250 K to 3000 K.
Combining Figure 5a,b, a higher WIR accelerates the drop in the in-cylinder mean temperature in the short term and reduces the overall in-cylinder temperature in the long term. In conclusion, considering the temperature curves in Figure 5, increasing the WIR will generally lower the in-cylinder mean temperature during a single stroke, which is beneficial for engine operation. However, taking into account the simulation results of Figure 3 and Figure 4, a WIR of more than 10% can cause uneven in-cylinder temperature distribution and high-temperature concentration, generating a large temperature difference on the surfaces of the cylinder head and cylinder wall. This can result in excessive thermal stress on the cylinder, potentially affecting the service life of engine parts.

3.2. Pressure and IMEP Profiles

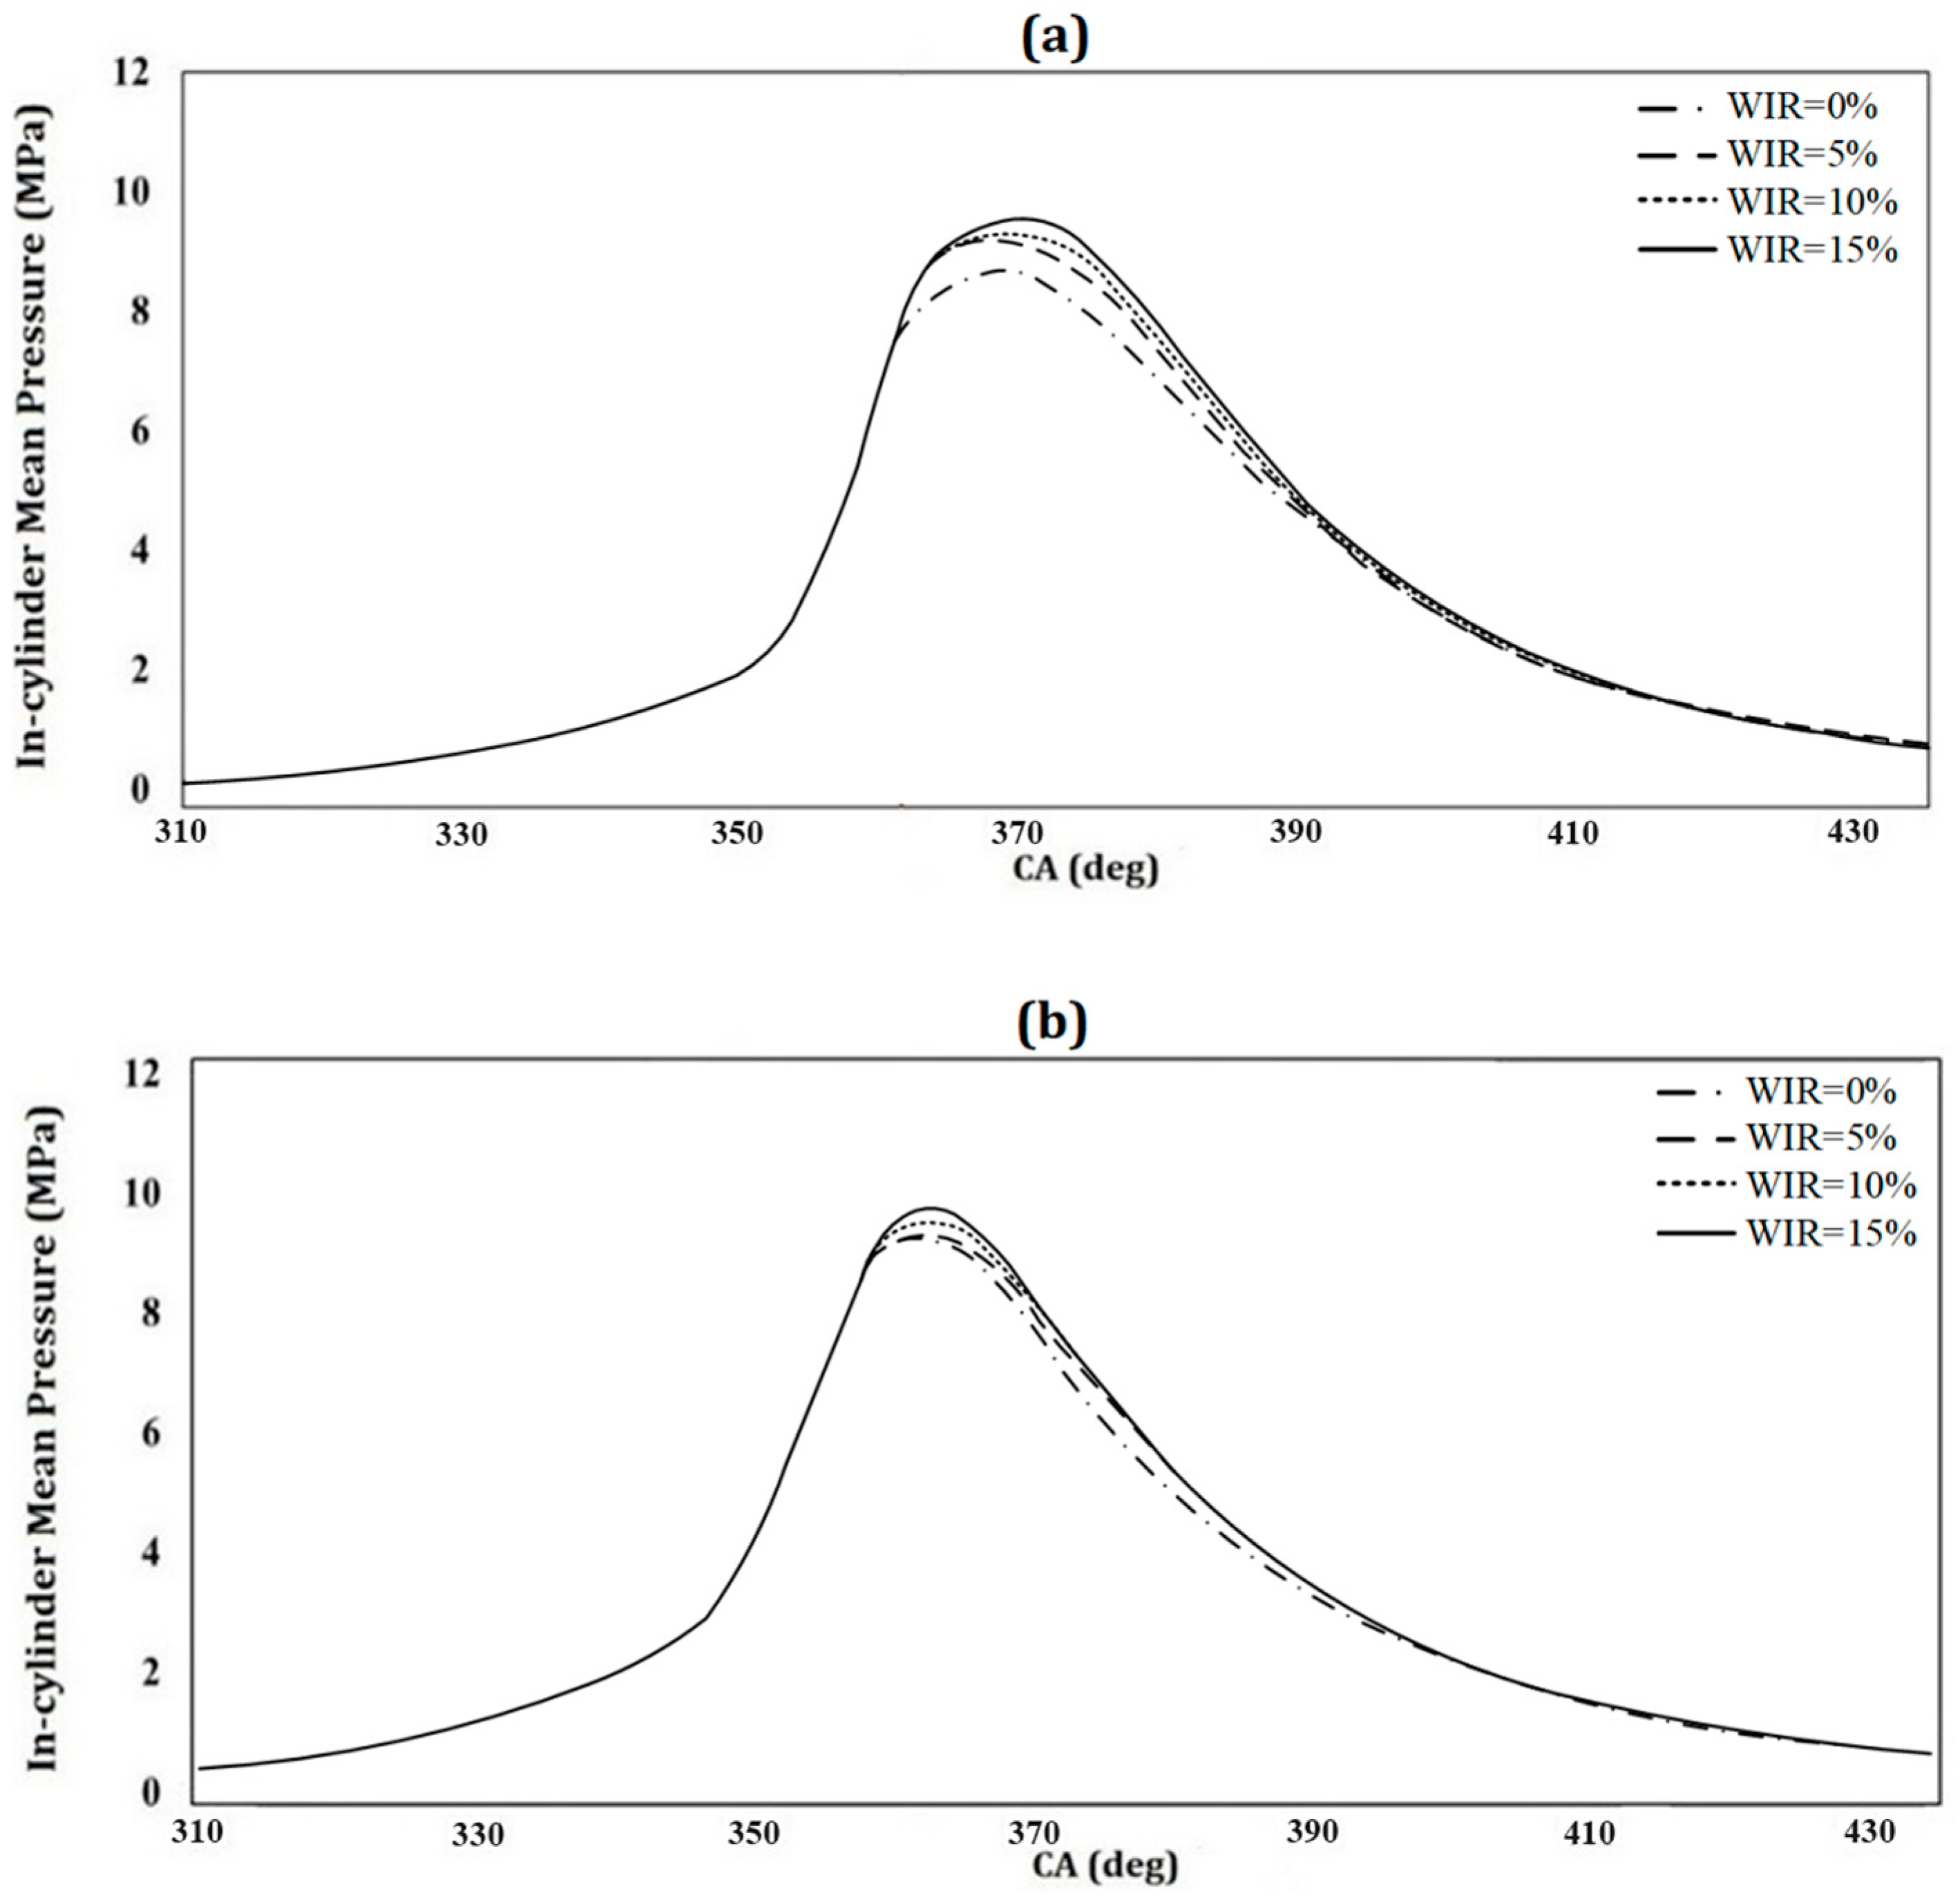
Figure 6a shows the in-cylinder mean pressure during the entire calculation period at 1100 rpm. The profile indicates a noticeable increase in the peak value of in-cylinder mean pressure due to water injection. The highest in-cylinder mean pressure increases from 8.9 MPa to 9.27 MPa when the WIR is 0 and 5%. Alternatively, the curves are similar at WIRs of 5%, 10% and 15%, which indicates that the effect of water injection on the peak in-cylinder mean pressure is relatively unaffected by further increases in WIR. After the peak point at around 370°CA, the effect of water injection gradually diminishes, and the four curves will eventually merge once again.
At 2500 rpm, as shown in Figure 6b, the improvement in the peak value of in-cylinder mean pressure is steadily compared to 1100 rpm. When the WIR ≤ 5%, the curves are similar and the peak values are close. When the WIR ≥ 5%, the divergence of the curves and peak values becomes more evident, and the peak point continues to increase evenly. Similar to the situation at 1100 rpm, all four curves will eventually converge.
By comparing Figure 5 and Figure 6, it can be observed that after water injection, the in-cylinder temperature and pressure are not directly proportional. This is because water injection changes the amount of substances in the gas mixture inside the cylinder, resulting in the state balance within the cylinder no longer depending solely on temperature and pressure but also on the amount of substances in the gas mixture. The discrepancy in in-cylinder mean pressure between 1100 rpm and 2500 rpm is primarily caused by the different mixing effects of water with the mixture inside the combustion chamber. At 1100 rpm, the water injection begins at 361°CA, and the peak point of in-cylinder mean pressure occurs around 370°CA, with a duration of 1.36 ms, which is reduced to 0.6 ms at 2500 rpm. The mixing is more adequate inside the cylinder at 1100 rpm compared to 2500 rpm; therefore, the effect of water injection is better at 1100 rpm, even at WIR = 5%. As for 2500 rpm, due to the inadequate mixing, the effect of water injection is poor at WIR ≤ 5%. However, if the WIR is increased, the effect of water injection will continuously improve, since the quantity of water inside the cylinder increases.
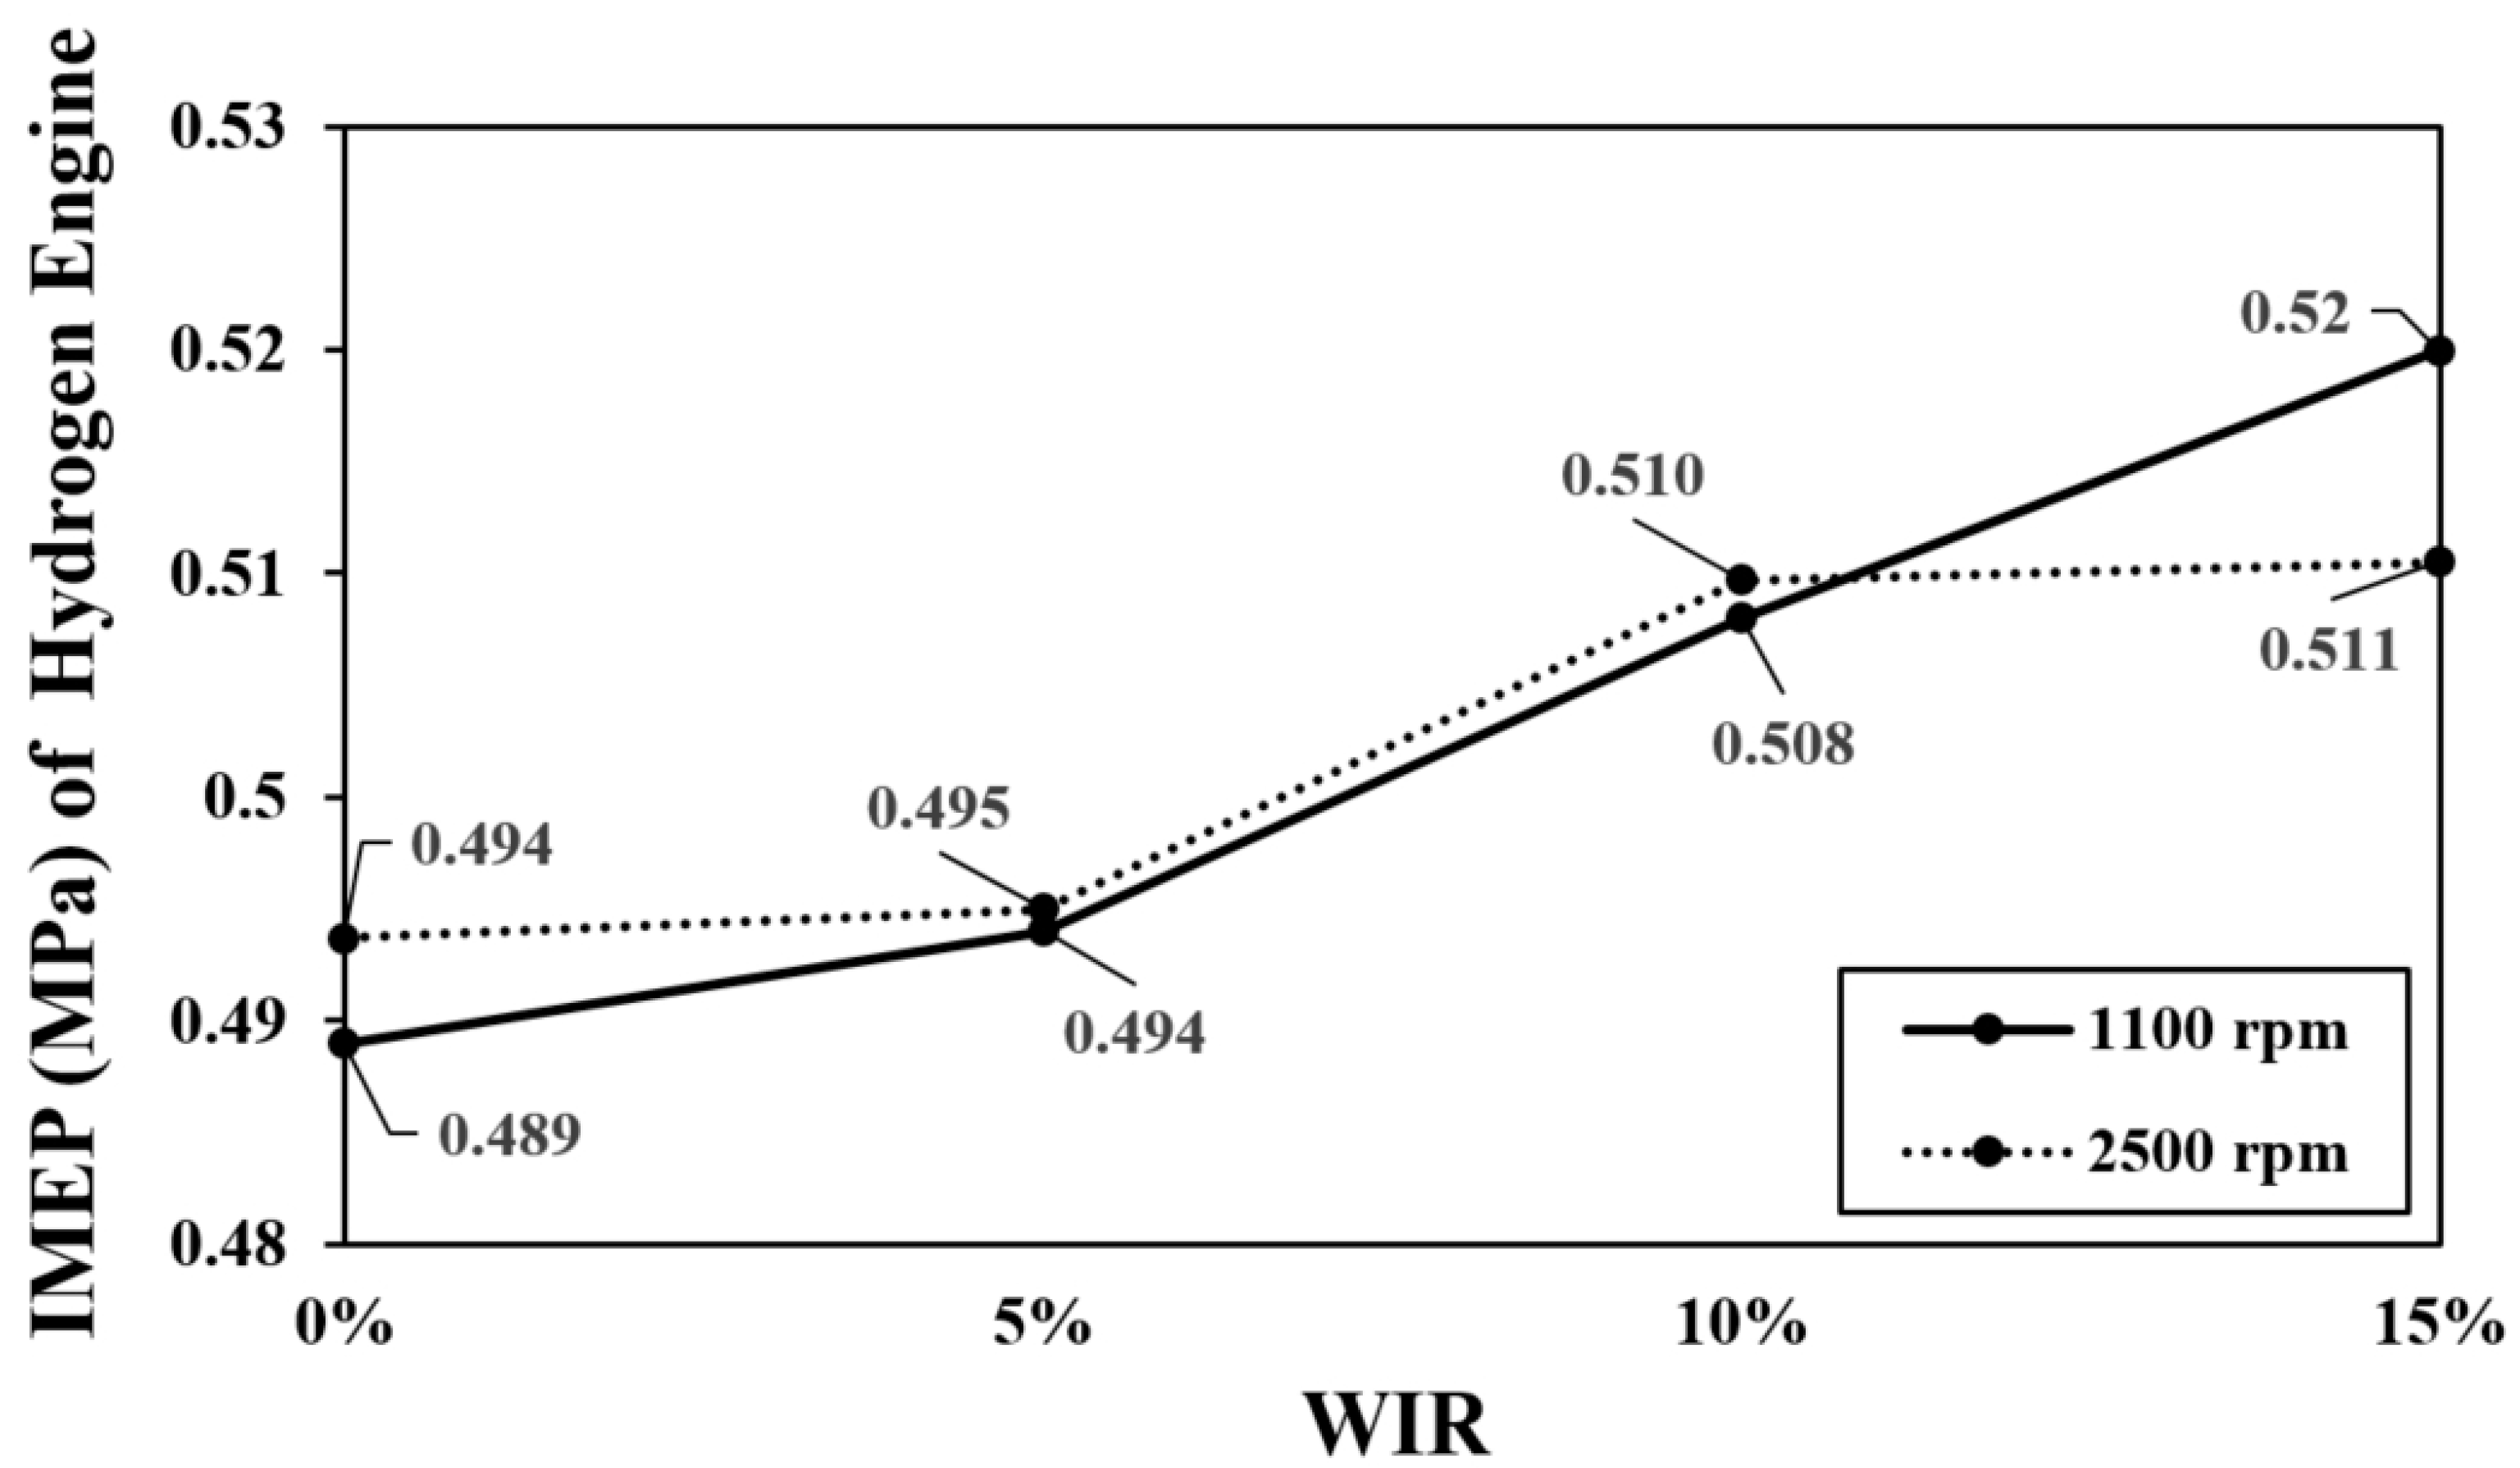
To quantitatively evaluate engine performance, directly using torque is inappropriate because it gives larger engines extra advantages. Output power is also unsuitable for reference, as it can have a profound impact on the evaluation results due to engine speed [47]. In general, IMEP is one of the most objective indices for indicating engine performance, as outlined in Equation (1) in Section 2.3. Compared to torque and power, IMEP is independent of engine size and speed. A higher IMEP indicates better engine performance. Since the impact range of water injection on in-cylinder pressure is between 360°CA and 400°CA, the computational domain for IMEP is set to calculate over the same range. Specifically, the calculation data for in-cylinder pressure and volume between 360°CA and 400°CA are extracted, and all volumetric changes within this interval are determined based on the aforementioned data. Then, Equation (1) is applied to calculate the IMEP.
As shown in Figure 7, IMEP increases as the WIR increases. Comparing the combustion without water injection, IMEP with WIR = 15% shows an increase of 6.34% at 1100 rpm and 3.4% at 2500 rpm, respectively. The IMEP curve at 1100 rpm is almost linear; however, when the engine speed increases to 2500 rpm, the improvement in IMEP is concentrated only between WIR = 5% and WIR = 10%. This is because inadequate mixing at WIR ≤ 5% leads to a minimal increase in IMEP, while a finite combustion scale prevents IMEP from increasing indefinitely.
Although water injection can improve the efficiency of a hydrogen engine, the WIR is not the higher the better, especially at a speed of 2500 rpm. The increase in WIR from 10% to 15% results in a very limited improvement in IMEP and can cause uneven temperature distribution within the cylinder, affecting its longevity.

3.3. Internal Flow Characteristics

The distributions of in-cylinder swirl, TKE, and dissipation rate are analyzed to evaluate the internal flow pattern within the cylinder. As the water injection operates from 361°CA to 365°CA, the contours of the internal flow inside the cylinder are depicted at 366°CA, immediately after water injection has ceased.
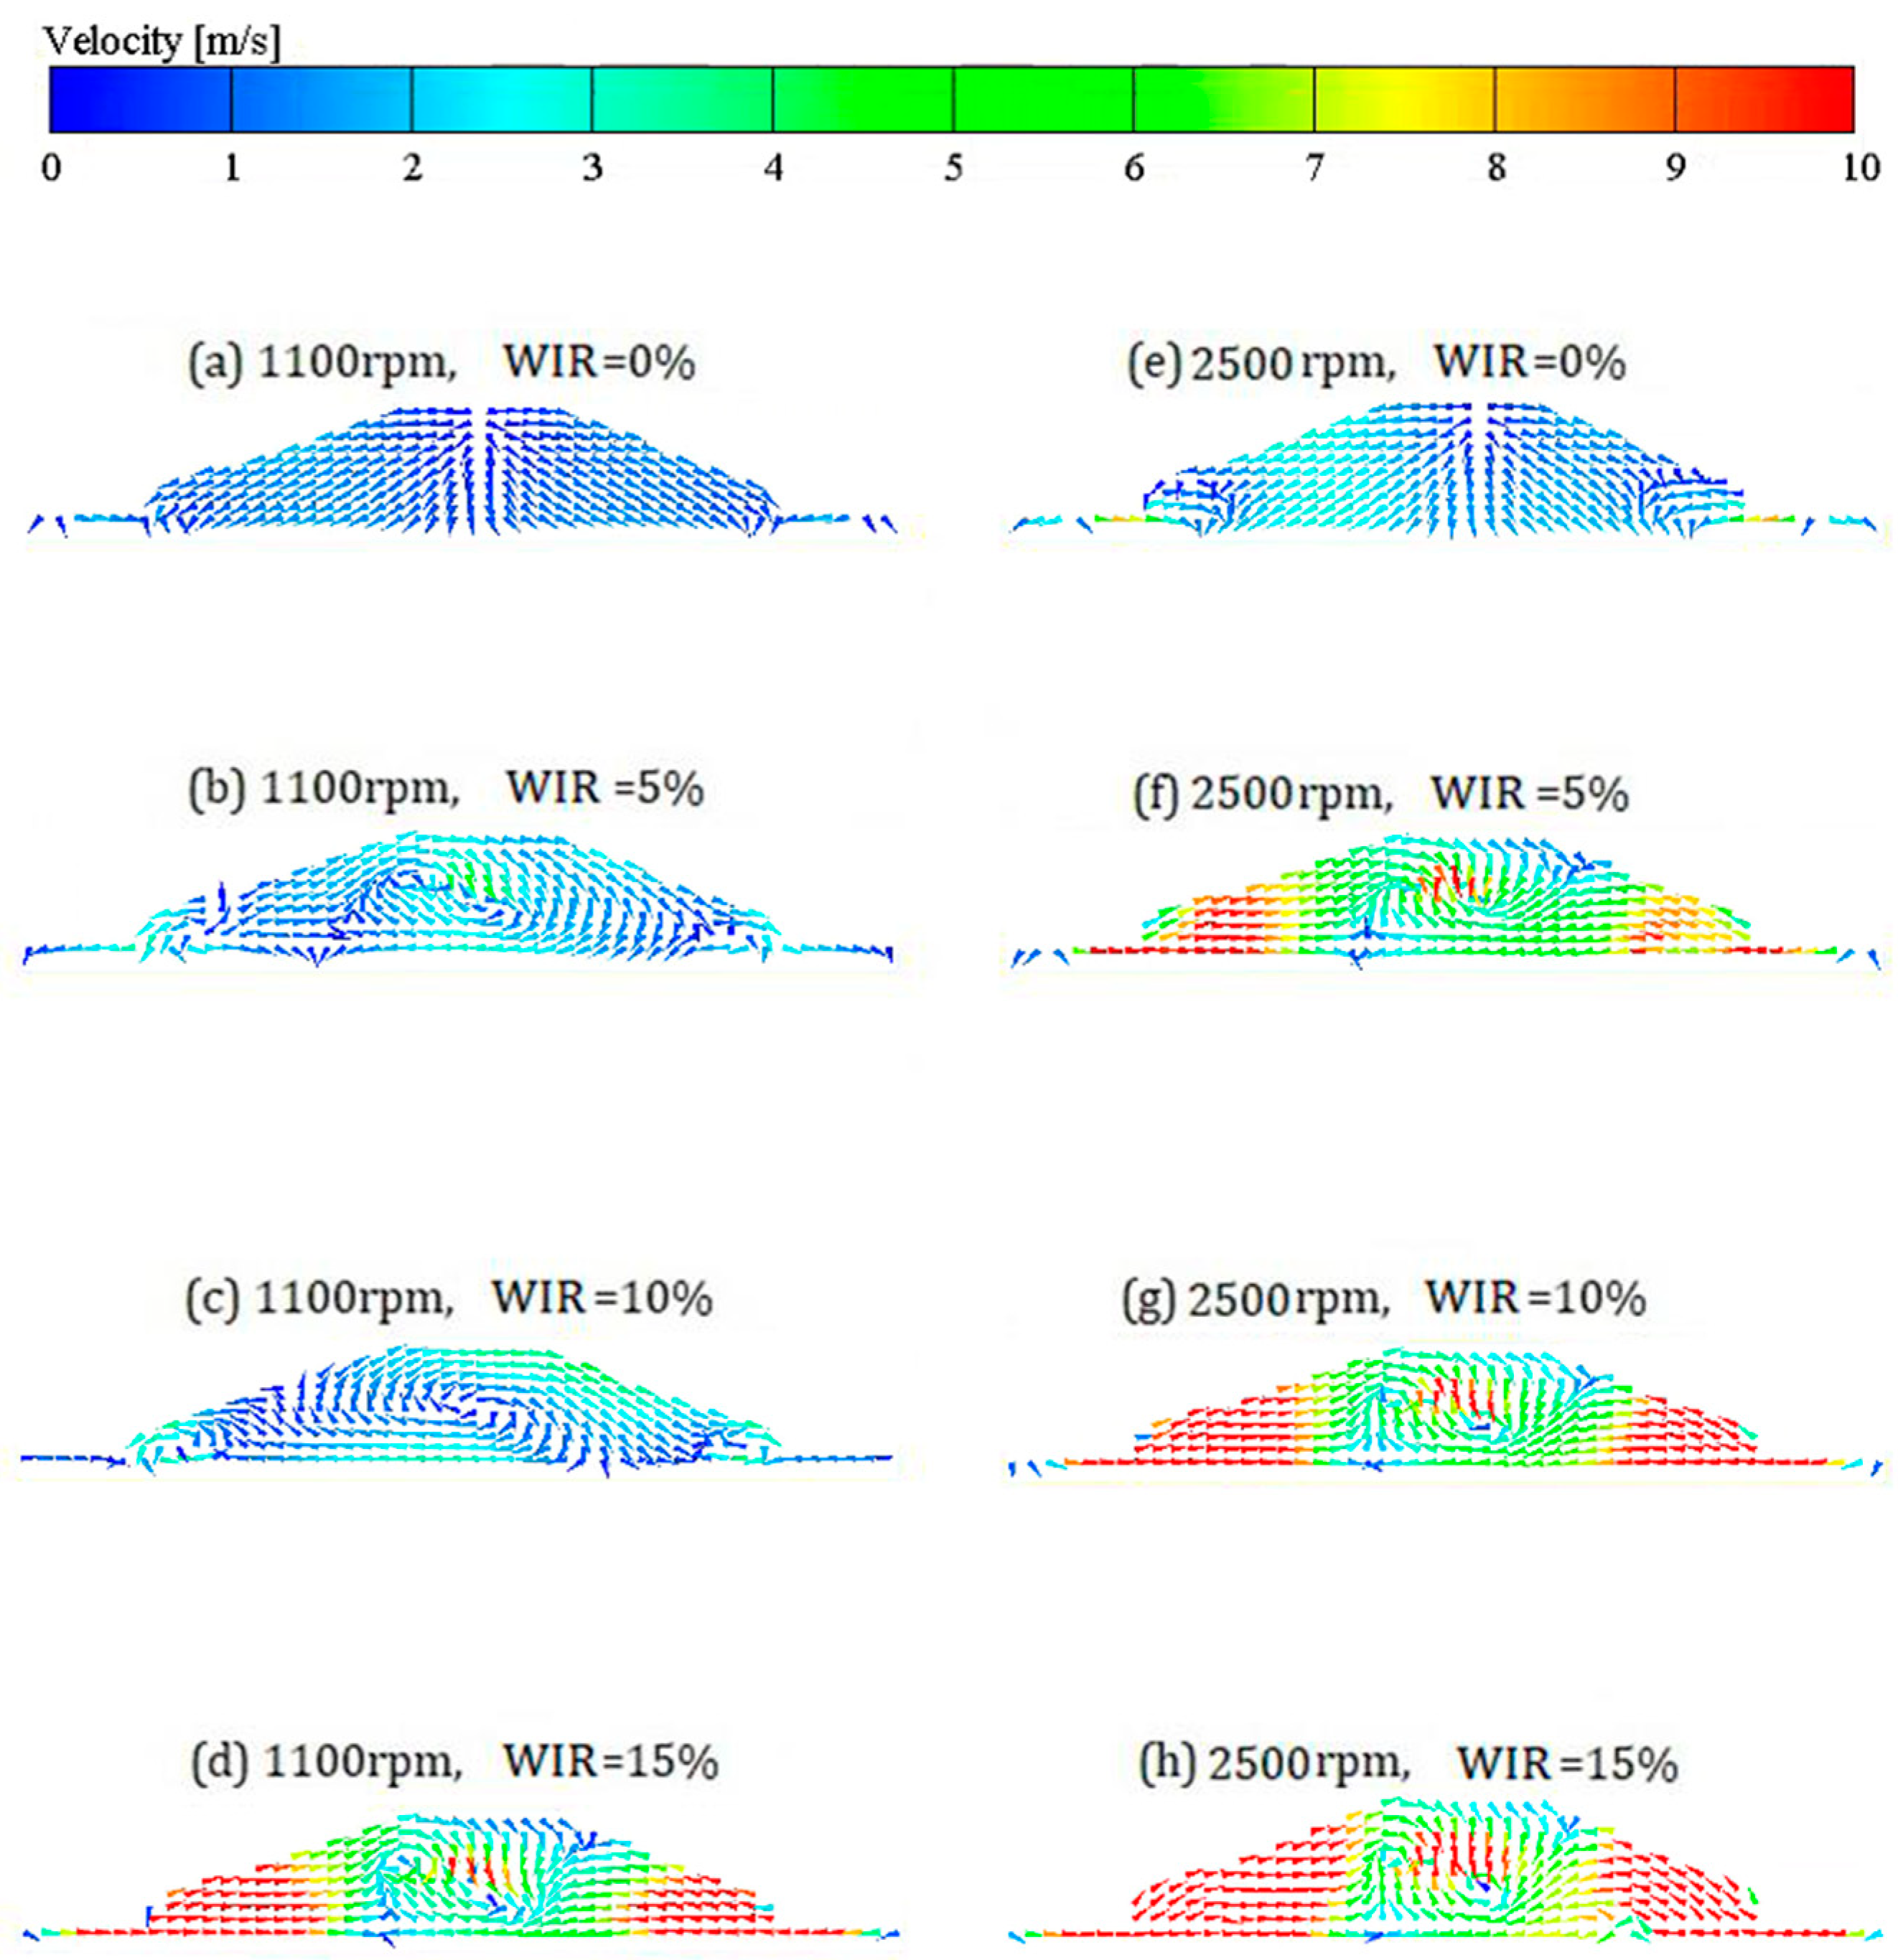
At 1100 rpm, according to Figure 8, as the WIR increases, the in-cylinder flow tends to become more chaotic. Figure 8a shows that without water injection, the vortexes are horizontal and appear in the cylinder’s central region, the in-cylinder flow velocity is uniform, and the flow direction is symmetrical inside the cylinder. The in-cylinder flow undergoes a significant transformation with the application of water injection. Figure 8b indicates that when WIR = 5%, the in-cylinder flow velocity distribution widens, the flow velocity noticeably increases, and the vortexes inside the cylinder transition from horizontal to vertical as water is injected vertically into the cylinder. Since the duration of water injection is fixed, lasting from 361°CA to 365°CA, the velocity of water flow increases with a rising WIR. The kinetic energy is transferred from water to the in-cylinder mixture, resulting in an increase in the in-cylinder flow velocity, as depicted in Figure 8c,d. Concurrently, enhancing water injection complicates the in-cylinder flow, leading to further chaos inside the cylinder. Consequently, the range of flow velocity widens as WIR increases, as illustrated in Figure 8c,d, with maximum flow velocity magnitudes reaching 11.71 m/s and 38.01 m/s, respectively.
The in-cylinder flow transformation tendencies are similar between 1500 rpm and 2500 rpm, according to Figure 8. Water injection not only changes the direction of the vortexes inside the cylinder but also increases the flow velocity. The difference is that the internal flow velocity at 2500 rpm is higher than at 1500 rpm overall. Before water injection is applied, the piston transfers more kinetic energy when the engine speed is higher. After water injection, the mixture inside the cylinder absorbs more kinetic energy, as the engine’s acceleration improves the speed of the water injected into the cylinder, as shown in Figure 8g,h, with the maximum flow velocity dramatically increasing to 27.72 m/s and 52.82 m/s, respectively.
By comparing the velocity distributions in Figure 8d,h with the temperature distributions in Figure 3 and Figure 4, for a WIR = 15%, there is indeed a correlation between these two parameters. Similar distribution patterns are observed at the peripheral area of the cylinder, with lower temperatures and higher velocities, respectively. This phenomenon is caused by an excessive amount of water injection, which results in insufficient combustion in the peripheral area of the cylinder and leads to the formation of a low-temperature region. Since the in-cylinder temperature in the central area is much higher than at the periphery, the unburned gas mixture will enter the high-temperature zone. This results in a high-velocity distribution at the peripheral cylinder. Such an observation indicates that the engine’s energy efficiency is impaired due to inadequate combustion in certain areas.
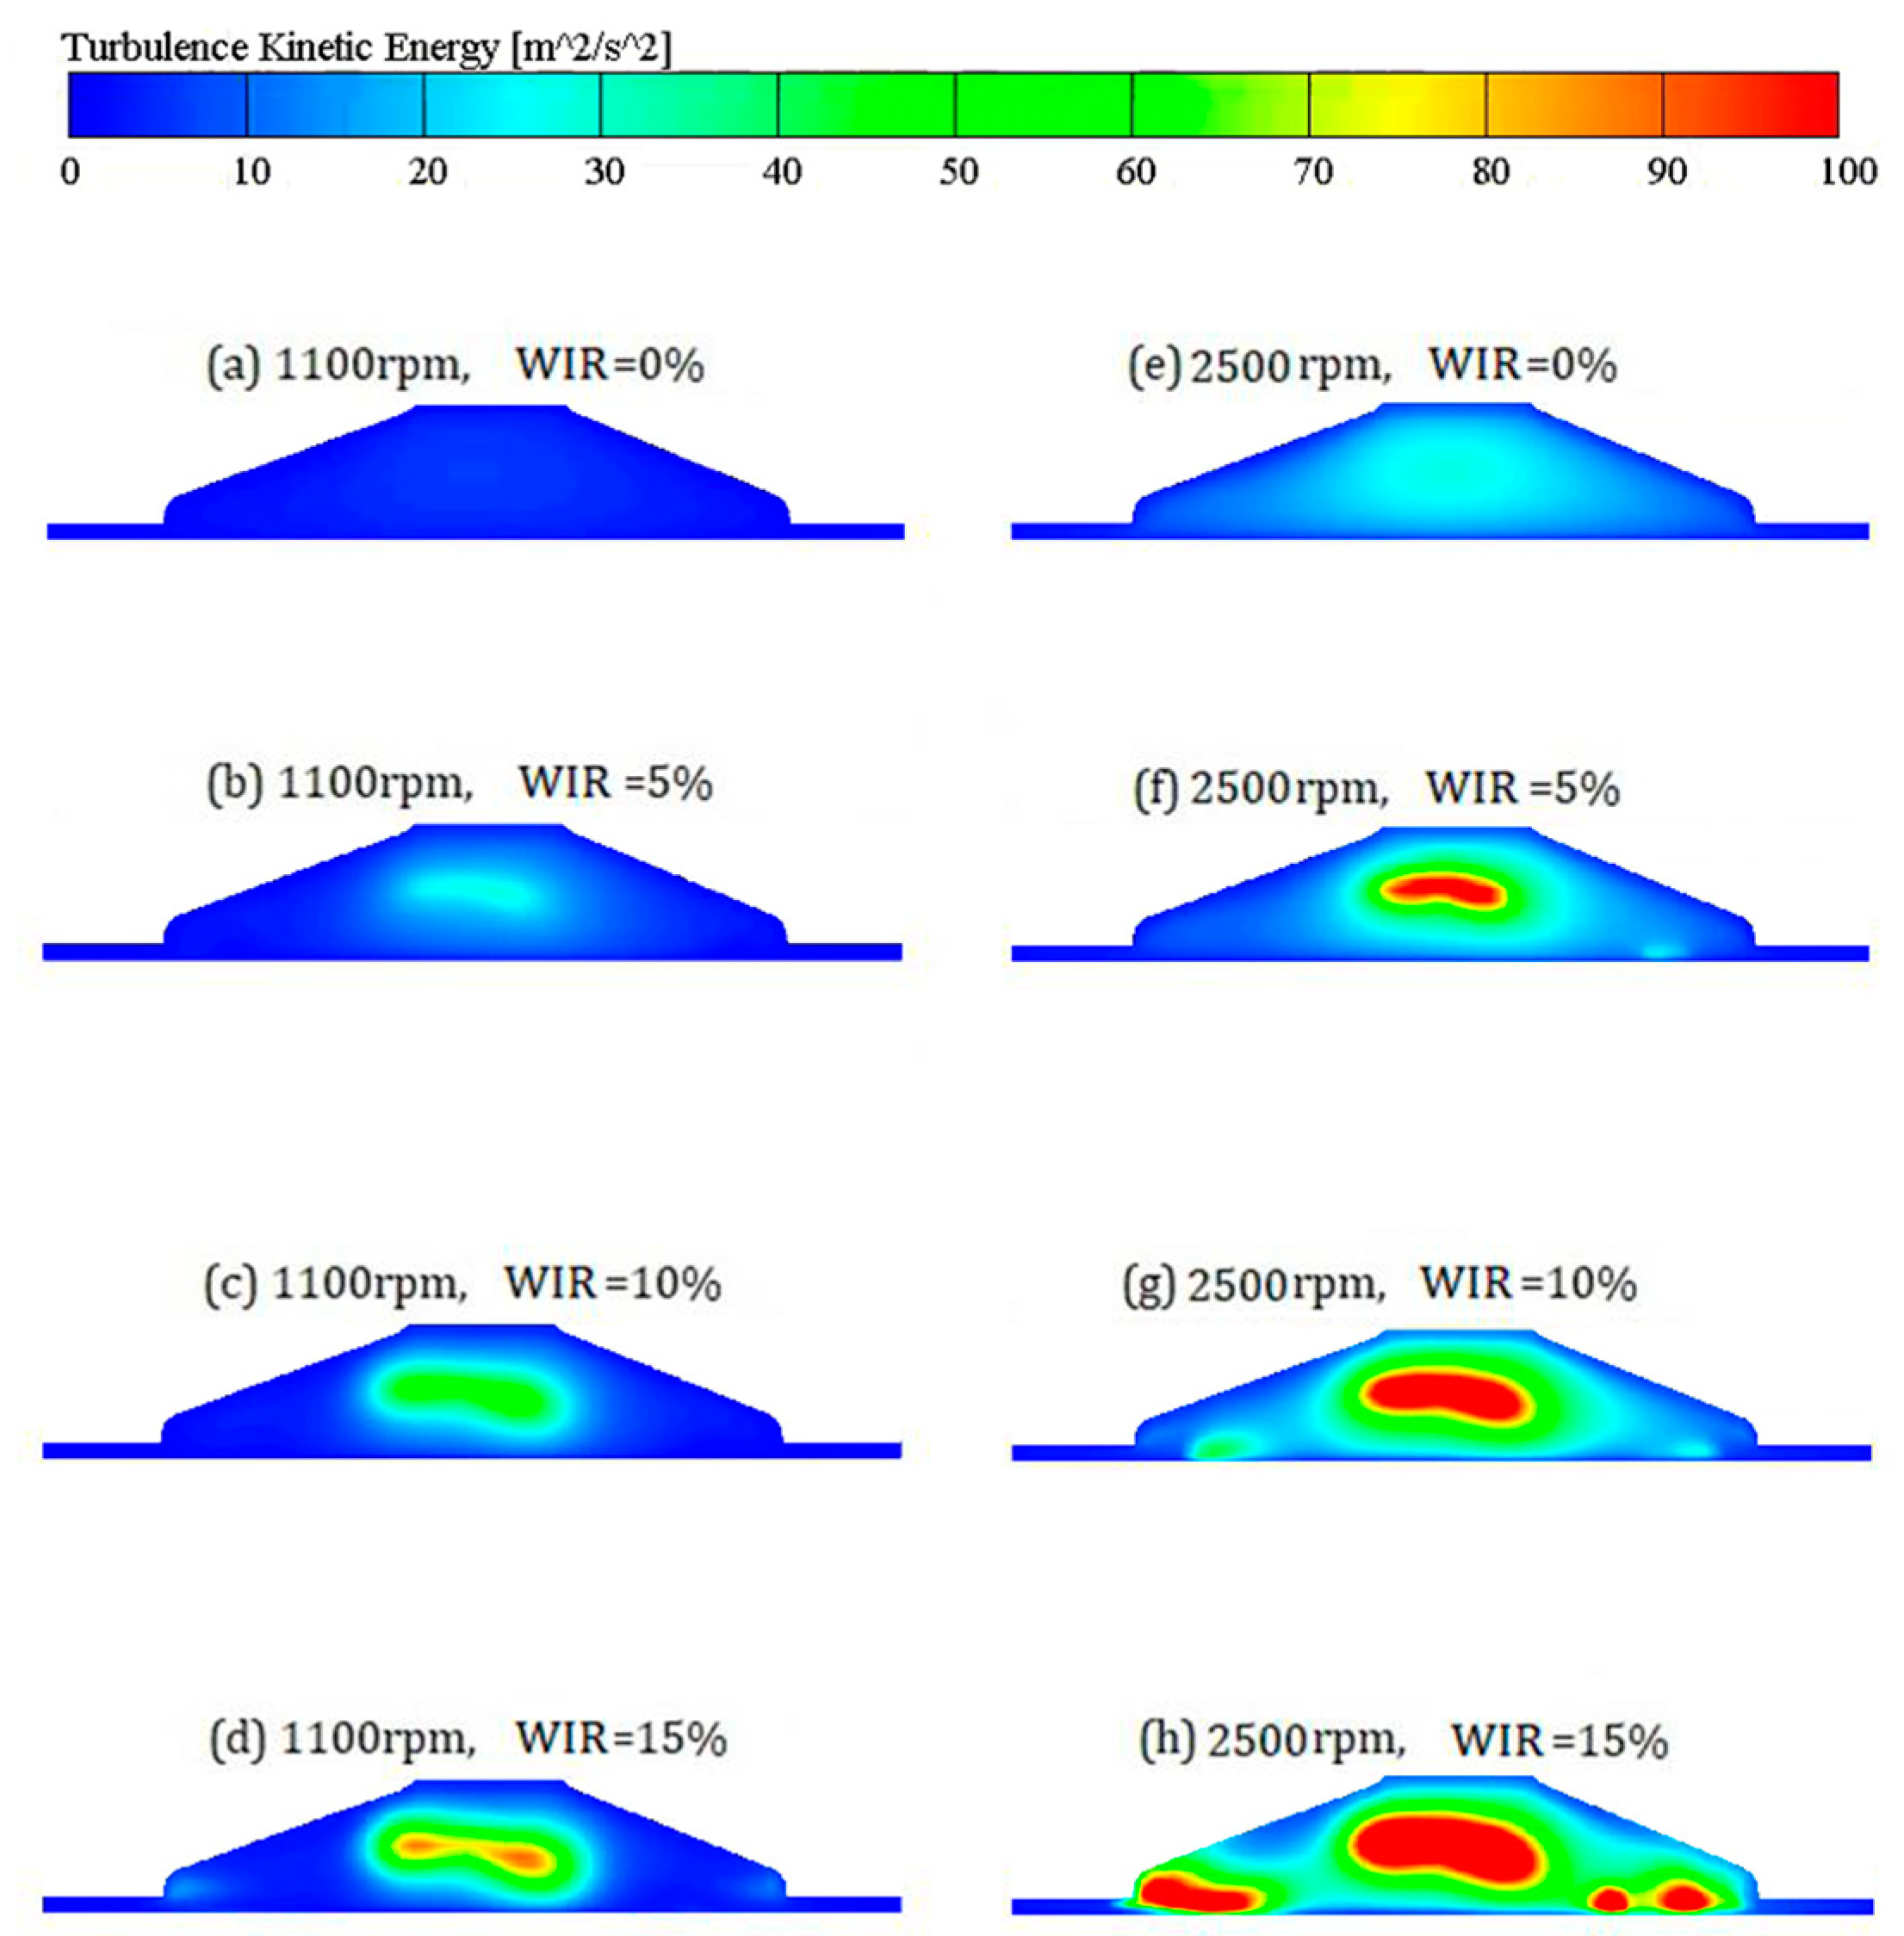
The analysis of the distribution of TKE and dissipation rate improves our understanding of the water injection effect on in-cylinder turbulence. The mixing and combustion quality inside the cylinder largely depends on internal turbulence. An increase in TKE symbolizes the conversion of power generated by combustion into the kinetic energy of the in-cylinder mixture, rather than being dissipated as waste heat. A higher TKE can accelerate the speed of flame propagation [48], which is beneficial for optimizing combustion within the cylinder, thereby improving engine performance.
As seen in Figure 9a–d, at 1100 rpm, in-cylinder TKE increases with the WIR. The peak TKE values are concentrated in the central area of the cylinder. Figure 9e–h display a similar trend in TKE distribution within the cylinder as the engine speed increases to 2500 rpm. However, a significant difference is observed at WIR = 15% in Figure 9h, with additional concentration points of in-cylinder TKE at the cylinder’s periphery. It is illustrated that in-cylinder TKE increases with engine speed, and the increase is relatively remarkable when WIR = 15%. According to Figure 9d,h, internal turbulent motion concentrates in the peripheral area of the cylinder when WIR = 15%, leading to the formation of an additional high TKE zone away from the cylinder’s central area, which generates a reduction in engine stability. However, due to the increase in overall TKE inside the cylinder as WIR increases, engine performance is improved due to the optimization of higher TKE on combustion within the cylinder. Furthermore, the mixing of combustible gases is enhanced, thus reducing emissions caused by incomplete combustion.
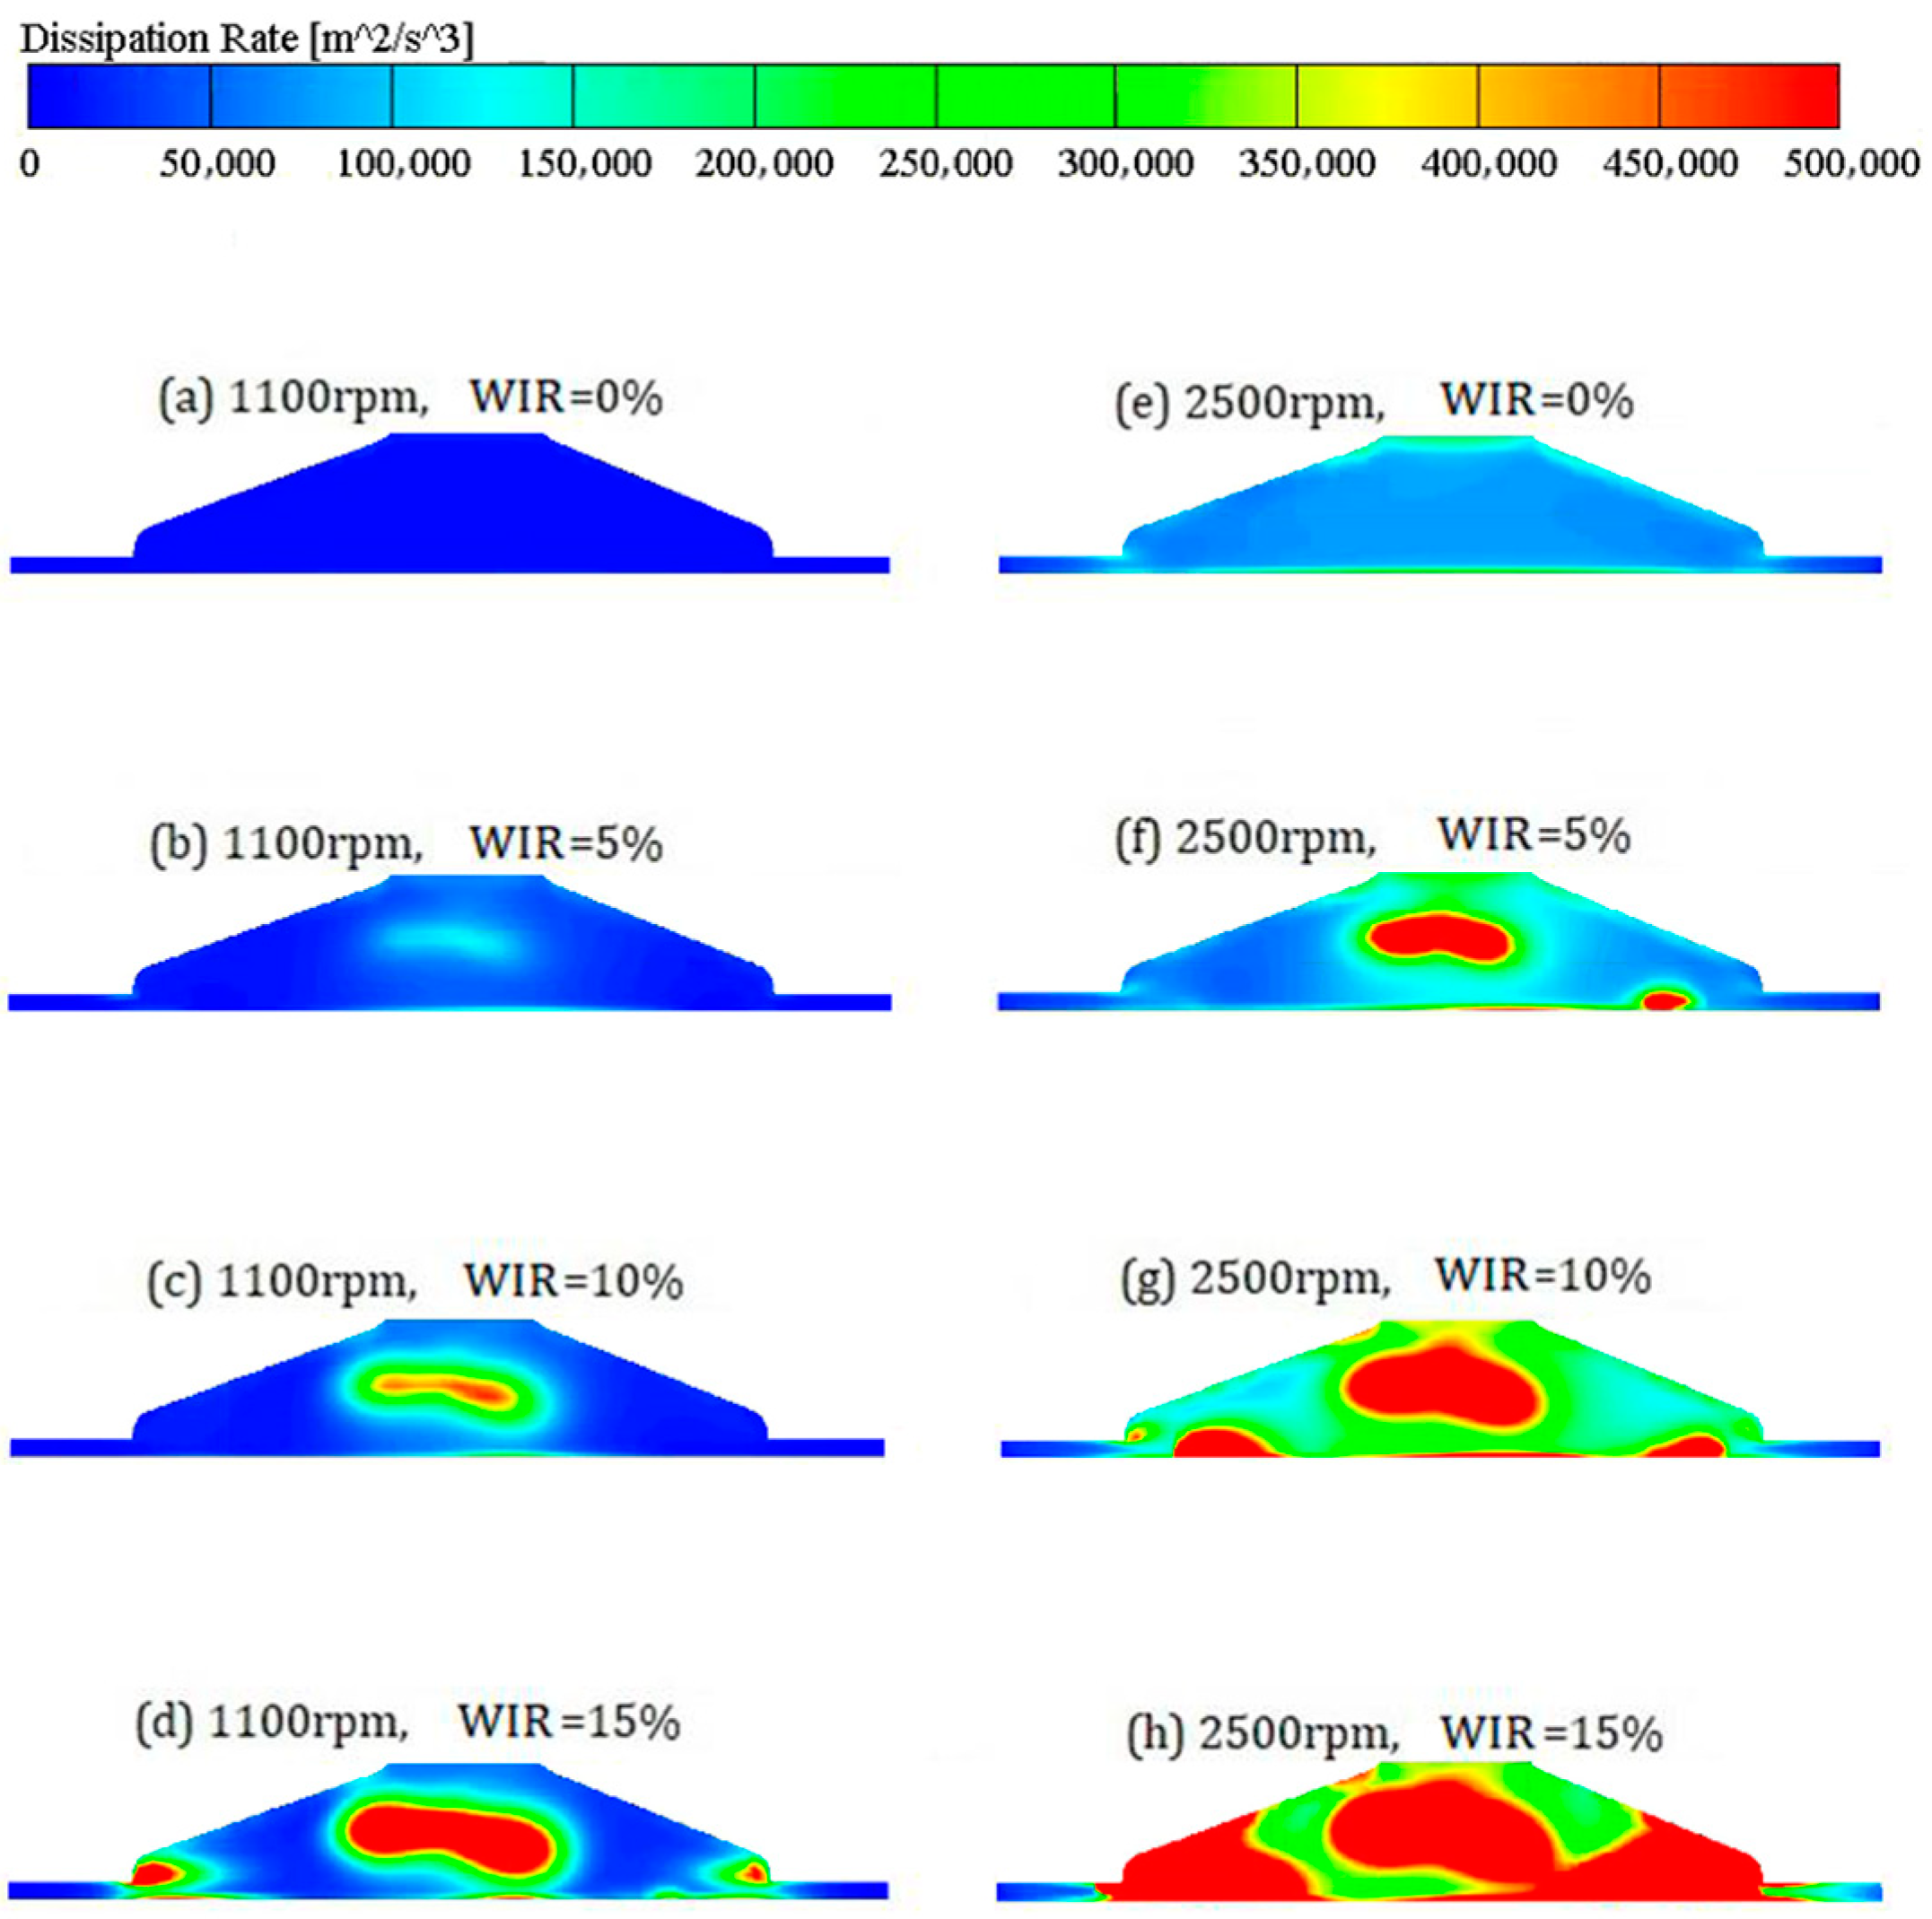
The turbulent kinetic energy dissipation rate is the rate at which TKE is converted into thermal internal energy; it is one of the most important quantities characterizing turbulence and is used to estimate many relevant features of turbulent flow [49]. The dissipation rate is a key parameter to quantify the level of turbulence, the resulting mixing, and the turbulent transport properties [50]. In Figure 10a, at 1100 rpm and without water injection, the in-cylinder dissipation rate is equally distributed and at a lower level. With the application of water injection, a high dissipation zone is generated in the central area of the cylinder, as shown in Figure 10b. The peak value and the proportion of the high dissipation zone continue to increase with WIR, as illustrated in Figure 10c. Compared to the waterless mode, the in-cylinder maximum dissipation rate increases by over 40-times when WIR = 15%, and the high dissipation zone expands to the peripheral area. Since energy exchange is accompanied by dissipation, the high dissipation zone is related to the internal flow and TKE inside the cylinder. In this case, the significant increase in the in-cylinder dissipation rate at WIR = 15% indicates the expansion of TKE and turbulence intensity, as seen in Figure 9. An excessive dissipation rate implies an excess loss in energy, resulting in a decline in energy efficiency and engine economy. The distribution of the in-cylinder dissipation rate shows a similar trend when the engine speed increases to 2500 rpm, as depicted in Figure 10e–h. With the same WIR at 2500 rpm, the in-cylinder dissipation rate is noticeably higher than at 1100 rpm, indicating that in-cylinder dissipation is directly proportional to WIR and engine speed. Consequently, the engine faces greater energy dissipation and a decline in economy when WIR exceeds 10% during high-speed operation.

4. Conclusions

A thorough study on the effect of water injection on hydrogen engines was conducted in this work. In-cylinder temperature and pressure contours are established to analyze engine performance. We specifically focused on in-cylinder state distribution and turbulence characteristics as dependent variables of the water injection rate. The in-cylinder swirl, turbulence kinetic energy, and dissipation rate are used to characterize the combustion quality and fuel efficiency of the engine. By comparing the numerical simulation results with those in reference [40], it can be observed that the trends of the in-cylinder temperature and pressure curves for both are parallel, which proves the rationality of the results. The conclusions are summarized as follows.
(1)
From the perspective of engine health, water injection offers a satisfactory cooling effect during the power stroke, which is conducive to the constant and healthy operation of the engine. However, a WIR exceeding 10% can lead to uneven in-cylinder temperature distribution and high-temperature concentration, generating a large temperature difference on the surfaces of the cylinder head and cylinder wall. This results in excessive thermal stress on the cylinder, potentially affecting the service life of engine components.
(2)
From the perspective of engine performance, a higher WIR will increase the engine’s in-cylinder mean pressure and IMEP, which means the engine can provide more power without changing other conditions. However, once the WIR reaches 10%, the optimization effect of water injection is dramatically reduced, especially at 2500 rpm. This indicates that the beneficial effects of water injection are not limitless as the WIR increases.
(3)
From the perspective of in-cylinder flow characteristics, the flow velocity and TKE increase with the WIR. Consequently, the combustible gas mixture can be sufficiently mixed, and the speed of the flame propagation can be accelerated within the cylinder by increasing the WIR, which improves the combustion quality. The dissipation rate also increases with the WIR, resulting in greater energy loss and a decline in energy efficiency and engine economy. The most drastic change in the dissipation rate occurs during the phase in which the WIR increases from 10% to 15%.
(4)
Comparing all the numerical results in this study, the case of WIR = 15% maximizes the performance of the hydrogen engine; however, such a high WIR is detrimental to engine health and fuel economy. Alternatively, at WIR = 10%, engine performance is close to that at WIR = 15%, but the negative impact on engine health and fuel economy due to water injection is sharply reduced. In summary, the optimum WIR to maintain a hydrogen engine running well is 10%, based on the simulations in this study.
The next step of this work is to further investigate the mechanism of water injection in hydrogen engines and to introduce a neural network algorithm to develop an accurate water injection calculation method. This aims to enhance the precision and scope of WIR calculations, ensuring high-precision computation of the optimal WIR for various engine speeds and different operating conditions. Furthermore, a water injection regulator for hydrogen engines based on WIR control will be developed, in order to achieve the optimization effects of this study in reality.

Author Contributions

Conceptualization and methodology, Q.Y.; software, validation and writing—original draft preparation, H.L.; writing—review and editing, J.C. and T.H.K. All authors have read and agreed to the published version of the manuscript.

Funding

This work has been supported by the Guangdong Basic and Applied Basic Research Foundation-Guangdong-Hong Kong-Macao Applied Mathematics Center Project under Grant No. 2021B1515310001, and the Guangdong Basic and Applied Basic Research Foundation-Regional Joint Fund Key Project under Grant No. 2022B1515120009. Additionally, we extend our appreciation to the National Key Research and Development Program under Grant No. 2020YFA0712502 for their invaluable support in this research.

Institutional Review Board Statement

Not applicable.

Informed Consent Statement

Not applicable.

Data Availability Statement

The data presented in this study are available on request from the corresponding author.

Acknowledgments

We would also like to express our gratitude to Sheng Wang, Jiawen Wang and Wenbin Wang, as this study is partially based on their previous work.

Conflicts of Interest

The authors declare no conflicts of interest.

Nomenclature

VSSwept Volume Per Cylinder (m3)
VVolume of the Combustion Chamber (m3)
PIn-cylinder Pressure (Pascal)
Abbreviations
CACrank Angle
CFMCoupled Flame Model
CFDComputational Fluid Dynamics
CICompression Ignition
GDIGasoline Direct Injection
IMEPIndicated Mean Effective Pressure
PFIPort Fuel Injection
SISpark Ignition
TKETurbulent Kinetic Energy
WIRWater Injection Ratio

References

  1. Gökalp, Ç.; Çınarer, G.; Yeşilyurt, M.K.; Ağbulut, Ü.; Yılbaşı, Z.; Kılıç, K. Application of various machine learning algorithms in view of predicting the CO2 emissions in the transportation sector. Sci. Technol. Energy Transit. 2024, 79, 15. [Google Scholar]
  2. Amiri, S.S.; Mostafavi, N.; Lee, E.R.; Hoque, S. Machine learning approaches for predicting household transportation energy use. City Environ. Interact. 2022, 7, 100044. [Google Scholar] [CrossRef]
  3. Yazilitaş, C.; Yilbaşi, Z.; Yeşilyurt, M. Biodiesel production from hempseed (Cannabis sativa L.) oil: Providing optimum conditions by response surface methodology. Sci. Technol. Energy Transit. (STET) 2024, 79, 11. [Google Scholar] [CrossRef]
  4. Yilbaşi, Z.; Yesilyurt, M.K.; Arslan, M.; Yaman, H. Energy, exergy and exergoeconomic assessment of a compres-sion-ignition engine powered by 1-pentanol, 1-hexanol or 1-heptanol/hempseed oil biodiesel/diesel. Interna-Tional J. Exergy 2023, 42, 410–432. [Google Scholar] [CrossRef]
  5. Yilbaşi, Z.; Yeşilyurt, M.K.; Arslan, M.; Yaman, H. Understanding the performance, emis-sions, and combustion behaviors of a DI diesel engine using alcohol/hemp seed oil biodiesel/diesel fuel ternary blends: Influence of long-chain alcohol type and concentration. Sci. Technol. Energy Transit. 2023, 78, 5. [Google Scholar] [CrossRef]
  6. Yilbaşi, Z.; Yesilyurt, M.K.; Yaman, H.; Arslan, M. The industrial-grade hemp (Cannabis sativa L.) seed oil biodiesel application in a diesel engine: Combustion, harmful pollutants, and performance characteristics. Sci. Technol. Energy Transit. 2022, 77, 15. [Google Scholar] [CrossRef]
  7. Escobar-Jiménez, R.F.; Cervantes-Bobadilla, M.; García-Morales, J.; Aguilar, J.G.; Pérez, J.H.; Alvarez-Gallegos, A. Short communication: The effects of not controlling the hydrogen supplied to an internal combustion engine. Int. J. Hydrogen Energy 2020, 45, 14991–14996. [Google Scholar] [CrossRef]
  8. Verhelst, S.; Wallner, T. Hydrogen-fueled internal combustion engines. Prog. Energy Combust. Sci. 2009, 35, 490–527. [Google Scholar] [CrossRef]
  9. Lamas, M.I.; Rodriguez, C.G. Numerical model to analyze Nox reduction by ammonia injection in diesel-hydrogen engines. Int. J. Hydrog. Energy 2017, 4, 26132–26141. [Google Scholar] [CrossRef]
  10. Castro, N.; Toledo, M.; Amador, G. An experimental investigation of the performance and emissions of a hydrogen-diesel dual fuel compression ignition internal combustion engine. Appl. Therm. Eng. 2019, 156, 660–667. [Google Scholar] [CrossRef]
  11. White, C.M.; Steeper, R.R.; Lutz, A.E. The hydrogen-fueled internal combustion engine: A technical review. Int. J. Hydrog. Energy 2005, 31, 1292–1305. [Google Scholar] [CrossRef]
  12. Taghavifar, H.; Khalilarya, S.; Mirhasani, S.; Jafarmadar, S. Numerical energetic and exergetic analysis of CI diesel engine performance for different fuels of hydrogen, dimethyl ether, and diesel under various engine speeds. Int. J. Hydrog. Energy 2014, 39, 9515–9526. [Google Scholar] [CrossRef]
  13. Hames, Y.; Kaya, K.; Baltacioglu, E.; Turksoy, A. Analysis of the control strategies for fuel saving in the hydrogen fuel cell vehicles. Int. J. Hydrog. Energy 2018, 43, 10810–10821. [Google Scholar] [CrossRef]
  14. Blum, L.; Deja, R.; Peters, R.; Stolten, D. Comparison of efficiencies of low, mean and high temperature fuel cell Systems. Int. J. Hydrog. Energy 2011, 36, 11056–11067. [Google Scholar] [CrossRef]
  15. Krishnanunni, J.; Bhatia, D.; Das, L.M. Experimental and modelling investigations on the performance and emission characteristics of a single cylinder hydrogen engine. Int. J. Hydrog. Energy 2017, 42, 29574–29584. [Google Scholar] [CrossRef]
  16. Ghazal, O.H. Performance and combustion characteristic of CI engine fueled with hydrogen enriched diesel. Int. J. Hydrog. Energy 2013, 38, 15469–15476. [Google Scholar] [CrossRef]
  17. Boretti, A. Advances in hydrogen compression ignition internal combustion engines. Int. J. Hydrog. Energy 2011, 36, 12601–12606. [Google Scholar] [CrossRef]
  18. Antunes, J.M.G.; Mikalsen, R.; Roskilly, A.P. An experimental study of a direct injection compression ignition hydrogen engine. Int. J. Hydrog. Energy 2009, 34, 6516–6522. [Google Scholar] [CrossRef]
  19. Barilo, N.F.; Weiner, S.C.; James, C.W. Overview of the DOE hydrogen safety, codes and standards program part 2: Hydrogen and fuel cells: Emphasizing safety to enable commercialization. Int. J. Hydrog. Energy 2016, 42, 7625–7632. [Google Scholar] [CrossRef]
  20. Xing, L.; Xiang, W.; Zhu, R.; Tu, Z. Modeling and thermal management of proton exchange membrane fuel cell for fuel cell/battery hybrid automotive vehicle. Int. J. Hydrog. Energy 2022, 47, 1888–1900. [Google Scholar] [CrossRef]
  21. Stockhausen, W.F.; Natkin, R.J.; Kabat, D.M.; Reams, L.; Tang, X.; Hashemi, S.; Szwabowski, S.J.; Zanardelli, V.P. Ford P2000 Hydrogen Engine Design and Vehicle Development Program; SAE Technical Paper: Warrendale, PA, USA, 2002. [Google Scholar]
  22. Tang, X.; Kabat, D.M.; Natkin, R.J.; Stockhausen, W.F.; Heffel, J. Ford P2000 Hydrogen Engine Dynamometer Development; SAE Transactions: Warrendale, PA, USA, 2002; pp. 631–642. [Google Scholar]
  23. Wallner, T.; Lohse-Busch, H.; Gurski, S.; Duoba, M.; Thiel, W.; Martin, D.; Korn, T. Fuel economy and emissions evaluation of BMW Hydrogen 7 Mono-Fuel demonstration vehicles. Int. J. Hydrog. Energy 2008, 33, 7607–7618. [Google Scholar] [CrossRef]
  24. Pan, H.; Pournazeri, S.; Princevac, M.; Miller, J.W.; Mahalingam, S.; Khan, M.Y.; Jayaram, V.; Welch, W.A. Effect of hydrogen addition on criteria and greenhouse gas emissions for a marine diesel engine. Int. J. Hydrog. Energy 2014, 39, 11336–11345. [Google Scholar] [CrossRef]
  25. Sun, Z.-Y.; Liu, F.-S.; Liu, X.-H.; Sun, B.-G.; Sun, D.-W. Research and development of hydrogen fuelled engines in China. Int. J. Hydrog. Energy 2012, 37, 664–681. [Google Scholar] [CrossRef]
  26. Becherif, M.; Ramadan, H.; Cabaret, K.; Picard, F.; Simoncini, N.; Béthoux, O. Hydrogen energy storage: New techno-economic emergence solution analysis. Energy Procedia 2015, 74, 371–380. [Google Scholar] [CrossRef]
  27. Abe, J.O.; Popoola, A.; Ajenifuja, E.; Popoola, O. Hydrogen energy, economy and storage: Review and recommendation. Int. J. Hydrog. Energy 2019, 44, 15072–15086. [Google Scholar] [CrossRef]
  28. Chen, Y.; Lou, D.; Zhang, Y.; Fang, L.; Yang, D.; Ren, D.; Song, G. An investigation on the H2O, unburned H2 and NO emission characteristics from a direct injection hydrogen engine. Int. J. Hydrog. Energy 2024, 81, 1181–1191. [Google Scholar] [CrossRef]
  29. Mingrui, W.; Sa, N.T.; Turkson, R.F.; Jinping, L.; Guanlun, G. Water injection for higher engine performance and lower emissions. J. Energy Inst. 2017, 90, 285–299. [Google Scholar] [CrossRef]
  30. Chintala, V.; Subramanian, K. Experimental investigation of hydrogen energy share improvement in a compression ignition engine using water injection and compression ratio reduction. Energy Convers. Manag. 2016, 108, 106–119. [Google Scholar] [CrossRef]
  31. Fu, L.; Wu, Z.; Yu, X.; Deng, J.; Hu, Z.; Li, L. Experimental investigation of combustion and emission characteristics for internal combustion rankine cycle engine under different water injection laws. Energy Procedia 2015, 66, 89–92. [Google Scholar] [CrossRef]
  32. Arabaci, E.; İçingür, Y. Thermodynamic investigation of experimental performance parameters of a water injection with exhaust heat recovery six-stroke engine. J. Energy Inst. 2016, 89, 569–577. [Google Scholar] [CrossRef]
  33. Nour, M.; Kosaka, H.; Abdel-Rahman, A.K.; Bady, M. Effect of water injection into exhaust manifold on diesel engine combustion and emissions. Energy Procedia 2016, 100 (Suppl. C), 178–187. [Google Scholar] [CrossRef]
  34. Berni, F.; Breda, S.; Lugli, M.; Cantore, G. A numerical investigation on the potentials of water injection to increase knock resistance and reduce fuel consumption in highly downsized GDI engines. Energy Procedia 2015, 81, 826–835. [Google Scholar] [CrossRef]
  35. Ma, X.; Zhang, F.; Han, K.; Zhu, Z.; Liu, Y. Effects of intake manifold water injection on combustion and emissions of diesel engine. Energy Procedia 2014, 61, 777–781. [Google Scholar] [CrossRef]
  36. Arabaci, E.; İçingür, Y.; Solmaz, H.; Uyumaz, A.; Yilmaz, E. Experimental investigation of the effects of direct water injection parameters on engine performance in a six-stroke engine. Energy Convers. Manag. 2015, 98, 89–97. [Google Scholar] [CrossRef]
  37. Bozza, F.; De Bellis, V.; Teodosio, L. Potentials of cooled EGR and water injection for knock resistance and fuel consumption improvements of gasoline engines. Appl. Energy 2016, 169, 112–125. [Google Scholar] [CrossRef]
  38. Yu, H.; Su, Y.; Shen, B.; Zhang, Y.; Wang, B.; Xie, F. Experimental study on knock suppression by direct water injection and direct ammonia-water injection based on low-flow injector under high load. Appl. Therm. Eng. 2024, 255, 124055. [Google Scholar] [CrossRef]
  39. Ianniello, R.; Pipicelli, M.; Di Luca, G.; Beatrice, C.; Di Blasio, G. A study on supercritical water injection as waste heat recovery system in in-ternal combustion engines. Appl. Therm. Eng. 2024, 248, 123084. [Google Scholar] [CrossRef]
  40. Taghavifar, H.; Anvari, S.; Parvishi, A. Benchmarking of water injection in a hydrogen-fueled diesel engine to reduce emissions. Int. J. Hydrog. Energy 2017, 42, 11962–11975. [Google Scholar] [CrossRef]
  41. Zhu, Z.; Zhong, X.; Zhao, X.; Wang, Y.; Zheng, Z.; Yao, M.; Wang, H. Numerical investigation on combustion system optimization of stoichiometric operation natural gas engine based on knocking boundary extension. Fuel 2021, 290, 120092. [Google Scholar] [CrossRef]
  42. Sun, Y.; Yu, X.; Dong, W.; Tang, Y. Effects of hydrogen direct injection on engine stability and optimization of control parameters for a combined injection engine. Int. J. Hydrog. Energy 2018, 43, 6723–6733. [Google Scholar] [CrossRef]
  43. Wang, L.; Yang, Z.; Huang, Y.; Liu, D.; Duan, J.; Guo, S.; Qin, Z. The effect of hydrogen injection parameters on the quality of hydrogen–air mixture formation for a PFI hydrogen internal combustion engine. Int. J. Hydrog. Energy 2017, 42, 23832–23845. [Google Scholar] [CrossRef]
  44. Brunt, M.F.; Emtage, A.L. Evaluation of IMEP Routines and Analysis Errors; SAE Transactions: Warrendale, PA, USA, 1996; pp. 749–763. [Google Scholar]
  45. Wang, S.; Ji, C. Cyclic variation in a hydrogen-enriched spark-ignition gasoline engine under various operating conditions. Int. J. Hydrog. Energy 2012, 37, 1112–1119. [Google Scholar] [CrossRef]
  46. Yang, G.; Yang, Z.Z. Analysis of the Hydrogen Engine’s Combustion Process Based on the AVL-FIRE. Mach. Des. Manuf. 2013, 4, 30. [Google Scholar]
  47. Mansoury, M.; Jafarmadar, S.; Talei, M.; Lashkarpour, S. Optimization of HCCI (Homogeneous Charge Compression Ignition) engine combustion chamber walls temperature to achieve optimum IMEP using LHS and Nelder Mead algorithm. Energy 2017, 119, 938–949. [Google Scholar] [CrossRef]
  48. Wu, C.; Deng, K.; Wang, Z. The effect of combustion chamber shape on cylinder flow and lean combustion process in a large bore spark-ignition CNG engine, Evaluation of the turbulent hot jet flame characteristics for achieving high thermal efficiency of hybrid engine. J. Energy Inst. 2016, 89, 240–247. [Google Scholar] [CrossRef]
  49. Schröder, M.; Bätge, T.; Bodenschatz, E.; Wilczek, M.; Bagheri, G. Estimating the turbulent kinetic energy dissipation rate from one-dimensional velocity measurements in time. Atmos. Meas. Tech. 2024, 17, 627–657. [Google Scholar] [CrossRef]
  50. Wang, G.; Yang, F.; Wu, K.; Ma, Y.; Peng, C.; Liu, T.; Wang, L.-P. Estimation of the dissipation rate of turbulent kinetic energy: A review. Chem. Eng. Sci. 2020, 299, 116133. [Google Scholar] [CrossRef]
Figure 1. JH600 engine (a), 3D model of the cylinder (b), side view of the cylinder (c).
Fire 07 00289 g001
Figure 2. Results of mesh independence study.
Fire 07 00289 g002
Figure 3. In-cylinder temperature distributions at 366°CA.
Fire 07 00289 g003
Figure 4. In-cylinder temperature distributions at 396°CA.
Fire 07 00289 g004
Figure 5. In-cylinder mean temperature at 1100 rpm (a), 2500 rpm (b).
Fire 07 00289 g005
Figure 6. In-cylinder mean pressure at 1100 rpm (a), 2500 rpm (b).
Fire 07 00289 g006
Figure 7. IMEP between 360°CA and 400°CA.
Fire 07 00289 g007
Figure 8. In-cylinder velocity distributions at 366°CA.
Fire 07 00289 g008
Figure 9. In-cylinder TKE distributions at 366°CA.
Fire 07 00289 g009
Figure 10. In-cylinder dissipation rate distributions at 366°CA.
Fire 07 00289 g010
Table 1. Parameters of JH600 engine.
ParametersIndexes
Length of Connecting Rod/mm160
Stroke/mm85
Bore/mm94
Compression Ratio9.7:1
Maximum Power/kW30
Maximum power speed/r·min−16000
Maximum Torque/Nm51
Table 2. Boundary condition settings.
ParametersTemperature/K
Liner425
Cylinder head surface450
Piston500
Exhaust valves550
Intake valves450
Table 3. Operating parameter settings.
Initial ConditionsWater Injection Parameters
Crank Position220°CAStarting time361°CA
Pressure0.1 MPaEnd Time365°CA
Temperature400 KTemperature60 °C
A: F ratio36.25WIRs0%, 5%, 10%, 15%
Swirl ratio1.64Ignition Time337°CA
Intake Stroke0~180°CA
Compression Stroke180~360°CA
Power Stroke360~540°CA
Exhaust Stroke540~720°CA
Table 4. Mesh independence study on in-cylinder temperature.
Test GroupsAvg Cell SizeNumber of CellsMax In-Cylinder Mean TemperatureTime Cost
Group 10.8 mm57,9123186.71 K71 min
Group 21.0 mm42,7803207.17 K50 min
Group 31.2 mm35,3643246.06 K42 min
Group 41.4 mm29,6603262.01 K34 min
Disclaimer/Publisher’s Note: The statements, opinions and data contained in all publications are solely those of the individual author(s) and contributor(s) and not of MDPI and/or the editor(s). MDPI and/or the editor(s) disclaim responsibility for any injury to people or property resulting from any ideas, methods, instructions or products referred to in the content.