Abstract
Prescriptions for fuel management are universally applied across the forest types in British Columbia, Canada, to reduce the fire behaviour potential in the wildland–urban interface. Fuel thinning treatments have been advocated as a means of minimizing the likelihood of crown fire development in conifer forests. We hypothesized that these types of prescriptions are inappropriate for the coastal rainforests of the Whistler region of the province. Our study examined the impact of fuel thinning treatments in four stands located in the Whistler community forest. We measured several in-stand microclimatic variables beginning with snow melt in the spring up to the height of fire danger in late summer, at paired thinned and unthinned stand locations. We found that the thinning led to warmer, drier, and windier fire environments. The difference in mean soil moisture, ambient air temperature, and relative humidity between thinned and unthinned stands was significant in the spring with approximate p-values of 0.000217, 9.40 × 10⁻⁵, and 4.33 × 10⁻⁸, respectively, though there were no discernible differences in the late summer. The difference in mean solar radiation, average wind speed, and average cross wind between thinned and unthinned locations are significant in the spring and late summer (with approximate p-values for spring of 9.54 × 10⁻⁷, 0.02101, 1.92 × 10⁻⁹, and for late summer of 2.45 × 10⁻⁷, 4.08 × 10⁻⁶, and 2.45 × 10⁻⁵, respectively).
1. Introduction
Building on the extensive culture of investigation and innovation in wildland fire science in Canada [1], we humbly add our research contribution to determining the effects of fuel thinning on the forest microclimate, and consequently, forest ecosystem sustainability. With the increased ingress of humans into the forest environment, through residential growth and recreational activities, there is less and less tolerance for the incidence of wildfires. Governments have allocated significant tax dollars (CAD 5000 to CAD 7400 per hectare [2]) in fuel management practices to reduce the risk of wildfire. In municipalities like Whistler, British Columbia, Canada, with huge infrastructure investment, the cost of fuel thinning averages CAD 35,000 per ha depending on the ability to offset costs through timber sales [3]. The consequences of wildfire are in turn driving government response which is misdirected at least partly because fire management terms have morphed from their original definition, leading to confusion and misuse (Appendix A).
By limiting our focus to forest fuels, we have lost sight of natural forest resilience as an important factor in mitigating fire behaviour potential. We are ignoring the link between reduced fire intensity and stand conditions on fuel moisture such as slower spring snow melt, the water-holding capacity of coarse woody debris (CWD), and the lower flammability afforded by perennial herbaceous ground vegetation. Partial cutting can increase the severity of the fire climate enough to materially increase the number of days when disastrous crown fires can occur [4].
Fuel thinning was conceived to control the start and spread of crown fires [5,6], which are expected to increase in the future [1,7]. But crown fires are not common in the coastal rainforests of the Pacific Northwest region of North America [8,9]. Crowning forest fires are associated with dense canopy conditions [10], yet fuel thinning also dries out the surface and ground fuels in these forests through the effects of solar radiation [11,12,13] and increases in-stand wind penetration, which can in turn increase crown fire potential [14].
Fuel is one of three principal ingredients (ignition risk and weather being the other two) along with topographic characteristics that strongly influence wildfire activity in an area [1,7,15]. Fuel thinning alone cannot mitigate against wildfire severity under instances of extreme fire behaviour, yet it is the cases associated with critical fire weather conditions that have triggered recent conflagrations in the Pacific Northwest region of North America [9,16,17].
Given the general lack of knowledge on the subject, our research set out to examine the impact of fuel thinning in the coastal rainforest stands of the Whistler region of British Columbia, Canada (Figure 1). We specifically wanted to know whether fuel thinning increases wildfire potential relative to the unthinned forest based on conditions associated with wildfires, namely (a) during spring (i.e., faster snow melt), (b) during the late summer (i.e., drier fuels), and (c) during both seasons (i.e., increased wind speed, ambient air temperature, and solar radiation, and decreased soil moisture and relative humidity).
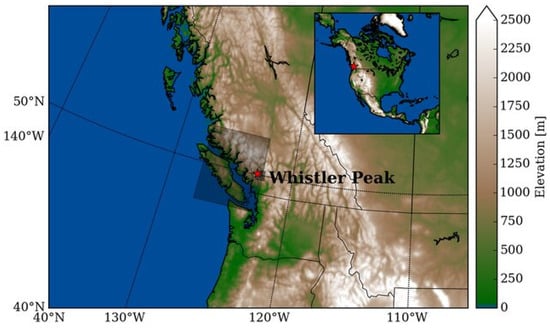
Figure 1.
Geographical location and elevation of the community of Whistler in southwest British Columbia, Canada. Source: http://dx.doi.org/10.5194/acp-16-383-2016 (accessed on 15 June 2024).
2. Materials and Methods
Given the expanse of the study area and to control for confounding effects on microclimate, sampling points were selected using a geographic information system (GIS), ArcGIS Pro Version 2.9, to a priori exclude non-forested fuel types (e.g., wetlands, roads, lakes and infrastructure), and to pair thinned (T) and unthinned (UT) locations by aspect, slope steepness, and forest type, while ensuring the sampling locations were at least 100 m apart (Figure 2). In this region, variation in the local ultraviolet light (UV) input to the forest stand is almost the only source of heat that creates the variability in local weather and fuel conditions we were interested in measuring, so we sampled south-facing slopes which have a longer timeframe of higher UV heating [18]. This would provide the potential contrast in the effect of treatment that we were interested in understanding.
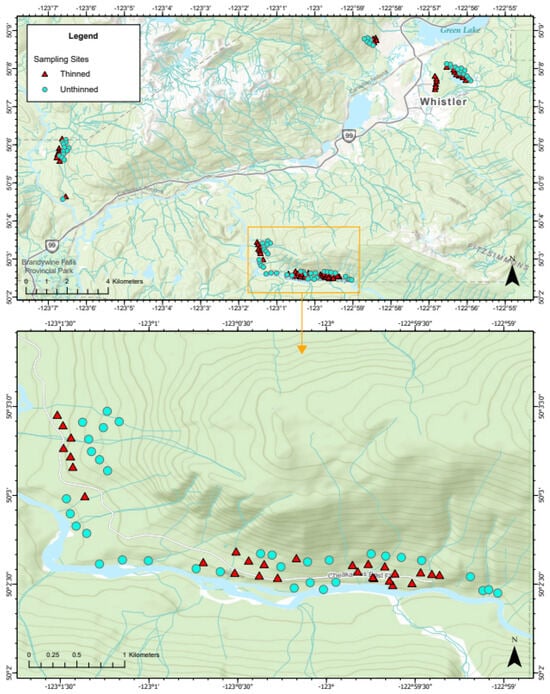
Figure 2.
Example of GIS-derived sampling points (thinned and unthinned) in Cheakamus, one of the four areas sampled in Whistler’s coastal rainforest area.
The characteristics of the sampled forest stands are detailed in Table 1. The four forest sites lie in the Coastal Western Biogeoclimatic zone of British Columbia (https://www.for.gov.bc.ca/hre/becweb/ (accessed on 15 June 2024)). The overstory commonly comprises predominantly mature subalpine fir, western redcedar, Douglas fir, and western hemlock.

Table 1.
Overstory tree and stand characteristics of the study sites.
We replicated sampling at four sites in Whistler’s coastal forest (i.e., Alpine, Lost Lake, Cheakamus, and Callaghan) for two seasons of the year: (1) spring—during snow melt as an indicator of wildfire risk (April); and (2) late summer—during the period of highest fire danger (i.e., the latter part of July to early August). We sampled at 99 point- locations in the spring (n = 44 in T and n = 55 in UT stand locations) (Table 2). More points (n = 111) were accessible in late summer (n = 52 in T and n = 59 in UT locations) than in the spring. We avoided sampling within 24 h of a recent rainfall event and sampled across sites as close in time as possible given the availability of volunteer field assistants.

Table 2.
Sampling design and sample size by treatment and season.
Though we did not sample on consecutive days over the full growing season for all forest areas, our sampling did span spring and late summer, morning to late afternoon, and a full range of ambient air temperatures, relative humidities, and precipitation amounts (Table 3 and Appendix B). It took an average of 2.5 days in the spring and 2 days in late summer to sample all the points at a site.

Table 3.
Range of weather parameters measured in this study’s T and UT stand locations. Source: https://climate.weather.gc.ca/climate_data/ (accessed date 15 June 2024) whistler A (50.128889° N, 122.954722° W) for Alpine and Lost Lake; Cal (50.143905° N, 123.110558° W) for Cheakamus and Callaghan.
At each point, lab-calibrated equipment (Table 4, Figure 3) was used to measure ambient air temperature, relative humidity (RH), wind speed and direction, solar radiation, and soil moisture. In the spring, we included snow depth and snow cover. In late summer, we included fuel moisture, classification of fuel by volume, and digital photos of tree canopy closure and ground fuel (i.e., organic matter, CWD, and living plant cover).

Table 4.
Data collected and the expected direction of effect due to fuel thinning. Each variable is listed with its units and instrument accuracy where relevant. Solar radiation measurements were taken at waist height (110 cm above ground) and Kestrel variables (ambient air temperature, RH and wind speed) at tripod height (134 cm above ground level).
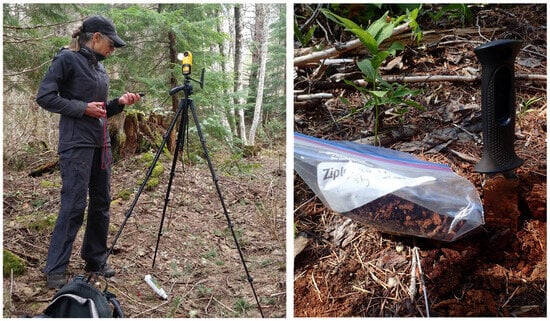
Figure 3.
Field measurement of microclimate variables (left), soil moisture and fuel data (right).
To analyze fuel moisture, samples of surface materials were collected using a trowel to a 3 cm soil depth (Table 5). Each sample was put into a Ziplock plastic bag, labelled with the site location, date, and time of collection on the outside, and stored in a dark cupboard at a temperature of 20 °C and 50% RH for up to nine days. A measured volume (cm2) of each sample was transferred to a half-cup metal container and weighed (to a 0.01 g accuracy) before and after drying.

Table 5.
Number of ground fuel samples collected for fuel moisture content (n = 15 per treatment; n = 30 total).
The proportion of each fuel component was estimated visually at the initial weighing and again by photo analysis in the field. Fuels were categorized as living plants, moss, CWD, needles/cones, chipped wood, and bare ground/rock) to correspond with expected drying times reported in the literature.
No laboratory drying oven was available locally so we purchased the highest-rated food dehydrator that could handle an initial moisture content of 60%, had sufficient and adjustable shelves to dry treated and untreated samples simultaneously, reusable non-stick paraflexx sheets to prevent sample loss, and a constant moderate temperature of 74 °C. We tested for the standard exponential decline in %moisture using this equipment (Figure 4). Fuel moisture content was calculated as the quantity of moisture in the fuel (the difference in weight from initial to dried) and expressed as a percentage of the final weight when thoroughly dried. A food dehydrator has been used to determine the moisture content of soil and vegetative materials on an oven dry weight basis [19,20,21].
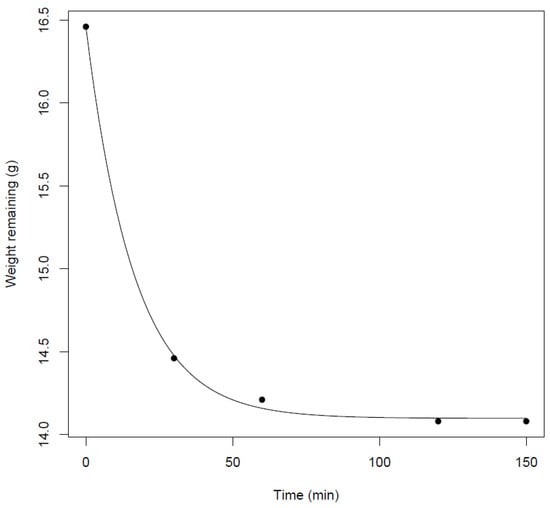
Figure 4.
Exponential decline in moisture over time for treated sites at Lost Lake. Materials included needles, wood, cones, humus, and moss.
Samples were dried at 74 °C until the weight did not change (2.0 to 4.5 h) using a 4-tray food dehydrator with a drying volume of 0.07 m3 (Figure 5). For 10 of the initial 30 samples, we noted an average 0.01 g increase in weight after 120 min (median 240 min) of drying. We attribute this to the spread of one sample to another during the transfer from the drying sheets back to the weighing cup. For this reason, we let subsequent samples dry for a longer initial interval (≥120 min). When weights plateaued or increased, we took the weight before that measured as the dry weight.
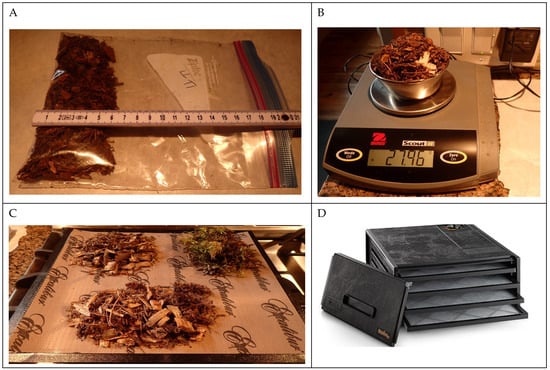
Figure 5.
Drying method for fuel moisture data, where (A) represents the volume (cm−3), (B) represents the weight (g), (C) is the dehydration tray, and (D) is the dehydrator (Excalibur set at 74 °C for 1.0–24 h).
Ground and canopy photos were taken at 78 sites (Table 6) and uploaded to a photo analysis software tool called ImageJ Version 1.54, where a grid (220 cells per image) was overlaid on every image and within each grid, the percent canopy cover (versus clear sky) and percent ground cover by fuel component were calculated (Figure 6). For each image (n = 156), invalid cells (i.e., not clear sky or no ground cover) were ignored and the portion of each valid cell tallied by grid–row for a total percentage per image ± variability across the rows. The average percent ground cover and percent canopy cover were compared by treatment and site. At Lost Lake, photos were only taken at thinned sites because we did not realize the utility of the photos until after UT sites were completed.

Table 6.
Canopy cover and ground cover photo analysis (n = 78 sampling locations; n = 34 in thinned; n = 44 in unthinned). A canopy and a ground photo were taken at each site for a total of n = 156 photos.
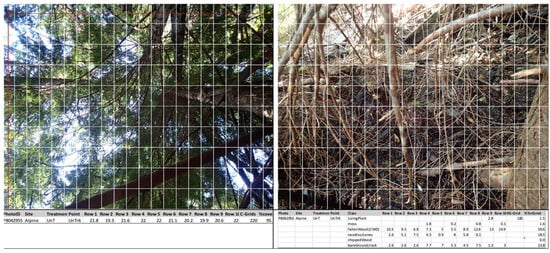
Figure 6.
Example grid overlay for image analysis with the accompanying excel data for the (left) unthinned canopy and (right) ground views at the Alpine site. The red line marks the grid being analysed.
3. Results
3.1. Fuel Thinning Effect on Microclimate
All microclimate variables changed in the direction of an increase in wildfire potential for both portions of the fire season (Table 7 and Table 8). The average increase (absolute value) across all parameters was 58% (unthinned to thinned) in the spring and 37% in late summer. Unthinned points received 12% of the solar radiation measured at thinned stand locations.

Table 7.
Data used in assessment of the effect of thinning or lack thereof on microclimate variables in the spring (UT = unthinned; T = thinned; Avg. = average; SD = standard deviation; and n = sample size).

Table 8.
Data used in assessment of the effect of thinning or lack thereof on microclimate in late summer (UT = unthinned; T = thinned; Avg. = average; SD = standard deviation; n = sample size). Fuel moisture materials included living plant, moss, fallen wood, needles, cones, chipped wood, and bare ground or rock.
Fuel moisture declined an average of 18% from UT to T stands, consistently across all four sites. No snow remained in thinned forest at the time of spring sampling, and in thinned stands in late summer, we found field-detectable soil moisture only at the points with decaying wood chips. At the UT sites, 71% of those with field-detectable moisture contained CWD.
Photo analysis of canopy and ground cover images showed that the T stand locations had 27.05% less canopy, and ground cover did not change appreciably (16.25 versus 16.34%; Table 9 and Table 10). UT ground photos show a more dappled light penetration and retention of large-diameter CWD (Figure 7). The percent cover of living plants was not significantly different in T versus UT stands based on the photo analysis.

Table 9.
Effect of thinning on canopy cover, expressed as a percent of each image taken above the sampling point, then averaged for each site and totaled across sites for each treatment. Photo samples were not taken at Lost Lake.

Table 10.
Effect of thinning on ground cover by fuel components, expressed as a percent of each image taken above the sampling point, then averaged for each site and totaled across sites for each treatment.
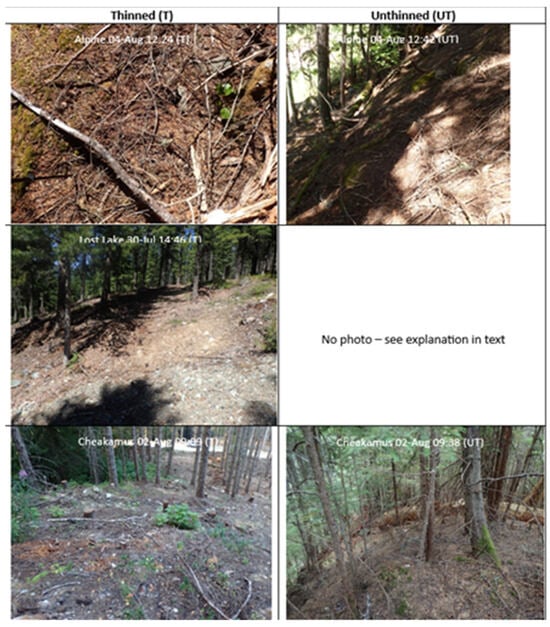
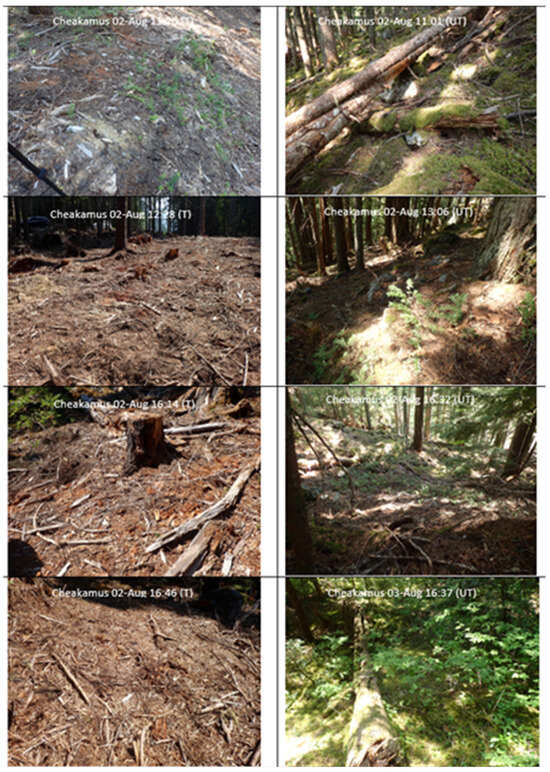
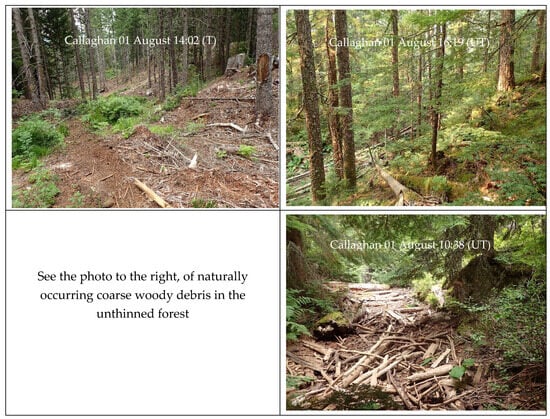
Figure 7.
Example photos of the ground cover by site and treatment, taken while collecting ground fuels. Note: though samples were taken close in time (date and time of day), the light (UV penetration) is dappled at unthinned (UT) sites versus full sun exposure at thinned (T) sites. Also note the loss of water-holding ground plants and large woody debris after thinning compared to sampling locations in the same forest stand that were not thinned.
There was no apparent change in prescription or interpretation of the prescription by the contractor who carried out the thinning operation (Table 11). However, canopy cover is significantly more variable (16.9%) across thinned sites, than it is at unthinned sites (4.9%). Irrespective of year of treatment or contractor, Whistler canopy removal is beyond that of “Moderately-Thinned” prescriptions (Table 11).

Table 11.
Reduction in canopy cover (“T − UT” = “Thinned minus Unthinned”) by year of fuel thinning and contractor employed.
There were other unintended effects beyond microclimate changes associated with the increased wildfire risk. At the Cheakamus and Callaghan thinned areas, we observed an increase in unauthorized trails used by both motorized and non-motorized vehicles, thereby leading to increases in human-caused ignition potential [22]. Evidence of reduced resilience in the forest environment was also observed in the form of bark damage on tree boles as well as soil erosion (Figure 8).
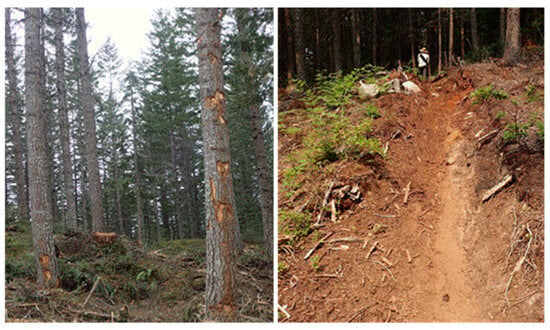
Figure 8.
Reduced forest ecosystem resilience in thinned areas: tree bole damage (left), and soil erosion (right).
3.2. Site Most Susceptible to the Threat of Wildfire
The site most susceptible to the threat of wildfire is defined as the warmest, driest, and windiest site, combined across treatment (thinned, unthinned). Warmest represents the combination of ambient air temperature and solar radiation. Driest is a combination of low RH, low soil moisture, and either less snow remaining in the spring or less moisture in late summer. Windiest is measured directly as the highest average wind speed. Given that each factor is recorded in different units, the factors are first converted to rank order across sites and then the combined rank for each site is compared (Table 12). For each variable (e.g., RH), the four sites are ranked from the highest value for that index (i.e., 4) to the lowest value (i.e., 1). The site most susceptible was Callaghan in the spring and Lost Lake in late summer. To analyze the microclimate effects of fuel thinning, the site most susceptible was compared before and after thinning for heat, dryness, and wind velocity (Table 12); the overall change was an increased risk (+4 Alpine, −3 Lost Lake, +2 Callaghan, −1 Cheakamus).

Table 12.
Summary of site susceptibility to wildfire threat factors. The four sites (A = Alpine; LL = Lost Lake; Cal = Callaghan; and CCF = Cheakamus community forest) were ranked from the highest (4; highlighted in yellow) to lowest (1) for each microclimate variable in the spring and late summer (i.e., the height of fire danger) at thinned versus unthinned sites.
3.3. Grouping the Significance of Microclimate Variables
By applying the lmer function in the lme4 package in R [23], we found that the difference in mean soil moisture, ambient air temperature, and RH between thinned and unthinned stands was significant in the spring with approximate p-values of 0.000217, 9.40 × 10⁻⁵, and 4.33 × 10⁻⁸, respectively. There were no discernible differences in mean soil moisture, ambient air temperature, and RH in the late summer. The difference in mean solar radiation, average wind speed, and average cross wind between T and UT locations are significant in the spring and late summer (with approximate p-values for spring of 9.54 × 10⁻⁷, 0.02101, 1.92 × 10⁻⁹, and for late summer of 2.45 × 10⁻⁷, 4.08 × 10⁻⁶, and 2.45 × 10⁻⁵, respectively).
Using local microclimate data, the models are suggestive of an increased wildfire risk at the T sites compared to the UT sites, due to changes in mean soil moisture, ambient air temperature, and RH in the spring and in mean solar radiation, and average wind speed in both the spring and late summer. The regional meteorological data did not mimic the stand-level microclimate conditions (Appendix C). This was especially true for unthinned portions of the stand which were more unlike the regional situation.
4. Discussion and Conclusions
Our objective was to measure the effect of thinning on the microclimate conditions that are associated with wildfires. The four sites measured for this study are naturally wet and as expected, have not experienced wildfires in recent times despite the wildfire activity across BC. The results of this work suggest the natural resilience has been compromised by thinning.
Our findings are consistent with those of others, e.g., [15,24,25,26], where thinning resulted in increased solar radiation, wind speed, and ambient air temperature, and decreased RH and dead fuel moisture. As Whitehead and others [15,16] have found, the effects on RH and soil moisture were less pronounced in late summer at the height of fire danger. The importance of forest canopy in maintaining high fuel moisture levels was pointed out by Stickel [27] as early as 1931. The level of increased wind speeds we found in thinned stands was like that observed by Bigelow and North [28], which increases the rate of fire spread in fire simulation modelling software. Opening the forest stand results in a warmer, drier, and windier fire environment that creates a net increase in fire hazard [29].
Based on the photo analysis, none of the fuel thinning reduced the canopy cover to the threshold reduction of 27.05% that Gibos [12] noted for solar radiation levels needed to cause increased wildfire risk. Nonetheless, where the forest stands were thinned to below 50% (leaving 34–49% canopy coverage), the solar radiation levels reaching the ground surface were 39 to 65% higher than the unthinned places. Estes et al. [30] found higher moisture in unthinned ponderosa pine only for large CWD in the early season. However, their unthinned plots had less canopy cover than our thinned sites (56% cover in their unthinned versus our 93% cover at unthinned and 63% cover at thinned sites). They noted higher windthrow on unthinned sites.
The ground fuels in thinned forest areas were predominantly covered by bare ground/rock which were associated with higher wildfire risk. Pickering and others [25] found understorey vegetation to be important in mitigating fuel flammability. In our ground photo analysis, living plants were not found to be affected by fuel thinning.
During peak burning conditions in daylight hours (i.e., 1300 to 1700 h local time), the south-facing site was on average 1.4 °C warmer and had an RH 5.5% lower than the north-facing site. Given that fuel moisture and response time of fuel are predicted from RH, and surface temperature is a function of ambient air temperature, wind speed, and solar radiation, fuel thinning in Whistler’s coastal forests has unquestionably increased forest fuel flammability.
Schroeder et al. [31] found unthinned lodgepole pine stands that had similar fuel loads compared to thinned with no slash removal, but the bulk of weight came from larger-sized fuels (>7.0 cm diameter) which did not ignite during outdoor test fires. They found RH to be the best predictor of ignition probability over modelled twig moisture content. Our management concern was not to thin and then remove the fuel load, but to retain the CWD and the microclimate of a closed forest in the first place.
Fuel management is the only approach the Resort Municipality of Whistler is taking for wildland and urban areas. They believe “fuel is the only aspect of the fire behaviour triangle that can be directly managed to reduce wildlife threat” [32]. We need to consider more than fuel in fire management strategies and go beyond a ‘one size fits all’ approach. As Brackebusch [33] pointed out in 1973, “fuel management could lead to a trap of managing land simply for fire control”, where instead “how we manipulate vegetation ought to be tempered by the expected hazard associated”. Again, in Drysdale’s words 27 years later [34], “Further major advances in combating wildfire are unlikely to be achieved simply by continued application of traditional methods. What is required is a more fundamental approach which can be applied at the design stage … such an approach requires a detailed understanding of fire behaviour”.
In general, fire susceptibility increases as RH decreases and ambient air temperature rises. We can increase humidity with sprinklers and perennial herbaceous plants and decrease ambient air temperature by shading (i.e., canopy tree retention, which has the added benefit of reduced air flow on fire spread). The significant funds currently being spent on fuel thinning could be diverted to increased vigilance in the wildland–urban interface (WUI).
The coastal, naturally regenerated forests of the Whistler region require a different fuel management strategy from the dry, wildfire-prone forests around Kelowna in southcentral British Columbia and the plantation forests surrounding Fort Nelson in the northeastern region of the province (Appendix D). The humid climatic conditions in British Columbia’s southwestern coastal forests yield less frequent threatening wildfires [35,36,37,38,39,40]. Fuel thinning prescriptions of today (i.e., selection thinning and crown thinning that maintain multiple canopy layers, along with individual tree selection systems) will not reduce the risk of crown fire occurrence except in the driest of ponderosa pine stands [41]. Silvicultural practices that involve the creation of high-density, even-aged stands of commercial conifer tree species have contributed to an increase in wildfire potential [42,43]. Similarly, unmanaged forests comprising mature ponderosa pine, western white pine, and western larch tend to exhibit tall stems (with the crowns separated from the surface fuels) that are deep-rooted (which are more resilient to drought) and are self-pruned (and therefore lack bridge or ladder fuels), even in moderately dense stands [44].
The topographic differences illustrated in Appendix D (Figure A2 and Table A2), and the slope effect graphs presented in Appendix E (Figure A3), confirm the unique features of mountainous terrain found in British Columbia from a wildfire mitigation standpoint. The Whistler area has a different topographic environment from the high-fire-risk towns in other parts of the province like Fort Nelson, which features a far flatter terrain compared to the Whistler landscape (Table A2). Thinning increased the variability in slope steepness effects, in turn causing extremes in distribution, which are more of a wildfire concern due to their influence on the predictability of fire behaviour during a major wildfire event (Figure A3). This provides further caution as to why fuel thinning, as a strategy for wildfire mitigation, is not appropriate due to the extremes in topography found in southwestern British Columbia.
There is an opportunity to integrate FireSmart [45] efforts with fuel management in the WUI and reduce the harvesting of trees that are essential in mitigating climate change. Solar radiation and wind ingress in FireSmart-thinned stands can be greater than fuel-thinned stands. Research is needed on the potential for planting native perennial herbaceous plants to retain the climate resiliency in the WUI. Mitigating fire hazards with deciduous species provides protection [46]. However, perennial herbaceous plants would provide year-round, RH-enhancing cover.
Gibos [12] found that a FireSmart-thinned stand received 30% of the solar radiation and 30% of the wind measured in the open and was significantly warmer than all other stands during the peak solar radiation period of the day. In this study, unthinned locations in the stands received 12% of the solar radiation measured in the thinned portions of the stand in the spring and 5% in late summer. Gibos [12] found FireSmart-thinned stands had wind speeds 18% higher than unthinned stands, compared to the 3–5 fold higher wind speed levels we observed at thinned versus unthinned locations within the stand associated with this study.
Further work is required to quantify the increased risk of wildfire ignitions due to improved access by motorized vehicles (i.e., dirt bikes, quads, and side-by-sides) [22].
What is the confounding effect of a change in prescription and contractor when it comes to fuel thinning? The digital photo analysis revealed considerable variation in implementation. Our stands were moderate to heavily thinned compared to those of Bigelow and North [28], who recorded a difference in canopy cover of 69 ± 7% to 57 ± 6% for lightly thinned stands and 49 ± 8% in moderately thinned stands.
Our results also suggest that the recent provincial strategy to remove debris using broadcast burning of woody surface debris [47] following mechanized thinning will enhance the drying of ground and surface fuels. The retention of higher soil moisture in the late summer was associated with CWD in unthinned stands and wood chips in thinned stands. The removal of woody debris by burning releases carbon into the atmosphere, and both burning and/or the physical clearing of the debris remove organic matter (important for soil fertility and moisture retention) and enhance moisture loss by exposing tree roots [48,49,50,51]. The removal of post-thinning wood chips should be curtailed until their importance in retaining soil moisture is better understood.
Significant funds have been spent on fuel thinning in the coastal rainforests of British Columbia. The CAD 10.1 million allocated in 2022 for Whistler alone [52] could have been directed towards research in collaboration with the FireSmart programme, to test the efficacy of planting green fuelbreaks on the urban side of the WUI, to protect infrastructure, instead of removing trees which are essential for climate change mitigation and, based on this research, maintain a fire-resilient microclimate. The current FireSmart prescription of harvesting conifer trees is opening up urban spaces, leading to increased warming and drying, which is in turn exacerbating the heat and drought stress already occurring in concert with climate change.
Where fuel thinning is proven to be efficacious (i.e., reduces wildfire risk), monitoring for other adverse effects should be included, specifically, the effect of fuel thinning on native wildlife populations (i.e., on the displacement of habitat-specialist species by disturbance-related species), and on soils with respect to fertility, erosion, and water retention. In communities like Whistler where the economy is dependent on recreation and tourism, the focus should be on the retention of the natural features of the forest ecosystem. Further research is required to understand the importance of CWD and old-growth trees in retaining the fire-resilient microclimate while also maintaining ecosystem function.
Our results show that fuel thinning on south-facing slopes in the coastal rainforests of southwestern British Columbia has a greater impact on the wildfire risk in unthinned stands in the same forest type. Under the conditions examined in this study, for the relevant days of monitoring (Table 3 and Appendix B), we are in turn increasing the wildfire risk with fuel thinning practices. The additional ignition risk of opening up the forest to unauthorized trails is a further reason to halt this practice. These results are consistent with those of Taylor and others [53] and Countryman [4], who found that the probability of wildfire severity increased in older stands. The topographic features of the Whistler region and other communities in the mountainous areas across southern British Columbia are of concern when it comes to fuel thinning as a strategy for wildfire mitigation. Further research is required to determine how general the increased wildfire risk is across other topographic forest conditions.
Author Contributions
Conceptualization, R.L.M.; methodology, R.L.M. and M.E.A.; validation, W.J.B. and M.E.A.; analysis, R.L.M., W.J.B. and S.F.; writing—original draft preparation, R.L.M. and M.E.A.; project administration, R.L.M. All authors have read and agreed to the published version of the manuscript.
Funding
The authors declare no specific funding for this work. This work is an example of citizen science, led and funded personally by volunteer scientists. Shabnam Fani and W. John Braun were able to participate thanks to their ongoing funding from the Natural Sciences and Engineering Research Council of Canada under its NSF-NSERC Global Centres program (Award number AWD-026932).
Informed Consent Statement
Not applicable.
Data Availability Statement
The data presented in this study are available on request from the corresponding author.
Acknowledgments
We are grateful for equipment support (AWARE), GIS selection of points and mapping (Clare Greenberg), volunteer data collection (Sarah Bell, Heather Beresford, Loren Hawthorn, Rebecca Merenyl, Frank Poulsen, Colin Rankin, Melanie Tardiff), and forest statistics (Simon Murray). Thanks to Brian Carter (Mapmonsters, Victoria, BC, Canada) for the provision of Figure A2 and Table A2.
Conflicts of Interest
The authors declare no conflicts of interest. There are no potential commercial interests.
Abbreviations
| CWD | Coarse woody debris |
| ECCC | Environment and Climate Change Canada |
| GIS | Geographic information system |
| Quantile–quantile | |
| RH | Relative humidity |
| RMOW | Resort Municipality of Whistler |
| T | Thinned |
| UT | Unthinned |
| WUI | Wildland–urban interface |
Appendix A. Terminology Clarified
Fire management terms have morphed from the original definition (given in italics), leading to confusion and misuse (underlined text). For example, fuel management is defined as the planned manipulation of forest vegetation to decrease the intensity and rate of spread of a wildfire [54,55]. Today, fuel reduction is conducted to create a defensible space in the forest that surrounds the infrastructure at a cost of CAD 2000–8000 per ha [48].
Classically, thinning is defined as “cuttings made in immature stands in order to stimulate the growth of trees that remain and to increase the total yield of useful material from a stand” [56]. Fuel thinning (also called fire thinning, mechanical thinning, and overstory thinning) is based on the management of crown-fire-dominated forests where fuel reduction is expected to reduce the crowning potential without increasing the surface fire intensity. The Resort Municipality of Whistler (RMOW)’s goal is “to reduce fuel loads in the WUI to reduce fire spread from the wildlands into the community and vice versa, and make wildfires easier to suppress”, by removing shrub cover and other vegetative debris, pruning lower tree branches, and removing dense second-growth trees to reduce the number of trees in the stand, in order to retain species considered fire-resistant, reduce fine woody debris while leaving larger CWD, and remove “danger” trees while maintaining high-value wildlife trees where possible, (Resort Municipality of Whistler 28 August 2021).
The goal of a fuelbreak (often mistakenly called a firebreak [57], defensible fuel zone, or community protection zone), is to alter the fire behaviour potential in order to limit or slow a fire’s spread and reduce its flame length, thereby reducing the probability of tree torching and of a fully developed crown fire, thereby providing safe access for firefighting crews. A distinct area outside a community (or other value at risk) of any size and shape where anthropogenic modifications of forest fuels have been conducted to aid in the protection of that community from future wildfires (bold font added to emphasize the original intent). The RMOW’s focus is to reduce tree densities in tight second growth (but by sometimes removing old-growth trees), thin stands 100–200 m from each side of service roads, reduce the available fuels, and create defensible areas for firefighting crews to safely work in.
Appendix B. Distribution of Thinned and Unthinned Sampling Points across the Range in Ambient Air Temperatures and Relative Humidities for Both Spring and Late Summer Seasons
Quantile–quantile (QQ) plots (Figure A1) are used to compare distributions of values in two samples [58]. If the samples are of equal size, the QQ plot is a scatterplot of the sorted values of one sample against the sorted values of the other. For unequal-sized samples, a similar technique is employed but based on certain approximations. For samples coming from the same population, one would expect the minimum and maximum values of each sample to match, as well as all intermediate values. Thus, the plotted points should line up along a 45° line. Large deviations from such a reference line indicate that the distributions are different. In Figure A1, we see some deviations from the straight line, indicating that there is a moderate to large difference between the thinned and unthinned distributions, especially for RH values of 20% for thinned sites. The unthinned sites have RH values ranging from 20 to 40 percent. The points on the RH plot are all above the reference line, which shows that unthinned sites tend to have higher RH in general than thinned sites. The temperature distributions match at the low values, but there is a tendency for temperatures to be somewhat higher for thinned sites than unthinned sites when ambient air temperatures exceed 20 °C.
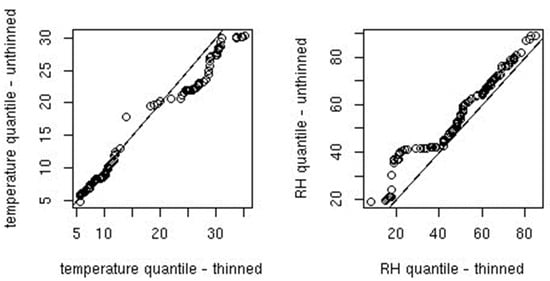
Figure A1.
Quantile–quantile plots of ambient air temperatures (left) and relative humidity (RH) conditions (right) at thinned and unthinned sites. Deviation from the reference line indicates that the distributions are different at the thinned and unthinned sites.
Appendix C. Regional- versus Stand-Level Weather Metric Comparison
The digital elevation model (DEM) used in this analysis reported in Table A2 had a pixel resolution of 25 × 25 m and was derived from the Canadian Digital Elevation Model (CDEM). Each town centroid (Whistler and Fort Nelson) was buffered by 26 km and the DEM was clipped to this circle with a diameter of 52 km. Percent slope was calculated using the Environmental Systems Research Institute (ESRI) spatial analyst “Slope” tool. For each cell, the Slope tool calculates the maximum rate of change in value from that cell to its neighbours. Basically, the maximum change in elevation over the distance between the cell and its eight neighbours identifies the steepest downhill descent from the cell. The rates of change (delta) of the surface in the horizontal (dz/dx) and vertical (dz/dy) directions from the centre cell determine the slope steepness. The basic algorithm used to calculate the slope is as follows: slope radians = ATAN (√ ([dz/dx]2 + [dz/dy]2)). This percent slope steepness output was then clipped to a smaller 50 km diameter circle and classified into each of the four percent slope steepness classes. To compute the area within each class, the 25 × 25 m pixel was converted to ha ((25 × 25)/10,000) and multiplied by the total number of pixels in each class. The total area was calculated using the pixels in the same manner, and proportions were generated by dividing the percent slope steepness class area by the total area.

Table A1.
Whistler weather station metrics compared to the within stand metrics on selected days in the spring (23-April to 09-May) and late summer (29-July to 04-August) of 2021.
Table A1.
Whistler weather station metrics compared to the within stand metrics on selected days in the spring (23-April to 09-May) and late summer (29-July to 04-August) of 2021.
| Site | Date | Local Time 1 | Treatment 2 | Region 3 | Stand | Total AbsDiff √[Ʃ(Region-Stand) 2] | Avg. Diff. by Site, Thinned | Avg. Diff. by Site, Unthinned | % Diff [(UnT − T)/(Unt + T)]% | ||||||
|---|---|---|---|---|---|---|---|---|---|---|---|---|---|---|---|
| RH (%) | Wind (km h−1) | Temp (°C) | Precip. (mm) | RH (%) | Wind (km h−1) | Temp (°C) | Precip. (mm) 3 | ||||||||
| Alpine | 01-May | 15:28 | T | 72.5 | 4.5 | 7.5 | 0.32 | 68.4 | 0.7 | 10.5 | 0.1 | 5.20 | 5.20 | 3.01 | −53.3 |
| 13:44 | UT | 69.7 | 7.7 | 7.8 | 0.32 | 71.1 | 0.0 | 9.4 | 0.0 | 3.01 | |||||
| 04-Aug | 11:36 | T | 16.0 | 9.0 | 31.1 | 0.00 | 28.3 | 4.3 | 27.6 | 0.0 | 12.82 | 12.82 | 10.37 | −21.1 | |
| 10:37 | UT | 36.8 | 2.3 | 25.1 | 0.00 | 46.5 | 0.6 | 21.5 | 0.0 | 10.57 | |||||
| Lost Lake | 23-Apr | 14:31 | T | 53.8 | 5.5 | 11.9 | 0.00 | 51.7 | 9.8 | 11.8 | 0.1 | 2.39 | 6.68 | 10.45 | 44.1 |
| 15:30 | UT | 76.0 | 4.0 | 9.6 | 0.00 | 60.9 | 0.5 | 10.6 | 0.0 | 15.21 | |||||
| 24-Apr | 14:51 | T | 76.0 | 1.0 | 8.2 | 0.00 | 69.9 | 0.8 | 10.2 | 0.0 | 6.38 | ||||
| 14:51 | UT | 84.7 | 3.7 | 8.2 | 0.00 | 90.3 | 0.0 | 8.1 | 0.1 | 5.69 | |||||
| 25-Apr | 13:32 | T | 68.0 | 4.0 | 9.2 | 0.00 | 57.0 | 0.7 | 11.4 | 0.0 | 11.26 | ||||
| UT | - | - | - | - | - | - | - | - | - | ||||||
| 29-Jul | 12:19 | T | 25.0 | 4.0 | 30.0 | 0.00 | 34.3 | 1.3 | 28.4 | 0.0 | 10.13 | 6.95 | - | - | |
| 14:44 | UT | - | - | - | - | 26.3 | 0.8 | 29.7 | 0.0 | - | |||||
| 30-Jul | 11:06 | T | 25.4 | 3.4 | 29.9 | 0.00 | 29.6 | 3.1 | 28.7 | 0.0 | 5.10 | ||||
| UT | - | - | - | - | - | - | - | - | - | ||||||
| Cheakamus | 26-Apr | 13:19 | T | 66.3 | 6.7 | 8.2 | 0.03 | 65.7 | 6.0 | 10.3 | 0.0 | 2.15 | 4.95 | 11.78 | 81.6 |
| 11:50 | UT | 67.0 | 5.5 | 7.9 | 0.00 | 77.1 | 1.4 | 8.0 | 0.0 | 10.17 | |||||
| 27-Apr | 10:41 | T | 78.5 | 2.0 | 7.0 | 0.00 | 65.4 | 3.4 | 10.2 | 0.0 | 13.53 | ||||
| 10:41 | UT | 84.5 | 3.0 | 6.6 | 0.00 | 72.1 | 1.3 | 8.8 | 0.0 | 12.59 | |||||
| 08-May | 12:50 | T | 64.8 | 4.8 | 6.0 | 0.00 | 61.2 | 3.9 | 7.4 | 0.0 | 3.89 | ||||
| 12:50 | UT | 63.8 | 4.3 | 6.3 | 0.00 | 66.7 | 1.5 | 6.9 | 0.0 | 3.06 | |||||
| 09-May | 13:01 | T | 47.3 | 3.7 | 11.1 | 0.00 | 47.5 | 3.6 | 12.9 | 0.0 | 1.79 | ||||
| 13:01 | UT | 56.2 | 5.0 | 9.7 | 0.00 | 55.8 | 1.4 | 11.3 | 0.0 | 1.94 | |||||
| Cheakamus | 31-Jul | 12:45 | T | 55.3 | 1.7 | 22.9 | 0.03 | 52.4 | 1.7 | 22.0 | 0.0 | 3.33 | 7.70 | 8.08 | 4.7 |
| 12:24 | UT | 68.7 | 4.0 | 20.1 | 0.00 | 54.2 | 0.0 | 21.7 | 0.0 | 15.13 | |||||
| 02-Aug | 13:24 | T | 52.3 | 4.3 | 25.0 | 0.00 | 44.4 | 3.1 | 27.4 | 0.0 | 8.84 | ||||
| 12:47 | UT | 48.7 | 6.3 | 25.8 | 0.00 | 52.6 | 1.3 | 25.4 | 0.0 | 7.14 | |||||
| 03-Aug | 13:26 | T | 31.3 | 6.0 | 19.8 | 0.00 | 24.6 | 4.8 | 29.6 | 0.0 | 12.72 | ||||
| 12:56 | UT | 31.8 | 5.4 | 27.7 | 0.00 | 36.9 | 0.5 | 26.4 | 0.0 | 7.45 | |||||
| Callaghan | 02-May | 13:43 | T | 57.0 | 4.0 | 9.3 | 0.00 | 57.3 | 2.8 | 12.7 | 0.0 | 3.39 | 3.39 | 31.11 | 160.7 |
| 11:07 | UT | 49.0 | 4.4 | 10.7 | 0.00 | 80.1 | 0.5 | 9.1 | 0.0 | 31.11 | |||||
| 01-Aug | 12:58 | T | 55.5 | 3.0 | 24.4 | 0.00 | 59.0 | 0.4 | 24.2 | 0.0 | 4.53 | 3.56 | 11.83 | 107.4 | |
| 12:13 | UT | 49.0 | 3.7 | 25.4 | 0.00 | 60.7 | 0.0 | 24.4 | 0.0 | 12.34 | |||||
| Total difference across the 4 areas, between region and stand microclimate indices, by treatment | 51.26 | 86.63 | 51.3 | ||||||||||||
1 Average start to finish sampling time. 2 Treatment type: T = thinned and UT = unthinned. 3 Average of closest Environment and Climate Change (ECCC) weather station for the date and times that correspond to treatment times; a “-” means there were no corresponding ECCC data and Precip. = precipitation.; Source: https://climate.weather.gc.ca/historical_data/search_historic_data_e.html for Whistler A (0.01 km from Nesters station and Whistler; 11.23 km from Callaghan station) accessed 9 July 2024.
Appendix D. The Relative Importance of Topography When Assessing Fire Behaviour Potential
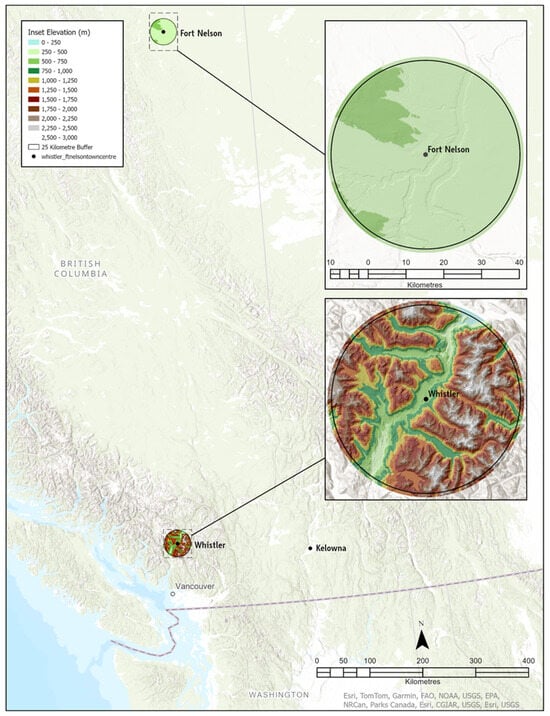
Figure A2.
The mountainous topography of the Whistler region of southern British Columbia versus the flatter terrain found in the Fort Nelson area of the province. Source: Brian Carter, Mapmonsters, Victoria, BC., Canada.

Table A2.
Contrasting topographic environments based on slope steepness classes in southwestern and northeastern British Columbia, Canada. Barrows [59] considered 0–20% as a gentle slope, 21–40% as a moderate slope, 41–60% as a steep slope, and greater than 60% as a very steep slope.
Table A2.
Contrasting topographic environments based on slope steepness classes in southwestern and northeastern British Columbia, Canada. Barrows [59] considered 0–20% as a gentle slope, 21–40% as a moderate slope, 41–60% as a steep slope, and greater than 60% as a very steep slope.
| Geographical Region | Percent Slope Steepness Class | |||
|---|---|---|---|---|
| 0–20% | 21–40% | 40–60% | >60% | |
| Whistler | ||||
| Area (ha) | 36,405 | 54,306 | 52,396 | 53,240 |
| Proportion | 18.6 | 27.7 | 26.7 | 27.1 |
| Fort Nelson | ||||
| Area (ha) | 188,407 | 6890 | 891 | 159 |
| Proportion | 96.0 | 3.5 | 0.5 | 0.1 |
Appendix E. Analysis of Slope Effect on Rate of Fire Speed
Possible interactions between fuel treatments, slope steepness, and wind speed were investigated via a scenario analysis of slope equivalent wind speed and direction. The scenarios considered were the seven coniferous forest fuel types in the Canadian Forest Fire Behavior Prediction (FBP) System [60], crossed with general stand type (i.e., dense or open).
Slope, wind speed, and direction can be converted to the slope equivalent wind velocities (in rectangular coordinates) as described by Equations (47) and (48) in [60]. Slope equivalent wind speed adjustment factors were estimated from Table 5 in [61], which gives adjustments for slopes up to a 70% grade, for each of the seven coniferous forest fuel types. Slopes exceeding 70% were set equal in our calculations. To convert eye-level wind speed measurements to the international 10 m open standard [62], the values were first adjusted to the 20 ft (6.1 m) U.S. open wind speed standard, according to the factors presented in Figure 26 of [63] for open stands (0.2) and dense stands (0.1) with a further adjustment of 15% as recommended by [62] to convert from 20 ft (6.1 m) winds to 10 m open wind speeds.
The result was a set of bivariate data presented in Figure A3, where the black open circles correspond to the wind vectors for thinned stands and the red solid circles correspond to the unthinned stand. The data were partitioned according to season and to whether they were at the Cheakamus location or one of the other locations. Combining the other three locations provided a sample size approximating the Cheakamus location.
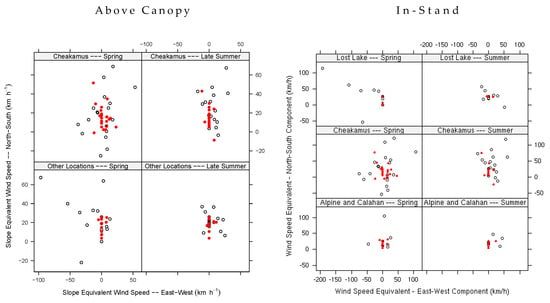
Figure A3.
Box plots of the slope equivalent wind speed at 10 m above the forest canopy and in-stand, for thinned (open circles) and unthinned (red circles) sites in the spring and at the height of fire danger in late summer, at the four forest site locations in the Whistler community forest.
Scenario-based comparisons were made of slope equivalent wind velocity dispersion between treatment groups for each factor level. We used the PERMIDISP2 multivariate test of [64,65] for variance homogeneity based on Euclidean distances. See also [66,67]. Ranges of p-values for the seven FBP System coniferous forest fuel type scenarios and the two general stand type scenarios were obtained. A simulation-based power study was conducted to calculate Bayes Factors (see [68] for a clear discussion of the issues involved) to ensure that the power of the test used was adequate.
The results were clear. The ranges of p-values for the seven FBP System coniferous forest fuel type scenarios under the open stand scenario assumption were 0.000136–0.00104 for spring in Cheakamus; 0.00186–0.0111 for late summer in Cheakamus; 0.00577–0.00924 for spring in the other sites; and 0.00855–0.167 for late summer in the other sites. For the C-7 fuel type specifically, the respective p-values were 0.000158, 0.00395, 0.00692, and 0.0435.
Under the dense stand scenario assumption, the p-value ranges were 0.000006–0.000042 for spring in Cheakamus; 0.00143–0.00280 for late summer in Cheakamus; 0.00579–0.00607 for spring in the other sites; and 0.00634–0.0173 for late summer in the other sites. For the C-7 fuel type specifically, the respective p-values were 0.0000168, 0.00191, 0.00586, and 0.00946. Even with a Bonferroni adjustment for multiple testing, these p-values are all highly suggestive of a difference in dispersion between the thinned and unthinned slope equivalent wind vectors.
The conclusion to be drawn from this analysis is that there is strong evidence that thinning can lead to a change in the variability of the wind field. The plots presented in Figure A3 indicate that the variability does increase. This further implies that more extreme fire behaviour could be expected with scenarios involving thinning in untreated stands.
References
- Coogan, S.C.P.; Daniels, L.D.; Boychuk, D.; Burton, P.J.; Flannigan, M.D.; Gauthier, S.; Kafka, V.; Park, J.S.; Wotton, B.M. Fifty years of wildland fire science in Canada. Can. J. For. Res. 2020, 51, 283–302. [Google Scholar] [CrossRef]
- Beverly, J.L.; Leverkus, S.E.R.; Cameron, H.; Schroeder, D. Stand-level fuel reduction treatments and fire behaviour in Canadian boreal conifer forests. Fire 2020, 3, 35. [Google Scholar] [CrossRef]
- Beresford, H.; (Environmental Manager, Resort Municipality of Whistler, Whistler, Canada). Personal communication, 4 January 2022.
- Countryman, C.M. Old-growth conversion also converts the fire climate. Fire Manag. Today 2021, 79, 19–21. [Google Scholar]
- Van Wagner, C.E. Conditions for the start and spread of crown fire. Can. J. For. Res. 1977, 7, 23–34. [Google Scholar] [CrossRef]
- Agee, J.K.; Skinner, C.N. Basic principles of forest fuel reduction treatments. For. Ecol. Manag. 2005, 211, 83–96. [Google Scholar] [CrossRef]
- Flannigan, M.D.; Wotton, B.M.; Marshall, G.A.; De Groot, W.J.; Johnston, J.; Jurko, N.; Cantin, A.S. Fuel moisture sensitivity to temperature and precipitation: Climate change implications. Clim. Chang. 2016, 134, 59–71. [Google Scholar] [CrossRef]
- Agee, J.K. Fire Ecology of Pacific Northwest Forests; Island Press: Washington, DC, USA, 1993; p. 493. [Google Scholar]
- Reilly, M.J.; Zuspan, A.; Halofsky, J.S.; Raymond, C.; McEvoy, A.; Dye, A.W.; Donato, D.C.; Kim, J.B.; Potter, B.E.; Walker, N.; et al. Cascadia Burning: The historic, but not historically unprecedented, 2020 wildfires in the Pacific Northwest, USA. Ecosphere 2022, 13, e4070. [Google Scholar] [CrossRef]
- Alexander, M.E.; Cruz, M.G. Evaluating the 3-m tree crown spacing guideline for the prevention of crowning wildfires in lodgepole pine forests, Alberta. For. Chron. 2020, 96, 165–173. [Google Scholar] [CrossRef]
- Byram, G.M.; Jemison, G.M. Solar radiation and forest fuel moisture. J. Agric. Res. 1943, 67, 149–176. [Google Scholar]
- Gibos, K.E. Effect of Slope and Aspect on Litter Layer Moisture Content of Lodgepole Pine Stands in the East Slopes of the Rocky Mountains of Alberta. Master’s Thesis, University of Toronto, Toronto, ON, Canada, 2010; pp. 1–155. [Google Scholar]
- Marshall, G.; Thompson, D.K.; Anderson, K.; Simpson, B.; Linn, R.; Schroeder, D. The impact of fuel treatments on wildfire behaviour in North America boreal fuels: A simulation study using FIRETEC. Fire 2020, 3, 18. [Google Scholar] [CrossRef]
- Flannigan, M.D.; Logan, K.A.; Amiro, B.D.; Skinner, W.R.; Stocks, B.J. Future area burned in Canada. Clim. Chang. 2005, 72, 1–16. [Google Scholar] [CrossRef]
- Whitehead, R.J.; Russo, G.; Hawkes, B.C.; Taylor, S.W.; Brown, B.N.; Armitage, O.B.; Barclay, H.J.; Benton, R.A. Effect of Commercial Thinning on Within-stand Microclimate and Fine Fuel Moisture Conditions in a Mature Lodgepole Pine Stand in Southeastern British Columbia; Information Report; FI-X-004; Natural Resources Canada, Canadian Forest Service, Canadian Wood Fibre Centre: Victoria, BC, Canada, 2008; pp. 1–16. [Google Scholar]
- Whitehead, R.J.; Russo, G.L.; Hawkes, B.C.; Taylor, S.W.; Brown, B.N.; Barclay, H.J.; Benton, R.A. Effect of a spaced thinning in mature lodgepole pine on within-stand microclimate and fine fuel moisture content. In Fuels Management—How to Measure Success: Conference Proceedings. Portland, OR, USA, 28–30 March 2006; Andrews, P.L., Butler, B.W., Eds.; Proc. RMRS-P-41; USDA Forest Service, Rocky Mountain Research Station: Fort Collins, CO, USA, 2006; pp. 523–536. [Google Scholar]
- Simpson, M. Case Study 2015 Elaho Fire. Unpublished Work. 2015; 1–10. [Google Scholar]
- Cohen, J.D.; Westhaver, A. An examination of the Lytton, British Columbia wildland-urban fire destruction; Summary report to the British Columbia FireSmart TM Committee. Inst. Catastrophic Loss Res. Pap. 2022, 73, 1–43. [Google Scholar]
- Countryman, C.M. The concept of fire environment. Fire Manag. Today 2004, 64, 49–52. [Google Scholar]
- Beardsley, C.A.; Fuller, K.A.; Reilly III, T.H.; Henry, C.S. Method for Analysis of Environmental Lead Contamination in Soils. Analyst 2022, 146, 7520–7527. [Google Scholar] [CrossRef]
- Peters, J. On-Farm Moisture Testing of Corn Silage, Extension University of Wisconsin-Madison. 2024. Available online: https://cropsandsoils.extension.wisc.edu/articles/on-farm-moisture-testing-of-corn-silage/ (accessed on 15 June 2024).
- Ricotta, C.; Bajocco, S.; IGuglietta, D.; Conedera, M. Assessing the influence of roads on fire ignition: Does land cover matter? Fire 2018, 1, 24. [Google Scholar] [CrossRef]
- Bates, D.; Mächler, M.; Bolker, B.; Walker, S. Fitting linear mixed-effects models using lme4. J. Stat. Softw. 2015, 67, 1–48. [Google Scholar] [CrossRef]
- Kane, J.M. Stand conditions alter seasonal microclimate and dead fuel moisture in a Northwestern California oak woodland. Agric. For. Meteorol. 2021, 308–309, 108602. [Google Scholar] [CrossRef]
- Pickering, B.J.; Duff, T.J.; Baillie, C.; Cawson, J.G. Darker, cooler, wetter: Forest understories influence surface fuel moisture. Agric. For. Meteorol. 2021, 300, 108311. [Google Scholar] [CrossRef]
- Faiella, S.M.; Bailey, J.D. Fluctuations in fuel moisture across restoration treatments in semi-arid ponderosa pine forests of northern Arizona, USA. Int. J. Wildland Fire 2007, 16, 119–127. [Google Scholar] [CrossRef]
- Stickel, P.W. The Measurement and Interpretation of Forest Fire-Weather in the Western Adirondacks; Technical Publication No. 34; Syracuse University, New York State College of Forestry: Syracuse, NY, USA, 1931; pp. 1–115. [Google Scholar]
- Bigelow, S.W.; North, M.P. Microclimate effects of fuels-reduction and group-selection silviculture: Implications for fire behaviour in Sierran mixed-conifer forests. For. Ecol. Manag. 2011, 264, 51–59. [Google Scholar] [CrossRef]
- Weatherspoon, C.P. Fire-Silviculture Relationships in Sierra Forests. In Sierra Nevada Ecosystem Project, Final Report to Congress, II: Vol. II: Assessments and Scientific Basis for Management Options; Water Resources Center Report No. 37; Centers for Water and Wildland Resources, University of California, Davis: Davis, CA, USA, 1996; pp. 1167–1176. Available online: https://pubs.usgs.gov/dds/dds-43/VOL_II/VII_C44.PDF (accessed on 12 May 2023).
- Estes, B.L.; Knapp, E.E.; Skinner, C.N.; Uzoh, C.C. Seasonal variation in surface fuel moisture between unthinned and thinned mixed conifer forest, northern California. Int. J. Wildland Fire 2012, 21, 428–435. [Google Scholar] [CrossRef]
- Schroeder, D.; Russo, G.; Beck, J.; Hawkes, B.; Dalrymple, G. Modelling Ignition Probability of Thinned Lodgepole Pine Stands; Advantage 7(12); Forest Research Institute of Canada: Pointe-Claire, QC, Canada, 2006; pp. 1–8. [Google Scholar]
- Blackwell, B.A. Community Wildfire Resiliency Plan, Resort Municipality of Whistler. 2022; pp. 1-100 + Appendices. Available online: https://www.whistler.ca/services/emergency/fire/community-wildfire-protection-and-preparedness/wildfire-protection-strategy/ (accessed on 15 June 2024).
- Alexander, M.E. A fuels management bibliography with subject index. Fire Manag. Today 2007, 67, 45. [Google Scholar]
- Drysdale, D. Introduction to Fire Dynamics; Wiley: Chichester, UK, 2011; p. 551. [Google Scholar]
- Hallett, D.J.; Lepofsky, D.S.; Mathewes, R.W.; Lertzman, K.P. 11,000 years of fire history and climate in the mountain hemlock rain forests of southwestern British Columbia based on sedimentary charcoal. Can. J. For. Res. 2003, 33, 292–312. [Google Scholar] [CrossRef]
- Hoffman, K.M.; Gavin, D.G.; Lertzman, K.P.; Smith, D.J.; Starzomski, B.M. 13,000 years of fire history derived from soil charcoal in a British Columbia coastal temperate rain forest. Ecosphere 2016, 7, e01415. [Google Scholar] [CrossRef]
- Brown, K.J.; Hebda, N.J.; Conder, N.; Golinski, K.G.; Hawkes, B.; Schoups, G. Changing climate, vegetation, and fire disturbance in a sub-boreal pine-dominated forest, British Columbia, Canada. Can. J. For. Res. 2017, 47, 615–627. [Google Scholar] [CrossRef]
- Brown, K.J.; Hebda, N.J.R.; Schoups, G.; Conder, N.; Smith, K.A.P.; Trofymow, J.A. Long-term climate, vegetation and fire regime change in a managed municipal water supply area, British Columbia, Canada. Holocene 2019, 29, 1411–1424. [Google Scholar] [CrossRef]
- Graham, R.T.; Harvey, A.E.; Jain, T.B.; Tonn, J.R. The Effects of Thinning and Similar stand Treatments on Fire Behavior in Western Forests; General Technical Report; PNW-GTR-463; USDA Forest Service, Pacific Northwest Research Station: Portland, OR, USA, 1999; pp. 1–27. [Google Scholar]
- Lezberg, A.L.; Battaglia, M.A.; Shepperd, W.D.; Schoettle, A.W. Decades-old silvicultural treatments influence surface wildfire severity and post-fire nitrogen availability in a ponderosa pine forest. For. Ecol. Manag. 2008, 255, 49–61. [Google Scholar] [CrossRef]
- Cumming, S.G. Forest type and wildfire in the Alberta boreal mixedwood: What do fires burn? Ecol. Appl. 2001, 11, 97–110. [Google Scholar] [CrossRef]
- Parisien, M.-A.; Barber, Q.E.; Hirsch, K.G.; Stockdale, C.A.; Erni, S.; Wang, X.; Arsenault, D.; Parks, S.A. Fire deficit increases wildfire risk for many communities in the Canadian boreal forest. Nat. Commun. 2020, 11, 2121. [Google Scholar] [CrossRef]
- Countryman, C.M. The Fire Environment Concept; Pacific Southwest Forest and Range Experiment Station: Berkeley, CA, USA, 1972; pp. 1–12. [Google Scholar]
- Lawson, B.D.; Armitage, O.B. Weather Guide for the Canadian Forest Fire Danger Rating System; Canadian Forest Service Northern Forestry Centre: Edmonton, AB, Canada, 2008; pp. 1–73. [Google Scholar]
- PIP. FireSmart: Protecting Your Community from Wildfire, 2nd ed.; Partners in Protection: Edmonton, AB, Canada, 2003; pp. 1–165. [Google Scholar]
- Alexander, M.E. Thoughts on living with fire in Canada’s forests. In Proceedings of the Institute of Catastrophic Loss Reduction (ICLR) Friday Forum; Online, 15 May 2020. Available online: https://www.frames.gov/catalog/61283 (accessed on 15 June 2024).
- Wildfire Prevention. Available online: https://www2.gov.bc.ca/gov/content/safety/wildfire-status/prevention/vegetation-and-fuel-management (accessed on 15 June 2024).
- Stevens, V. The Ecological Role of Coarse Woody Debris: An Overview of the Ecological Importance of CWD in B.C. Forests; Ministry of Forests, British Columbia: Victoria, BC, Canada, 1997; p. 30. [Google Scholar]
- Scheungrab, D.B.; Trettin, C.C.; Lea, R.; Jurgensen, M.F. Woody debris. In General Technical Report SRS-38; U.S. Department of Agriculture, Forest Service, Southern Research Station: Asheville, NC, USA, 2000; pp. 47–48. [Google Scholar]
- Van Galen, L.G.; Jordan, G.J.; Baker, S.C. Relationships between coarse woody debris habitat quality and forest maturity attributes. Conserv. Sci. Pract. 2019, 1, e55. [Google Scholar] [CrossRef]
- Hart, S.C.; Porter, T.M.; Basiliko, N.; Venier, L.; Hajibabaei, M.; Morris, D. Fungal community dynamics and carbon mineralization in coarse woody debris across decay stage, tree species, and stand development stage in northern boreal forests. bioRxiv 2022, 1–65. [Google Scholar] [CrossRef]
- Whistler.Ca. Available online: https://www.whistler.ca/media/news/media-advisory-infrastructure-announcement-whistler?utm_medium=email&utm_campaign=Whistler%20Today%20November%2010%202022&utm_content=Whistler%20Today%20November%2010%202022+CID_36a9958ef0633a2e4eba703717db32dc&utm_source=Email%20marketing%20software&utm_term=Read%20More (accessed on 10 November 2022).
- Taylor, C.; Blanchard, W.; Lindenmayer, D.B. Does forest thinning reduce fire severity in Australian eucalypt forests? Conserv. Lett. 2020, 14, e12766. [Google Scholar] [CrossRef]
- Merrill, D.L. Glossary of Forest Fire Management Terms, 4th ed.; Alexander, M.E., Ed.; NRCC No. 26516; National Research Council of Canada, Canadian Committee on Forest Fire Management: Ottawa, ON, Canada, 1987; pp. 1–91. [Google Scholar]
- Hirsch, K.G.; Pengelly, I. Forest fuels management in theory and practice. In Stand Density Management: Planning and Implementation; Bamsey, C.R., Alberta, E., Eds.; Proceedings of a Conference, November 6–7, 1997; Clear Lake Ltd.: Edmonton, AB, Canadian, 1998; pp. 112–116. [Google Scholar]
- Smith, D.M. The Practice of Silviculture, 7th ed.; John Wiley & Sons: New York, NY, USA, 1962; pp. 1–578. [Google Scholar]
- Alexander, M.E. Are shaded fuelbreaks the answer to Canada’s community wildfire protection problem? For. Chron. 2019, 95, 2–3. [Google Scholar] [CrossRef]
- Braun, W.J.; Murdoch, D.J. A First Course in Statistical Programming with R, 3rd ed.; Cambridge University Press: Cambridge, UK, 2021; pp. 1–257. [Google Scholar]
- Barrows, J.S. Fire Behavior in Northern Rocky Mountain Forests; Station Paper, No. 29; U.S. Department of Agriculture, Forest Service, Northern Rocky Mountain Forest and Range, Experiment Station: Missoula, MT, USA, 1951; pp. 1–103. Available online: https://www.frames.gov/documents/behaveplus/publications/Barrows_1951_SP-29.pdf (accessed on 15 June 2024).
- Forestry Canada Fire Danger Group. Development and Structure of the Canadian Forest Fire Behavior Prediction System; Information Report; ST-X-3; Forestry Canada, Science and Sustainable Development Directorate: Ottawa, ON, Canada, 1992; pp. 1–63. [Google Scholar]
- Taylor, S.W.; Alexander, M.E.; Pike, R.G. Field Guide to the Canadian Forest Fire Behaviour Prediction (FBP) System; Canadian Forest Service, Northern Forestry Centre: Edmonton, AB, Canada, 1997; Volume 11. [Google Scholar]
- Turner, J.A.; Lawson, B.D. Weather in the Canadian forest fire danger rating system. In A User Guide to National Standards and Practices; Information Report. BC-X-177; Canadian Forest Service, Pacific Forestry Centre: Victoria, BC, Canada, 1978; Volume 40. [Google Scholar]
- Andrews, P.L. Modeling Wind Adjustment Factor and Midflame Wind Speed for Rothermel’s Surface Fire Spread Model; Gen. Tech. Rep. RMRS-GTR-266; Department of Agriculture, Forest Service, Rocky Mountain Research Station: Fort Collins, CO, USA, 2012; p. 266. 39p. [Google Scholar]
- Anderson, M.J. Distance-based tests for homogeneity of multivariate dispersions. Biometrics 2006, 62, 245–253. [Google Scholar] [CrossRef]
- Anderson, M.J.; Ellingsen, K.E.; McArdle, B.H. Multivariate dispersion as a measure of beta diversity. Ecol. Lett. 2006, 9, 683–693. [Google Scholar] [CrossRef]
- O’Neill, M.E. A Weighted Least Squares Approach to Levene’s Test of Homogeneity of Variance. Aust. N. Z. J. Stat. 2000, 42, 81–100. [Google Scholar] [CrossRef]
- Stier, A.C.; Geange, S.W.; Hanson, K.M.; Bolker, B.M. Predator density and timing of arrival affect reef fish community assembly. Ecology 2013, 94, 1057–1068. [Google Scholar] [CrossRef]
- Colquhoun, D. An investigation of the false discovery rate and the misinterpretation of p-values. R. Soc. Open Sci. 2014, 1, 140216. [Google Scholar] [CrossRef]
Disclaimer/Publisher’s Note: The statements, opinions and data contained in all publications are solely those of the individual author(s) and contributor(s) and not of MDPI and/or the editor(s). MDPI and/or the editor(s) disclaim responsibility for any injury to people or property resulting from any ideas, methods, instructions or products referred to in the content. |
© 2024 by the authors. Licensee MDPI, Basel, Switzerland. This article is an open access article distributed under the terms and conditions of the Creative Commons Attribution (CC BY) license (https://creativecommons.org/licenses/by/4.0/).