Article

The Impact of Different Ventilation Conditions on Electric Bus Fires

1
College of Building Environment Engineering, Zhengzhou University of Light Industry, Zhengzhou 450001, China
2
Zhengzhou Key Laboratory of Electric Power Fire Safety, Zhengzhou 450001, China
3
School of Electrical Information Engineering, Henan University of Engineering, Zhengzhou 451191, China
*
Author to whom correspondence should be addressed.
Fire 2024, 7(6), 182; https://doi.org/10.3390/fire7060182
Submission received: 25 March 2024 / Revised: 16 May 2024 / Accepted: 21 May 2024 / Published: 25 May 2024

Abstract

:
Once a fire breaks out in an electric bus, it can easily lead to mass casualties and severe injuries, resulting in significant property damage and social impact. The high-temperature smoke and toxic gases in an electric bus fire are key factors that cause a large number of casualties, both of which are closely related to ventilation conditions. In view of this, this study utilized the Fire Dynamics Simulator (FDS 6) software to establish a three-dimensional experimental model of an electric bus. Numerical simulations of the fire combustion process in the electric bus under different ventilation conditions were conducted. Multiple fire scenes were established based on varying ventilation areas, different wind speeds, and diverse window opening positions. This study specifically analyzed the temperature and CO concentration variations under different fire scenes. By comparing the simulation results under different ventilation conditions, it can be concluded that when an electric bus catches fire, opening 100% of the windows, the wind speed is 8 m/s, and opening the rear window of the electric bus first can minimize the fire risk. Through the numerical simulation of electric bus fires under various conditions, this study analyzed the impact of different ventilation conditions on electric bus fires, providing a theoretical basis for firefighting and rescue efforts as well as personnel evacuation in electric bus fire incidents, with the ultimate goal of maximizing public safety.

1. Introduction

Given the continuous challenges posed by energy demands and propelled by the vigorous development of ecological civilization in the country, traditional fuel-powered public buses are gradually being replaced by electric buses thanks to the ongoing advancements in new energy sources such as lithium-ion batteries [1]. In 2022, China’s production and sales of electric vehicles reached 7.058 million and 6.887 million units, respectively, with a year-on-year growth of 96.9% and 93.4%, making it the country with the fastest growth rate of electric vehicles in the world. As the usage of electric buses continues to rise, incidents of fires in electric buses powered by lithium-ion batteries have occurred, posing a severe threat to the personal and property safety of individuals [2,3]. In recent years, typical public bus fire incidents both domestically and internationally are outlined in Table 1.
Electric bus fire accidents are mainly caused by thermal runaway of lithium-ion batteries. The thermal runaway mechanism of lithium-ion batteries is very complex. Through a summary of a large number of lithium-ion battery fires at home and abroad, lithium-ion battery thermal runaway can be divided into three categories [4,5,6,7]: (1) Mechanical abuse (including acupuncture, extrusion deformation, external collision, etc.). The battery first undergoes mechanical deformation under the action of external force, causing mechanical failure of the battery separator or electrode, which in turn causes short circuits, temperature rise, and gas and pressure increase. (2) Electrical abuse (including overcharge, overdischarge, short circuit, etc.). Overcharge and overdischarge of the battery cause internal side reactions. The battery temperature increases faster, the battery begins to expand, and the separator breaks after the casing ruptures, causing thermal runaway. An external short circuit is a dangerous state of rapid battery discharge. The extremely high current causes a rapid temperature rise and even fuses the battery tabs. (3) Thermal abuse (including overheating, thermal shock, fire exposure, etc.), high-temperature environment, or severe heat generation causes thermal accumulation in the battery. When the battery temperature rises to a certain level, a thermal runaway occurs.
Electric buses have the characteristics of being able to transport large mobility of people, large passenger capacity, a tight and narrow space, extensive use of thermoplastic materials inside the carriage, and complex and changeable environment. Fire accidents generally have the characteristics of fast burning speed, rapid-fire development, and difficulty for personnel. Evacuation, the easy accumulation of smoke, and difficulty in extinguishing fires, etc., can easily cause death and injury to people, cause great economic losses and serious social impact [8,9,10], and seriously affect people’s normal life order. Therefore, it is very necessary to carry out numerical simulations of electric bus fires and provide scientific theoretical guidance for the prevention, fighting, and evacuation of electric bus fires.
To understand the thermal runaway behavior of lithium-ion batteries, many studies have focused on thermal runaway experiments with small-scale lithium-ion batteries. The specific details of recent experimental studies on thermal runaway in lithium-ion batteries are shown in Table 2.
In recent years, numerous institutions and scholars, both domestically and internationally, have conducted full-scale experiments on electric vehicle fires, yielding a wealth of findings. The full-scale experimental research on electric vehicle fire is shown in Table 3. Research on electric vehicles has gradually matured, but there remain insufficient studies on the risks of fires in electric buses and corresponding fire prevention measures.
To address the insufficient research on the risks of fires in electric buses and corresponding fire prevention measures, this study utilized PyroSim software 2019 to conduct numerical simulations of electric public bus fires. In recent years, there has been extensive research utilizing PyroSim software to simulate lithium-ion batteries, with the technology becoming mature. The research status of lithium-ion battery fire simulation using PyroSim software is shown in Table 4.
In summary, previous research has predominantly focused on lithium-ion battery packs and electric vehicles, conducting numerous studies on the propagation and fire testing of electric vehicle fires caused by battery systems. However, there has been scant research on fires in electric buses. Yet, when electric buses are involved in fire accidents, there is a high risk of extensive casualties, emphasizing the necessity for deeper investigation [31]. Electric buses contain a significant number of lithium-ion batteries. In the event of a fire, the high-temperature smoke and toxic gases generated by electric buses can severely impede the evacuation and escape of trapped individuals. Therefore, understanding the characteristics of electric public bus fires under different ventilation conditions is crucial. It can assist firefighters in devising more effective firefighting strategies and evacuating passengers efficiently. Additionally, based on research findings, standards and requirements for the performance of ventilation systems in electric buses can be established to ensure the timely removal of harmful gases and the safety of passengers in the event of a fire. Therefore, the main focus of this paper was to conduct comprehensive numerical simulations of electric buses, systematically analyzing the influence of different ventilation conditions on electric bus fires. The goal was to provide scientific recommendations for firefighting, rescue operations, and personnel evacuation in the event of electric bus fire incidents.

2. Materials and Methods

2.1. FDS Model Introduction and Numerical Solution Method

2.1.1. FDS Model Introduction

(1)
Turbulence model
The turbulence model of FDS is divided into two types: large eddy simulation (LES) and direct numerical simulation (DNS). The numerical calculation in this paper was based on the large eddy simulation. The sublattice stress (Smagorinsky) model, which is commonly used in vortex simulation, was applied to deal with small-scale turbulence. The relevant parameters used in the model are as follows:
Viscosity coefficient:
u L E S = ρ ( C s ) 2 s 1 2
s 2 = 2 u x 2 + v y 2 + w z 2 + u y + v x 2 + u z + w x 2 + ( v z + w y ) 2 2 3 ( · u ) 2
Thermal conductivity:
k L E S = u L E S c p p γ
Diffusivity of material:
( ρ D ) L E S = u L E S S c
where Cs is the empirical constant, is the length of the size of a grid cell, |s| is the deformation term, Pγ is the Prandtl number, Sc is the Schmidt number, D is the thermal diffusion coefficient, and Cp is the specific heat at constant pressure.
(2)
Combustion model
The FDS 6 simulation software offers two types of combustion models: mixed-controlled combustion model and finite-rate combustion model. The mixed fraction model requires specifying a single equivalent fuel (composed of C, H, O, and N elements) reacting with oxygen to produce CO2, H2O, CO, and smoke. However, this method requires explicit specification of the atomic ratios of combustible material to equivalent fuel and the given production rates for each product. The finite-rate combustion model directly defines the unit area heat release rate and thermal parameters of the equivalent fuel, and the system derives the corresponding combustion model based on specific geometric information of the object’s surface.
During fire simulation, if only flame combustion effects are considered, the mixed component combustion model can suffice. If the concentration of smoke, carbon dioxide, carbon monoxide, and other gases generated during the fire needs to be studied, finite chemical reaction models need to be incorporated into the calculations. Typically, the simplified formula for the combustion of hydrocarbon fuels such as oil is expressed as equation [32].
v C x H y C x H y + v O 2 O 2 v C O 2 C O 2 + v H 2 O H 2 O
The rate of the occurring chemical reaction is the following:
d C x H y d t = A C x H y a O 2 b e E R T
In Equation (6), A represents the pre-exponential factor of activation energy; v denotes the chemical reaction coefficient; E stands for the activation energy of the reaction, in J/mol; R is the molar gas constant, taken as 8.314 J/(mol∙K); T represents the thermodynamic temperature in Kelvin; and a and b are reaction coefficients.
In this study, the mixed-controlled combustion model was adopted. However, when modeling, only one reaction can be defined in the combustion model. Therefore, it is necessary to equivalently convert the combustion reaction of the combustible material into a substance containing only C, H, O, and N elements. The total heat release rate of battery combustion is mainly influenced by the electrolyte [33], so appropriate adjustments are made based on the chemical composition of the electrolyte to serve as the reactants of the battery combustion reaction. Ultimately, the equivalent combustible material C6.3H7.1O2.1N was used to represent the combustion reaction of the battery.
This study used particle combustion. FDS can track the transport and mixing of various gaseous substances and smoke particles in the fire environment. The mass transport equation can be expressed as follows:
( ρ Y i ) t + · ρ Y i V = · ρ D i Y i + R i
In Equation (7), Yi represents substance i; t stands for time; ρ denotes density; Di is the diffusion coefficient of substance i, measured in m2/s; and Ri represents any source or sink term of substance i, measured in Kg/m3·s.
(3)
Thermal radiation model
This study selected a Discrete Ordinates Method, which decomposes the propagation of radiant energy into a set of discrete angular patterns (called Discrete Ordinates) to accurately simulate the radiative interaction between the flame and the hot surface. FDS uses the finite volume method to solve the radiation transport equation. If space gas has no scattering ability to thermal rays, the radiation transfer equation is as follows:
s · I λ ( x , s ) = k ( x , λ ) I b x I ( x , s )
In the formula, the source term Ib(x) is the blackbody monochromatic radiation force, which is defined by the Planck function. The surface of various objects can be regarded as the gray body diffuse surface, and the radiation heat transfer was calculated using the following formula:
I W s = ε I b w + 1 ε π s · n w < 0 I w ( s ) s · n w d Ω
where Ibw is the surface blackbody radiation intensity, and ε is the radiation emissivity.
(4)
Carbon monoxide concentration control equation
u j ¯ C x j x j ( D m + D t ) C x j = S ,
D t = v t S c t
where C represents the time average concentration of CO, and Dm is the molecular diffusion rate. Dt is the turbulent diffusion rate, S is the volume emission rate of pollutants, and Sct is the turbulence Schmidt number.

2.1.2. Numerical Solution Method
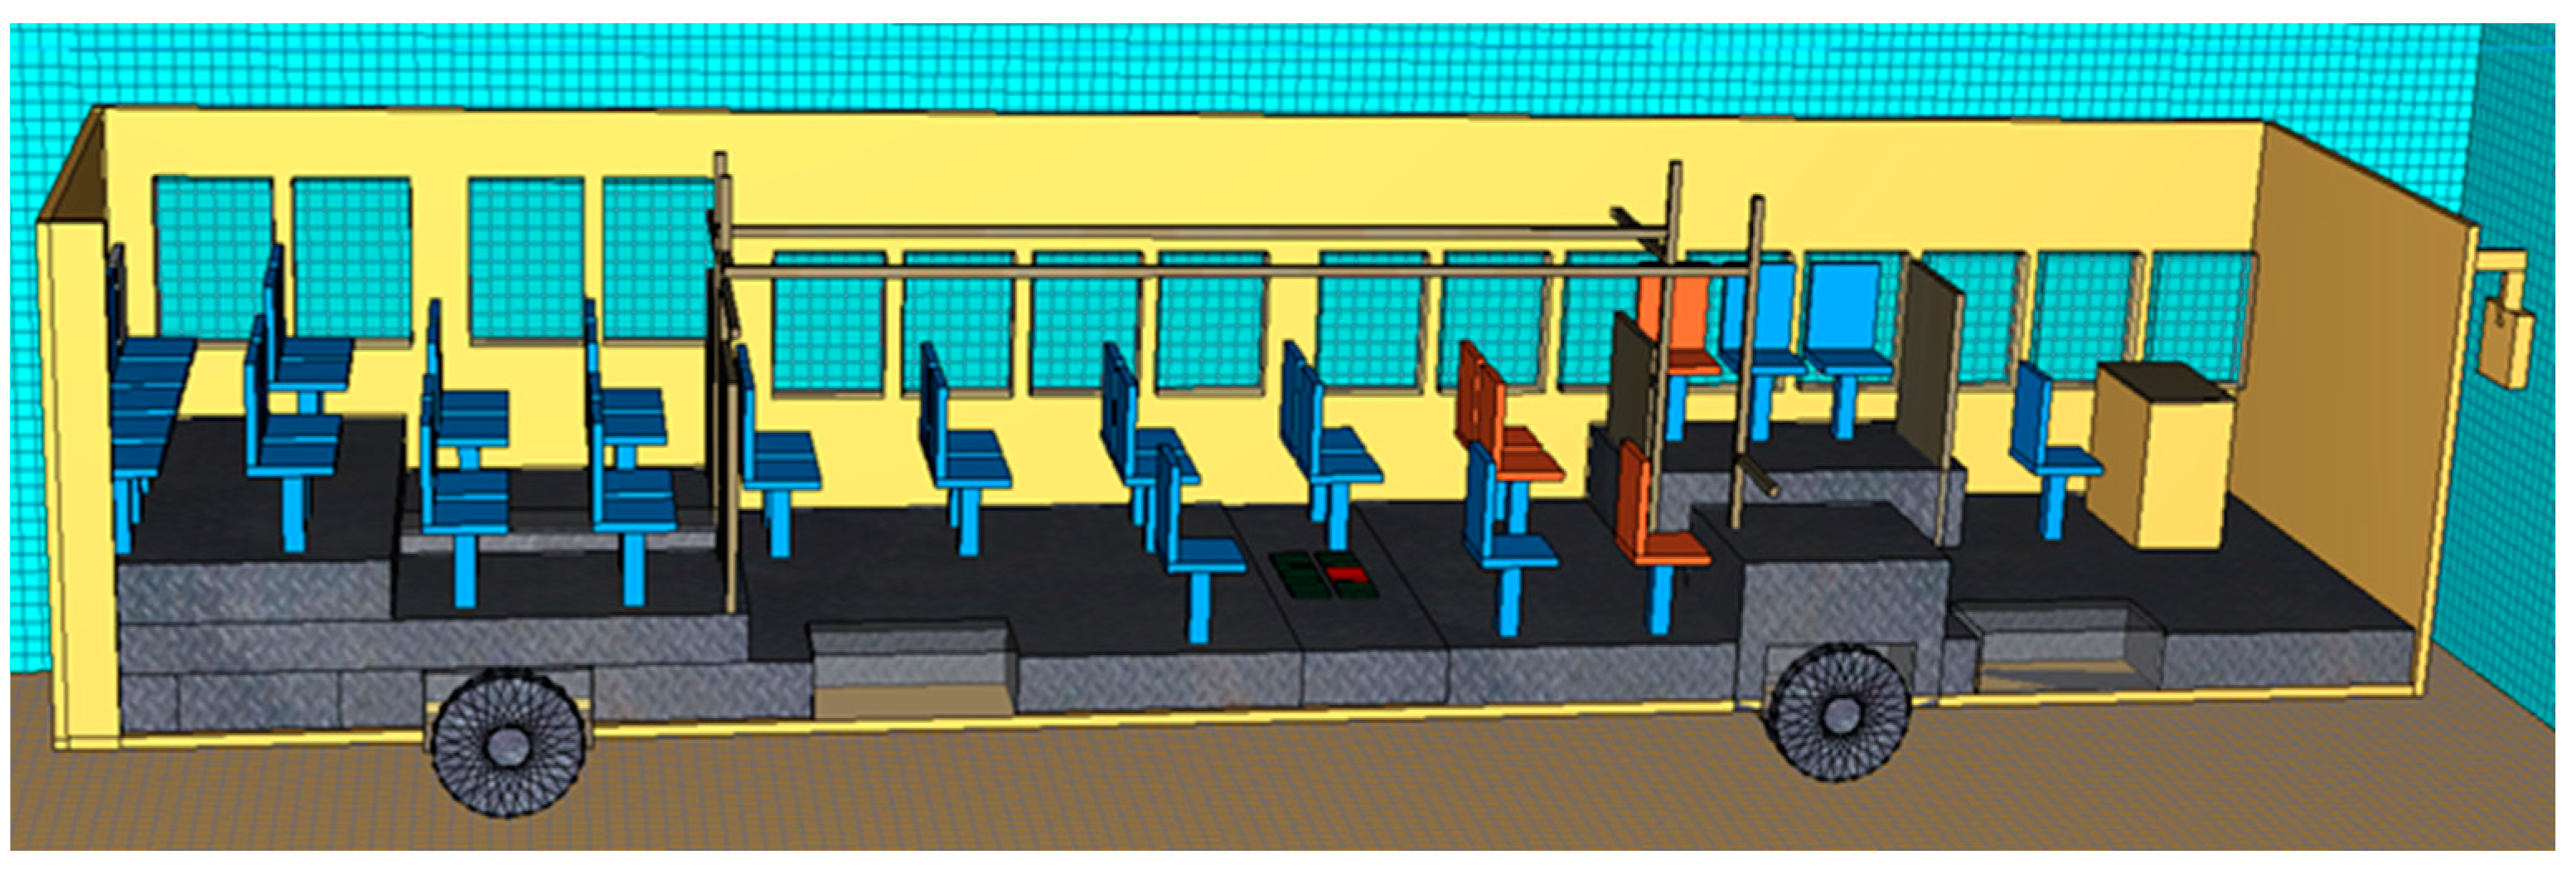
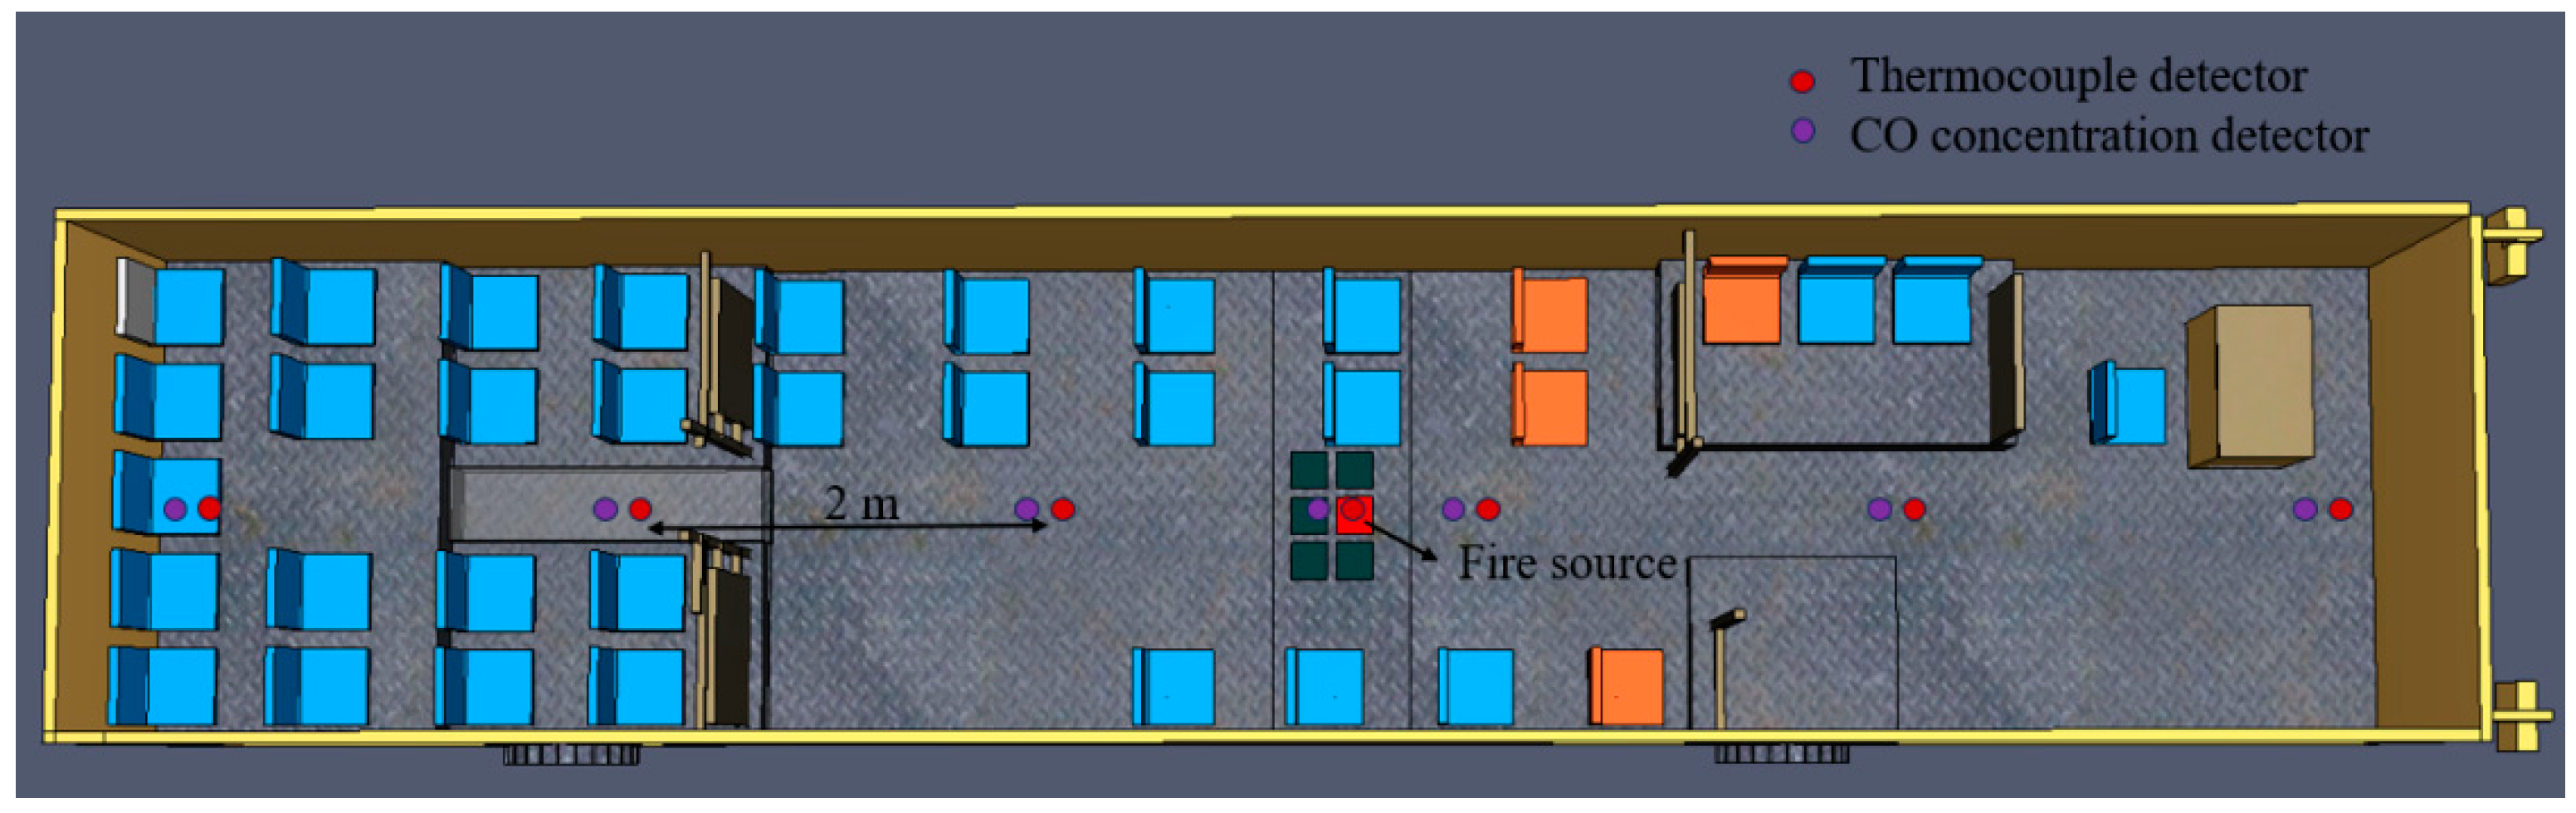
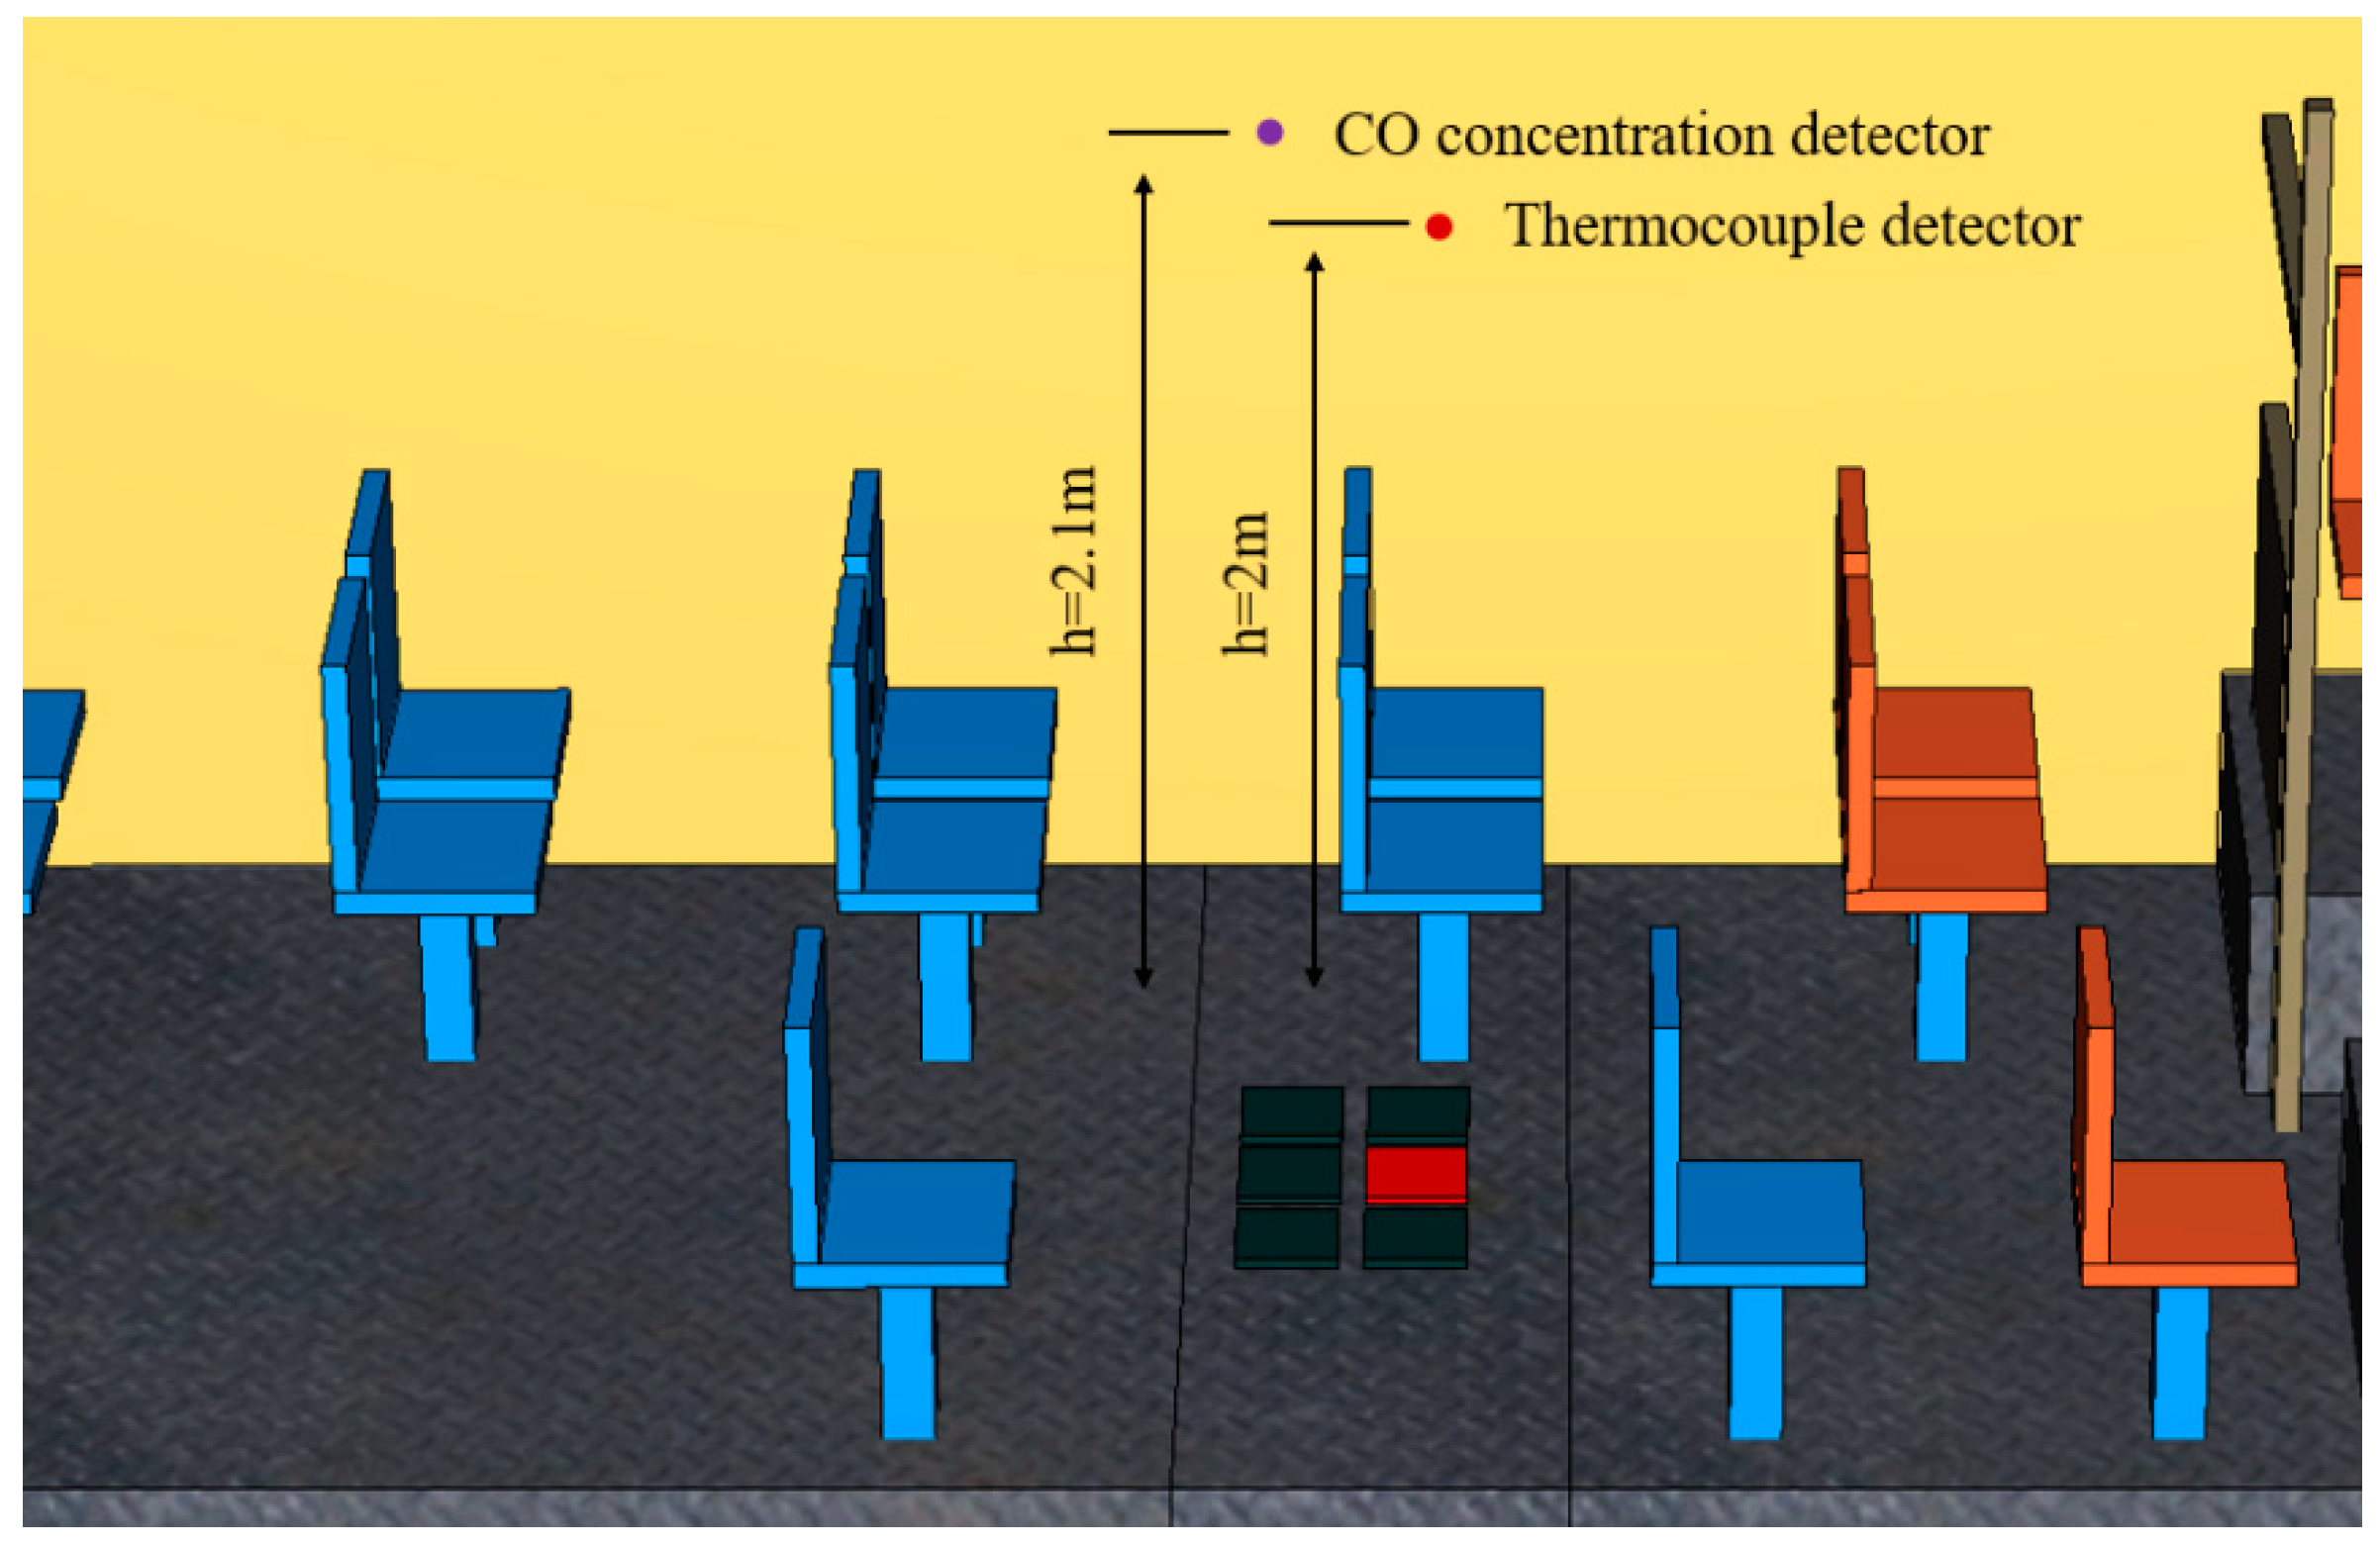
This study utilized the PyroSim 2019 (the built-in version is FDS Version 6) software for the numerical simulation of electric bus fires. It employed the physics models of ODE (Open Dynamics Engine) to calculate the mechanical and motion characteristics of objects. ODE is an open-source physics engine used to simulate the movement and interaction of rigid bodies, soft bodies, and fluids [34]. PyroSim uses kinematics A series of physical formulas, such as equations, dynamic equations, and energy conservation laws, were used to study the changes in various parameters during the fire process. Among them, the main applied equations were as follows:
Mass conservation equation:
ρ t + · ρ μ = 0
In the formula, ρ is the gas density, unit: kg/m3. t is the simulation time, unit: s. μ is the velocity vector, unit: m/s.
Momentum conservation equation:
t ρ μ + · ρ μ + ρ = ρ g + f + · τ i j
In the formula, g is the acceleration of gravity, unit: m/s2. f is the external force vector, unit: N. τij is the Newtonian fluid viscous stress tension, unit: N.
Energy conservation equation:
t ρ h + · ρ h μ = D p D t + q m · q n + Φ
In the formula, h is the apparent enthalpy, unit: J/kg. P is pressure, unit: N. qm is the heat release rate per unit volume, unit: W/m2. qn is the heat flux vector, unit: W/m2. Φ is the dissipation function.
Ideal state gas equation:
p = ρ R T W
In the formula, R is the ideal gas constant, unit: R = 8.134 J/(mol·K). W is the molecular weight of the gas mixture, unit: kg/mol.

2.2. Model Settings

Mao et al. [35] conducted a series of thermal runaway tests on lithium iron phosphate batteries used in a certain electric bus, recording temperature and voltage changes, flame behavior, gas concentration changes, and heat release rates. In order to make the fire simulation results closer to the actual fire process, this article will use the battery cells used in the experimental literature as the research object of the fire simulation. In the experimental literature, the nominal capacity and voltage of the battery cell are 300 Ah and 3.2 V, with dimensions of 180 mm × 70 mm × 205 mm and weight exceeding 5 kg. The geometric model of the battery cell is shown in Figure 1, and the specific thermal physical parameters are presented in Table 5. The heat release rate of the battery cell refers to the experimental literature [35], and the heat release rate of the battery cell is illustrated in Figure 2. Taking a 330 V 300 Ah electric bus as an example, if the battery cells in the literature are used, 18 battery cells need to be connected in series to form a lithium-ion battery pack, for a total of six lithium-ion battery packs. One of the lithium-ion battery packs is then set as a fire source. It can be seen from Figure 2 that the peak fire source heat release rate of a single battery is 88.78 kW. The calculation shows that the maximum fire source heat release rate of a lithium-ion battery pack is approximately 1500 kW.
Q = a t 2
The fire heat release curve of lithium-ion battery is similar to “t2” fire. According to the fire growth coefficient, “rapid fire” was selected as the simulation condition. In Formula (16), a = 0.04689 and Q is 1500 kW, so the calculation can be t = 179 s; that is, the fire source reaches its maximum value at t = 179 s. By referring to the changes in the fire source heat release rate of battery cells in the experimental literature, the simulation time was set to 360 s.
In this study, the simulation model of an electric bus created using PyroSim is illustrated in Figure 3. The electric bus has dimensions of 12.06 m × 2.6 m × 2.91 m. Due to the complex composition of electric buses and numerous combustible parts, for the convenience of research, this article only considered lithium-ion battery packs as combustibles for numerical simulation. The primary focus of this study was the simulation of fires caused by the ignition of lithium-ion batteries in electric buses. The layout of the fire source and detectors is depicted in Figure 4; the red surface is the source of the fire. The specific locations of the detectors are shown in Figure 5, with the distances from the floor of the electric bus compartment to the thermocouple and CO concentration detector being 2 m and 2.1 m, respectively.
However, there are certain limitations to this study: (1) In reality, lithium-ion batteries are located beneath the electric bus, but for the purpose of studying the influence of different ventilation conditions on electric bus fires, this study simplified the fire process by siting the lithium-ion battery on the surface of the electric bus compartment. (2) In order to facilitate the study of the impact of the ventilation area and window opening positions on electric bus fires, all windows were of the same size and were symmetrically distributed in terms of quantity and position around the vehicle. A total of 32 windows were installed, with no consideration given to the effect of doors on the fire.

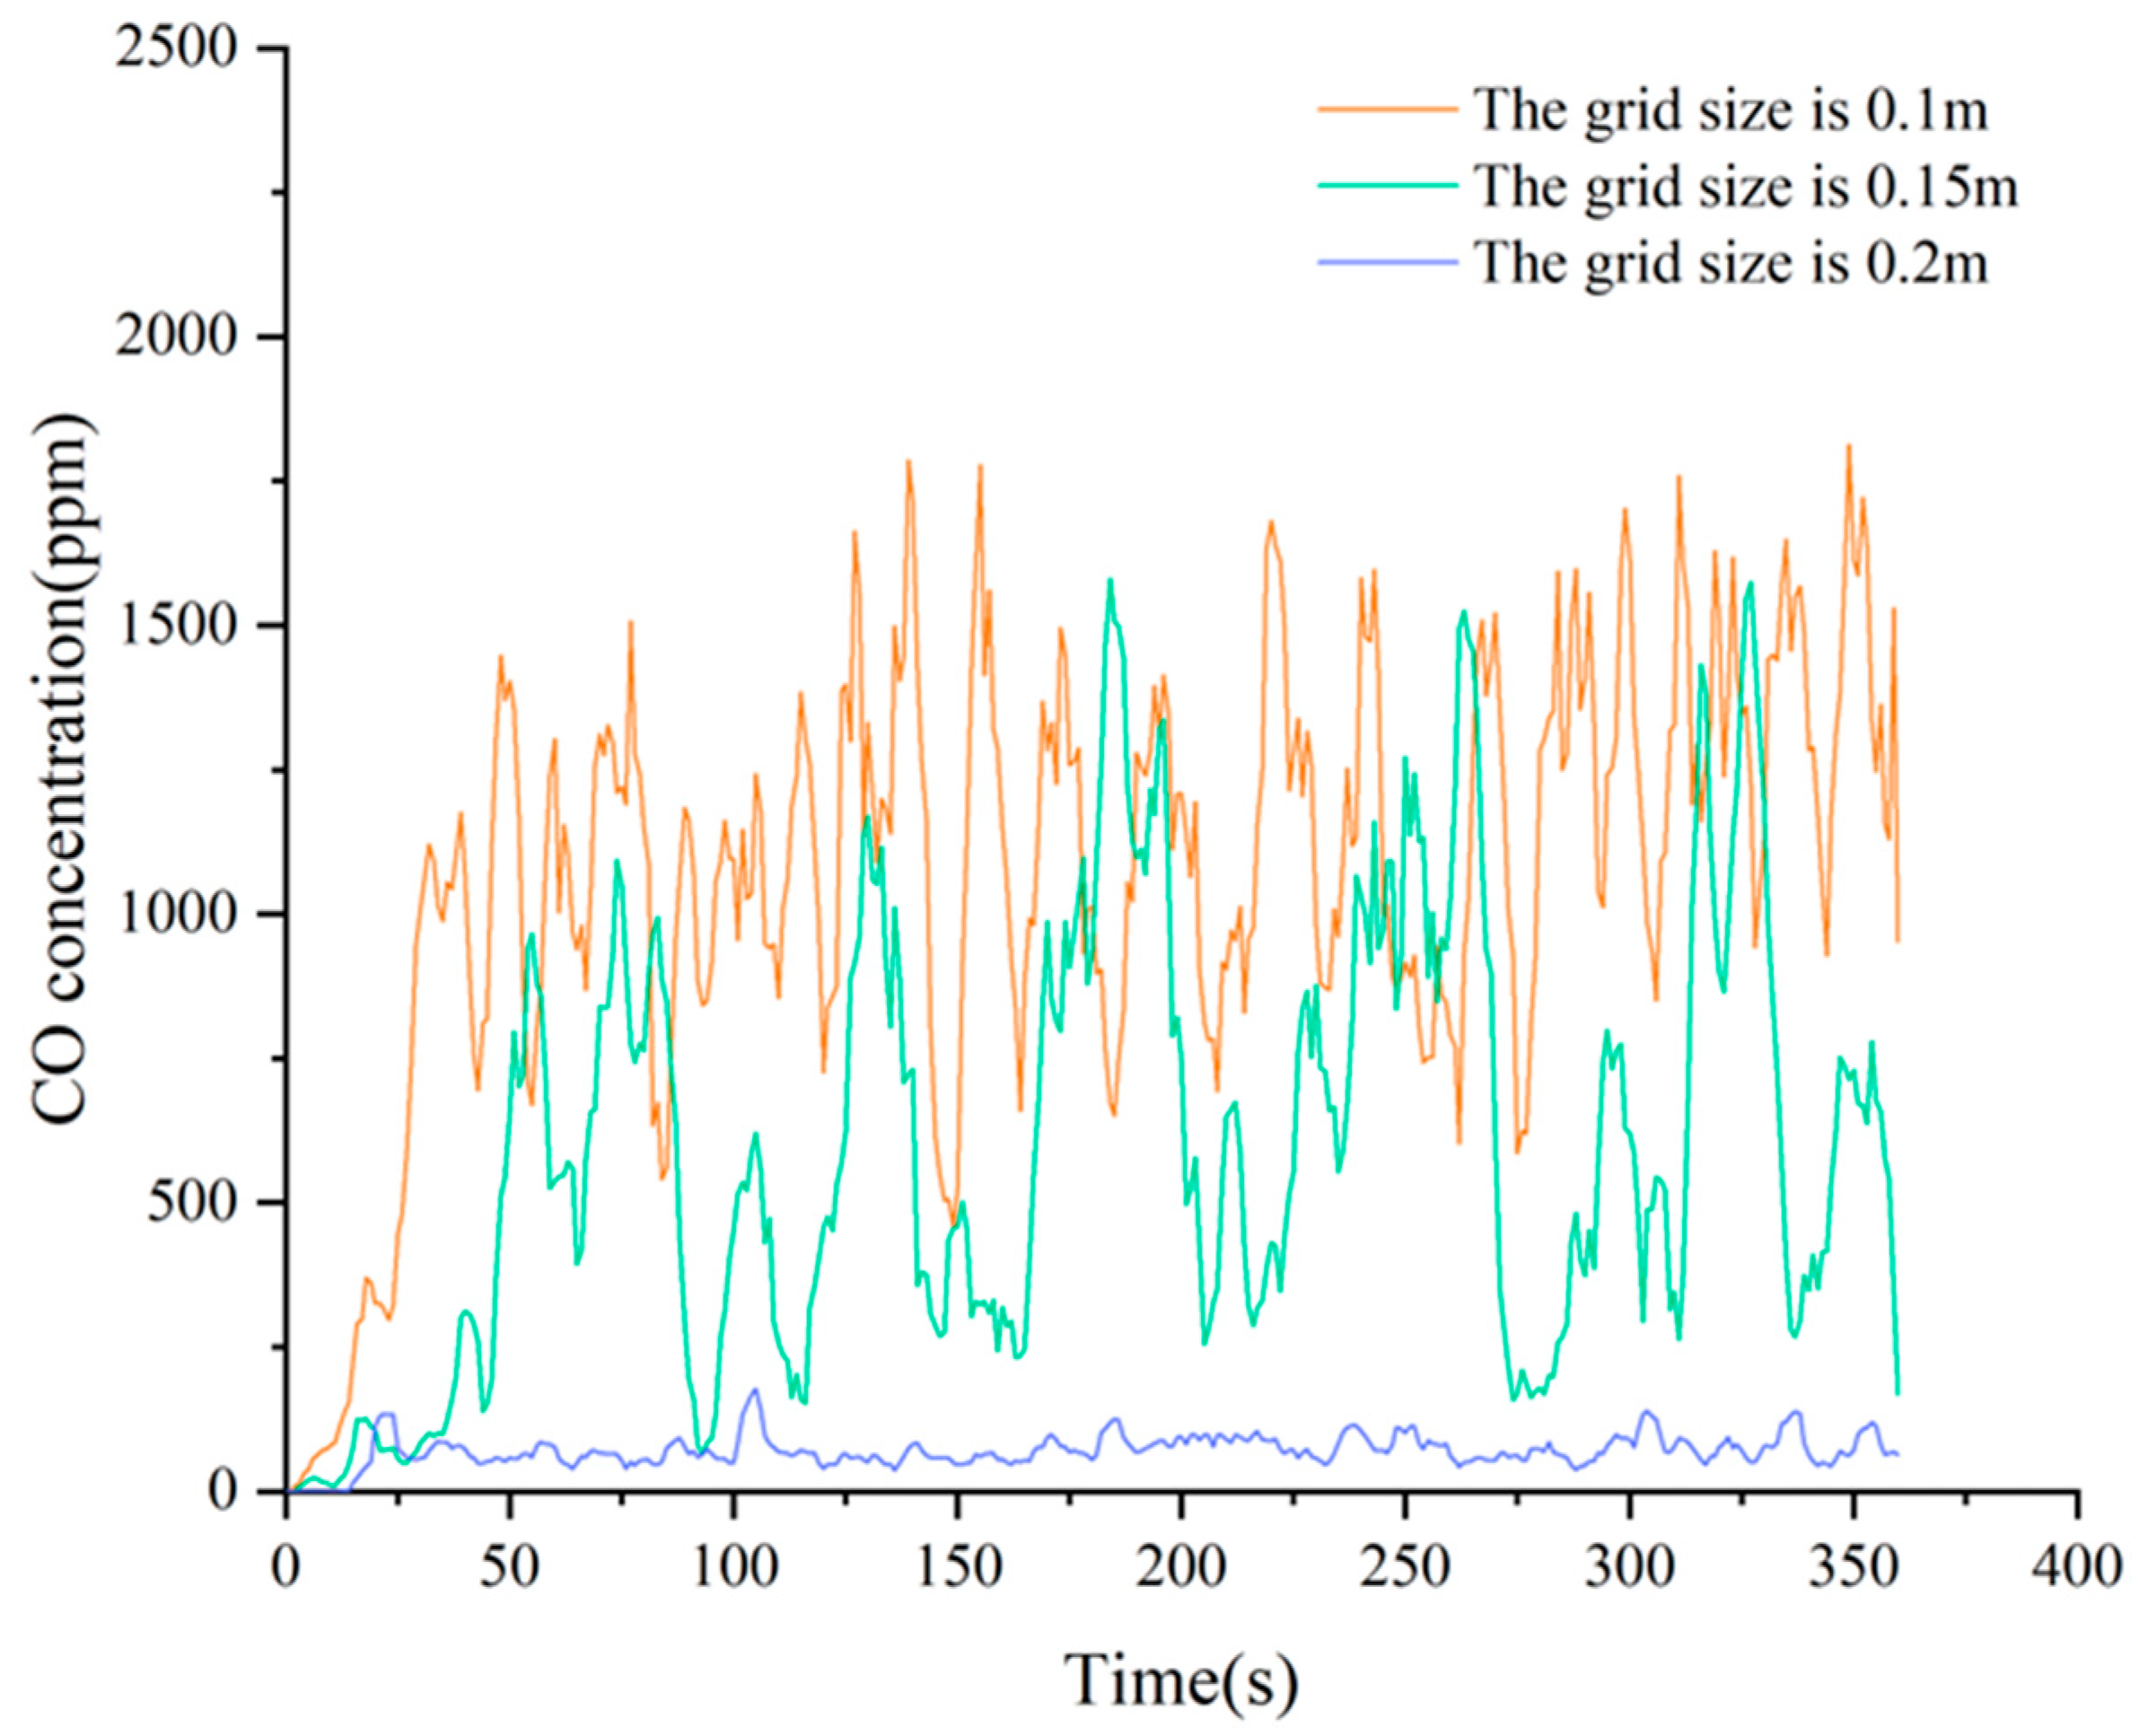
2.3. Grid Independence Verification

The premise of obtaining accurate computational results is to choose an appropriate grid density. When selecting grid density, two main considerations are taken into account: simulation accuracy and computational time. Generally, an accurate simulation result can be obtained when the value of D*/σ is in the range of 4 to 16. Here, D* represents the characteristic diameter of the fire source, measured in meters. σ is the grid size, and the grid size [36] is referenced in Formula (17).
D * = ( Q ρ 0 C p g T 0 ) 2 5
Here, Q represents the fire source power, and the set fire source power for this simulation is 1500 kW. ρ0 is the air density, typically taken as 1.29 kg/m3. Cp is the specific heat capacity of air, typically taken as 1.005 kJ/(kg·K). g is the gravitational acceleration, with a value of 9.8 m2. T0 is the ambient temperature, with a value of 273 K. The calculated value of D* is 1.228, which corresponds to a σ value of between 0.07 m and 0.28 m.
As shown in Figure 6, this study compared the changes in CO concentration inside the electric bus compartment under three grid sizes (0.1 m, 0.15 m, and 0.2 m) with a wind speed of 2 m/s. From the graph, it can be observed that when the grid size is 0.2 m, the CO concentration remains at a very low level throughout. This is because the grid size is too large, and the detector cannot accurately identify the CO gas components. When the grid size is 0.1 m and 0.15 m, the CO concentration rapidly increases after the fire and enters a stable fluctuation phase after 80 s. However, between the two CO concentration curves, the concentration variation is more stable when the grid size is 0.1 m; hence, this study chose a grid size of 0.1 m × 0.1 m × 0.1 m.

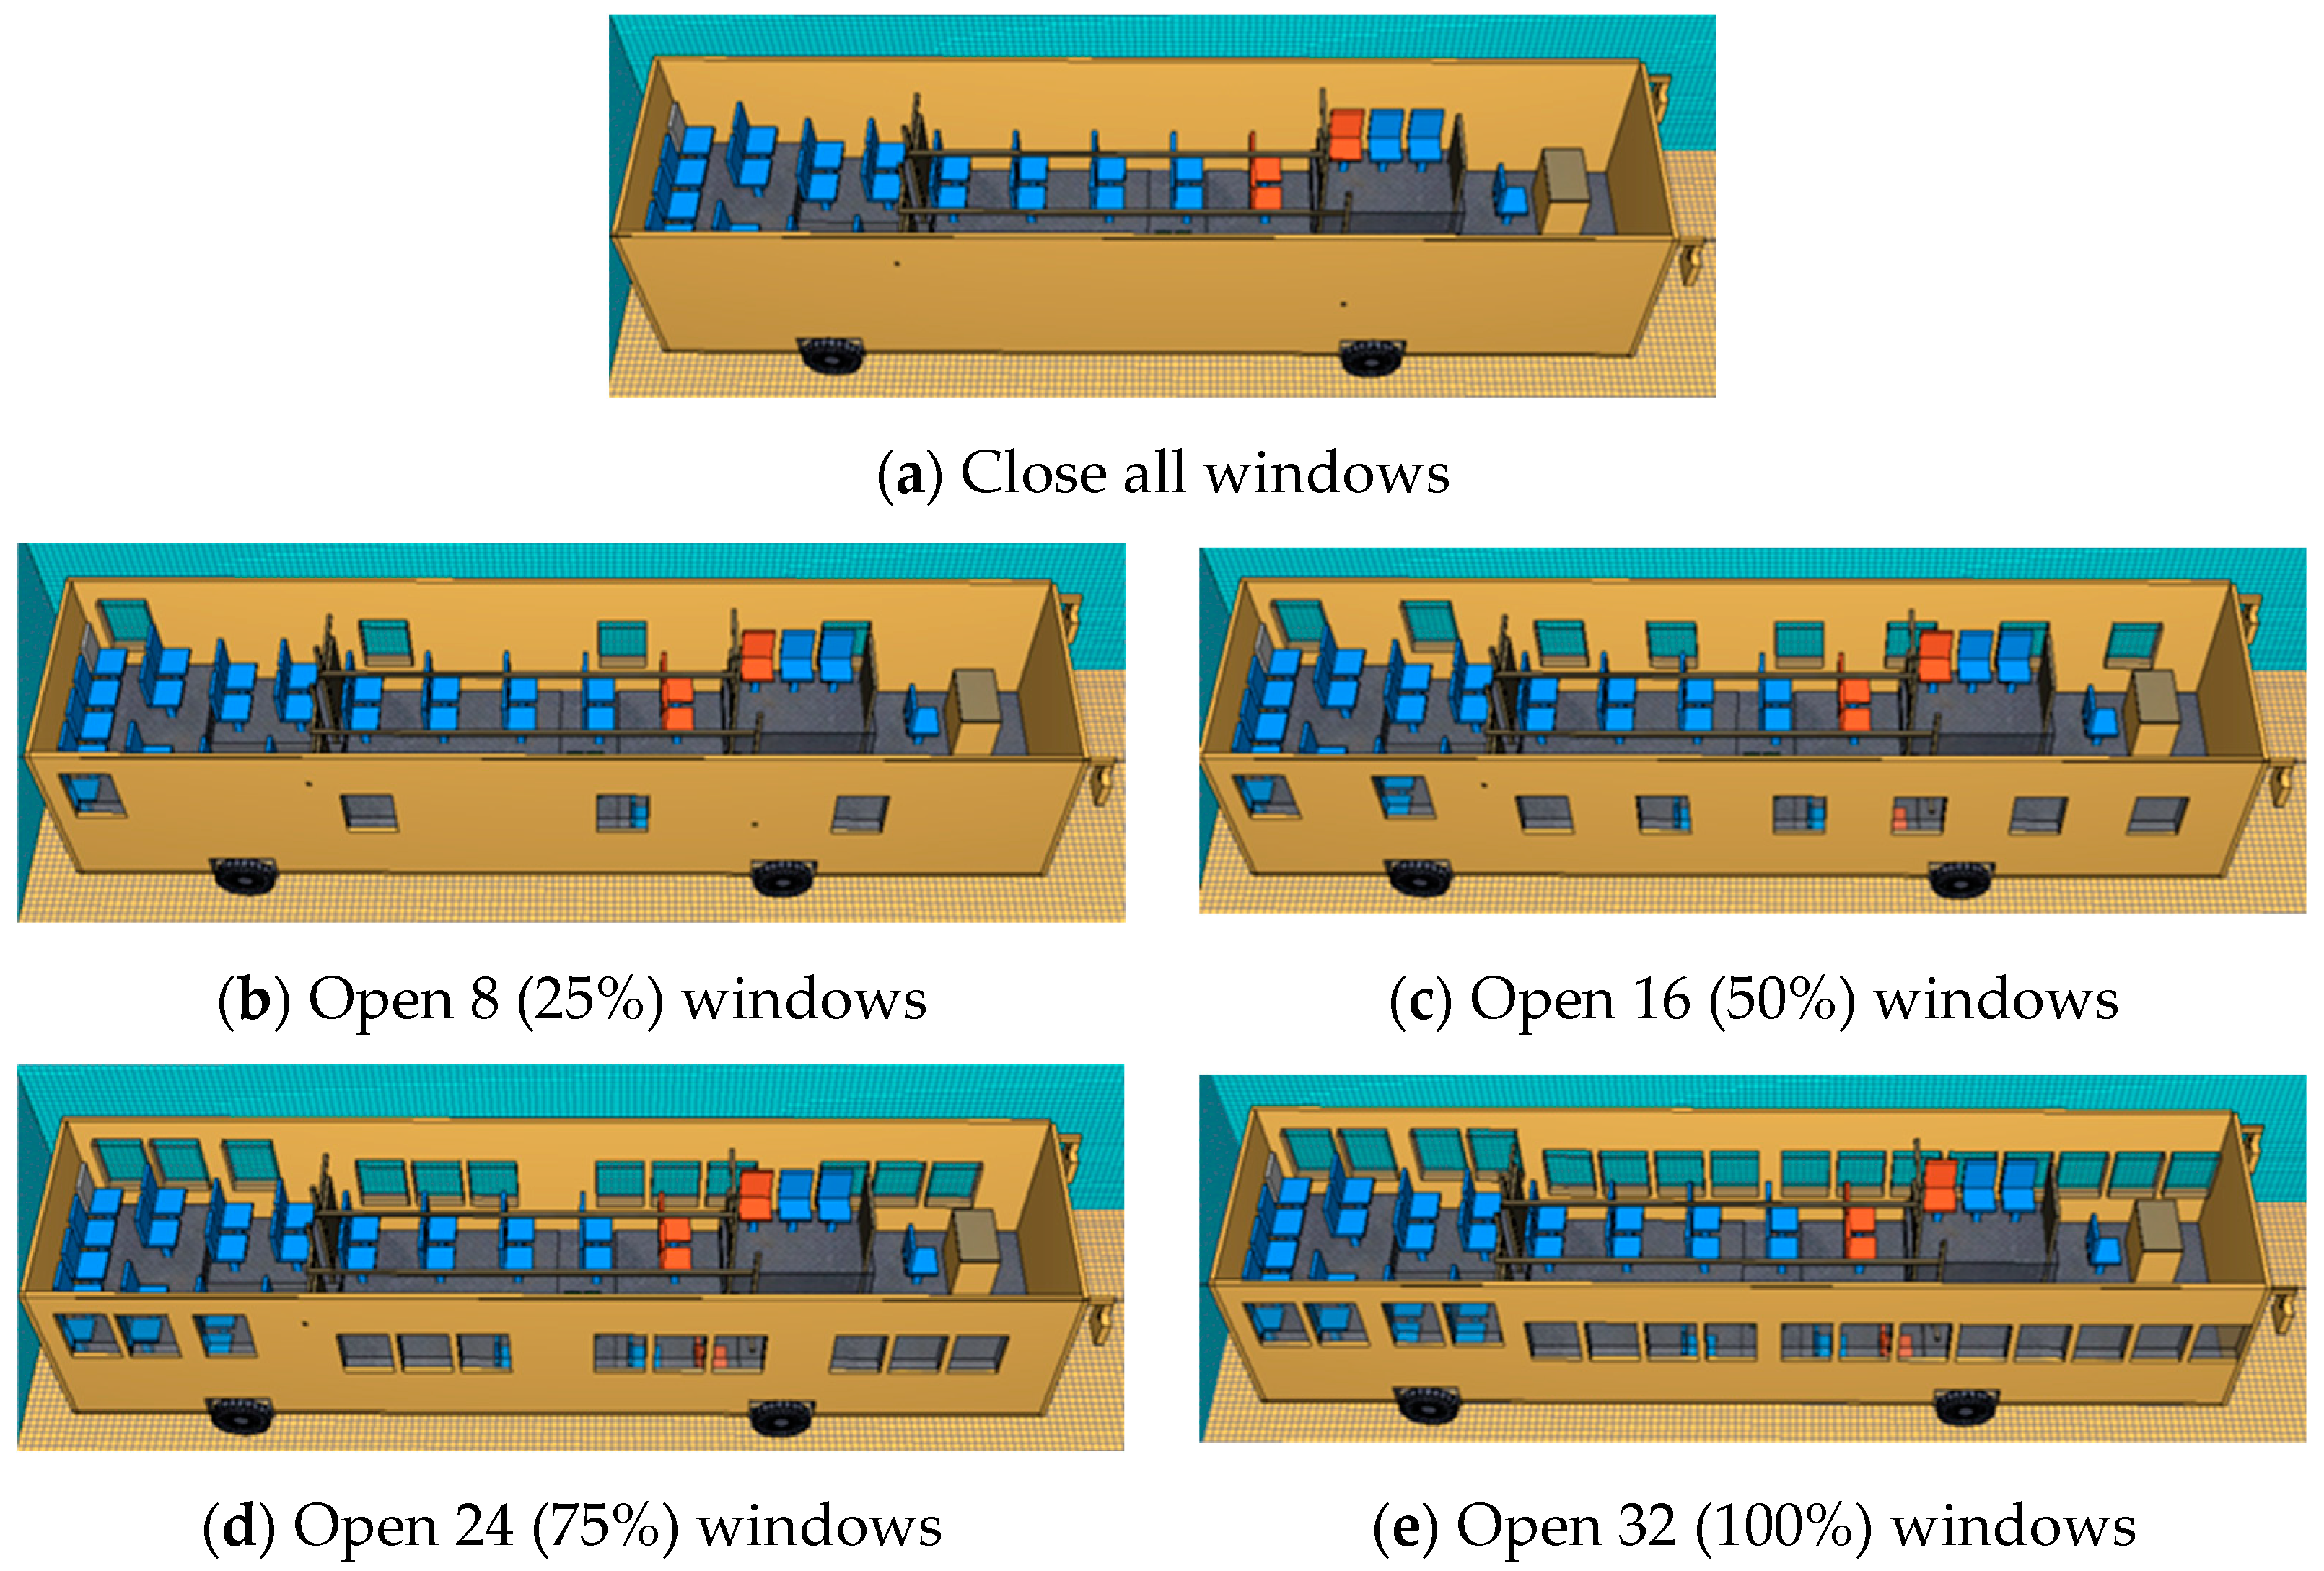
2.4. Fire Condition Settings

In the simulation process, a total of 14 fire scenes were set to study the effects of different ventilation conditions on electric bus fires. The study of the effects of different ventilation areas, wind speeds, and window opening positions on electric bus fires was conducted using the method of controlling variables. The design of fire conditions under different ventilation areas is shown in Figure 7. The differences between scenes 1 and 5 are mainly in the ventilation area, which is reflected by the different number of windows that are opened. There is no difference in wind speed and window opening positions between these five scenes. By comparing these five scenes, the impact of different ventilation areas on electric bus fires was analyzed. The design of fire conditions under different wind speed conditions is shown in Figure 8. Scenes 6 to 10 differ mainly in wind speed, and there is no difference between the opening position of the window and the ventilation area in these five working conditions, and all the Windows are opened. By comparing these five scenes, the impact of different wind speeds on electric bus fires was studied. The design of fire conditions under different window opening positions is shown in Figure 9. Scenes 11 to 14 differ mainly in window opening positions, and there is no difference in ventilation area and wind speed between these four scenes. By comparing these five scenes, the impact of different window opening positions on electric bus fires was investigated. The specific settings for fire scenes are shown in Table 6.

3. Analysis of Simulation Results

3.1. Fire Risk of Electric Buses under Different Ventilation Areas

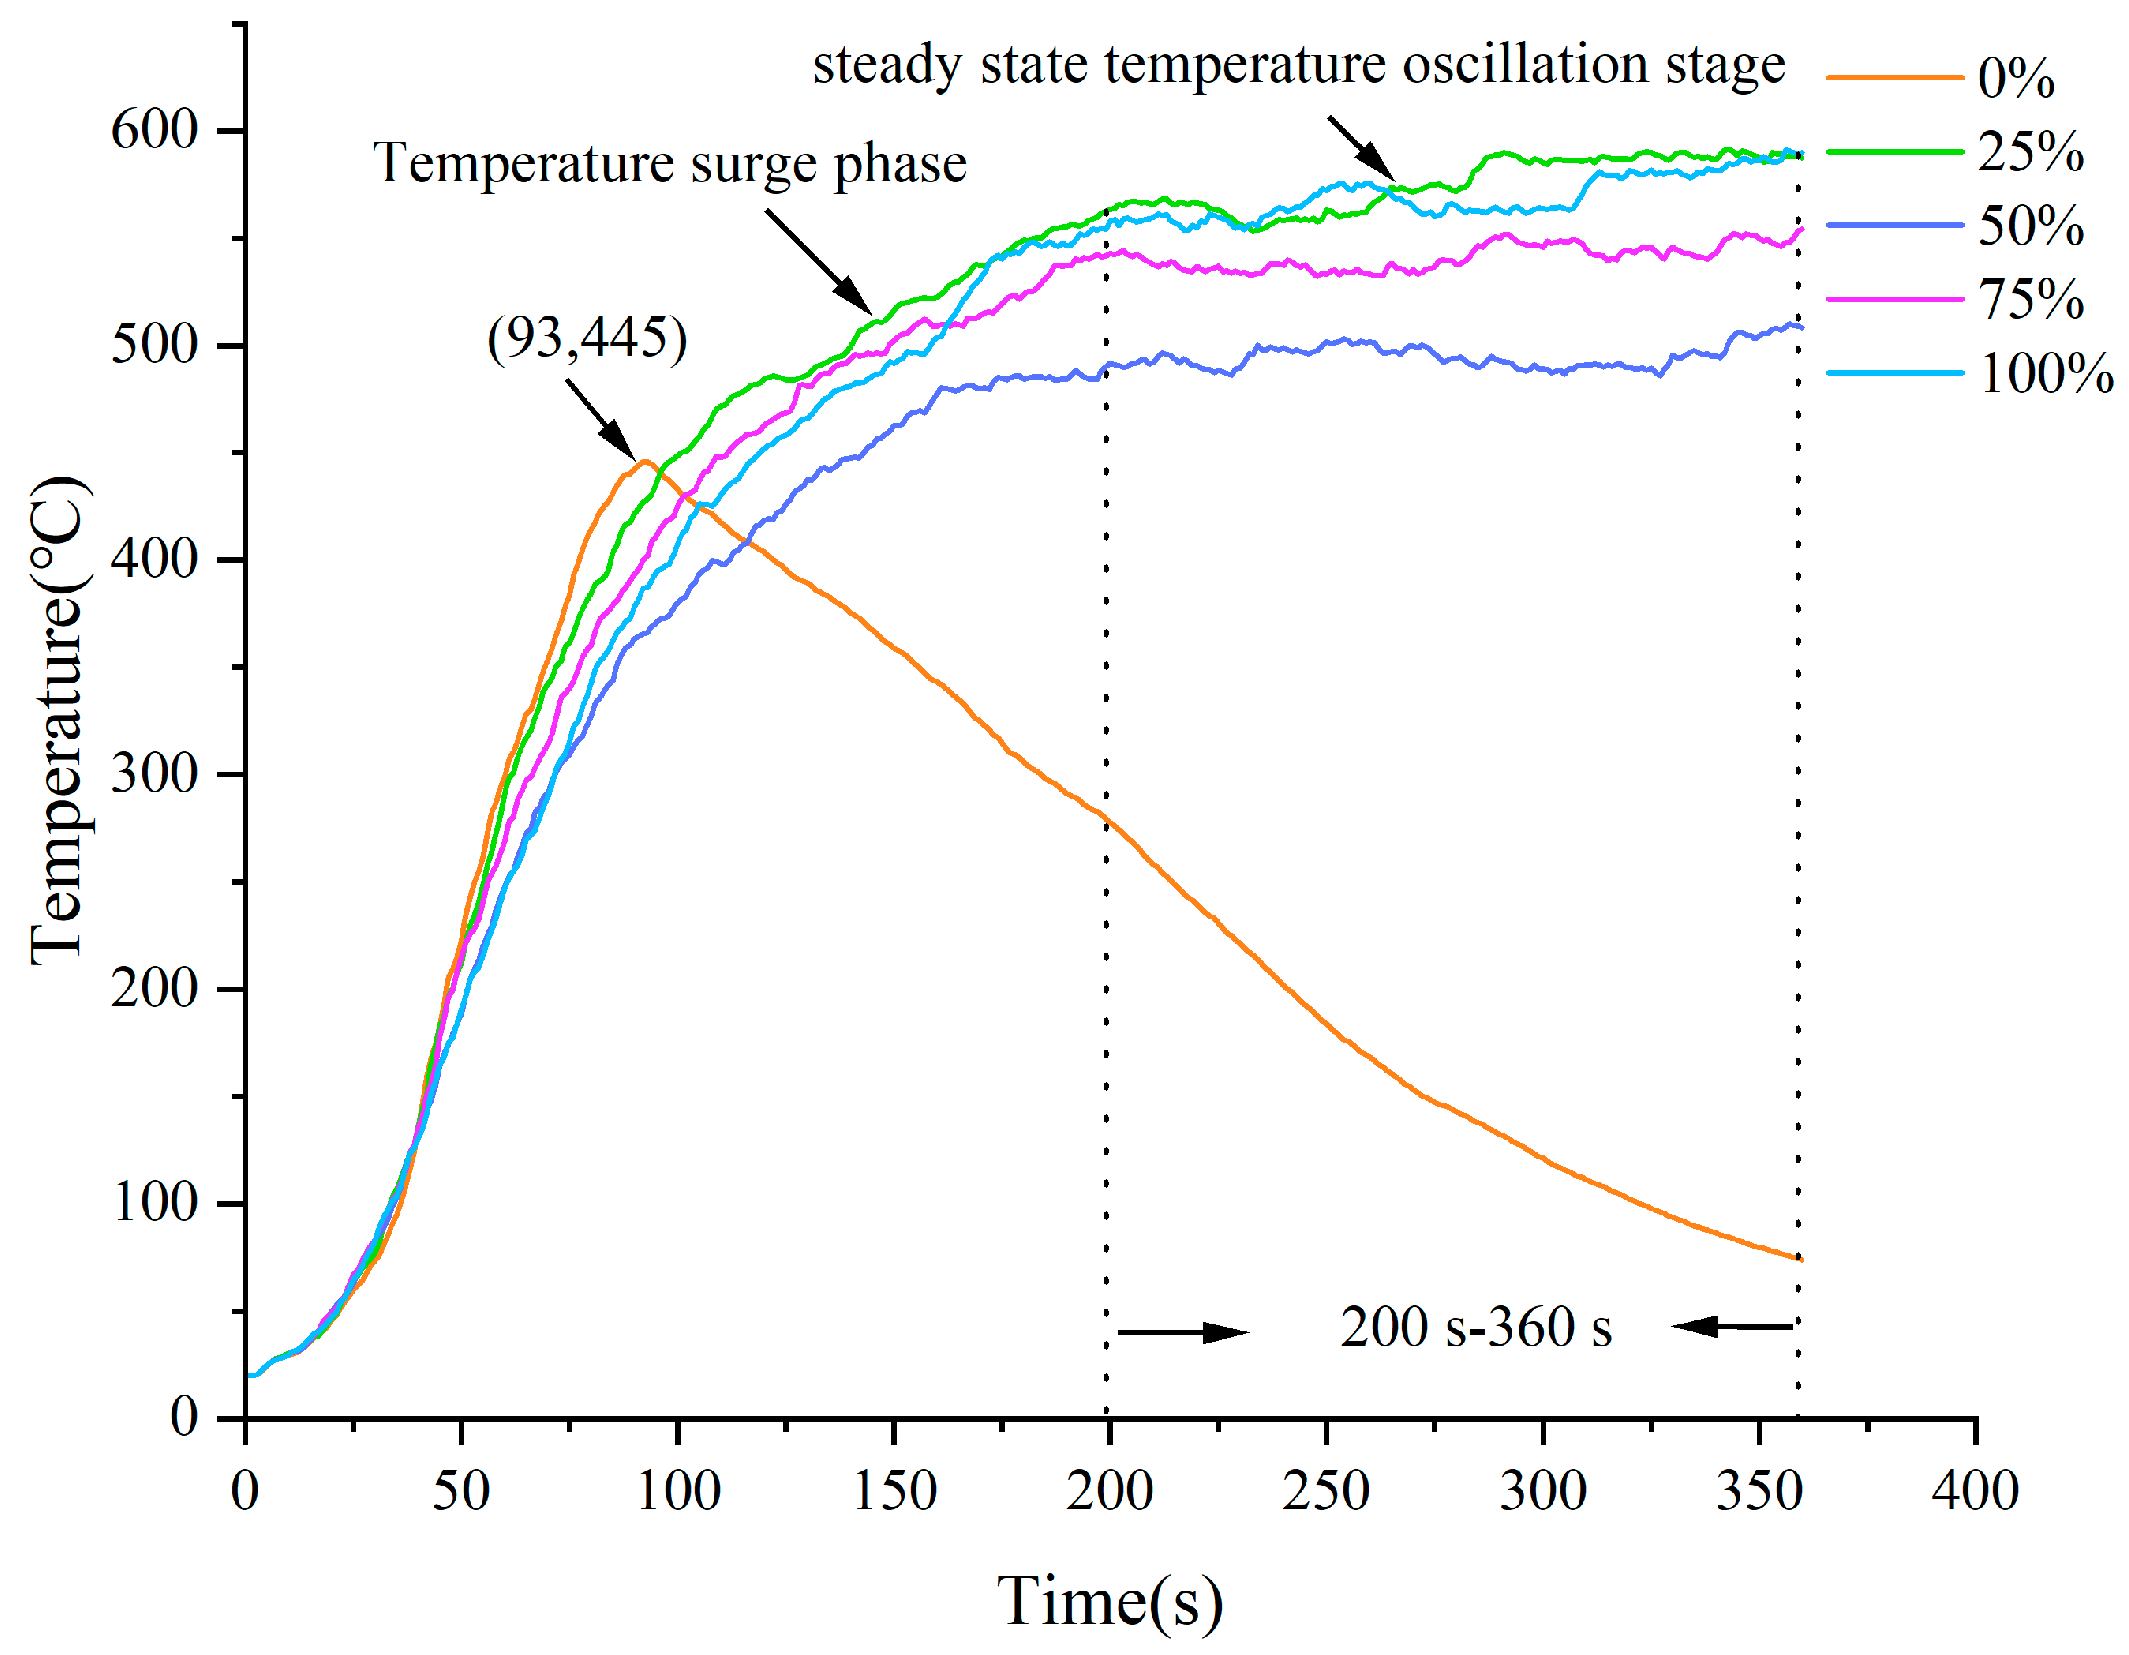
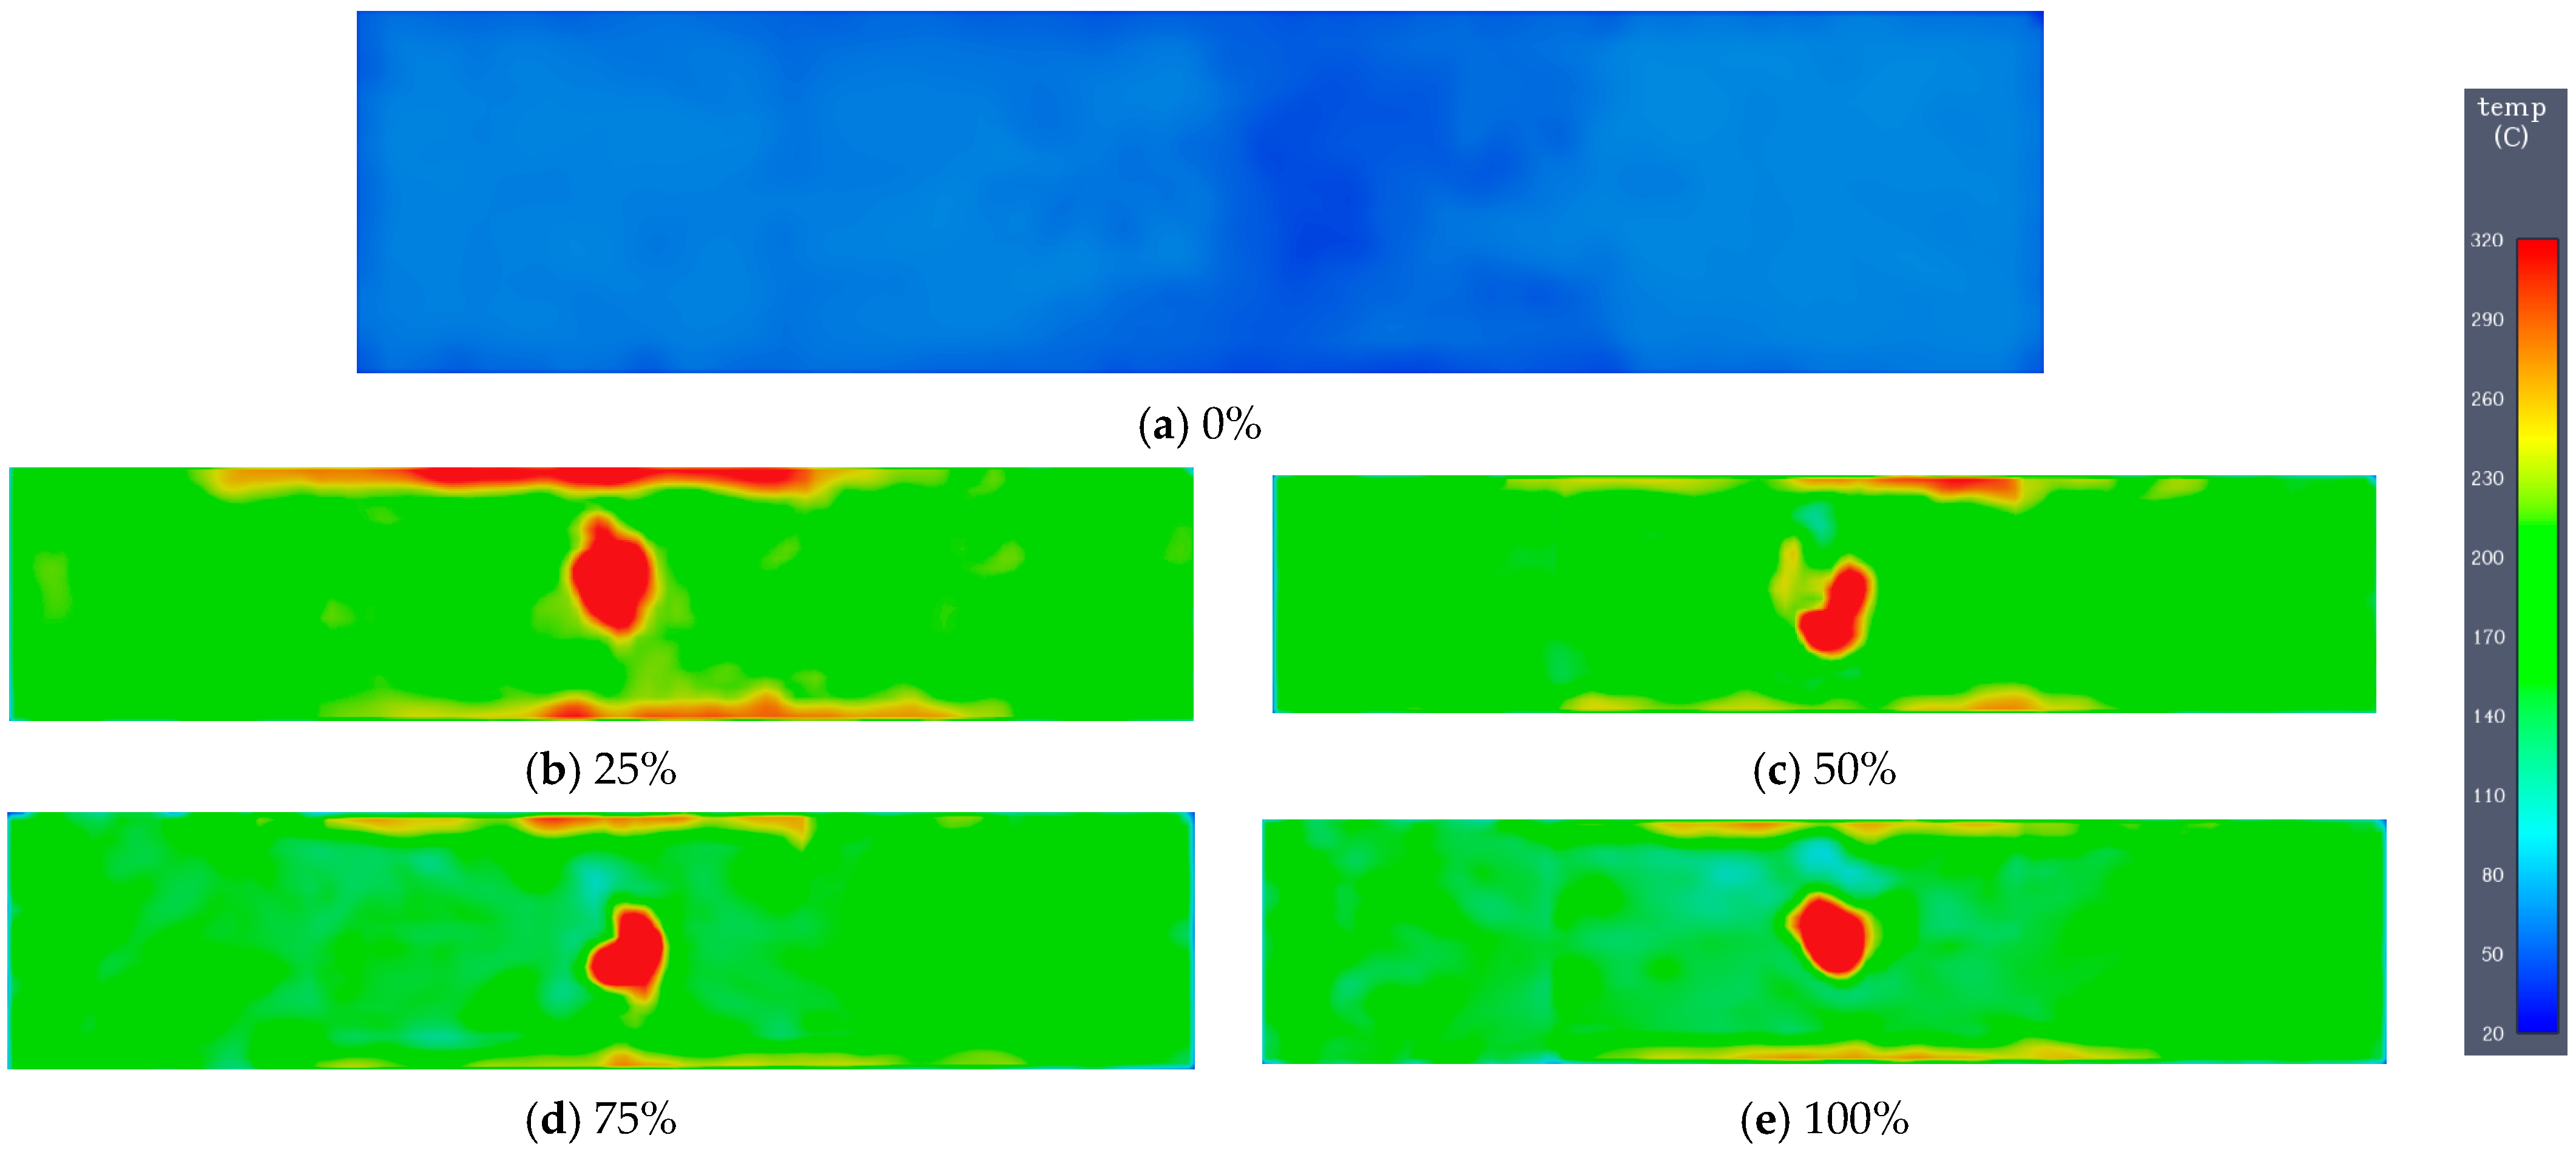
3.1.1. Temperature of Electric Bus Fire under Different Ventilation Areas

Under the condition that a lithium-ion battery pack of an electric bus caught fire, the influence of different ventilation areas on the temperature above the fire source was analyzed, yielding the following results:
As shown in Figure 10, after the fire, the temperature above the fire source rises rapidly. When all windows are closed (0%), the temperature above the fire source rises rapidly between 0 s and 93 s, reaching the maximum temperature, which is 445 °C, at 93 s. Subsequently, the temperature begins to drop, and at 360 s, the temperature above the fire source is approximately 70 °C. This is because in the sealed electric bus compartment, as the fire progresses, the oxygen content in the electric bus compartment is continuously reduced. When the oxygen in the electric bus compartment is exhausted, the fire automatically stops, so the temperature above the fire source starts to decrease. When different numbers of windows are opened, the temperature above the fire source for different ventilation areas (25%, 50%, 75%, 100%) rapidly increases between 0 s and 200 s. At 200 s, the temperatures above the fire source for different ventilation areas are 563 °C, 491 °C, 542 °C, and 557 °C. After 200 s, the rate of temperature increase above the fire source slows down and gradually stabilizes. The average temperatures above the fire source under different ventilation areas between 200 s and 360 s were 562 °C, 495 °C, 541 °C, and 569 °C respectively. The temperature distribution cloud map above the fire source under different ventilation areas at 320 s is shown in Figure 11. By combining Figure 10 and Figure 11, it can be seen that when the ventilation area is small, the ability to remove heat in the electric bus compartment is small. This is because with a smaller ventilation area, the ability to dissipate heat from the electric bus compartment is smaller. Therefore, under the condition of opening 25% of the windows, the temperature above the fire source is higher than that of other conditions. However, as the ventilation area increases, the temperature above the fire source gradually increases. This is because the larger ventilation area also provides more oxygen to the electric bus compartment, making the fire inside the electric bus compartment more intense and releasing more heat.

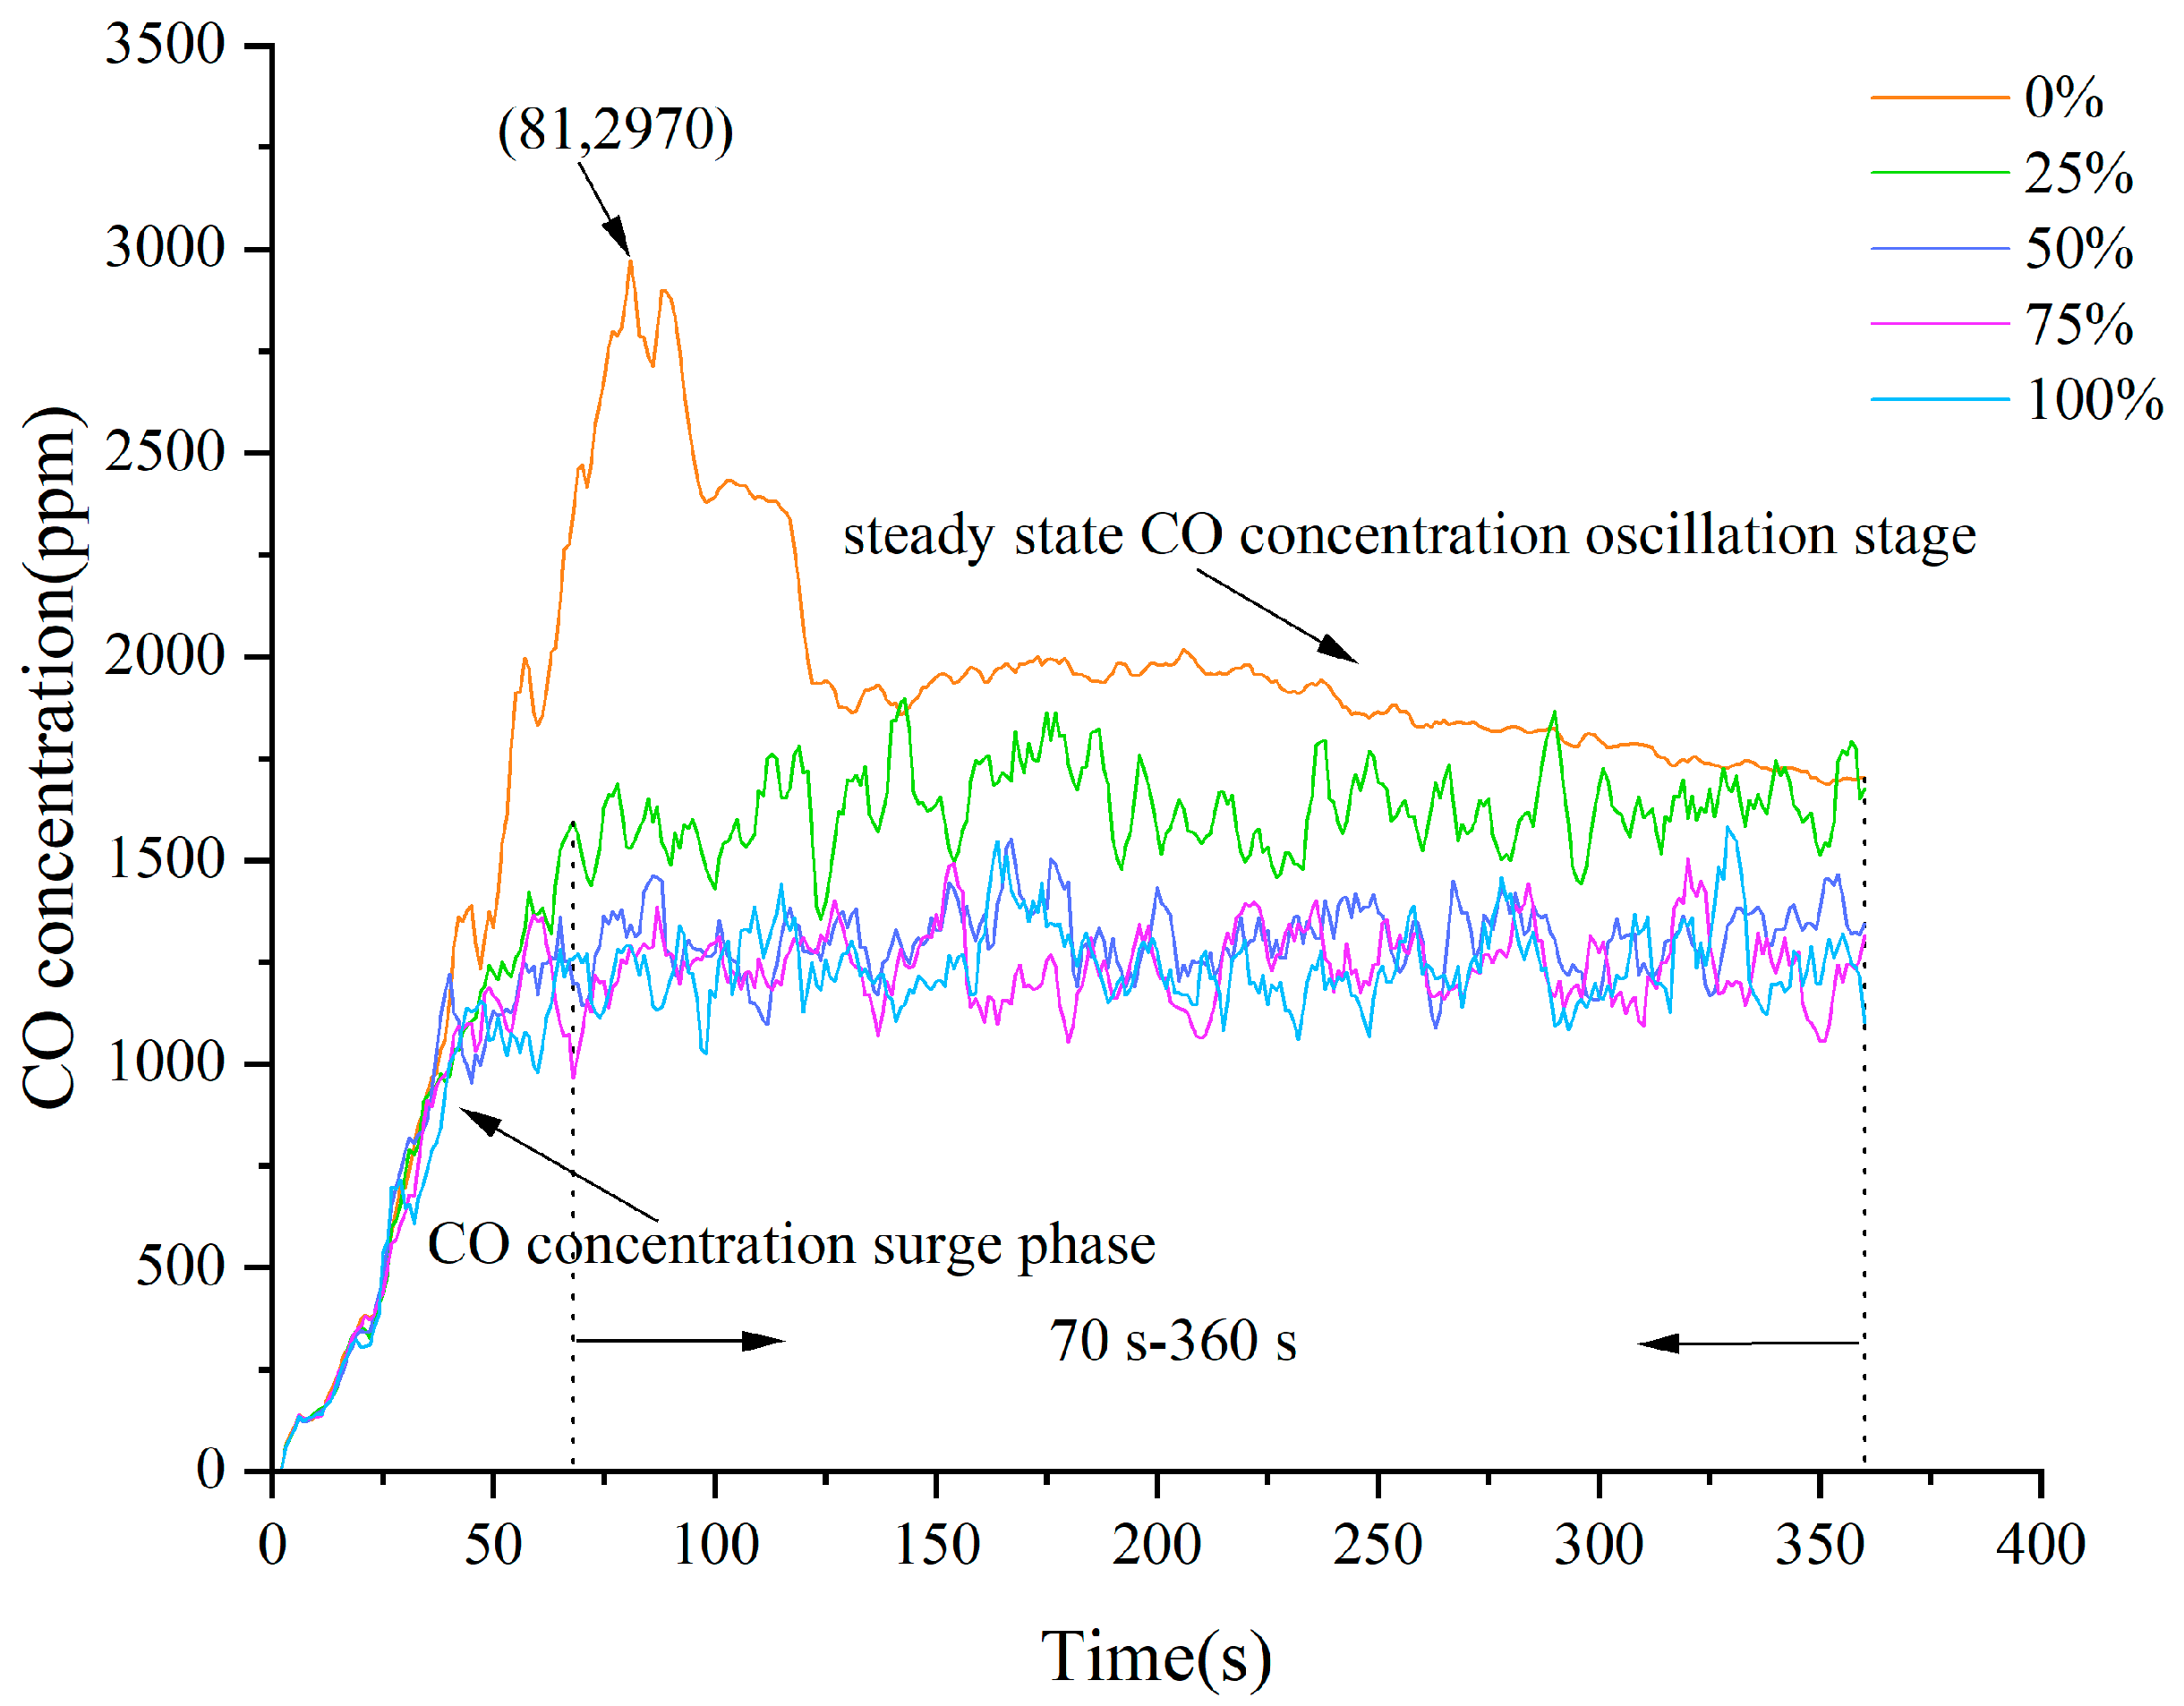
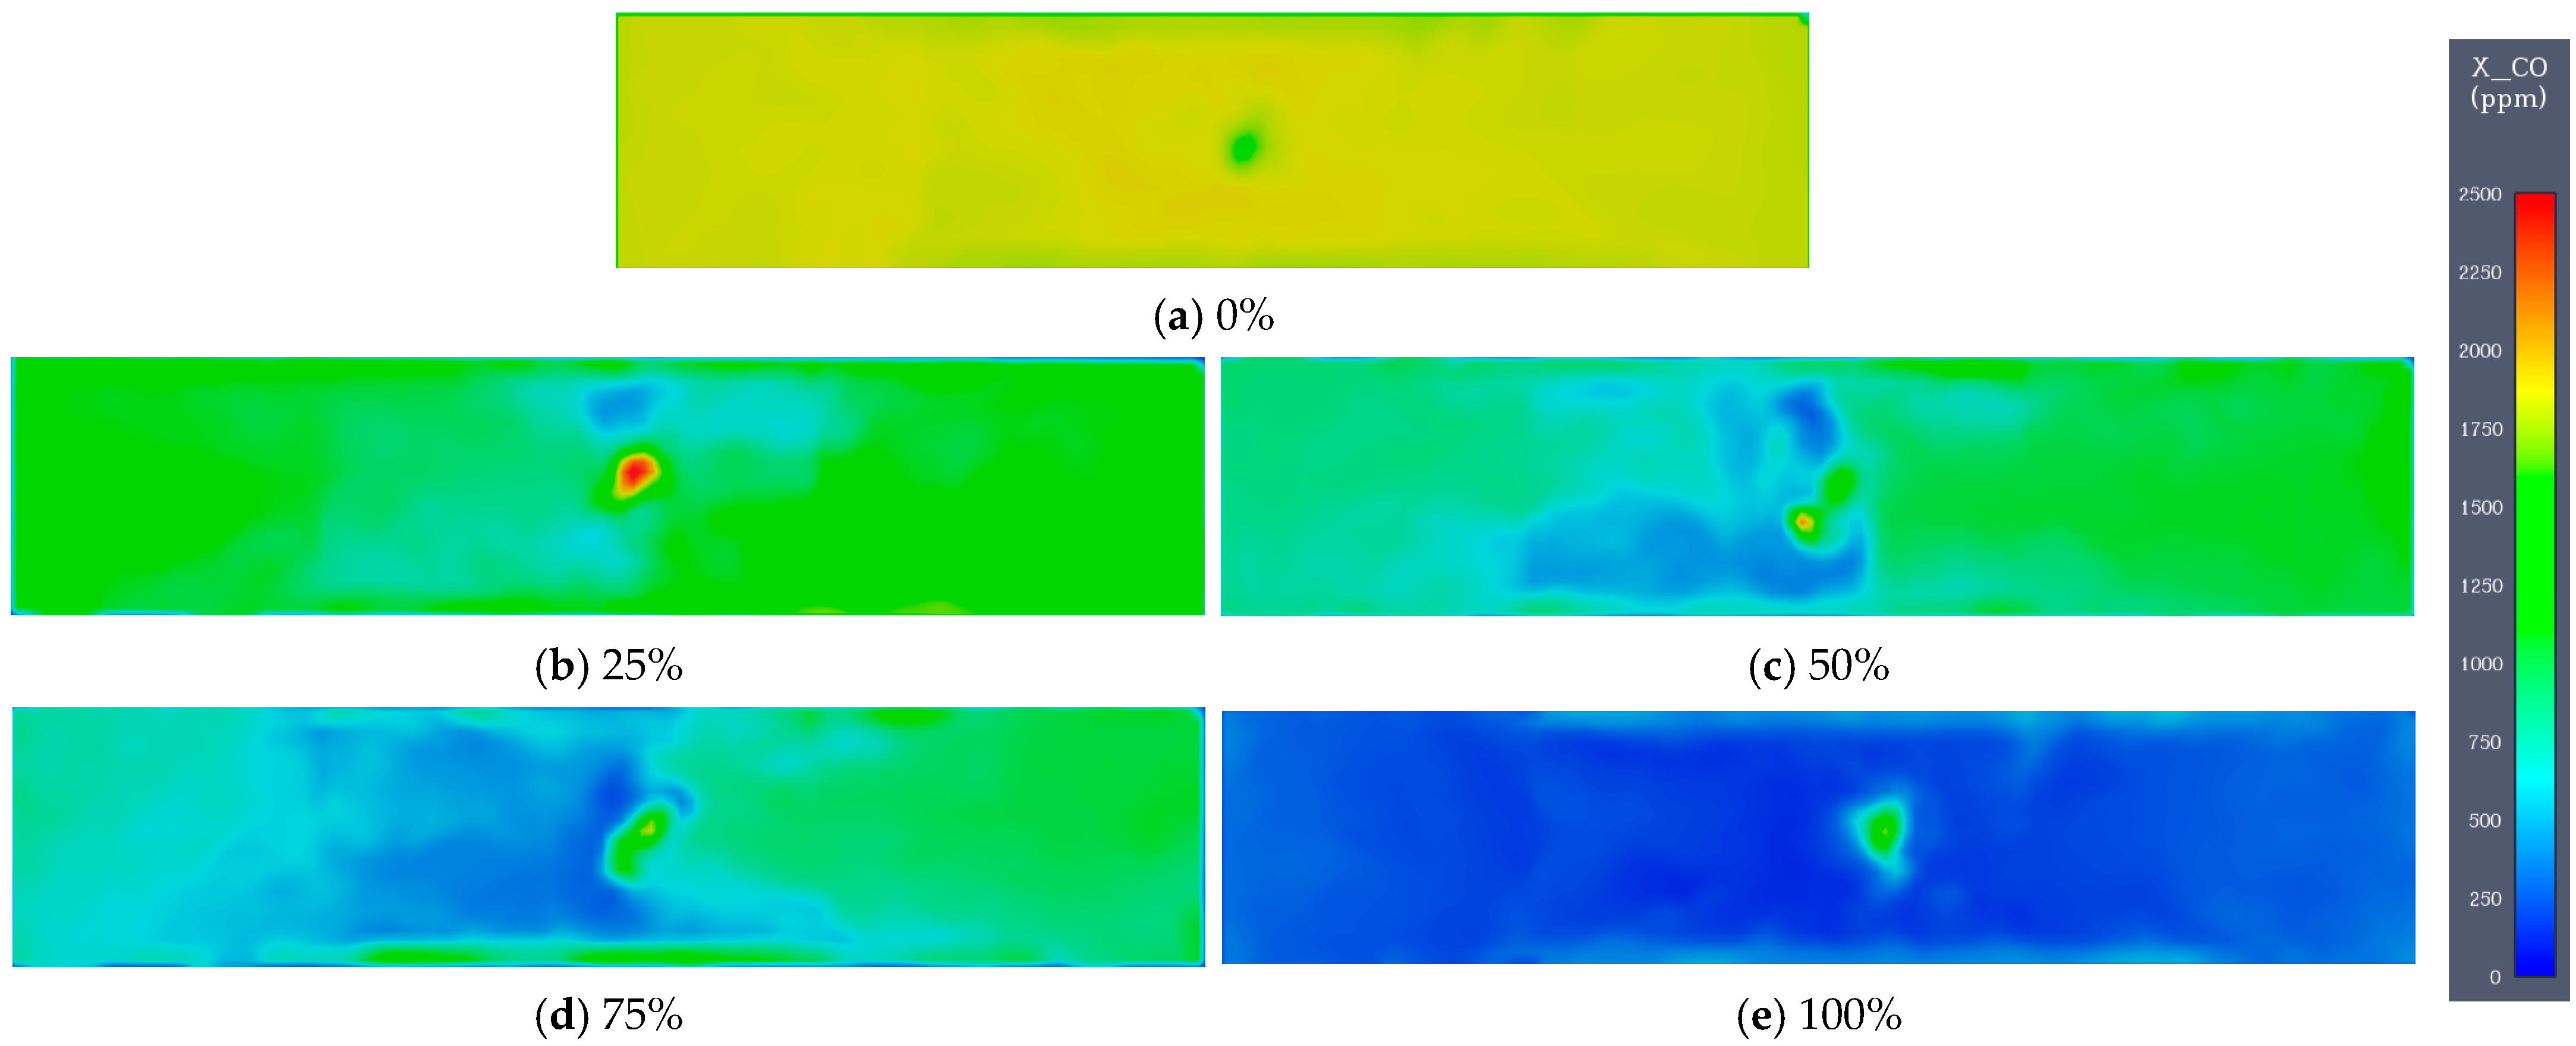
3.1.2. CO Concentration in Electric Bus Fires under Different Ventilation Areas

Under the condition that a lithium-ion battery pack of an electric bus caught fire, the influence of different ventilation areas on the CO concentration inside the electric bus compartment was analyzed, yielding the following results:
As shown in Figure 12, the CO concentration rapidly increased from the beginning. When all windows were closed, the CO concentration in the electric bus compartment rapidly increased from 0 s to 81 s, reaching its maximum at 81 s, with a maximum value of 2970 ppm. Afterward, the CO concentration began to decrease and stabilized around 1800 ppm after 125 s. This is because when the oxygen in the electric bus compartment is consumed, the fire automatically stops, so the CO concentration remains stable. When different numbers of windows were opened, the CO concentration in the electric bus compartment under different ventilation conditions (25%, 50%, 75%, 100%) rapidly increased from 0 s to 70 s and reached a stable state between 70 s and 360 s. When only 25% of the windows were opened, the CO concentration was significantly higher than in the other three conditions. This is because with a smaller ventilation area, there is insufficient oxygen in the electric bus compartment, leading to the incomplete combustion of combustibles and the production of a large amount of CO. Moreover, with only 25% of the windows open, the ability to remove smoke from the electric bus compartment is weaker, resulting in a higher CO concentration under this condition. The CO concentrations under different ventilation conditions (25%, 50%, 75%, 100%) reached an equilibrium between 70 s and 360 s, with average concentrations of 1630 ppm, 1310 ppm, 1240 ppm, and 1200 ppm, respectively. The CO concentration distribution cloud map under different ventilation areas at 320 s is shown in Figure 13. By combining Figure 12 and Figure 13, it can be seen that the larger the ventilation area, the lower the CO concentration. When the ventilation area increases to a certain extent, the oxygen content in the electric bus compartment increases, and the ability to exhaust smoke is enhanced, resulting in a smaller variation in the average CO concentration.

3.2. Fire Risk of Electric Buses under Different Wind Speeds

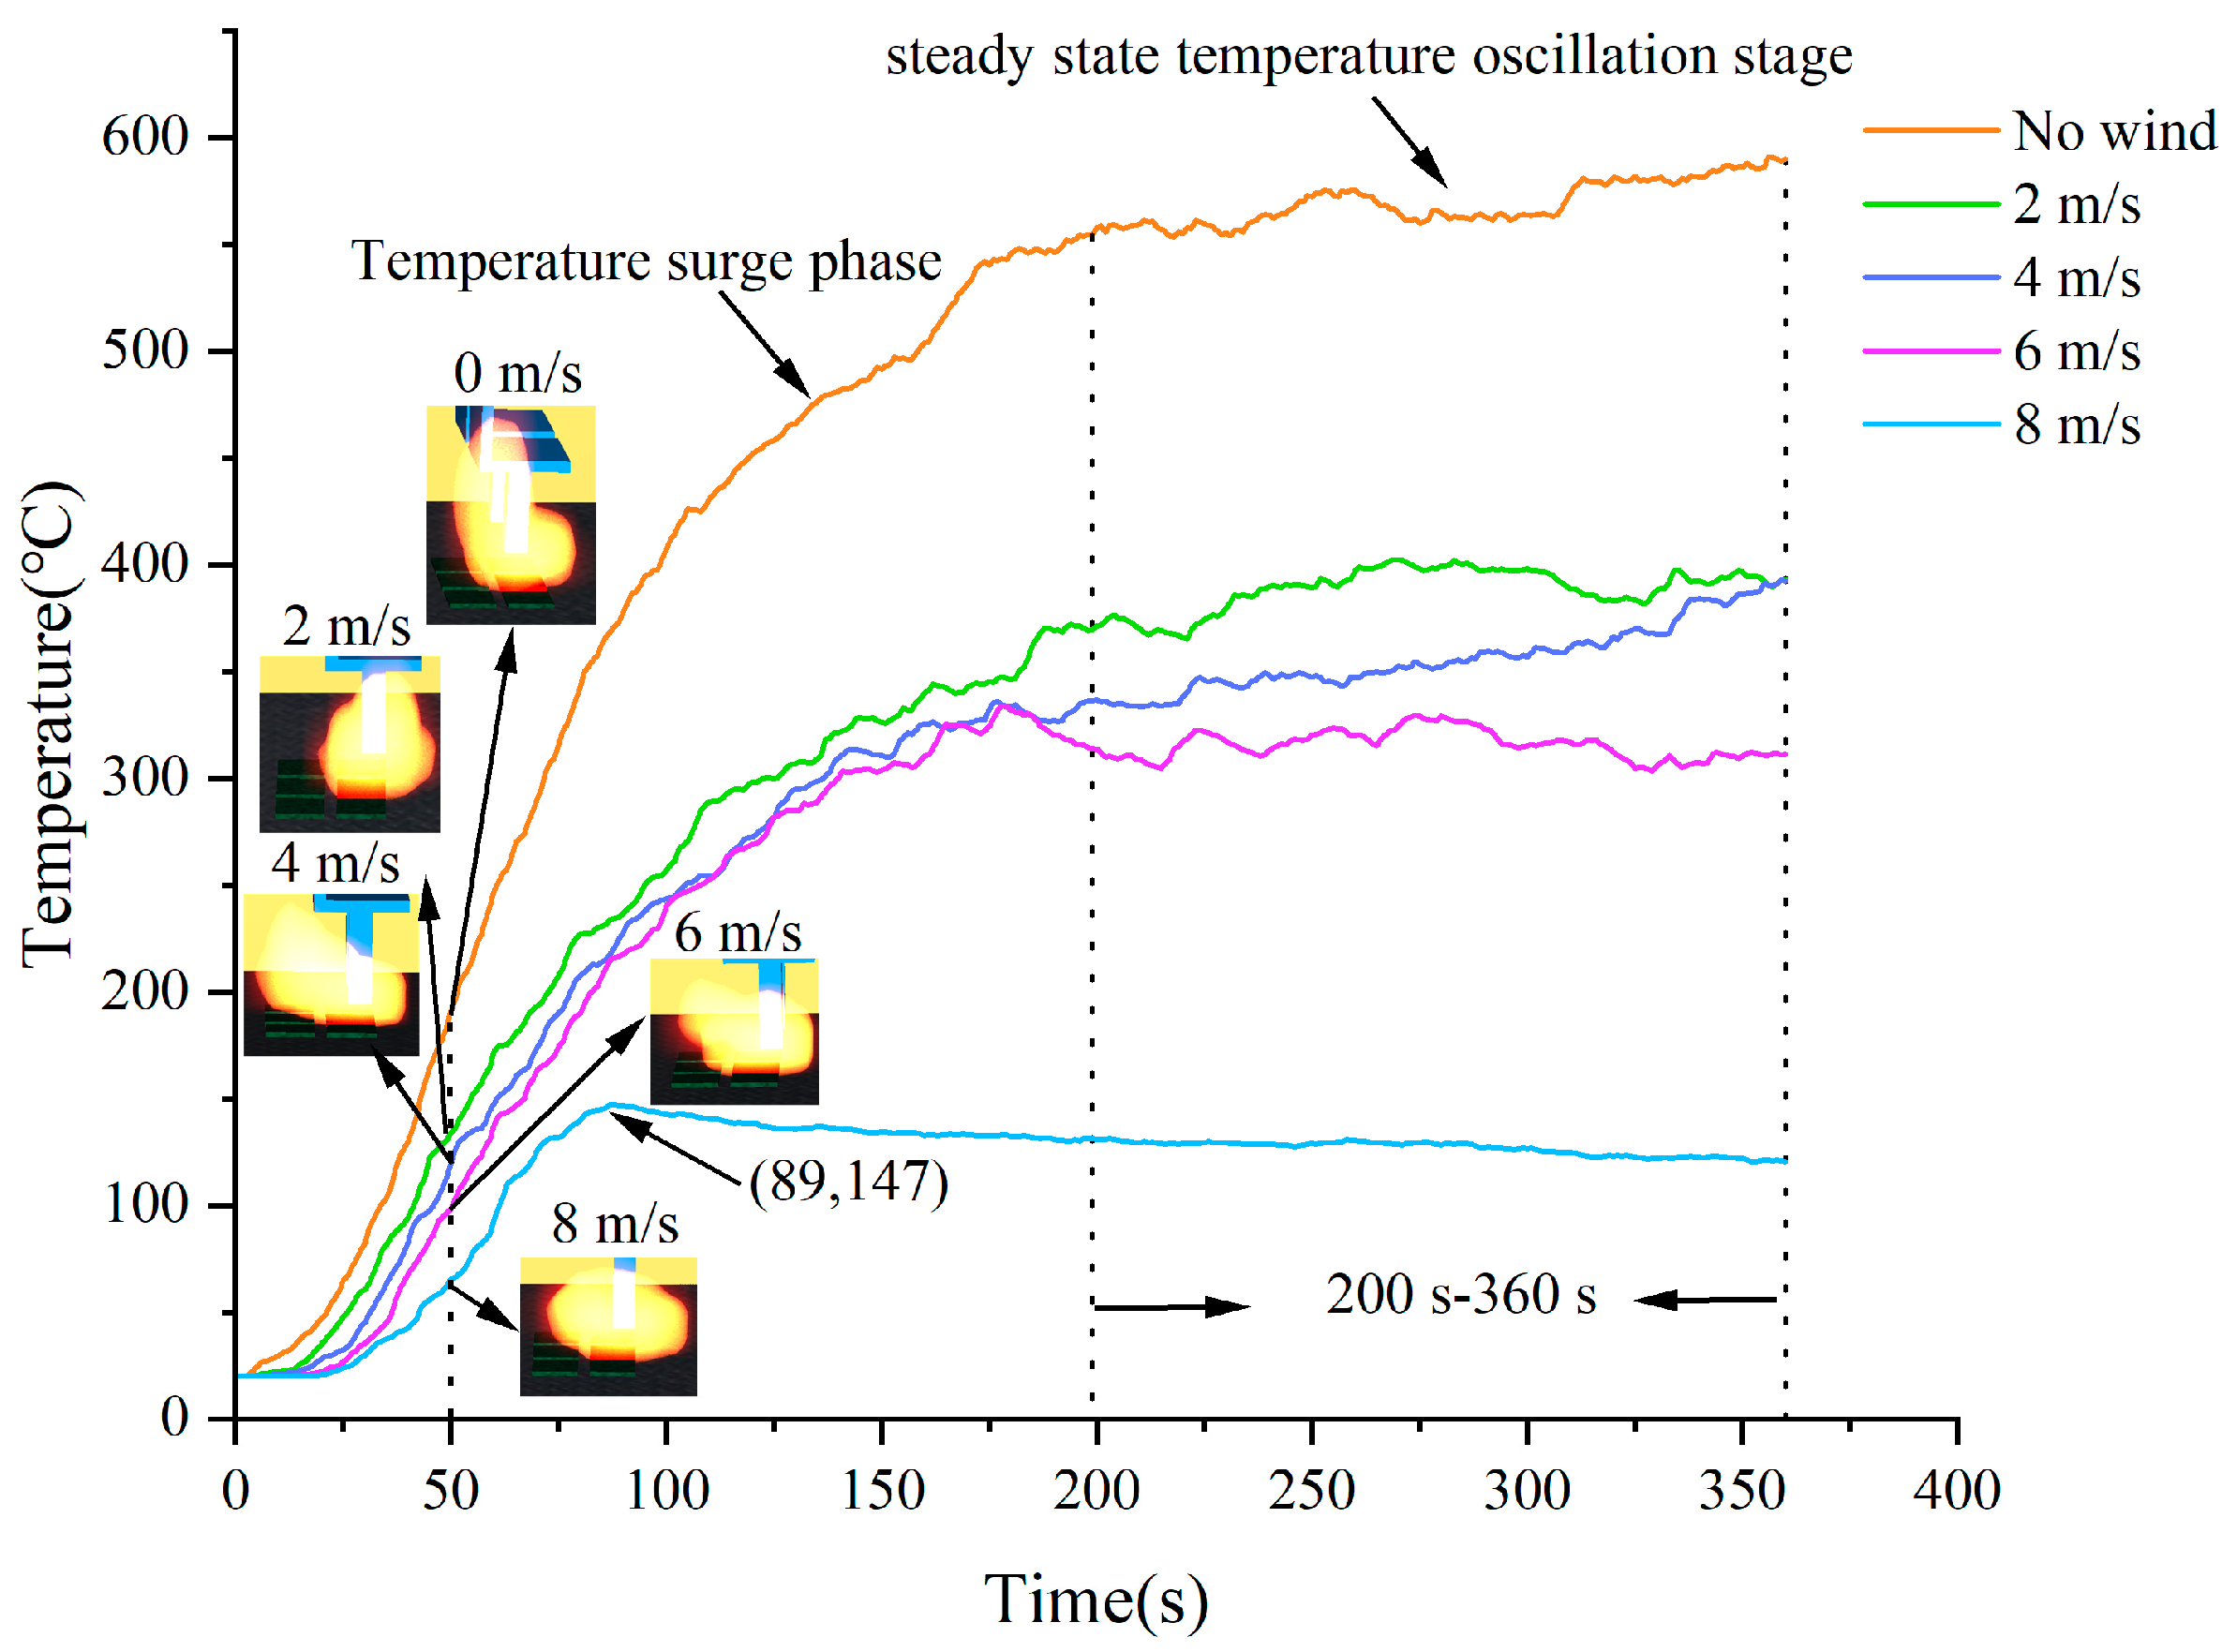
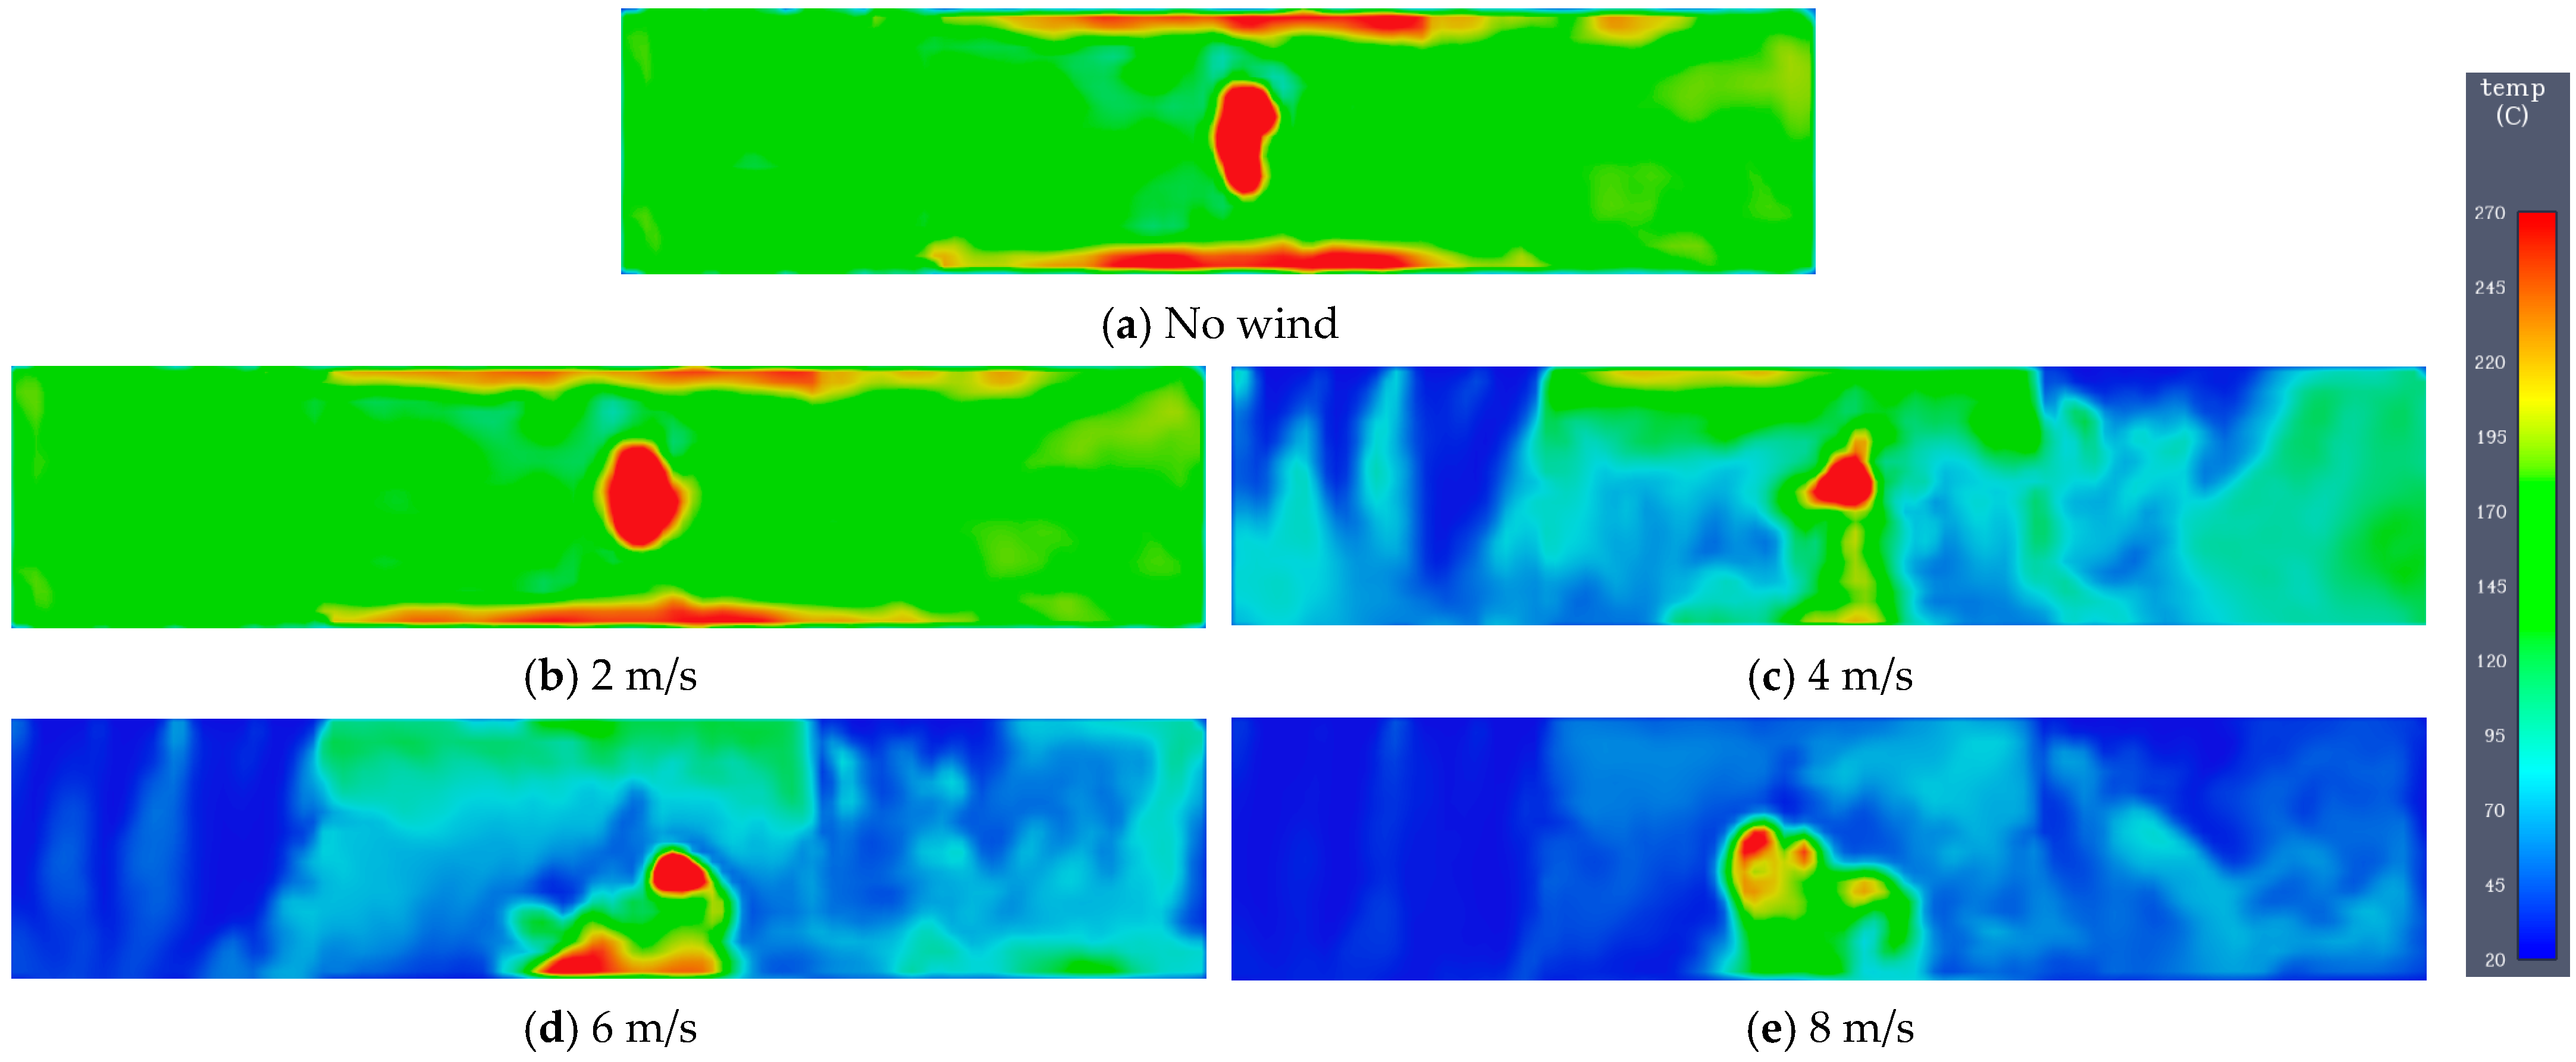
3.2.1. Temperature of Electric Bus Fire under Different Wind Speeds

Under the condition that a lithium-ion battery pack of an electric bus caught fire, the influence of different wind speeds on the temperature above the fire source was analyzed, yielding the following results:
As shown in Figure 14, the temperature above the fire source rose rapidly after the fire starts. When the wind speed was 8 m/s, the temperature above the fire source rose rapidly between 0 s and 89 s, reaching a maximum of 147 °C at 89 s, and then stabilized. Under no wind and 2 m/s, 4 m/s, or 6 m/s conditions, the temperature above the fire source quickly rose and stabilized between 0 s and 200 s. After 200 s, the temperature above the fire source entered a stable stage. Between 200 s and 360 s, under different wind speed conditions (no wind, 2 m/s, 4 m/s, 6 m/s, and 8 m/s), the average temperature above the fire source was 569 °C, 389 °C, 357 °C, 315 °C, and 126 °C. The temperature distribution cloud map above the fire source under different wind speed conditions at Z = 2 m at 320 s is shown in Figure 15. By combining Figure 14 and Figure 15, it can be seen that under different wind speed conditions, the temperature above the fire source decreased with the increase in wind speed. This is mainly due to the change in the shape of the flame once wind speed conditions are introduced, causing the flame to start moving downward. This conclusion is further supported by the variation in flame shape at 50 s under different wind speed conditions, as shown in Figure 12. Additionally, the increase in wind speed enhances the heat dissipation capacity inside the electric bus compartment, allowing high-temperature smoke to be expelled more quickly. Moreover, higher wind speeds facilitate faster temperature diffusion within the electric bus compartment.

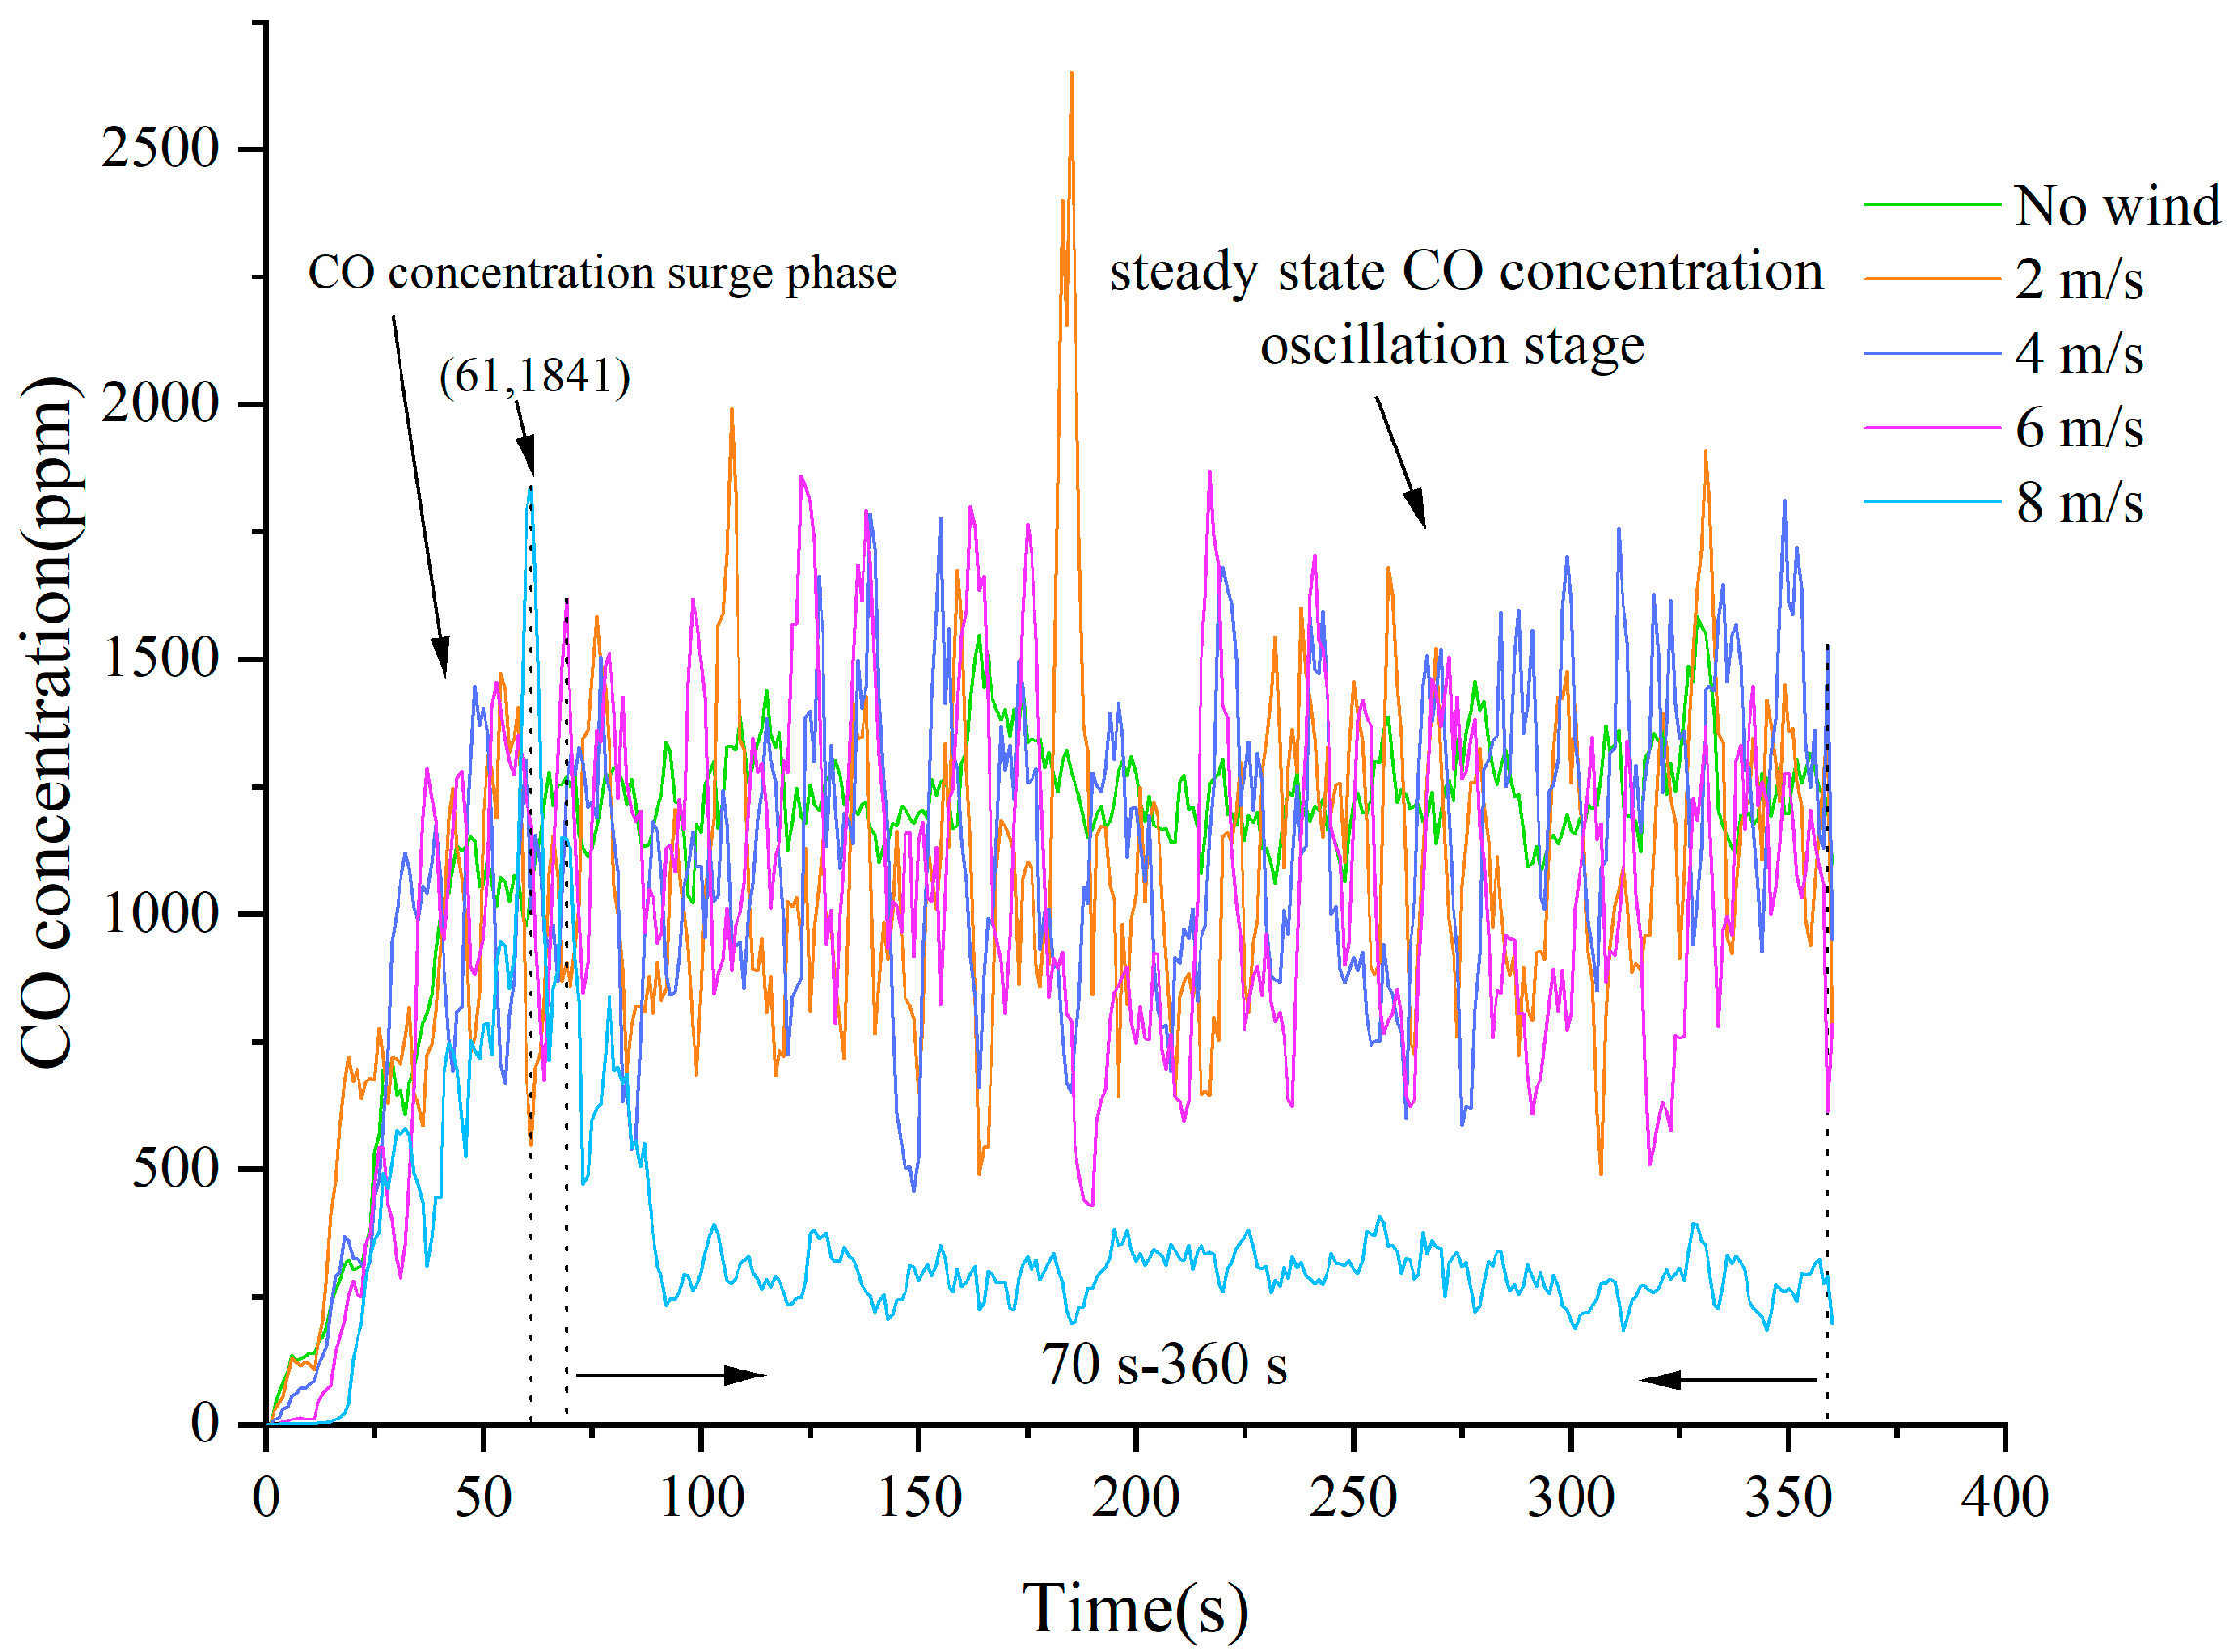
3.2.2. CO Concentration in Electric Bus Fires under Different Wind Speed Conditions

Under the condition that a lithium-ion battery pack of an electric bus caught fire, the influence of different wind speeds on the CO concentration inside the electric bus compartment was analyzed, yielding the following results:
As shown in Figure 16, the CO concentration inside the electric bus compartment rapidly increased after the fire occurred. When the wind speed was 8 m/s, the CO concentration inside the electric bus compartment rose rapidly between 0 s and 61 s, reaching a maximum value of 1841 ppm at 61 s. Subsequently, the CO concentration inside the compartment rapidly decreased and stabilized to around 250 ppm. When there was no wind and under conditions of 2 m/s, 4 m/s, or 6 m/s, the CO concentration inside the compartment rose rapidly between 0 s and 70 s, stabilizing after 70 s. Between 70 s and 360 s under different wind speed conditions (no wind, 2 m/s, 4 m/s, 6 m/s, and 8 m/s), the average CO concentration inside the compartment was 1240 ppm, 1170 ppm, 1130 ppm, 1090 ppm, and 316 ppm, respectively. Figure 17 shows the CO concentration distribution cloud map at Z = 2 m for different window positions at 320 s. By combining Figure 16 and Figure 17, it can be seen that under different wind speed conditions, the CO concentration inside the electric bus decreased as the wind speed increased. This is because with the presence of ventilation, the wind speed accelerates the expulsion of smoke from the electric bus compartment, resulting in a decrease in CO concentration with increasing wind speed.

3.3. Fire Risk of Electric Buses at Different Window Opening Positions

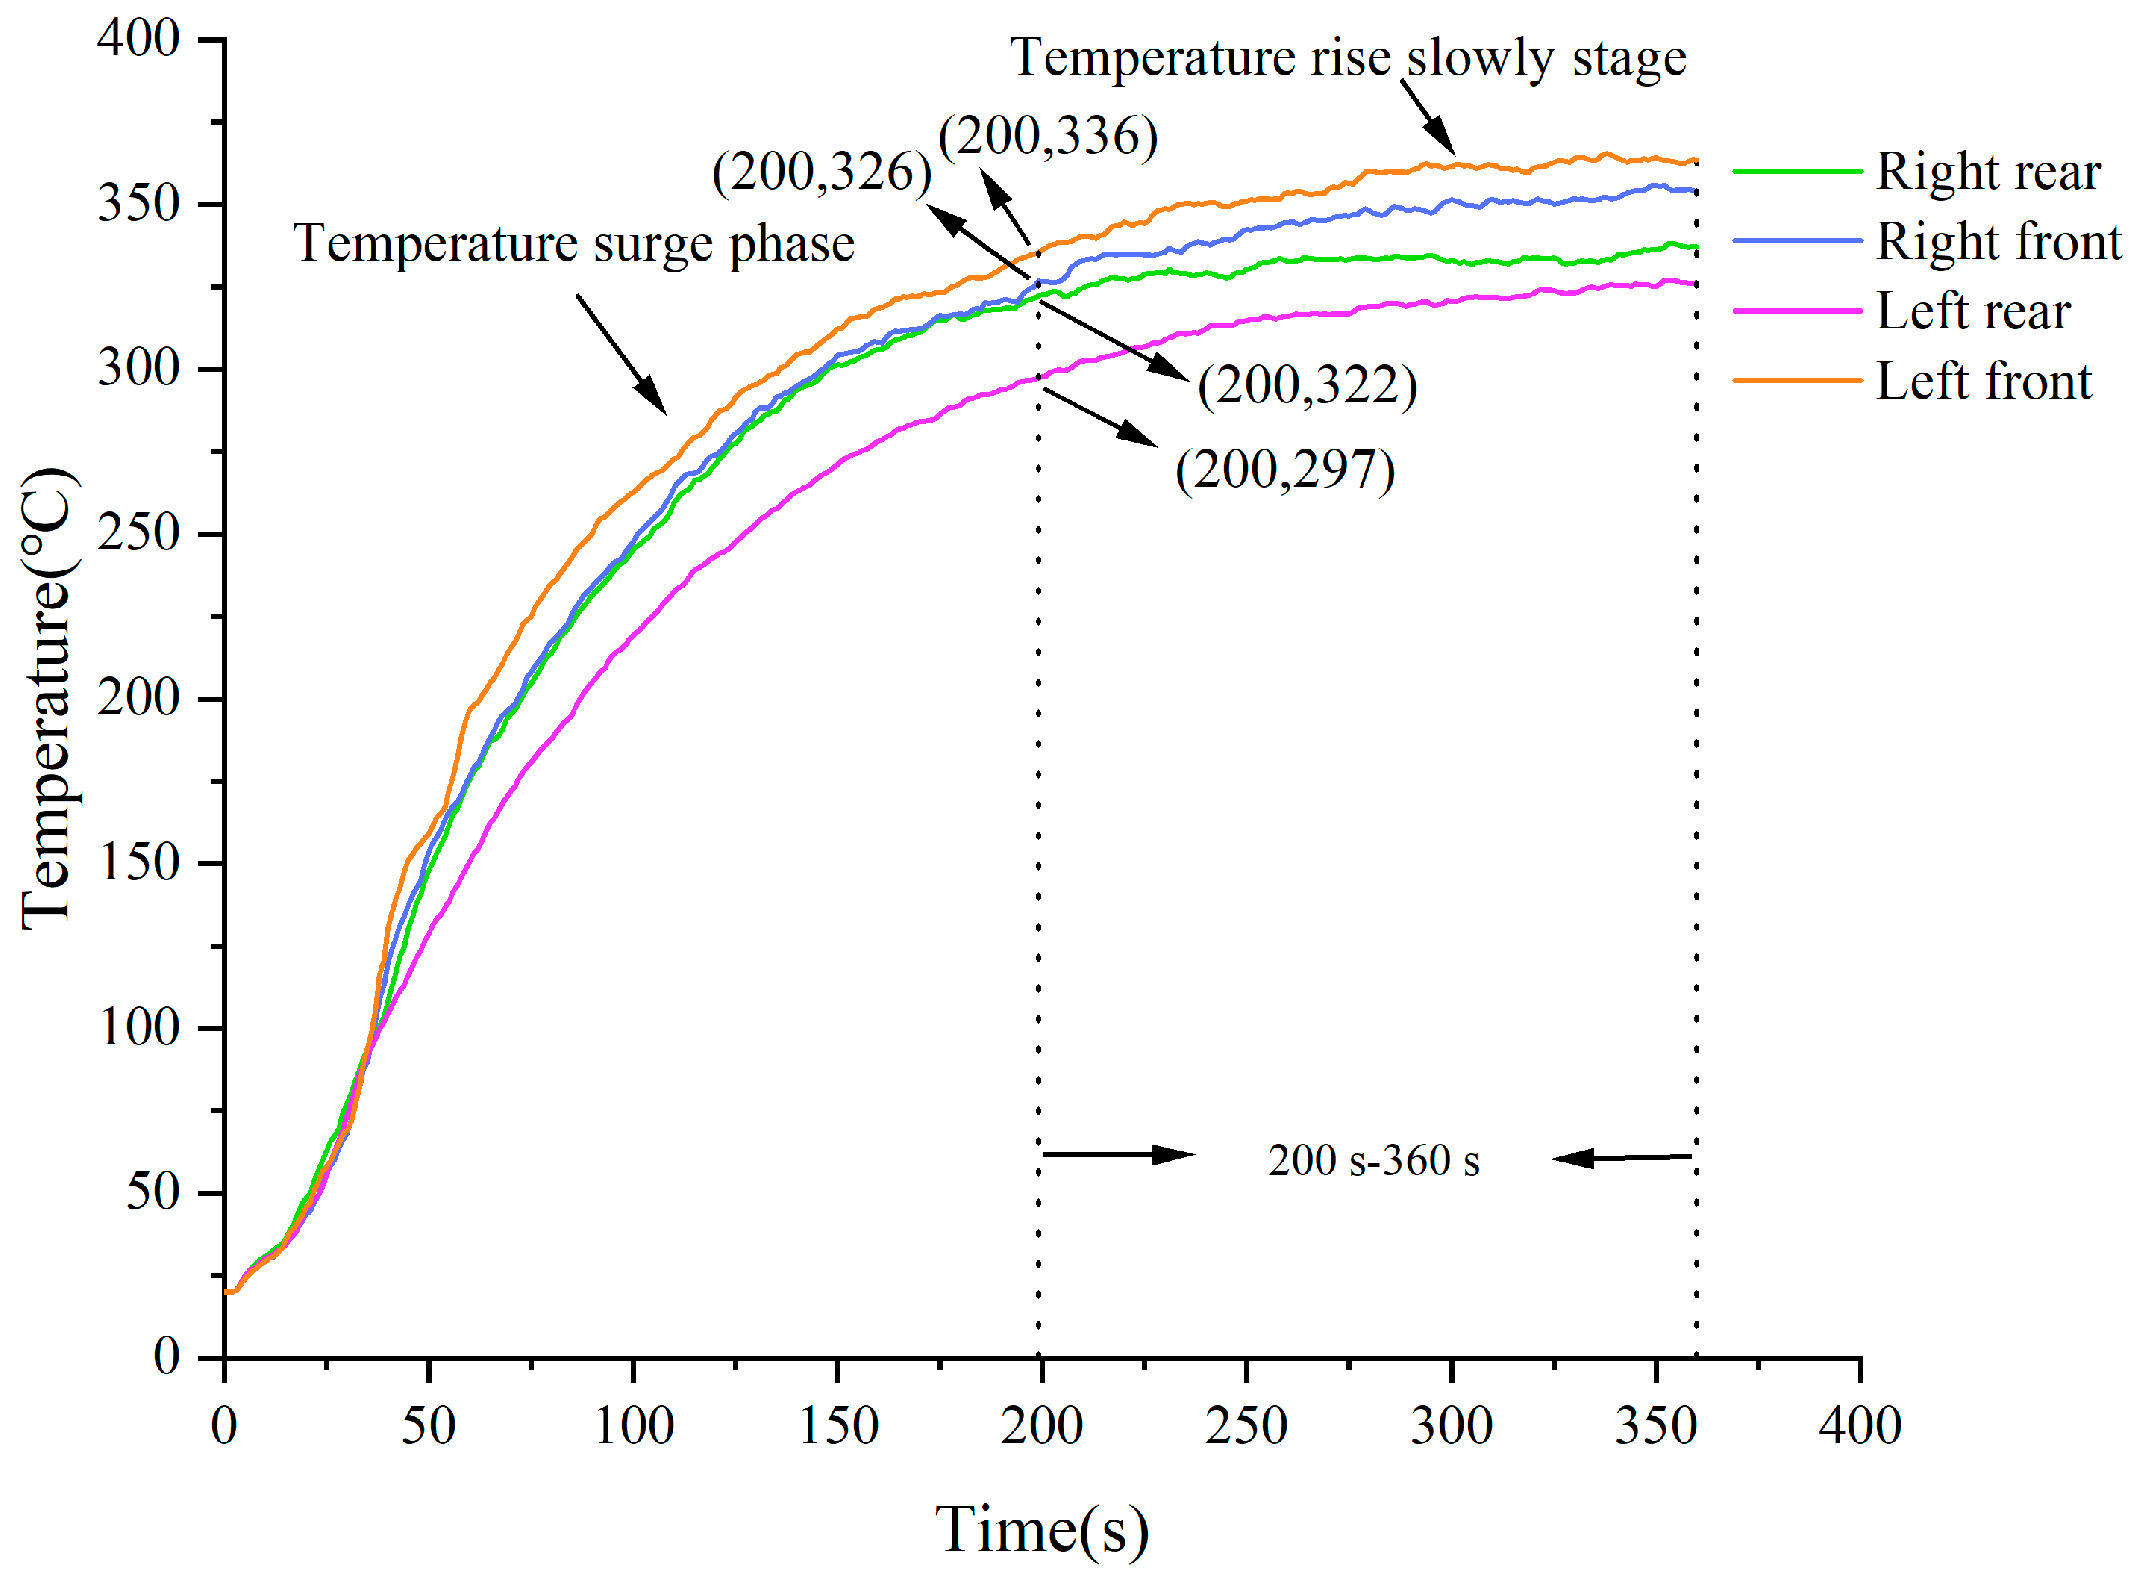
3.3.1. Temperature of Electric Bus Fire at Different Window Opening Positions

Under the condition that a lithium-ion battery pack of an electric bus caught fire, the influence of different window opening positions on the temperature above the fire source was analyzed, yielding the following results:
As shown in Figure 18, after the fire occurred, the temperature above the fire source rapidly rose from 0 s to 200 s under different window positions. At 200 s, the temperatures above the fire source for different window opening positions (right rear, right front, left rear, left front) were 322 °C, 326 °C, 297 °C, and 336 °C, respectively. After 200 s, the rate of temperature increase above the fire source began to slow down because the high-temperature smoke filled the entire carriage and started to escape through the windows. At 360 s, the temperatures above the fire source for different window opening positions (right rear, right front, left rear, left front) were 337 °C, 353 °C, 326 °C, and 363 °C, respectively. Figure 11 shows the temperature distribution cloud map above the fire source at Z = 2 m at 320 s for different window positions. By combining Figure 18 and Figure 19, it can be seen that when only the rear windows are open, the temperature above the fire source is at a lower level. After a fire occurs, high-temperature smoke will initially rise to the top of the bus’s interior. When the smoke fills the top of the bus, it gradually begins to descend. By only opening the rear windows, high-temperature smoke can be expelled earlier through the rear windows, leading to a lower temperature above the fire source.

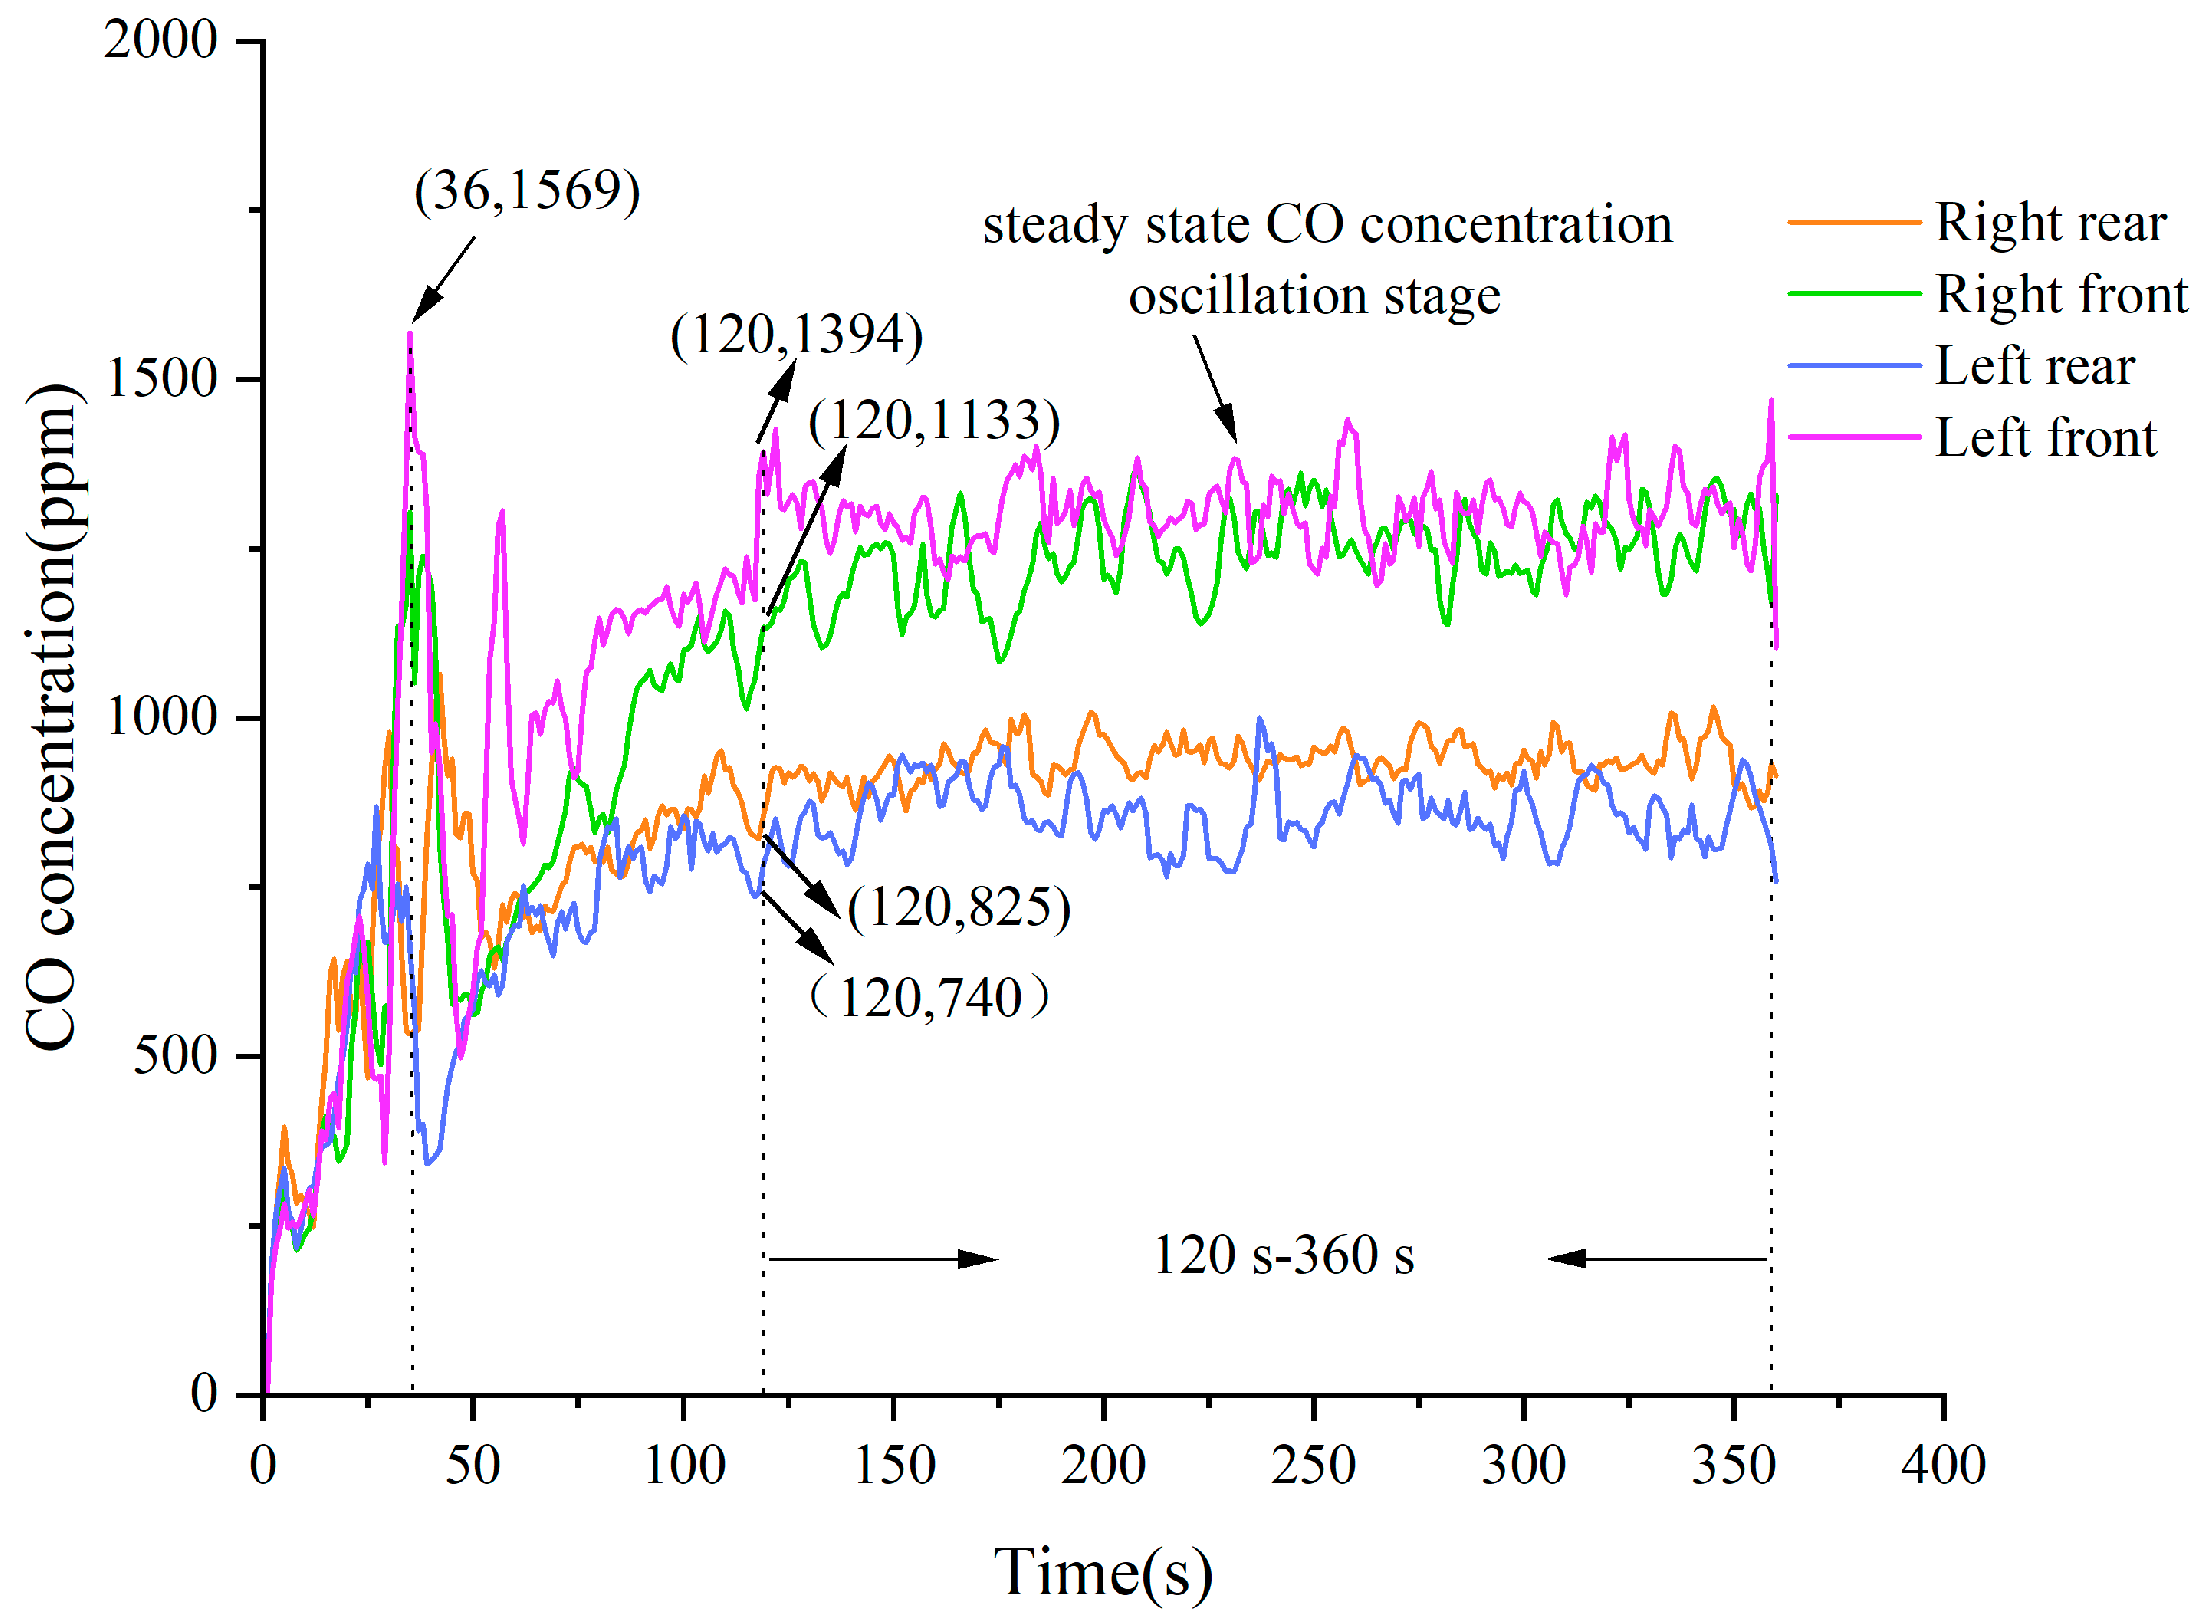
3.3.2. CO Concentration in Electric Bus Fires under Different Window Opening Positions

Under the condition that a lithium-ion battery pack of an electric bus caught fire, the influence of different window opening positions on the CO concentration inside the electric bus compartment was analyzed, yielding the following results:
As shown in Figure 20, following the occurrence of the fire, the CO concentration inside the electric bus cabin rapidly increased across different window opening positions. Around 36 s, there was a sharp increase in CO concentration within the electric bus cabin, swiftly followed by a rapid decrease. Specifically, when only the left front window was opened, the CO concentration peaked at 1569 ppm around 36 s. This spike is attributed to a thermal runaway event occurring in the lithium battery around the 36 s mark, resulting in a sudden release of a large amount of CO from the lithium-ion battery pack. Subsequently, the CO diffused throughout the entire cabin and to the exterior, leading to a rapid decline in CO concentration. Between 36 s and 120 s, the CO concentration inside the electric bus cabin continued to rise, albeit at a slower rate. After 120 s, the CO concentration within the cabin stabilized and fluctuated. The average CO concentrations inside the electric bus cabin under different window opening positions (right rear, right front, left rear, left front) were 937 ppm, 1240 ppm, 861 ppm, and 1300 ppm, respectively. The CO concentration distribution cloud diagram at different window opening positions at Z = 2 m at 320 s is shown in Figure 14. By combining Figure 20 and Figure 21, it can be found that in the two fire conditions of only opening the right rear window and only opening the left rear window, the CO concentration was significantly lower than the other two fire conditions, and the common feature of these two fire conditions was that the windows are located at the rear. This phenomenon arises because, following the fire, the smoke initially spreads upward, and as it reaches the top of the electric bus cabin, it gradually descends. Since some of the rear windows of the electric bus were positioned higher, opening only the rear windows allowed the fire smoke to escape to the exterior more quickly. Therefore, in the event of an electric bus fire, it is advisable to first open the rear windows for evacuation purposes.

4. Conclusions

(1)
When all windows are closed, the temperature above the fire source reaches a maximum value of 445 °C at 93 s, and then the temperature begins to drop sharply; the CO concentration in the cabin reaches a maximum value of 2970 ppm at 81 s, and then the CO concentration begins to drop sharply and 125 s late and is maintained at a stable value near 1800 ppm. When the ventilation area gradually increases from 25% to 100%, the stable value of the temperature above the fire source reaches a minimum value of 508 °C; when the ventilation area is 50%, the stable value of the CO concentration in the compartment reaches a minimum value of 1200 ppm when the ventilation area is 100%. Since toxic smoke is the most harmful to people in a fire, and the temperature above the fire source is not very different under different ventilation areas, when a fire occurs in an electric bus, we should open 100% of the windows.
(2)
Under windless conditions, the temperature above the fire source reaches a steady state temperature oscillation stage after 200 s, and the average temperature in the steady state temperature oscillation stage is 569 °C; the CO concentration in the compartment reaches a maximum value of 1841 ppm at 61 s, and then drops rapidly and stabilizes at 250 ppm. When the wind speed gradually increases from 2 m/s to 8 m/s, the temperature above the fire source and the temperature inside the cabin decrease with the increase in wind speed. When the wind speed is 8 m/s, the stable value of the temperature is above the fire source and the CO in the cabin. The concentration stability values are the lowest, respectively, at 126 °C and 316 ppm. Therefore, when a fire occurs in an electric bus, the wind speed of 8 m/s is most conducive to personnel evacuation.
(3)
When opening different window opening positions, the temperature above the fire source when the rear window is opened, and the CO concentration in the cabin are significantly lower. When the rear windows (right rear, left rear) are opened for 360 s, the temperatures above the fire source are 337 °C and 326 °C, respectively; the stable values of CO concentration in the cabin with the rear windows (right rear, left rear) open are 937 ppm and 861 ppm, respectively. When a fire breaks out in an electric bus, we should choose to open the rear window first and escape from the rear door.
(4)
This study introduces in detail the influence of different ventilation conditions on the fire of electric buses and provides theoretical guidance for fire escape and rescue of electric buses. However, there are some limitations to this study. The paper only considers lithium-ion batteries as combustibles for fire simulation and does not consider the spread of combustibles such as seats and curtains. In the simulation process, the lithium-ion battery pack was set on the surface of the electric bus floor, while the actual lithium-ion battery pack is located inside the electric bus. At the same time, the impact of the door on the fire was not considered.

Author Contributions

Study conception and design, H.Y., M.X. and H.S.; data collection, Y.Z. and S.L.; analysis and interpretation of results, H.Y. and M.X.; draft manuscript preparation, Z.B. All authors have read and agreed to the published version of the manuscript.

Funding

This work was supported by the Henan Province Key R&D Special Project (Grant No. 231111322200), Zhengzhou University of Light Industry Science and Technology Innovation Team Support Program Project (Grant No. 23XNKJTD0305), Henan Province Science and Technology Research Plan Project (Grant No.: 242102240096/242102241051/242102321033/242102321104/232102321094/222102320232), and Zhengzhou City Collaborative Innovation Special Project (Cultivation of Major Projects) (Grant No.: 2021ZDPY0108).

Institutional Review Board Statement

This study was based on software simulations, so ethical approval was not required.

Informed Consent Statement

Not applicable.

Data Availability Statement

Data are contained within the article.

Acknowledgments

The author sincerely appreciates the valuable suggestions provided by the reviewers.

Conflicts of Interest

The authors declare no conflicts of interest.

References

  1. Joshy, N.; Hajiyan, M.; Siddique, A.; Tasnim, S.; Simha, H.; Mahmud, S. Experimental investigation of the effect of vibration on phase change material (PCM) based battery thermal management system. J. Power Sources 2020, 450, 227717. [Google Scholar] [CrossRef]
  2. Ouyang, D.; Chen, M.; Huang, Q.; Weng, J.; Wang, Z.; Wang, J. A Review on the Thermal Hazards of the Lithium-Ion Battery and the Corresponding Countermeasures. Appl. Sci. 2019, 9, 2483. [Google Scholar] [CrossRef]
  3. Victor Chombo, P.; Laoonual, Y.; Wongwises, S. Lessons from the Electric Vehicle Crashworthiness Leading to Battery Fire. Energies 2021, 14, 4802. [Google Scholar] [CrossRef]
  4. Liu, B.; Jia, Y.; Yuan, C.; Wang, L.; Gao, X.; Yin, S.; Xu, J. Safety issues and mechanisms of lithium-ion battery cell upon mechanical abusive loading: A review. Energy Storage Mater. 2020, 24, 85–112. [Google Scholar] [CrossRef]
  5. Wang, K.; Ouyang, D.; Qian, X.; Yuan, S.; Chang, C.; Zhang, J.; Liu, Y. Early Warning Method and Fire Extinguishing Technology of Lithium-Ion Battery Thermal Runaway: A Review. Energies 2023, 16, 2960. [Google Scholar] [CrossRef]
  6. Wang, Q.; Mao, B.; Stoliarov, S.I.; Sun, J. A review of lithium-ion battery failure mechanisms and fire prevention strategies. Prog. Energy Combust. 2019, 73, 95–131. [Google Scholar] [CrossRef]
  7. Mallick, S.; Gayen, D. Thermal behaviour and thermal runaway propagation in lithium-ion battery systems—A critical review. J. Energy Storage 2023, 62, 106894. [Google Scholar] [CrossRef]
  8. Lin, C.-S.; Hsu, J.-P. Modeling and analysis of a bus fire accident for evaluation of fire safety door using the fire dynamics simulator. Clust. Comput. 2019, 22, 14973–14981. [Google Scholar] [CrossRef]
  9. Sandinge, A.; Fredriksson, H.; Blomqvist, P. Evaluation of smoke gas toxicity and smoke density of bus interior materials. Fire Mater. 2023, 47, 270–281. [Google Scholar] [CrossRef]
  10. Klippel, A.; Hofmann, A.; Gnutzmann, T.; Piechnik, K. Reaction-to-fire testing of bus interior materials: Assessing burning behaviour and smoke gas toxicity. Fire Mater. 2023, 47, 665–680. [Google Scholar] [CrossRef]
  11. Jiang, F.; Liu, K.; Wang, Z.; Tong, X.; Guo, L. Theoretical analysis of lithium-ion battery failure characteristics under different states of charge. Fire Mater. 2018, 42, 680–686. [Google Scholar] [CrossRef]
  12. He, X.; Restuccia, F.; Zhang, Y.; Hu, Z.; Huang, X.; Fang, J.; Rein, G. Experimental Study of Self-heating Ignition of Lithium-Ion Batteries During Storage: Effect of the Number of Cells. Fire Technol. 2020, 56, 2649–2669. [Google Scholar] [CrossRef]
  13. Park, S.-G.; Kim, S.-W.; Lee, E.-J. Experimental Study on Fire Characteristics of Lithium-ion Battery using Cone Calorimeter. Fire Sci. Eng. 2021, 35, 1–6. [Google Scholar] [CrossRef]
  14. Vendra, C.M.R.; Shelke, A.V.; Buston, J.E.H.; Gill, J.; Howard, D.; Read, E.; Abaza, A.; Cooper, B.; Wen, J.X. Numerical and experimental characterisation of high energy density 21700 lithium-ion battery fires. Process. Saf. Environ. Prot. 2022, 160, 153–165. [Google Scholar] [CrossRef]
  15. Hynynen, J.; Willstrand, O.; Blomqvist, P.; Andersson, P. Analysis of combustion gases from large-scale electric vehicle fire tests. Fire Saf. J. 2023, 139, 103829. [Google Scholar] [CrossRef]
  16. Sturm, P.; Fößleitner, P.; Fruhwirt, D.; Galler, R.; Wenighofer, R.; Heindl, S.F.; Krausbar, S.; Heger, O. Fire tests with lithium-ion battery electric vehicles in road tunnels. Fire Saf. J. 2022, 134, 103695. [Google Scholar] [CrossRef]
  17. Cui, Y.; Liu, J.; Cong, B.; Han, X.; Yin, S. Characterization and assessment of fire evolution process of electric vehicles placed in parallel. Process. Saf. Environ. Prot. 2022, 166, 524–534. [Google Scholar] [CrossRef]
  18. Arvidson, M.; Westlund, Ö. Water Spray Fire Suppression Tests Comparing Gasoline-Fuelled and Battery Electric Vehicles. Fire Technol. 2023, 59, 3391–3414. [Google Scholar] [CrossRef]
  19. Kang, S.; Kwon, M.; Yoon Choi, J.; Choi, S. Full-scale fire testing of battery electric vehicles. Appl. Energy 2023, 332, 120497. [Google Scholar] [CrossRef]
  20. Li, H.; Peng, W.; Yang, X.; Chen, H.; Sun, J.; Wang, Q. Full-Scale Experimental Study on the Combustion Behavior of Lithium-Ion Battery Pack Used for Electric Vehicle. Fire Technol. 2020, 56, 2545–2564. [Google Scholar] [CrossRef]
  21. Xie, J.; Li, J.; Wang, J.; Jiang, J. Fire protection design of a lithium-ion battery warehouse based on numerical simulation results. J. Loss Prev. Process Ind. 2022, 80, 104885. [Google Scholar] [CrossRef]
  22. Wang, J.; Jia, Z.; Qin, P. Simulation of thermal runaway gas diffusion in LiFePO4 battery module. Energy Storage Sci. Technol. 2022, 11, 185–192. [Google Scholar]
  23. Jiang, J.; Liu, Q.; Wang, Z. Study on fire spreading law of lithium-ion battery in storage shelf. Fire Sci. Technol. 2023, 42, 471–476. [Google Scholar]
  24. Guo, Q.; Tao, L.; Ma, Z. Numerical simulation analysis of combustion of electric sport utility vehicles. Energy Storage Sci. Technol. 2024, 13, 1000–1008. [Google Scholar]
  25. Kang, Q.; Zhao, L.; Li, Z. Numerically simulated study on the characteristic features and spreading process of the bus fire. J. Saf. Environ. 2015, 15, 107–110. [Google Scholar]
  26. Xia, J. Discussion on fire characteristics and heat release rate of blade electric vehicles. J. Saf. Environ. 2021, 21, 1028–1032. [Google Scholar]
  27. Ren, C.; Zhang, G. Analysis of Growth and Spreading of Fire Started from Engine Compartment of Large Bus. In Proceedings of the 2018 International Conference on Information Systems and Computer Aided Education (ICISCAE), Changchun, China, 6–8 July 2018. [Google Scholar]
  28. Brzezinska, D.; Bryant, P. Performance-Based Analysis in Evaluation of Safety in Car Parks under Electric Vehicle Fire Conditions. Energies 2022, 15, 649. [Google Scholar] [CrossRef]
  29. Pan, H.; Ji, H.; Qiu, M. Numerical simulation study on fire of lithium-ion battery pack in electric vehicle. China Work. Saf. Sci. Technol. 2020, 16, 104–109. [Google Scholar]
  30. Dorsz, A.; Lewandowski, M. Analysis of Fire Hazards Associated with the Operation of Electric Vehicles in Enclosed Structures. Energies 2022, 15, 11. [Google Scholar] [CrossRef]
  31. Sun, P.; Bisschop, R.; Niu, H.; Huang, X. A Review of Battery Fires in Electric Vehicles. Fire Technol 2020, 56, 1361–1410. [Google Scholar] [CrossRef]
  32. Lou, Z.; Huang, J.; Wang, M.; Zhang, Y.; Lv, K.; Yao, H. Inhibition performances of lithium-ion battery pack fires by fine water mist in an energy-storage cabin: A simulation study. Phys. Fluids 2024, 36, 045141. [Google Scholar] [CrossRef]
  33. Feng, X.; Ouyang, M.; Liu, X.; Lu, L.; Xia, Y.; He, X. Thermal runaway mechanism of lithium-ion battery for electric vehicles: A review. Energy Storage Mater. 2018, 10, 246–267. [Google Scholar] [CrossRef]
  34. Kim, E.; Woycheese, J.P.; Dembsey, N.A. Fire Dynamics Simulator (Version 4.0) Simulation for Tunnel Fire Scenarios with Forced, Transient, Longitudinal Ventilation Flows. Fire Technol. 2008, 44, 137–166. [Google Scholar] [CrossRef]
  35. Mao, B.; Liu, C.; Yang, K.; Li, S.; Liu, P.; Zhang, M.; Meng, X.; Gao, F.; Duan, X.; Wang, Q.; et al. Thermal runaway and fire behaviors of a 300 Ah lithium-ion battery with LiFePO4 as cathode. Renew. Sustain. Energy Rev. 2021, 139, 110717. [Google Scholar] [CrossRef]
  36. Lee, J. Numerical analysis of how ventilation conditions impact compartment fire suppression by water mist. Ann. Nucl. Energy 2020, 136, 107021. [Google Scholar] [CrossRef]
Figure 1. Geometric model of the individual battery cell.
Fire 07 00182 g001
Figure 2. Heat release rate of a battery.
Fire 07 00182 g002
Figure 3. Electric bus model diagram.
Fire 07 00182 g003
Figure 4. Layout of fire source and detection points.
Fire 07 00182 g004
Figure 5. The specific location of the detection point.
Fire 07 00182 g005
Figure 6. Changes in CO concentration with time under different grid sizes.
Fire 07 00182 g006
Figure 7. Fire conditions of electric buses under different ventilation areas.
Fire 07 00182 g007
Figure 8. Fire conditions of electric buses under different wind speed conditions.
Fire 07 00182 g008
Figure 9. Fire conditions of electric buses under different ventilation positions.
Fire 07 00182 g009
Figure 10. Temperature changes over time above the fire source under different ventilation areas.
Fire 07 00182 g010
Figure 11. Temperature distribution cloud map under different ventilation areas with Z = 2 m in 320 s.
Fire 07 00182 g011
Figure 12. Changes in CO concentration in the cabin over time under different ventilation areas.
Fire 07 00182 g012
Figure 13. CO concentration distribution cloud map under different ventilation areas with Z = 2 m in 320 s.
Fire 07 00182 g013
Figure 14. Temperature changes over time above the fire source under different wind speed conditions.
Fire 07 00182 g014
Figure 15. Temperature distribution cloud map under different wind speed conditions at Z = 2 m in 320 s.
Fire 07 00182 g015
Figure 16. Changes in CO concentration in the cabin over time under different speed conditions.
Fire 07 00182 g016
Figure 17. CO concentration distribution cloud map under different wind speed conditions at Z = 2 m in 320 s.
Fire 07 00182 g017
Figure 18. Temperature changes over time above the fire source under different window opening positions.
Fire 07 00182 g018
Figure 19. Temperature distribution cloud map under different window opening positions at Z = 2 m in 320 s.
Fire 07 00182 g019
Figure 20. Changes in CO concentration in the cabin over time under different window opening positions.
Fire 07 00182 g020
Figure 21. CO concentration distribution cloud map under different window opening positions at Z = 2 m in 320 s.
Fire 07 00182 g021
Table 1. Typical public bus fire incidents at home and abroad.
TimePlaceEvent
16 February 2023Shijingshan District, Beijing, ChinaA non-passenger-carrying bus suddenly caught fire while in transit. Due to the timely control of the fire, there were no casualties. The cause of the fire is currently unknown.
12 February 2022Shenyang City, Liaoning Province, ChinaA bus traveling on the road experienced an explosion, resulting in one fatality, two severe injuries, and 40 minor injuries. According to reports, the cause of the fire was an explosion of the lithium battery used in the bus.
9 January 2021South IndiaA bus caught fire suddenly while in motion, leading to at least 19 fatalities. According to reports, the cause of the fire was a short circuit resulting from an engine malfunction.
11 August 2021Karnataka, IndiaA public bus caught fire, resulting in five fatalities and 27 injuries, including one child. Preliminary investigations indicate that the cause of the accident was an engine malfunction.
12 September 2020Punjab Province, PakistanA bus caught fire suddenly while in transit, resulting in at least nine fatalities and 15 injuries. According to reports, the cause of the fire was an electrical malfunction.
1 June 2017Nanning City, Guangxi Province, ChinaA bus caught fire suddenly while in transit, resulting in at least 35 fatalities and 19 injuries. According to reports, the cause of the fire was a fire in the vehicle’s electrical system due to a malfunction.
Table 2. Experimental studies on the thermal runaway of lithium-ion batteries.
AuthorResearch ContentConclusion
Jiang et al. The relationship between thermal runaway characteristics of lithium-ion batteries and different charging statesThe higher the lithium-ion battery capacity, the lower the starting temperature for thermal runaway [11].
He et al.Surface and core temperatures, voltages and ignition times of stacked lithium-ion cells with different numbers.Self-heating ignition of open-circuit lithium-ion batteries is possible, and its behavior is divided into three stages: heating, self-heating and thermal runaway [12].
Park et al.Fire characteristics and heat release rates of cylindrical standard lithium-ion batteriesThe fire consists of two combustion stages. The peak HRR of the second stage of combustion is higher than that of the first stage and is accompanied by a violent explosion [13].
Vendra et al.A total of 21,700 heat release rate and temperature evolution during the thermal runaway of lithium-ion batteriesUnder thermal abuse conditions, the average peak values of battery heat release rate, battery surface, and internal temperature are 3.6 kW, 753 °C and 1080 °C, respectively [14].
Hynynen et al.Toxic gases produced when lithium-ion batteries burnThe biggest difference between electric vehicles and internal combustion engine vehicles is hydrogen fluoride [15].
Table 3. Full-scale experimental studies on electric vehicle fire.
AuthorResearch ContentConclusion
Sturm et al.Electric vehicle fire test.The heat release rate of electric vehicles is higher than that of traditional fuel vehicles [16].
Cui et al.Fire evolution process and characteristics of two electric vehicles placed side by side.The precursor to a fire in an electric vehicle is white smoke coming out of the chassis, and the flames spread between electric vehicles faster than in internal combustion engine vehicles [17].
Arvidson et al.Fire extinguishing tests on water sprinkler systems for fuel vehicles and electric vehicles.Electric vehicle fires take longer to burn, and the combustion products are more complex [18].
Kang et al.Thermal behavior of pure electric vehicle fires.The intensive emission of jet flames from lithium-ion battery packs causes the flames to quickly spread to adjacent combustible parts, thereby accelerating the growth of the fire [19].
Li et al.Comprehensive thermal runaway testing of lithium-ion battery packs.In the worst case, it only takes 22 s for a lithium-ion battery cell to undergo thermal runaway and turn into a flame that spreads to the entire battery pack [20].
Table 4. The research status of lithium-ion battery fire simulation using PyroSim software.
AuthorResearch ContentConclusion
Xie et al.Numerical simulation of lithium-ion battery warehouse under different fire scenes.Determine the warehouse layout plan with optimal battery state of charge, shelf spacing, and fire extinguishing measures [21].
Wang et al.Gas diffusion rules during battery thermal runaway.Among the four thermal runaway gases H2, CO, CO2, and CH4, the concentration of CO2 is about 30%, accounting for the largest proportion, the concentration of CO is about 5%, the concentration of H2 is about 18%, and the concentration of CH4 is about 14% [22].
Jiang et al.Fire spread rules in different fire locations of lithium-ion batteries.In a four-layer lithium battery shelf, the continuous release time of CO is 54% longer when the bottom shelf catches fire than when the top shelf catches fire [23].
Guo et al.Fire combustion characteristics, flame propagation during combustion and cockpit smoke analysis of pure electric vehicles.Smoke will enter the cabin through the gaps in the body, and the smoke concentration in the passenger compartment will reach 100% coverage within 40 s [24].
Kang et al.Effect of door opening on bus fire development and personnel escape.The critical time for passengers to escape is within 20 s after the door is opened [25].
Xia et al.Fire characteristics and heat release rate of pure electric vehicles.The formula is reasonable to estimate the heat release rate of pure electric vehicle [26].
Ren et al.Numerical simulation of the fire process in the bus engine compartment.The faster the wind speed, the shorter the time it takes for a bus fire to reach the peak heat release rate [27].
Brzezinska et al.Numerical simulation of the thermal runaway process of the electric vehicle lithium-ion battery pack.Electric car fires in garages do not pose a risk to people staying in the garage [28].
Pan et al.The diffusion process of toxic smoke after thermal runaway of lithium-ion batteries in electric buses.After an electric bus fire, it is safer for people to escape through the back door than through the front door [29].
Dorsz et al.Comparison of fire characteristics between electric vehicles and conventional internal combustion engine passenger vehicles.There is little difference in temperature and visibility during fires between electric vehicles and conventional combustion engine vehicles [30].
Table 5. Thermal physical parameters of the lithium-ion battery model.
ArgumentPositive ElectrodeNegative ElectrodeElectrolyteDiaphragm
Density/(kg/m3)270085002600492
Specific heat capacity/[kJ·/(kg·K)]90038511001978
Thermal conductivity/[W/(m·K)]160146210.334
Thermal absorption coefficient0.80.80.90.8
Table 6. Fire scene settings.
Serial NumberFire Scene Settings
1Close all windows
2Open 8 (25%) windows
3Open 16 (50%) windows
4Open 24 (75%) windows
5Open 32 (100%) windows
6Conducted under windless conditions
7The wind speed is 2 m/s
8The wind speed is 4 m/s
9The wind speed is 6 m/s
10The wind speed is 8 m/s
11Open the right front windows
12Open the right rear windows
13Open the left front windows
14Open the left rear windows
Disclaimer/Publisher’s Note: The statements, opinions and data contained in all publications are solely those of the individual author(s) and contributor(s) and not of MDPI and/or the editor(s). MDPI and/or the editor(s) disclaim responsibility for any injury to people or property resulting from any ideas, methods, instructions or products referred to in the content.

