1. Introduction
As Decker describes in his article [
1], the first application of the Monte Carlo method dates back to 1777, when a probabilistic method for calculating the value of π was introduced. Later, at the beginning of the twentieth century, the Monte Carlo method was used to study the Boltzmann equation and to estimate the correlation coefficient for the t-distribution. Over time, the Monte Carlo method has been applied in other diverse fields such as computer science, engineering, architecture, and economics [
1].
The Monte Carlo method has also been applied in some cases dealing with the problem of evacuation of people. In this context, the term “evacuation of people” refers to the movement of all people from areas threatened by an emergency to a place of safety. The procedure for applying the Monte Carlo method in the field of evacuation of people is described by Phillips and Fahy in Chapter 80 of the SFPE handbook [
2].
Ternero et al. used the Monte Carlo method in their study to design fire evacuation plans for buildings in case of emergency [
3]. In this study, two proposed evacuation strategies for a specific building (Faculty of Engineering—USACH) were evaluated using a combination of simulations and data analysis using the Monte Carlo method. The simulations were performed using Pathfinder software version 2023.2 and highlighted key factors that affect a successful evacuation strategy, such as the distribution of people, the exit capacity, and the time available for evacuation. The optimisation of the evacuation plan was also addressed by Li et al. in their study [
4] in which the game theory based on the Monte Carlo analysis method was applied.
The Monte Carlo method was used in a study of crowd evacuation dynamics [
5] by Tamang and Sun. The stimulus for their study was the growing need to understand the processes by which people leave buildings. Their study found that the evacuation time increases with the initial density of people and decreases with increasing exit width. The simulations also showed that the crowd was grouped around the exits. This study aimed to develop a quantitative method to facilitate the design of people facilities and the management of people flows during an emergency to reduce the number of injured people or casualties during evacuation.
Shariff et al. [
6] used the Monte Carlo method to evaluate the safety and risk associated with the evacuation of people when emergency exits are blocked, considering the safety regulations and procedures established in Malaysia. Xie et al. applied this method in their study [
7] to determine the optimal distance between exits, which is a key aspect in the design of building fire safety.
The multipurpose hall that is the subject of this study is considered a place where people gather. In these types of buildings and spaces, it is important to pay close attention to proper fire safety design, especially to ensure the safe evacuation of people. In a study [
8], Chen and Mao addressed the issue of safely evacuating people from public areas, which can also be considered assembly areas. Two key indicators, ASET and RSET, were compared to assess the level of safe evacuation. To quantify uncertainties and their application in engineering design, the probability of failure model was used for the evacuation of people, followed by the Monte Carlo method.
Several other studies have addressed the issue of evacuating people from stadiums [
9,
10]. In their study [
11], Gravit et al. compared the flow of people during evacuation from two selected arenas (a sports arena and an entertainment arena) using simulated pedestrian dynamics. This study evaluates the effect of the evacuation route design on evacuation times and highlights the need for effective evacuation planning, especially when stairs are involved. Minegishi [
12] investigated the problem of crowd dynamics during emergencies by observing people—the author was part of the crowd—returning from football matches held in eight different stadiums.
Contribution, Scope, and Limitations of This Study
This study presents an innovative approach that uses a probabilistic model, specifically the Monte Carlo method, to analyse iterative evacuation processes. This research focusses on evaluating the change in evacuation time when the speed of movement is set according to different sources and on the effect of changing preferences for door selection on evacuation time. To properly evaluate the effect of changes on evacuation time, a convergence rate of iterations is performed for simulations. This ensures that the simulations are repeated until the results are acceptable.
This study addresses the problem of how to evacuate a large number of people safely and effectively from a multipurpose hall that is considered an indoor assembly area. Evacuation models provide some representation of human behaviour. However, they cannot fully reflect reality because they do not consider key aspects such as fear, panic, or uncertainty. Nonetheless, these models can provide valuable information to help develop effective and safe evacuation plans.
The remainder of this paper is structured as follows:
Section 2 briefly describes the multipurpose hall that was the subject of the case study. It also includes a description of Pathfinder software version 2023.3, detailing the input parameters used to simulate evacuation of people, and a description of the Monte Carlo method.
Section 3 presents the results of the analysis of evacuation times and space usage maps.
Section 4 discusses and evaluates the sensitivity analysis of the convergence rate. Finally,
Section 5 presents the conclusions and suggestions for future directions.
2. Methods
2.1. Case Study
The aim is to investigate how modern technology (the Monte Carlo method) can contribute to the development of effective and safe evacuation plans for mass events. This study focusses on modelling the evacuation of people for two specific configurations of the multipurpose hall. These are a hockey match with a capacity of 9500 people and a concert with a capacity of 11,000 people. For both configurations, we investigated how the evacuation of people is affected by the input of speed of movement from different sources [
13,
14,
15] and what effect changes in the preference for door selection have on the evacuation of people.
The Pathfinder software version 2023.3, which supports the Monte Carlo method, was chosen to implement the simulation process and configure agents (people). The combination of the two tools was used to obtain data on evacuation times, means, standard deviations (SDs), and people concentrations in the selected area. The results of the simulations provided valuable information for the design of effective safety measures in multipurpose halls and other similar multipurpose venues.
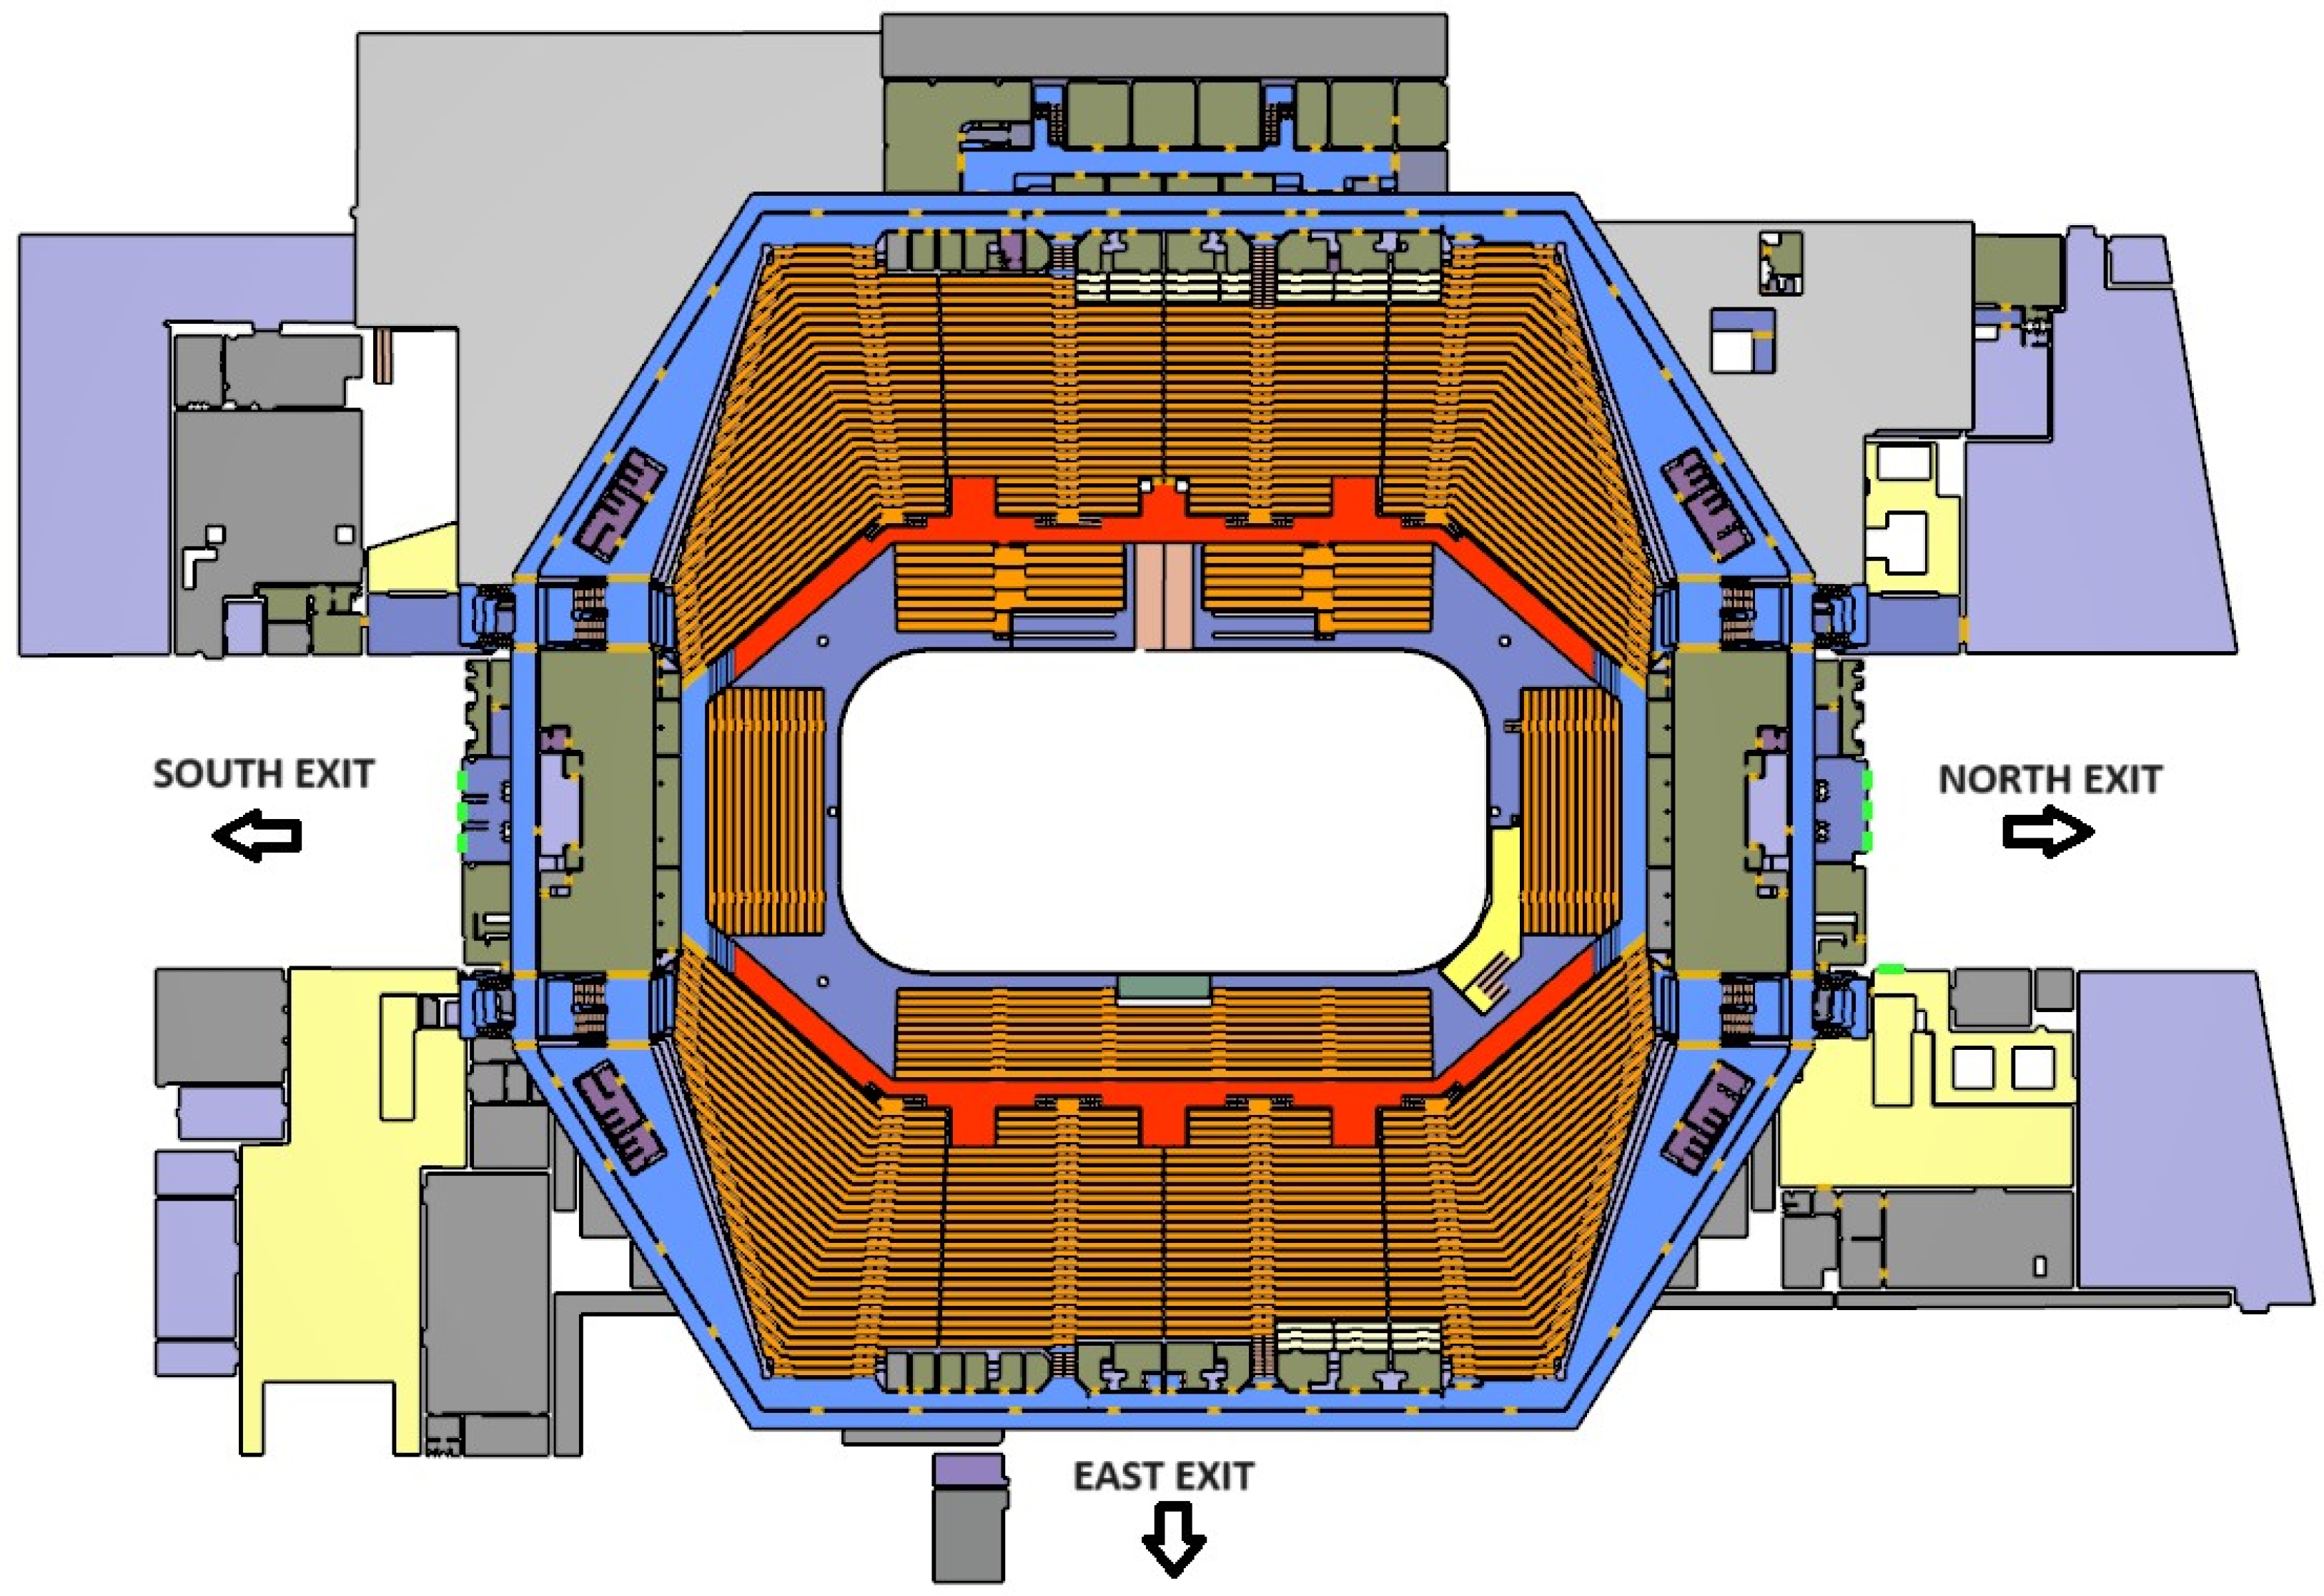
A multipurpose hall in the Czech Republic is the subject of this study. The hall has a total of 19 grandstands, which are marked with letters, and the individual rows are marked with Arabic numerals. The grandstands are located around the ice area. Matches, tournaments, and various performances are held in the ice area. The access to the grandstands is through stairs that lead from the entrance hall. Three entrances lead to the multipurpose hall and also serve as emergency exits in an emergency event. There are three entrance doors on the north and south sides, while the east side offers two entrance doors. All entrances to the multipurpose hall are wheelchair accessible. The multipurpose hall and its emergency exits are shown in
Figure 1.
2.2. Pathfinder Software
As mentioned above, the Pathfinder software version 2023.3 was used for this study [
16]. The software was developed by Thunderhead Engineering, which provides regular updates of this software. Pathfinder is now a widely used software, as evidenced by the number of studies on the evacuation of people in which the software has been applied [
17,
18,
19]. Pathfinder version 2023.3 was used for the simulation processes.
A people movement simulation software provides two simulation modes: the Society of Fire Protection Engineers (SFPE) mode and the steering mode. For this study, all simulations were performed in the steering mode. The control mode aims to mimic human behaviour and movements as closely as possible. This scheme is based on the autonomous behaviour of each agent. Agents move independently towards their goal while avoiding other people and obstacles [
16].
In Pathfinder, people are replaced by agents, as mentioned above. By default, they are displayed as cylinders with a diameter of 45.58 cm and a height of 1.83 m or as 3D people figures. The dimensions of the agents used in the simulations and how they are represented in the simulation are listed in
Table 1.
Four scenarios were developed to illustrate the evacuation of people from a multipurpose hall. Two (scenarios 1A and 1B) related to a hockey match and the other two (scenarios 2A and 2B) to a concert. Scenarios 1A and 2A show the evacuation of people without specifying the time before evacuation and without changing the preference for door selection, corresponding to a situation in which the agents are unfamiliar with the environment. These scenarios are called “original”. On the other hand, Scenarios 1B and 2B include agents who already have a set pre-evacuation time and their preference for door selection has also been adjusted. These scenarios are called “modified”.
In the original scenarios, people were divided into two main categories: ordinary people and vulnerable people. These categories were further subdivided into several groups, which are detailed in
Table 2. In the modified scenarios (1B and 2B), two additional profiles were added: “assistant men” and “assistant women”. The percentage distribution of the different groups within the scenarios is shown in
Figure 2.
In all four scenarios, the speeds of movement from different sources were successively entered, as shown in
Table 2. The aim was to find out how a change in the speed of movement set according to various sources (according to different authors) can affect the evacuation of people. In scenarios in which the speed of movement was set according to Fruin [
13], this speed of movement was set with a normal distribution with a mean value of 1.2 m/s and a standard deviation (SD) of 0.2 m/s. In scenarios in which the speed of movement was set according to Weidmann [
15], the effect of changing the dimensions of people (change in shoulder width) was also investigated. A comparison was made between the default dimensions (45.58 cm for all equally) and the dimensions according to Pheasant [
20] with a normal distribution.
As stated previously, Scenarios 1B and 2B involved setting a time before evacuation. This period was determined based on data from the publication [
22], which specifies a pre-evacuation time between 41 and 60 s for assembly areas with an auditorium. This range was applied to all people. In Scenarios 1B and 2B, the door selection parameters were also modified, as shown in
Table 3. In both scenarios, agents consider their distance to the door in the room but can change their choice during the simulation. Scenario 1B assumes that half of the visitors to the multipurpose hall are very familiar with the environment because they regularly attend hockey matches. On the contrary, in Scenario 2B, the setting was based on the idea that most visitors are not local and are, therefore, unfamiliar with the area.
2.3. Using the Monte Carlo Method
The Monte Carlo method is an effective tool for investigating patterns of behaviour. It is applied to determine the ideal number of simulations in evacuation models such as Pathfinder; the results are then subjected to convergence analysis (sensitivity analysis). The aim is to check whether the results are sufficiently accurate in relation to the expected values. The process involves a series of repeated simulations that generate average total evacuation time (TET) values that converge to the average evacuation time course. Analysis of the average TET values provides information on the time required for a safe escape.
To determine the convergence rate of the TET, the method proposed by Ronchi in collaboration with Reneke and Peacock [
23] is used. First, the arithmetic mean of the TET for the j-runs must be determined. This can be expressed as TETavj and is calculated using Equation (1).
Then, the convergence rate of two consecutive average evacuation times TET
avj (TET
av1, TET
av2, etc.) is determined. The convergence rate according to [
23] is obtained by calculating TET
convj using Equation (2). The TET
convj value is expressed as a percentage (%) as the absolute value of the difference between two consecutive average TET values divided by the last average evacuation time [
23]. The last value of TET
convj corresponds to all runs and can be referred to as TET
convFIN.
The convergence rate values obtained by TET
convj (including TET
convFIN) are then compared with the TR
TET threshold. The determination of the threshold value according to [
23] depends on various factors, such as the evacuation scenario or the model used. The potential value in the context of fire safety engineering can be the potential value in the context of modelling according to [
23], TR
TET = 0.5%.
The aim of this study is to achieve consistent results in terms of the average evacuation times of people. Using the Monte Carlo method, it is possible to generate the desired number of variations (iterations) with random agent positions and profiles for all agents [
16]. The agent profile includes parameters such as speed, shape (diameter, height), and preference for door selection. In this study, 30 repetitions of each simulation were performed. This approach avoids interpretation of the study topic solely based on individual behaviour. The actual implementation of the Monte Carlo method involved the following steps:
Define the problem to be solved.
Model the system and identify key parameters.
Repeat the simulation of the system.
Perform statistical analysis.
Interpret the results obtained.
3. Results
3.1. Analysis of Evacuation Times
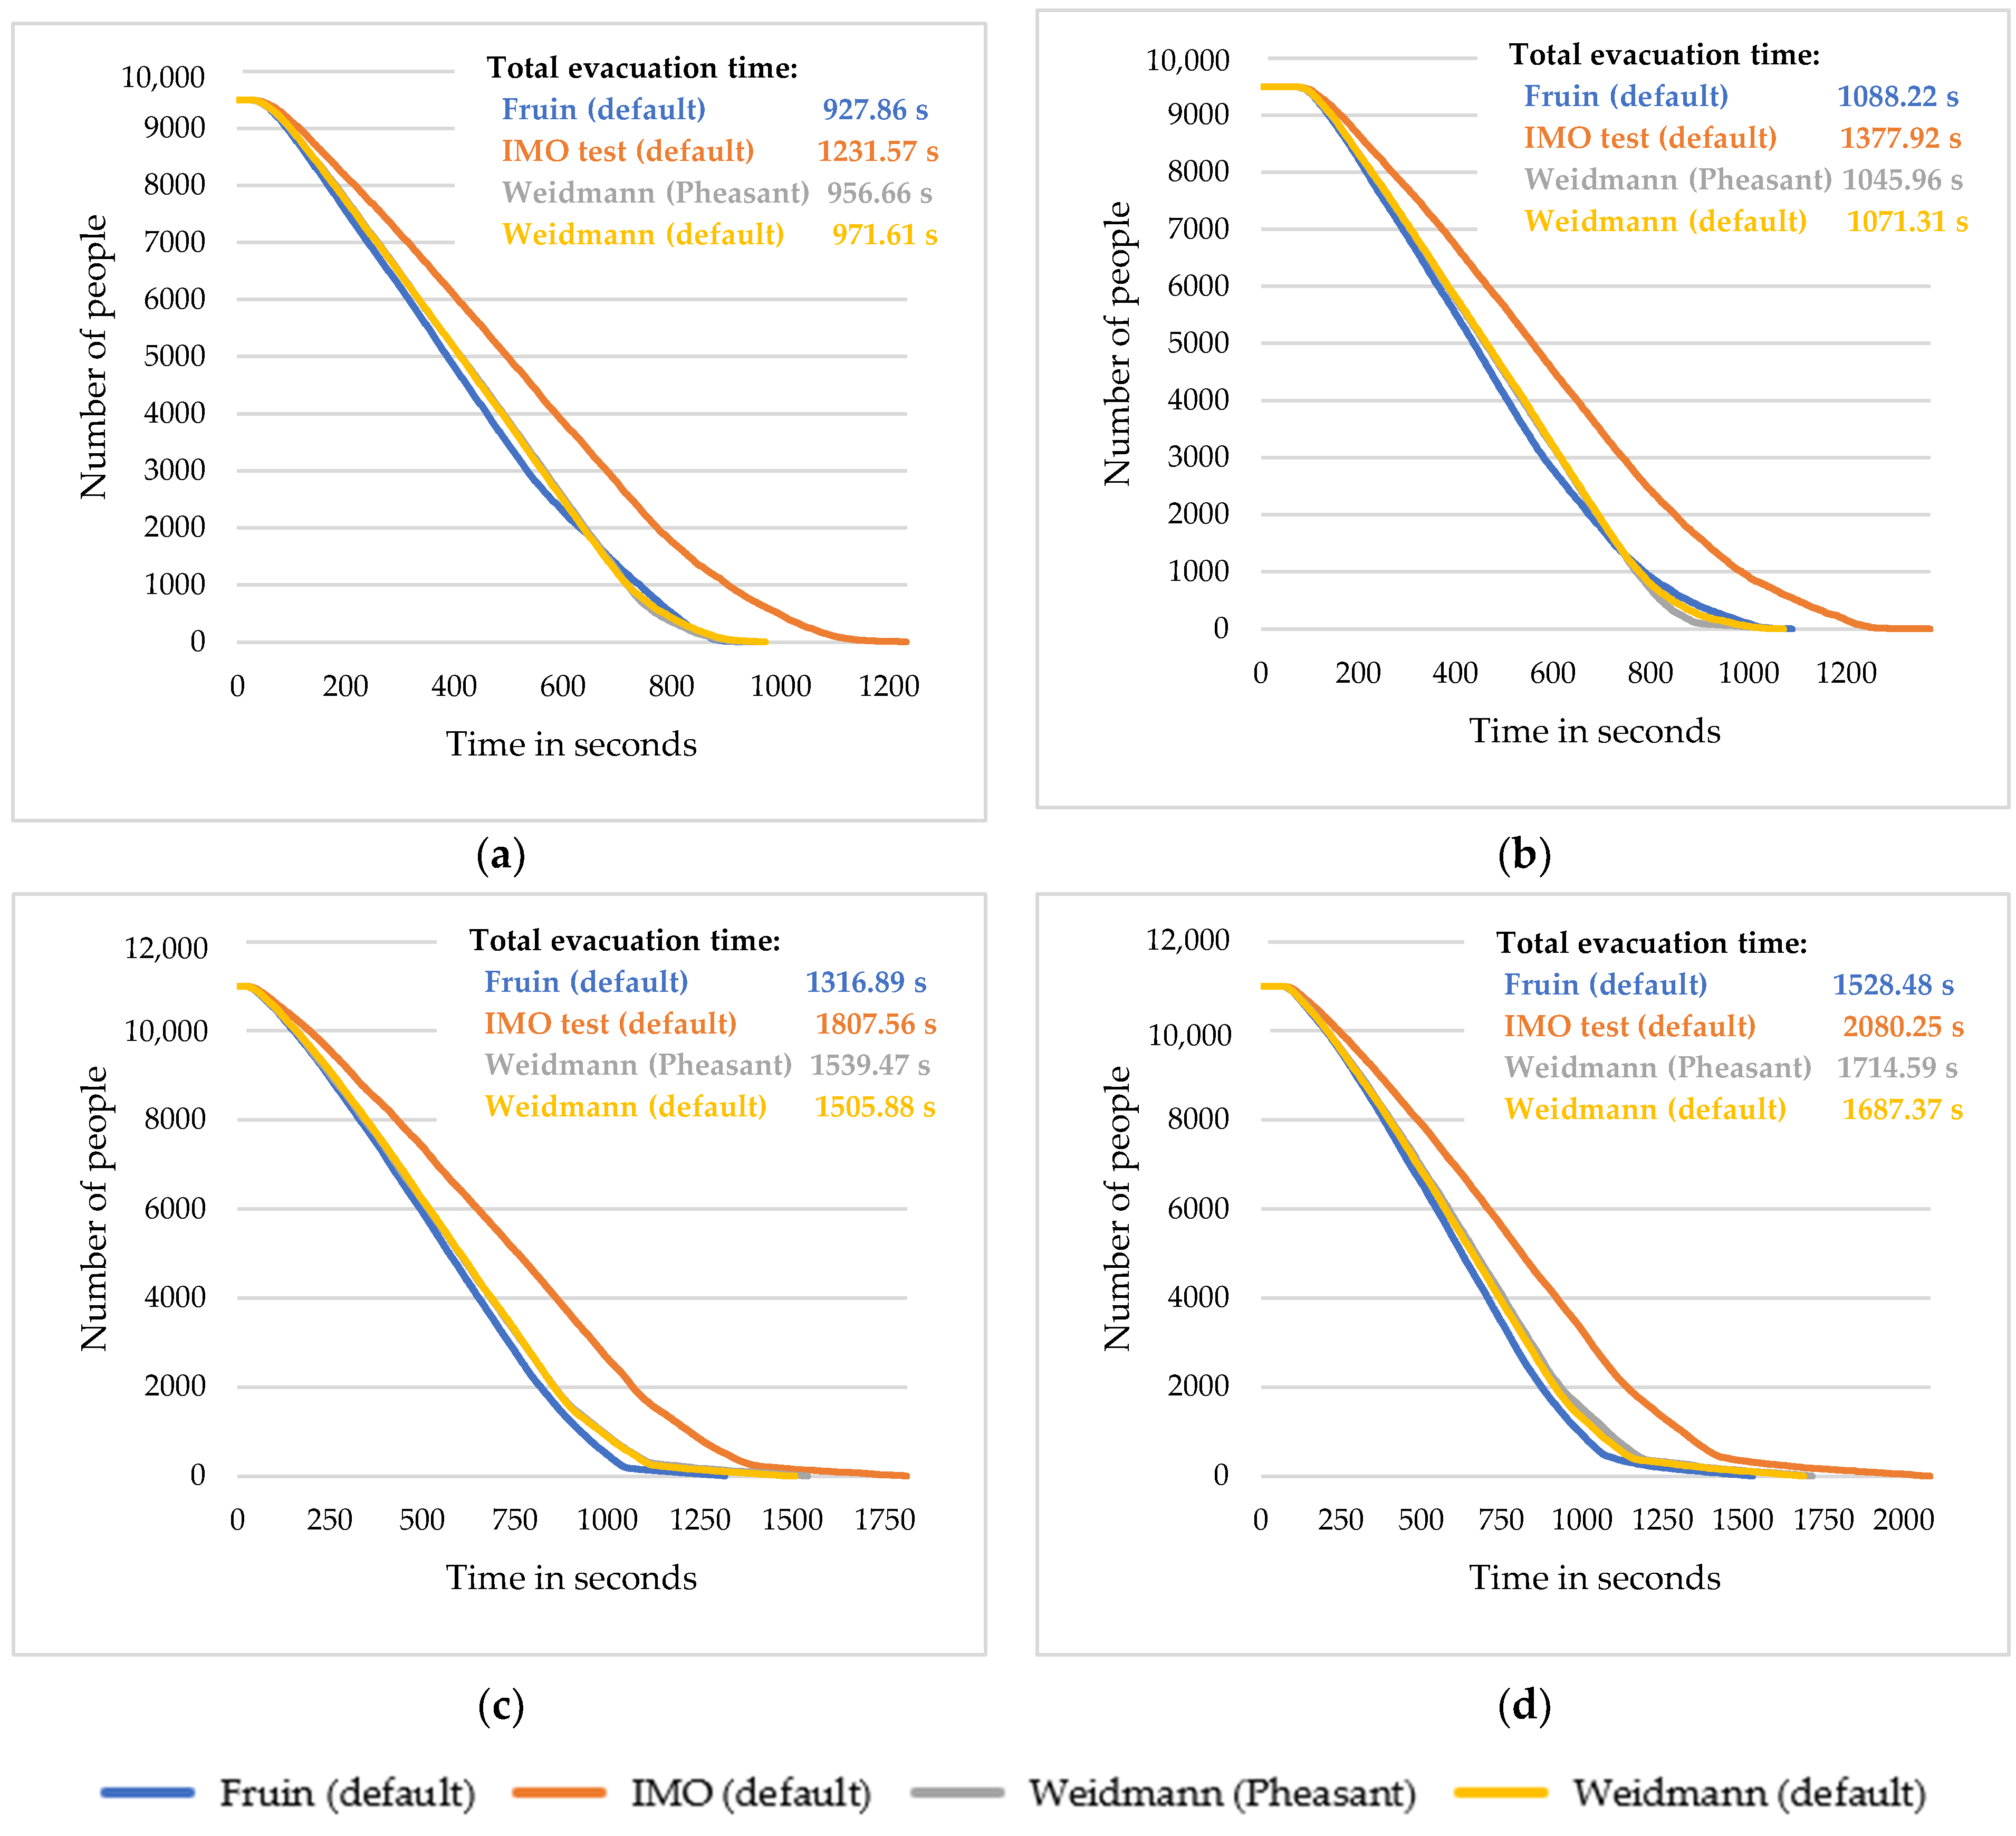
The analysis of the evacuation time of people for both situations (hockey—Scenario 1A, 1B; concert—Scenario 2A, 2B) was carried out based on the tables of values generated by the Pathfinder software version 2023.3. During the analysis, investigations were carried out on how the evacuation time changes and how its course depends on changes in the input parameters of the speed of movement. The graphs in
Figure 3 were generated for the average values obtained using the Monte Carlo method for 30 iterations of each scenario. These graphs express the relationship between the number of people remaining in the model (space) and the evacuation time in seconds. This analysis allows a better understanding of the factors that affect the effective evacuation process and highlights the need to improve the safety of people in an emergency event.
In
Figure 3, the greatest increase in evacuation time occurs when the speed of movement is set according to the International Maritime Organisation (IMO) test. For Scenarios 1A and 1B, the total evacuation time increased by approximately 300 s. For Scenarios 2A and 2B, it extended by 500 s compared to the Fruin speed of movement and by 300 s compared to the Weidmann speed of movement. It is also important to warn about the difference between the evacuation time at the speed of movement according to Fruin and the evacuation time at the speed of movement according to Weidmann. For Scenarios 1A and 1B, this difference was approximately 30 s, whereas for Scenarios 2A and 2B, the difference was approximately 200 s.
As part of this study, the effect of changing the width of the agents’ shoulders on the evacuation time was also monitored when entering the speed of movement according to Weidmann. It can be seen in
Figure 3 that changing the width of the shoulders from the default software setting (yellow curve) to the dimensions according to Pheasant (grey curve) did not have a significant effect on the evacuation time and its smooth course. The time difference between the evacuation time for the speed of movement according to Weidmann and the shoulder width according to Pheasant and the evacuation time for the speed of movement according to Weidmann and the shoulder width according to the default setting was about 30 s.
In
Figure 3, the difference in the time that the first agent leaves the multipurpose hall can also be observed. If a pre-evacuation time is set, the evacuation time will be longer. This setting makes the situation of the model more realistic. It takes into account the time for decision-making and preparation for evacuation. It is unlikely that everyone will start evacuating at the same time without first deciding on the next steps.
During the evaluation of the results, it was found that the change in preference for the door selection set for Scenario 1B and Scenario 2B affected the evacuation time. This can be seen in
Figure 3. In both cases, preferences for door selection resulted in an increase in evacuation time. The increase in evacuation time is due to the pre-evacuation time setting (in the
Section 2.2), which was not specified in the original scenarios (Scenarios 1A and 2A). Although Scenario 1B assumed knowledge of the facility for about half of the visitors, the evacuation time was longer than that in Scenario 1A with the original preferences for door selection. This finding is unexpected, as the evacuation time was expected to be shorter or the same as in Scenario 1A. A greater difference in evacuation times was observed between Scenarios 2A and 2B, where the preference for door selection was only changed from a value of 1 to a value of 2. These results show that even a small change in preferences for door selection can have a significant impact on overall evacuation times.
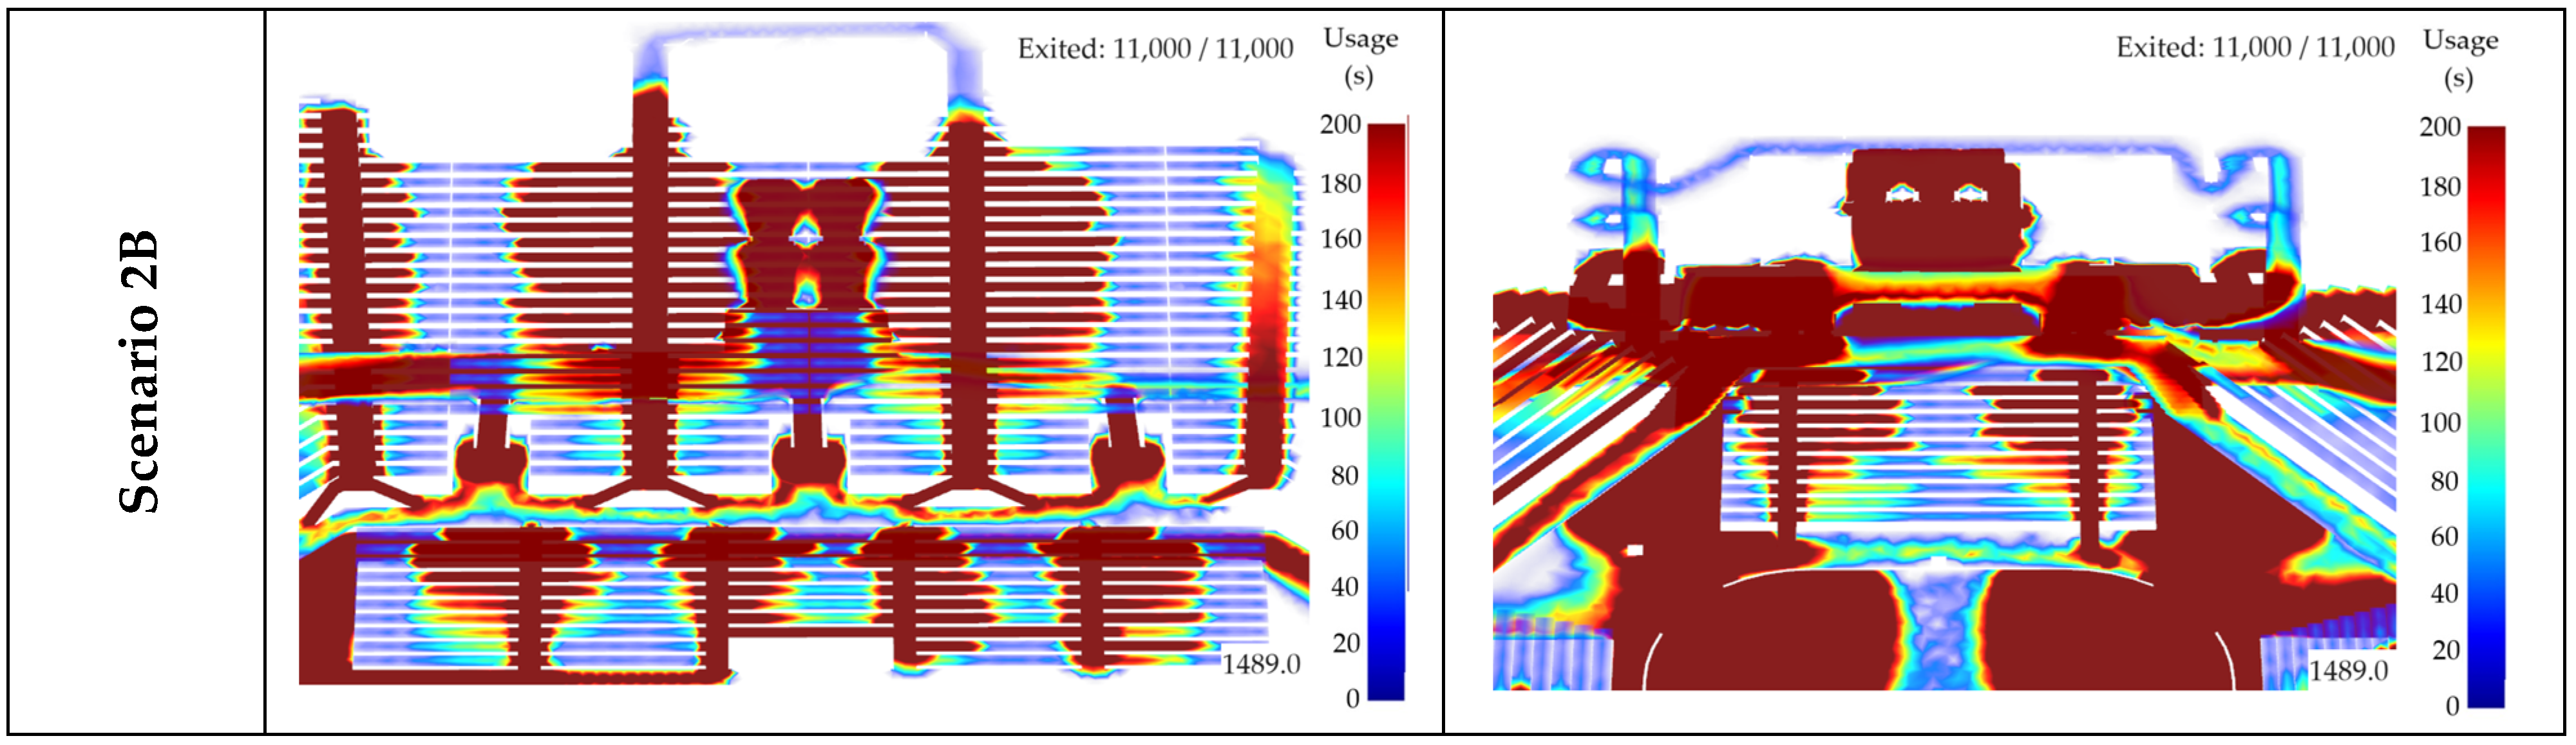
3.2. Analysis of Space Use Maps
Space usage maps are a useful tool to represent the evacuation process. These maps allow you to identify areas in which queues and congestion form during evacuations. Furthermore, they also allow one to identify areas with a high density of people and thus help to understand and reduce the risks associated with evacuation. For better clarity, the individual areas are distinguished by colour. The areas with the highest loads are marked in dark red, indicating areas with a high risk of injury or death. Identifying these locations can make the evacuation process more efficient.
Figure 4 shows space usage maps for all four scenarios in this study and provides a 3D view of two key areas within the building: (i) Grandstand B and East exit and (ii) Grandstand C and North exit. Although evacuation times vary from scenario to scenario, critical areas with high concentrations of people and queues appear in the same locations in all scenarios. This includes all the stairs in the building, the corridors, and exits of the multipurpose hall. The main difference can be seen when comparing the situation of a hockey match with a concert. During the concert (Scenarios 2A and 2B), people can only leave the ice area by the North exit. Barriers are placed at the South exit to prevent escape in that direction. The space behind these barriers contains the technical and sound equipment needed for the concert to run smoothly. During the concert, a very critical area with a high concentration of people is the area by Grandstand C towards the North exit.
4. Discussion
This study proposes the use of a probabilistic model, specifically the Monte Carlo method, combined with simulation software to develop an effective and safe evacuation plan for a multipurpose hall designed to host mass events. For the model to be as realistic as possible, the agents’ parameters must be set correctly. In this case study, the movement speeds for the different agent profiles in Pathfinder were set sequentially according to different sources. First, the minimum and maximum velocity values were set between 0.6 m/s and 1.8 m/s [
13] with a normal distribution. The minimum and maximum velocity values were then set between 0.37 m/s and 1.85 m/s [
14]. Finally, the minimum and maximum velocity values were set between 0.409 m/s and 1.610 m/s [
15].
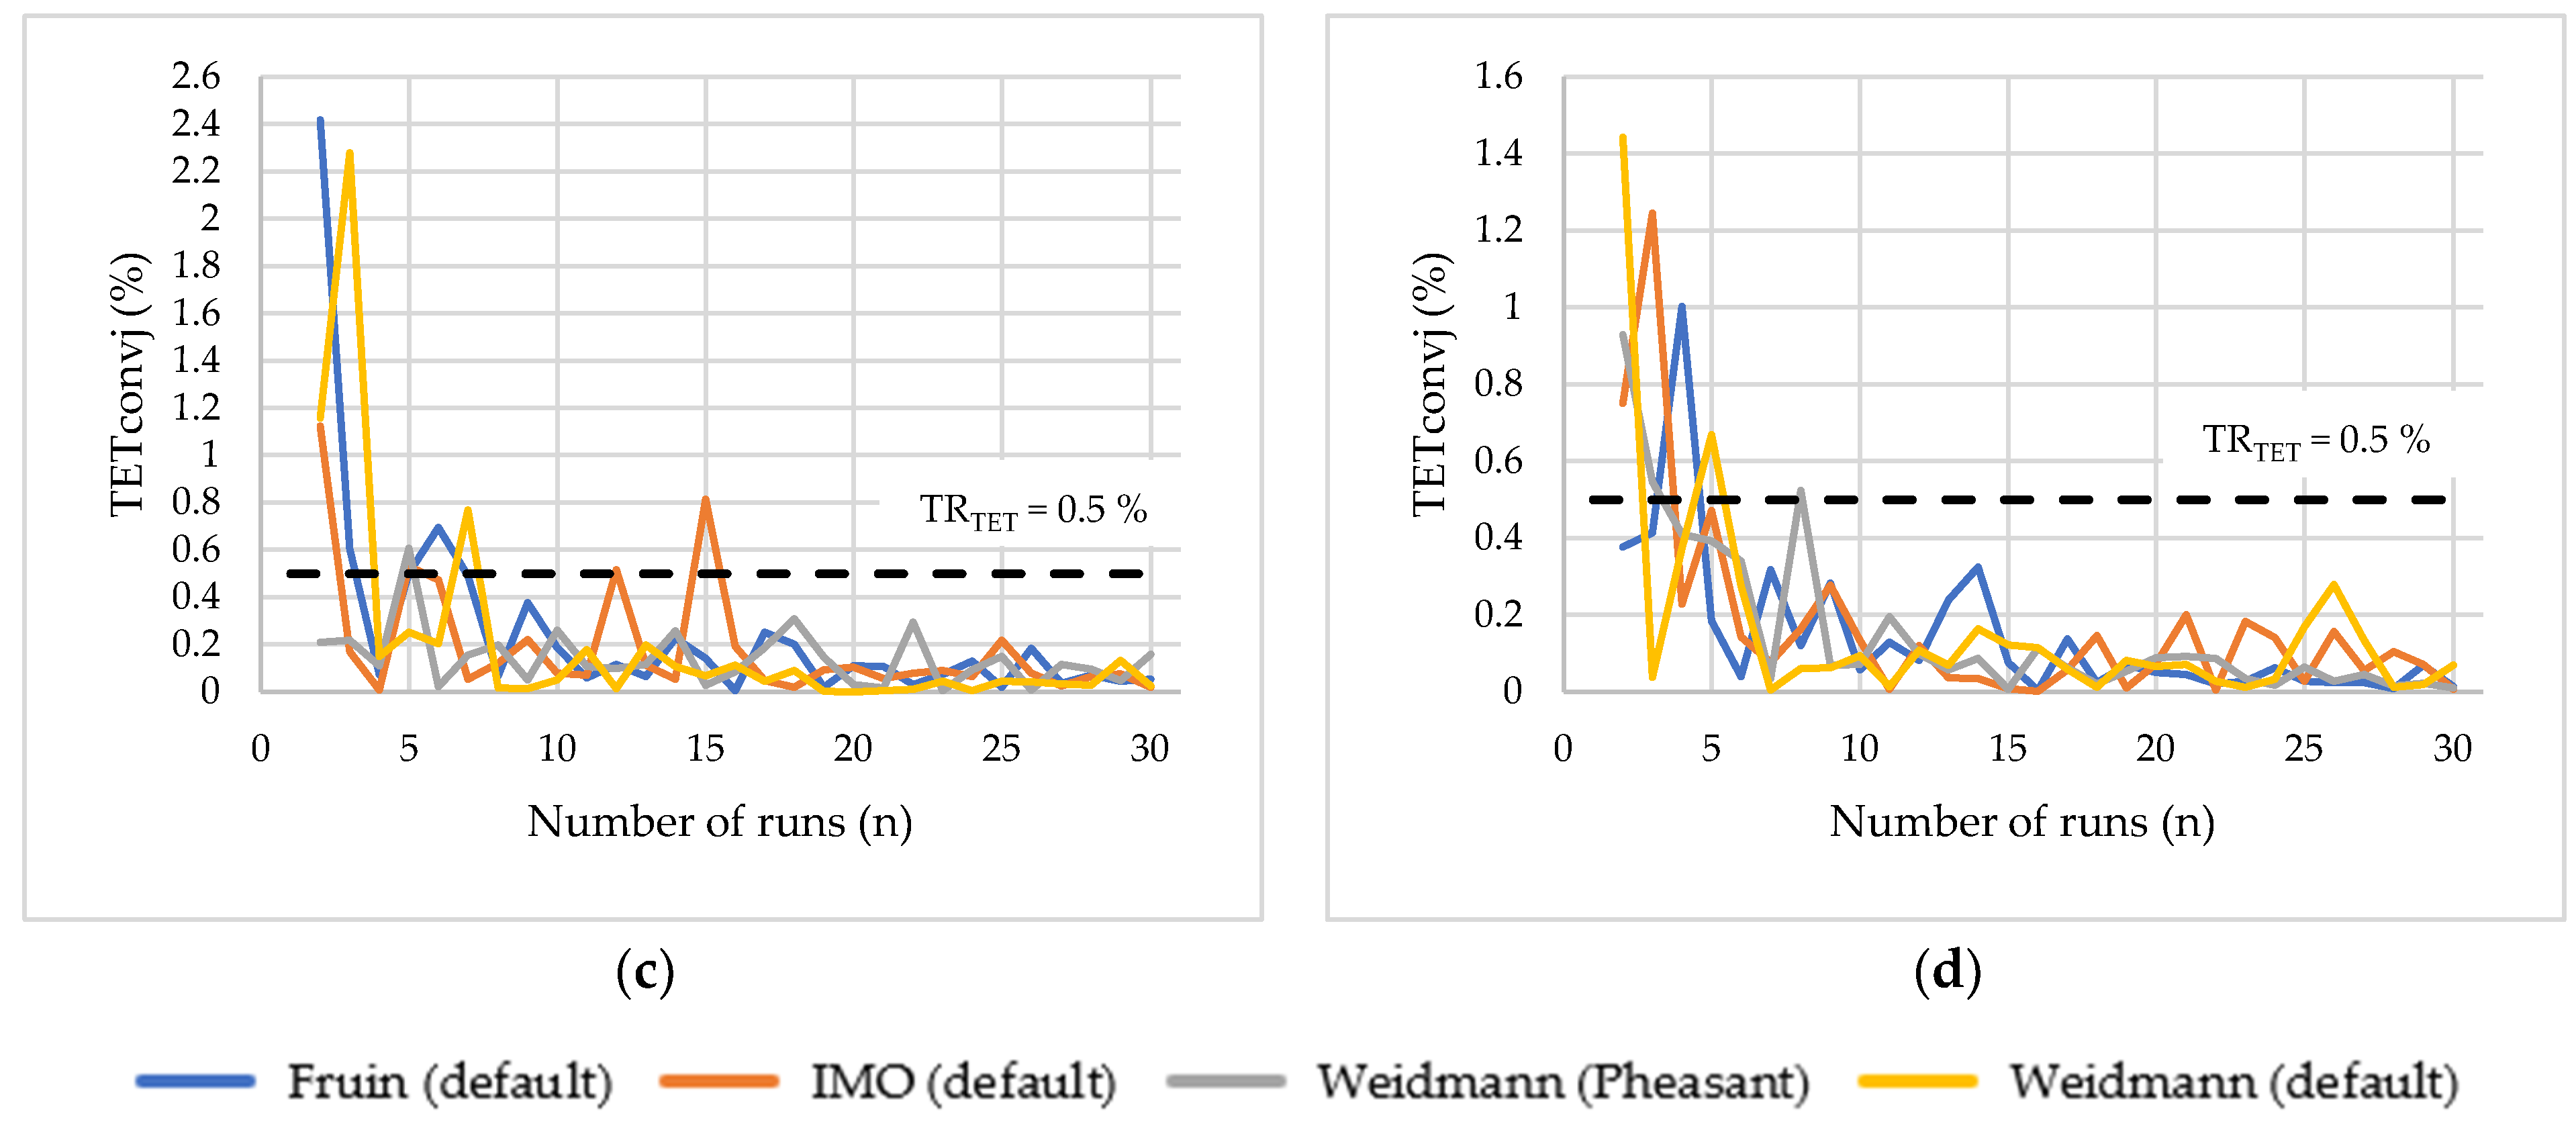
As part of this study, a convergence rate analysis of the total evacuation time (TET) of people was carried out. The method based on the search for convergence is shown in the graphs in
Figure 5. The best results were achieved in Scenario 1A. After five runs, the deviation of the average evacuation time did not exceed 0.5%. In Scenario 1B, the deviation fell below the TR
TET 0.5% after the twelfth run. When comparing Scenarios 2A and 2B, better results were obtained in Scenario 2B in which the deviation of the average evacuation time exceeded 0.5% for the last time in the eighth run and then stayed below this value. For Scenario 2A, the deviation fell to below 0.5% after the fifteenth run. Convergence is thus demonstrated.
The Monte Carlo method was used to analyse four scenarios: (i) Scenarios 1A and 1B—a hockey match and (ii) Scenarios 2A and 2B—a concert. Scenarios 1A and 2A were left with the original preferences for door selection, while Scenarios 1B and 2B had modified preferences. For the hockey match, it was assumed that approximately half of the visitors would be familiar with the space of the multipurpose hall. For the concert, it was assumed that they would be unfamiliar with the space. Scenarios 1B and 2B, which involved adding time before evacuation and changing preferences for door selection, can be assumed to provide a more realistic picture of the evacuation of people from the multipurpose hall.
The evacuation time curves show the time at which all agents leave the multipurpose hall. Analysis of these curves shows that there were no sudden changes during evacuation in any of the scenarios. From the curves, it can be seen that, when the speed of movement is set according to IMO [
14] in each scenario, the evacuation time compared to the speed of movement according to Fruin [
13] or Weidmann [
15] was the longest. It is also evident from these curves that the change in shoulder width (people’s dimensions) did not have a significant effect on the evacuation process or the total time of evacuation of people.
Space usage maps are a useful tool for monitoring and verifying human behaviour in a model. These maps show that, within the study area, people are the most likely to gather and move around during evacuation on the individual stairs leading from the grandstands, the stairs connecting the grandstands and the lobby, the corridors leading to the lobby, and at the individual exits from the multipurpose hall. These findings are particularly important in the first stages of the evacuation process. Space usage maps, together with time curves, provide valuable information that helps to create an optimal evacuation plan.
5. Conclusions
This paper introduces an innovative approach that uses a probabilistic model, the Monte Carlo method, to analyse iterative evacuation processes. This approach combines the application of a simulation tool and data analysis using a probabilistic model, specifically the Monte Carlo method. It is not a modification or improvement of Pathfinder software version 2023.3 or the Monte Carlo method. This approach has been applied to a specific example of a multipurpose hall. The evacuation of people was analysed for two configurations: a hockey match with a capacity of 9500 people and a concert with a capacity of 11,000 people. Individual simulations of the evacuation of people were performed using the Pathfinder software version 2023.3, which can predict human behaviour during the evacuation of the object. To make the behaviour of the simulated agent as close as possible to the actual behaviour, increased attention to detail was required for each agent.
The research focused on evaluating the change in evacuation time when the speed of movement was set according to different sources and on the effect of changing preferences for door selection on evacuation time. To properly evaluate the effect of changes on evacuation time, we performed a convergence rate of iterations for the simulations. This ensured that the simulations were repeated until the results were acceptable.
The evacuation of people is a random process, as is the behaviour of people or their placement. Therefore, it is important to perform several iterations and determine the number that is statistically significant. In this study, the number of iterations for each scenario was evaluated based on a convergence rate that was acceptable for a total of 30 iterations for each scenario.
The abovementioned approach to the analysis of the evacuation processes appears to be a suitable tool for the effective planning of the safety of people during evacuation from multipurpose halls and other similar multipurpose venues. The effective use of this approach involves analysing different evacuation scenarios and selecting the most appropriate evacuation options for the given conditions. Thanks to the simulations in Pathfinder, it is possible to present a complex evacuation process, highlight critical locations in terms of people density (in the section on analysing space usage maps), and examine the layout configuration of space when organising different mass events (e.g., space limitations when creating a rescue corridor). The Monte Carlo method enables the generation of several iterations of a defined scenario. These iterations make it possible to study the variability in the evacuation of people. These are mainly due to the change in the position of the agents but may also be due to the change in the profiles of the people (speed of movement, size, etc.).
This study focused only on the application of the Monte Carlo method in combination with the Pathfinder simulation tool to a selected area of a multipurpose hall. Other methods that could be used to analyse the evacuation of people were not considered. Further research could focus on a comparative analysis of other approaches to evaluate the evacuation of people and identify their advantages and disadvantages.
Author Contributions
Conceptualisation, A.S. and P.K.; Methodology, A.S. and P.K.; Software, A.S. and P.K.; Validation, A.S. and P.K.; Formal Analysis, A.S. and P.K.; Investigation, A.S. and P.K.; Resources, A.S.; Data Curation, A.S.; Writing—Original Draft Preparation, A.S. and P.K.; Writing—Review and Editing, A.S. and P.K.; Visualisation, A.S.; Supervision, P.K. and A.B.; Project Administration, P.K., A.B. and J.P. All authors have read and agreed to the published version of the manuscript.
Funding
This article has been produced with the financial support of the European Union under the REFRESH—Research Excellence For REgion Sustainability and High-tech Industries project number CZ.10.03.01/00/22_003/0000048 via the Operational Programme Just Transition.
Institutional Review Board Statement:
Not applicable.
Informed Consent Statement:
Not applicable.
Data Availability Statement
The data presented in this study are available on request from the corresponding author due to privacy restrictions.
Conflicts of Interest
The authors declare no conflicts of interest.
References
- Decker, K.M. The Monte Carlo method in science and engineering: Theory and application. Comput. Methods Appl. Mech. Eng. 1991, 89, 463–483. [Google Scholar] [CrossRef]
- Phillips, W.G.B.; Fahy, R.F.; Beller, D.K. Computer Simulation for Fire Risk Analysis. In SFPE Handbook of Fire Protection Engineering, 5th ed.; Hurley, M.J., Ed.; Springer: New York, NY, USA, 2016; pp. 3117–3136. [Google Scholar] [CrossRef]
- Ternero, R.; Sepúlveda, J.; Alfaro, M.; Fuertes, G.; Vargas, M.; Sepúlveda-Rojas, J.P.; Soto-Jancidakis, L. Analysis of Pedestrian Behavior for the Optimization of Evacuation Plans in Tall Buildings: Case Study Santiago, Chile. Buildings 2023, 13, 2907. [Google Scholar] [CrossRef]
- Li, W.; Zhu, J.; Li, H.; Wu, Q.; Zhang, L. A Game Theory Based on Monte Carlo Analysis for Optimizing Evacuation Routing in Complex Scenes. Math. Probl. Eng. 2015, 2015, 292093. [Google Scholar] [CrossRef]
- Tamang, N.; Sun, Y. Application of the dynamic Monte Carlo method to pedestrian evacuation dynamics. Appl. Math. Comput. 2023, 445, 127876. [Google Scholar] [CrossRef]
- Shariff, G.N.; Yong, J.C.E.; Salleh, N.; Siow, C.L. Risk Assessment of Building Fire Evacuation with Stochastic Obstructed Emergency Exit. In Proceedings of the 4th International Conference and Workshops on Recent Advances and Innovations in Engineering (ICRAIE), Kedah, Malaysia, 27–29 November 2019; pp. 1–5. [Google Scholar] [CrossRef]
- Xie, Q.; Wang, J.; Lu, S.; Hensen, J.L.M. An optimization method for the distance between exits of buildings considering uncertainties based on arbitrary polynomial chaos expansion. Reliab. Eng. Syst. Saf. 2016, 154, 188–196. [Google Scholar] [CrossRef]
- Chen, H.; Mao, Z. Study on the Failure Probability of Occupant Evacuation with the Method of Monte Carlo Sampling. Procedia Eng. 2018, 211, 55–62. [Google Scholar] [CrossRef]
- Bing, Z. Application of Mathematical Model of Evacuation for Large Stadium Building. Res. J. Appl. Sci. Eng. Technol. 2013, 5, 1432–1440. [Google Scholar] [CrossRef]
- Chin, K.; Young, T.; Chorlton, B.; Aucoin, D.; Gales, J. Crowd behaviour in Canadian football stadia—Part 2: Modelling. Can. J. Civ. Eng. 2022, 49, 1263–1271. [Google Scholar] [CrossRef]
- Gravit, M.; Kirik, E.; Savchenko, E.; Vitova, T.; Shabunina, D. Simulation of Evacuation from Stadiums and Entertainment Arenas of Different Epochs on the Example of the Roman Colosseum and the Gazprom Arena. Fire 2022, 5, 20. [Google Scholar] [CrossRef]
- Minegishi, Y. Tracer observation of egress and way-home crowd behavior at stadiums: From the perspective of crowd control in emergency evacuations. Jpn. Archit. Rev. 2023, 6, e12358. [Google Scholar] [CrossRef]
- Fruin, J.J. Pedestrian Planning and Design; Elevator World, Inc.: Mobile, AL, USA, 1971. [Google Scholar]
- The Maritime Safety Committee. MSC.1/Circ.1533: Revised Guidelines on Evacuation Analysis for New and Existing Passenger Ships; International Maritime Organization IMO: London, UK, 2016. [Google Scholar]
- Weidmann, U. Transporttechnik der Fussgänger: Transporttechnische Eigenschaften des Fussgängerverkehrs, Literaturauswertung; Institut für Verkehrsplanung, Transporttechnik, Strassen-und Eisenbahnbau (IVT), ETH Zürich: Zürich, Switzerland, 1993. [Google Scholar]
- Pathfinder׀Thunderhead Engineering. Available online: https://www.thunderheadeng.com/pathfinder (accessed on 25 March 2024).
- Ronchi, E.; Nilsson, D. Fire evacuation in high-rise buildings: A review of human behaviour and modelling research. Fire Sci. Rev. 2023, 2, 7. [Google Scholar] [CrossRef]
- Ronchi, E.; Uriz, F.N.; Criel, X.; Reilly, P. Modelling large-scale evacuation of music festivals. Case Stud. Fire Saf. 2016, 5, 11–19. [Google Scholar] [CrossRef]
- Capote, J.; Alvear, D.; Abreu, O.; Cuesta, A.; Alonso, V. A Stochastic Approach for Simulating Human Behaviour During Evacuation Process in Passenger Trains. Fire Technol. 2012, 48, 911–925. [Google Scholar] [CrossRef]
- Pheasant, S.; Haslegrave, C.M. Bodyspace: Anthropometry, Ergonomics, and the Design of Work, 3rd ed.; Taylor & Francis: Bristol, UK, 2006. [Google Scholar]
- Zdařilová, R. Barrier–free Use of Buildings: Methodology to Decree No. 398/2009 Coll., on General Technical Requirements Ensuring Barrier–Free Use of Buildings, 1st ed.; ČKAIT [Czech Chamber of Chartered Engineers and Technicians in Construction]: Prague, Czech Republic, 2011; p. 196. ISBN 978-80-87438-17-6. [Google Scholar]
- Gwynne, S.M.V.; Boyce, K.E. Engineering Data. In SFPE Handbook of Fire Protection Engineering, 5th ed.; Hurley, M.J., Ed.; Springer: New York, NY, USA, 2016; pp. 2429–2551. [Google Scholar] [CrossRef]
- Ronchi, E.; Reneke, P.A.; Peacock, R.D. A method for the Analysis of Behavioural Uncertainty in Evacuation Modelling. Fire Technol. 2014, 50, 1545–1571. [Google Scholar] [CrossRef]
| Disclaimer/Publisher’s Note: The statements, opinions and data contained in all publications are solely those of the individual author(s) and contributor(s) and not of MDPI and/or the editor(s). MDPI and/or the editor(s) disclaim responsibility for any injury to people or property resulting from any ideas, methods, instructions or products referred to in the content. |
© 2024 by the authors. Licensee MDPI, Basel, Switzerland. This article is an open access article distributed under the terms and conditions of the Creative Commons Attribution (CC BY) license (https://creativecommons.org/licenses/by/4.0/).


