1. Introduction
Strong volcanic activity may lead to the fall of incandescent pyroclastic material that can start fires on the volcano flanks. Fires are hazardous by nature, but in volcanology they belong to the so-called secondary hazards, mainly related to the destruction of vegetation that may promote the formation of floods in case of rain [
1].
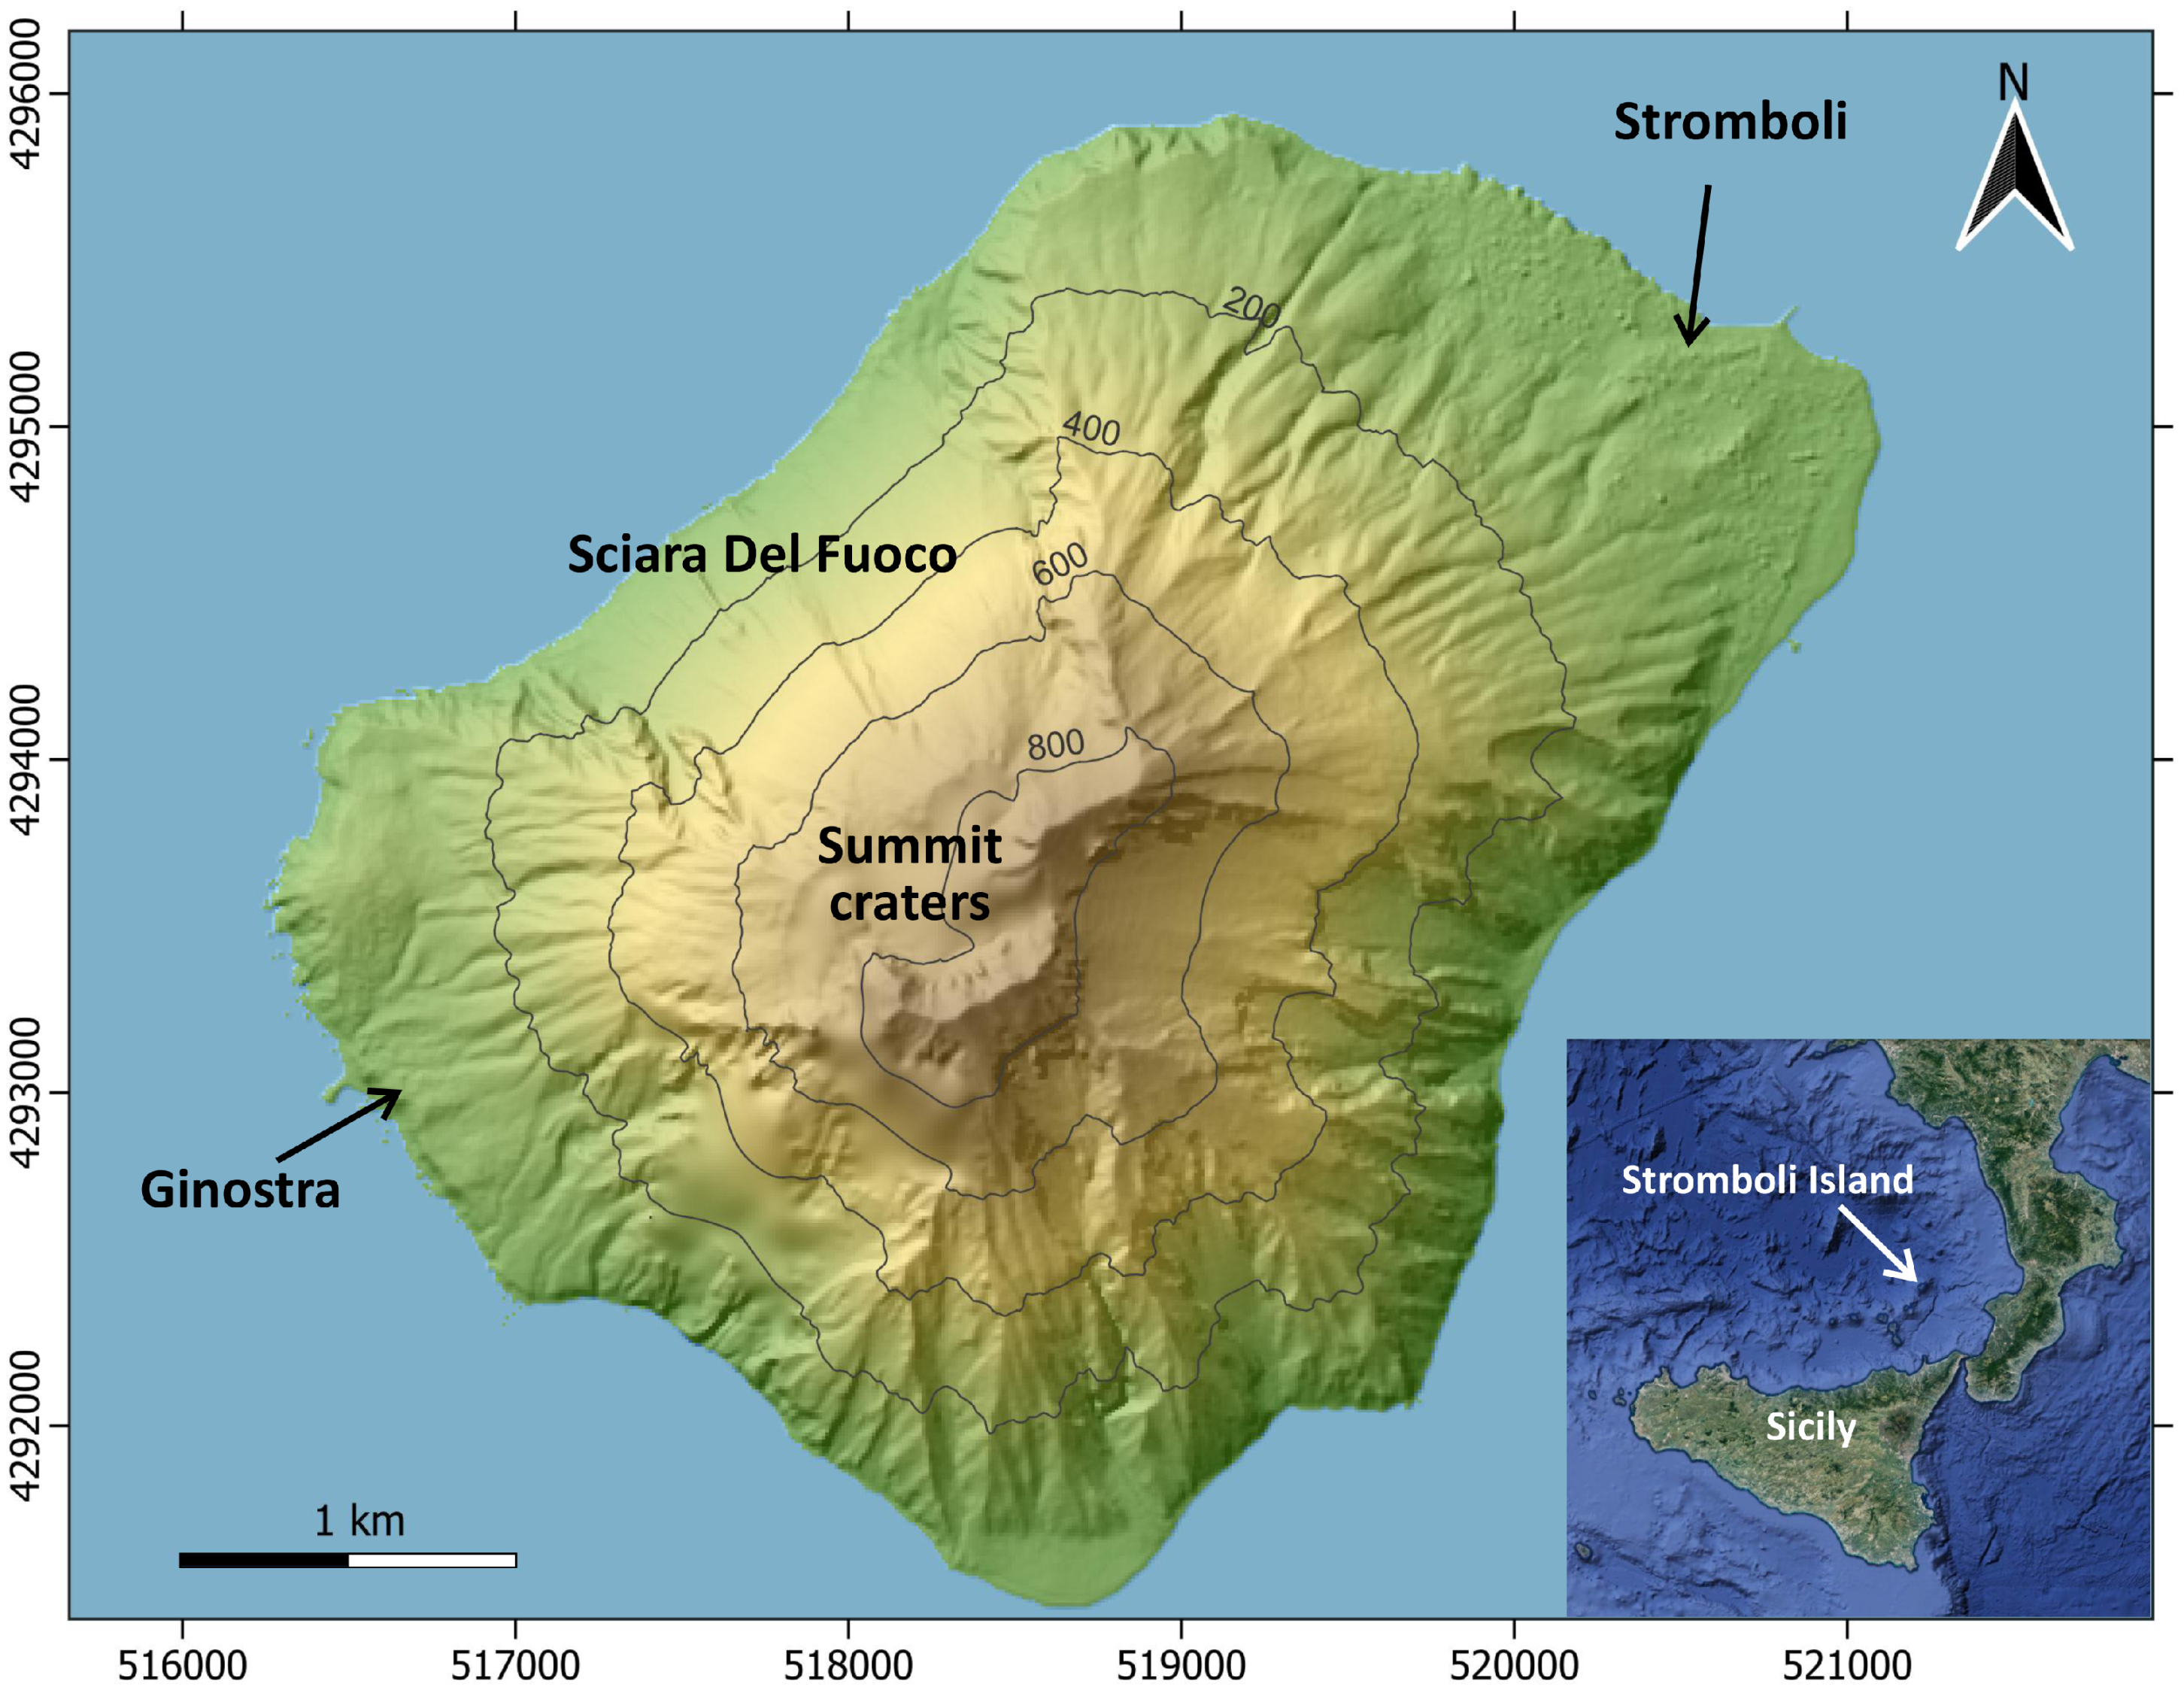
In recent years, Stromboli volcano (
Figure 1) has seen a growing number of fires, caused both by anthropogenic [
2] and volcanic activity [
3,
4]. While anthropogenic fires develop faster and hotter [
5], volcano-induced fires can increase fatalities due to both the great distance at which they can be ignited [
3,
4] and the destruction of vegetation along the flank of the volcano, which can strongly increase the possibility of floods, as occurred on Stromboli Island after the fire triggered by the 3 July 2019 eruption [
1].
Fire-spread models have been investigated since the late 1960s [
6,
7,
8,
9]. These models have proven to be fundamental for the analysis and management of fires in both forested and wildland–urban interface areas [
10,
11,
12,
13,
14]. Over the last decades, several models have been developed, distinguished by their complexity, computational costs, and types of input parameters. According to [
15], fire-spreading models can be classified by the approach used for propagation, and the balance they strike between completeness of the physics and computational load. Common propagation approaches include cellular automata, envelope models, semi-empirical models, and physical models. The more comprehensive full-physics-based models [
16,
17] are also computationally expensive (e.g., with representation of vegetation on the mesoscale as a porous medium and/or using balancing of the energy/heat equation), while others prefer a simplified physical model to achieve faster computations, for example solving 2D reaction/diffusion equations [
15,
18], or using even less physics, such as in estimate-based models using graphs [
19], cellular automata [
20,
21,
22,
23] or envelope-based approaches [
24].
Among the numerical models for simulating the propagation of wildfires, ignition mechanisms that utilise various input parameters are taken into consideration, including different types of trees, canopies, and the influence of wind [
25], moisture content, radiant capacity [
26], and/or topography [
27]. The integration of these models into GIS environments allows for both soil classification (zoning for susceptibility, hazard, and exposure estimation), considering the presence of vegetation and/or infrastructures [
10,
22], and the possibility of mapping burnt areas using satellite data [
28].
Models that use cellular automata [
29] and/or machine learning [
22,
23] have also gained popularity in recent years, with the aim of building an effective landscape network or simulating the spread of fires based on meteorological factors.
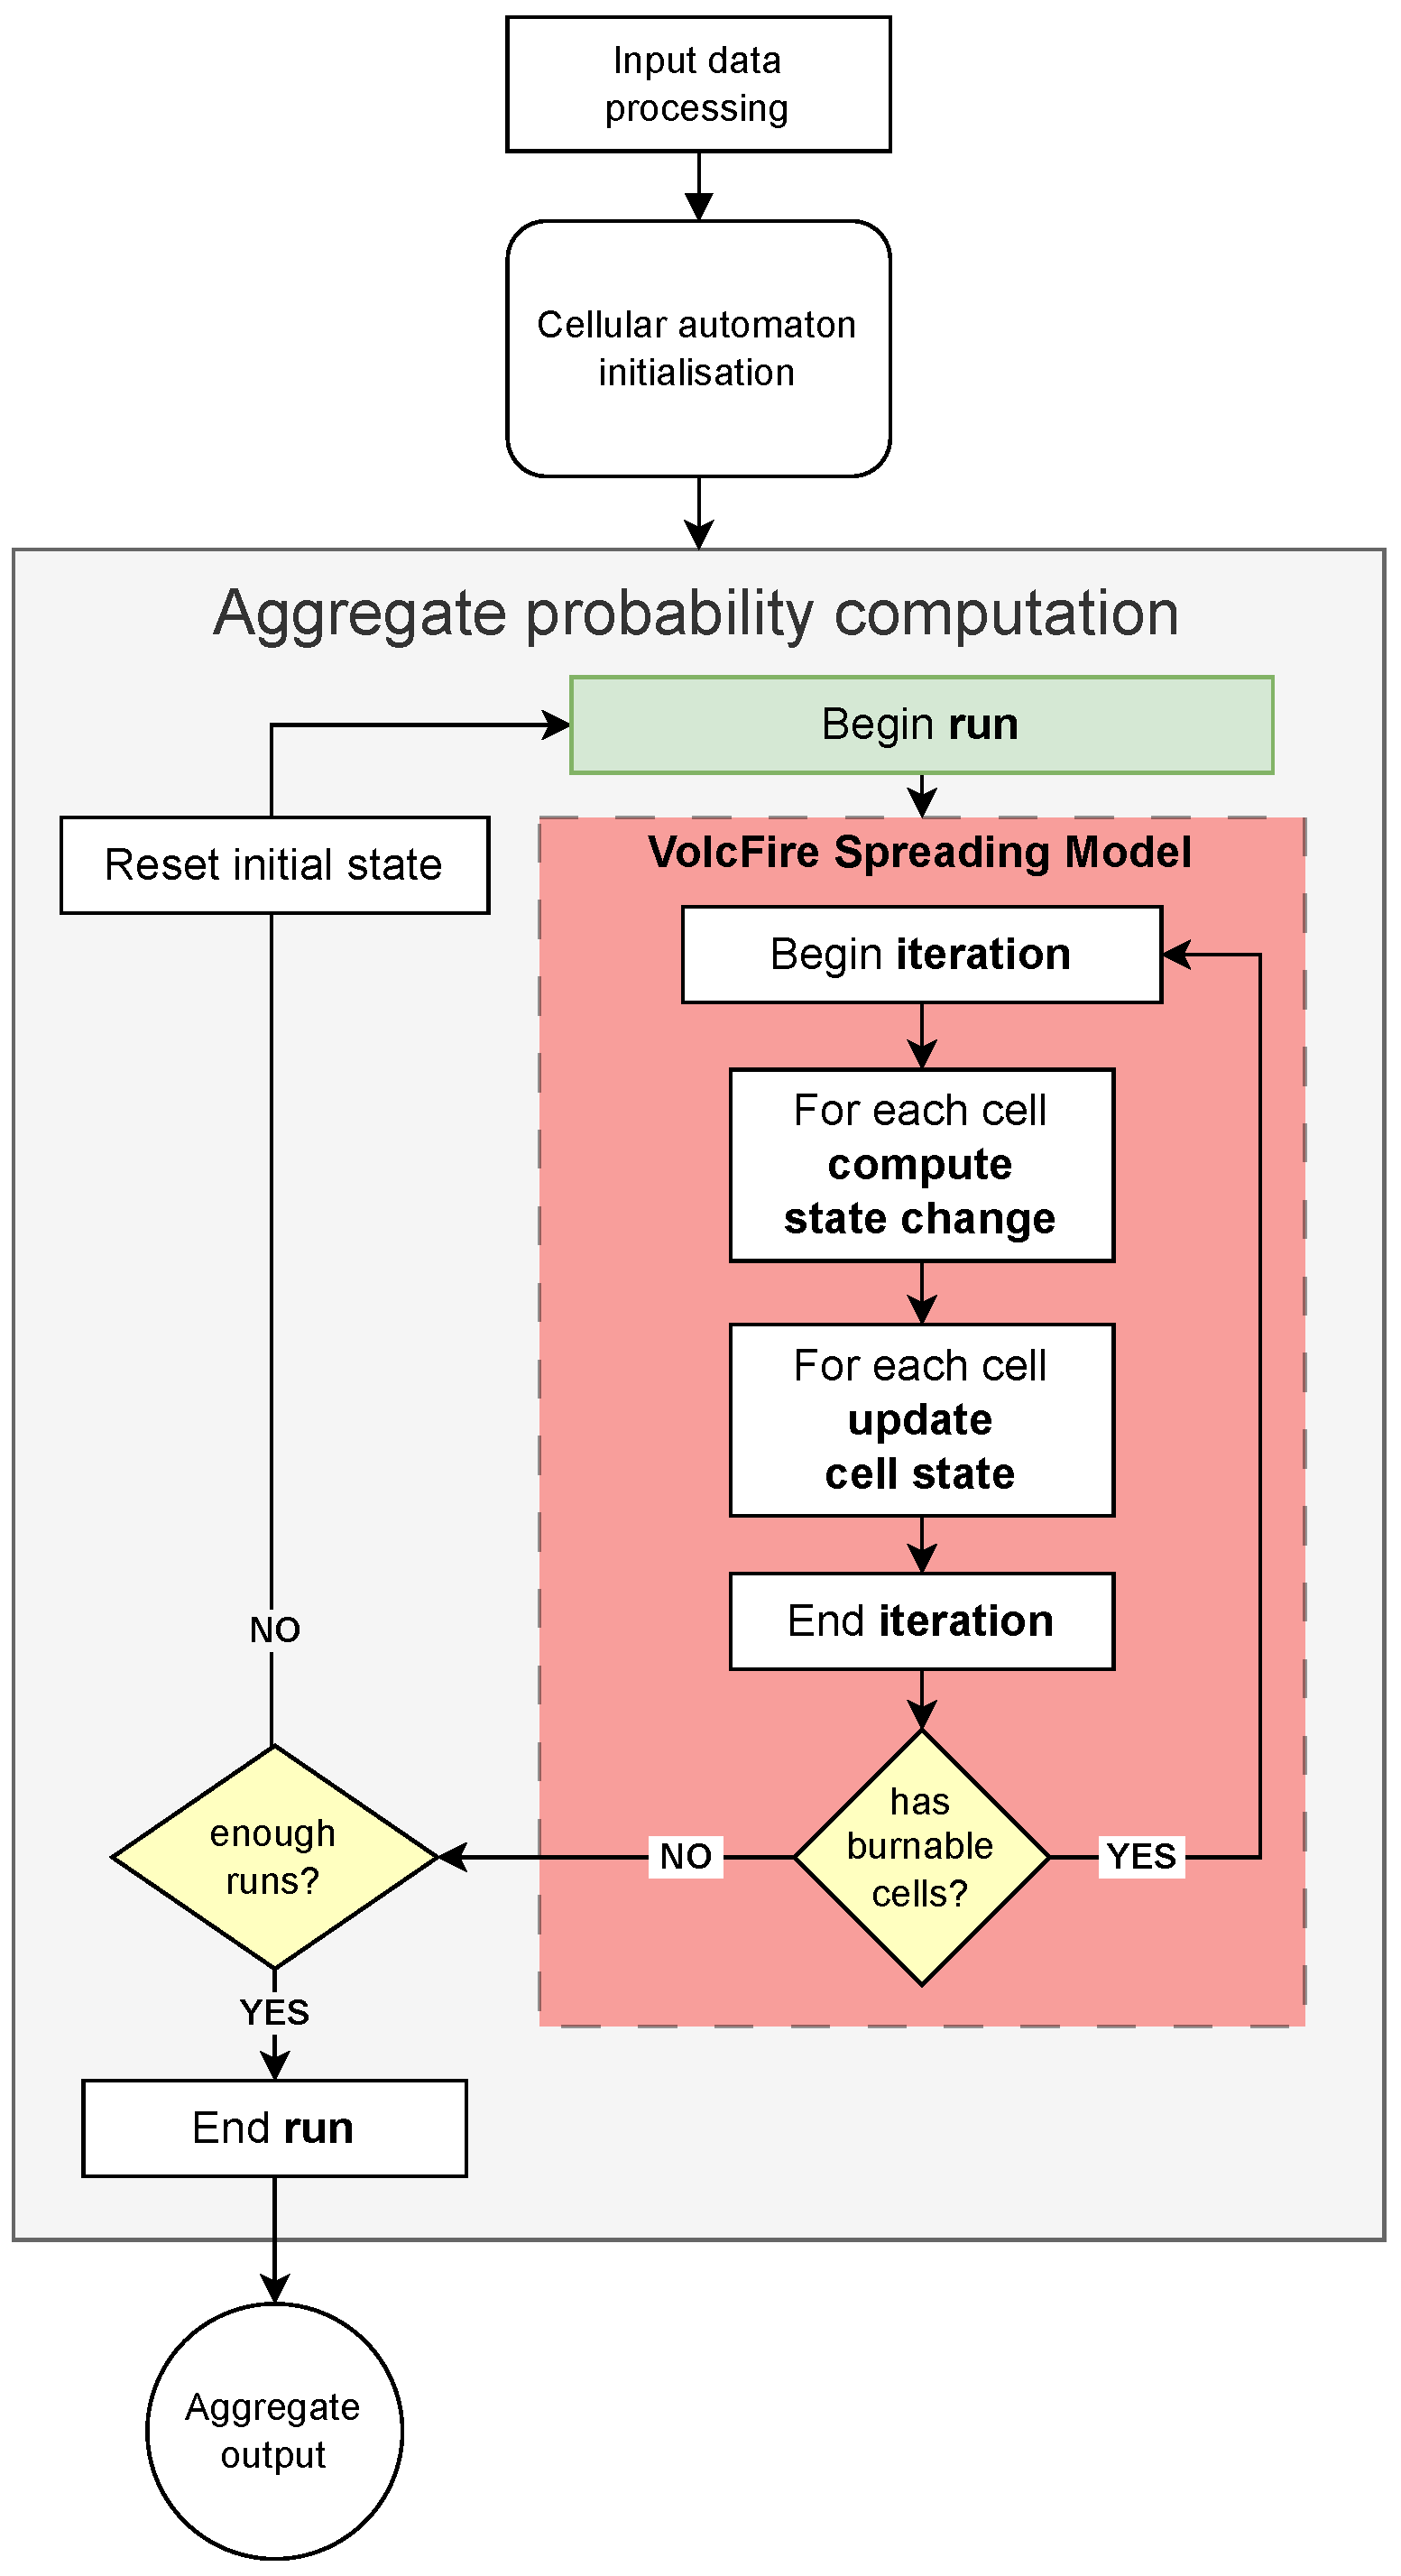
To the authors’ knowledge, there is no fire propagation model designed for the assessment of volcanic-induced fire hazards. The aim of our work is to fill this gap, presenting a new probabilistic cellular automaton fire-propagation model, called VolcFire, specifically aimed at the creation of hazard maps for fires of volcanic origin. The model takes as input parameters the digital surface model, the wind direction and intensity, the vegetation, the land use, and the ignition cells and returns hazard scenarios estimated from multiple probabilistic runs (
Figure 2). Several assumptions and simplifications have been made to reduce the computational load, while maintaining sufficient accuracy in the fire propagation, since our primary goal is the use of VolcFire to produce hazard maps rather than the simulation of individual scenarios.
The fire-propagation law used in VolcFire has been validated against two test cases, the 3 July 2019 volcanic fire and the 25 May 2022 anthropogenic fire on Stromboli island, with good fits between the simulated and actual burnt areas, excluding firefighting interventions, both by the local inhabitants and from civil protection services.
2. Materials and Methods
Fire-spreading cellular automata (CA) models [
9,
20,
25,
30] are based on a square lattice (representing the burnable area) on which each node (cell) can be in one of several states. Common choices include three-state CA models, with normal/unburnt, burning, and completely burnt cell states [
15], and five-state CA models (unburnt, ignited, fully developed, extinguishing, and completely burnt) [
21]. This kind of simulation is usually controlled by the rate of fire spread (ROS) [
31], and a probabilistic or stochastic law that determines the cell state at each step, based on the neighbour cell condition [
15].
For Volcfire, we have opted for a three-state model, augmented by a fourth (invariant) unburnable state for cells covering the sea and the Sciara del Fuoco. The input data, initialisation of the CA, spreading model, final output, and validation method are described in the following subsections.
2.1. Input Data
The input data of VolcFire are the topography, land use, vegetation load and humidity, wind direction and intensity, and the initial ignition cell(s).
The topographic information is provided through a Digital Surface Model (DSM), which is a raster grid of the Earth’s surface height, including natural and human-made structures. The information about the elevation or height of each cell is used in the VolcFire spreading model to compute the slope between adjacent cells. For this work, we used a DSM of Stromboli island with a spatial resolution of 10 m, derived from Pléiades satellite data using the MicMac code [
32].
Stromboli’s land use has been mapped using Skysat satellites, which is a constellation of 21 commercial on-demand satellites performing acquisitions at submetric spatial resolution. Thanks to a procedure based on the “Random Forest” supervised learning algorithm implemented using the Google Earth Engine platform, we identified five classes: sea, bare soil (i.e., the Sciara del Fuoco), vegetated areas, burned or parched areas, and human infrastructures.
The vegetation load and humidity are derived from Sentinel-2 imagery, using the Normalized Difference Vegetation Index (NDVI) and the Normalized Difference Moisture Index (NDMI), respectively. NDVI quantifies the health and density of vegetation, and is computed as
while NDMI detects its moisture levels and is computed as
In the above formulas, B4, B8, and B11 are the Sentinel-2 bands whose properties are summarised in
Table 1. Due to the difference in resolution, B11 is interpolated to a 10 m resolution by constant interpolation.
Information about the wind direction and strength is assumed to be constant during each simulation, and given as input by the user. In the test cases presented here, this information was taken from data provided by the media and found on [
33].
Finally, the ignition cell(s) indicate the cells from which the fire starts and spreads. These are also given as input by the user, in latitude/longitude for each ignition cell.
2.2. CA Initialisation
The model implementation starts by importing the DSM and land-use map as raster grid data. These define the computational region and cell resolution for the automaton. Sentinel-2 data, specified as a command-line parameter, are then loaded with GDAL, which is a translator library for raster and vector geospatial data formats [
34]. The satellite imagery is cropped to the computational region, and the NDVI and NDMI indices are computed for each cell, clipping to 0 for invalid data and negative values, since we are only interested in the cells where these indices are positive.
Each cell of the CA is then initialised to either the unburnt or unburnable state, based on a combination of the topographic information, land use, NDVI, and NDMI, as detailed below.
Topographic information is used to distinguish land and sea cells, with sea cells set to unburnable, while land use is used as a first step to recognise the bare soil cells, especially those belonging to Stromboli’s Sciara del Fuoco, which are also set to unburnable.
According to [
35], humidity should be lower than 83% to allow fire to develop. During the validation of our model, we found that an NDMI threshold of 0.4 (corresponding to the lower bound of high canopy cover with no water stress, according to EOS [
36]) represents a good approximation of this criterion: therefore, all cells with a NDMI value higher than 0.4 are also marked unburnable. We remark that this criterion is seasonal, in contrast to the filtering based on land use.
We also consider a lower boundary of 0.33 on NDVI, on the assumption that lower values represent areas with not enough fuel. Cells with NDVI lower than 0.33 are therefore also unburnable for the model. In the test cases discussed in this paper, there is a sizeable overlap in the filtering performed by the land-use map and the NDVI threshold. In fact, with a clear sky, the bare soil filtered from the land use constitutes a strict subset of the cells filtered by low NDVI: the land use is still necessary because it is not affected by clouds, which may otherwise influence the NDVI thresholding.
All other cells start in the unburnt state, except for the starting ignition cell(s) that are set to the burning state. After this initialisation, the fire-spreading iteration is started.
2.3. VolcFire Spreading Model
At each iteration, the automaton computes the state change for each cell:
unburnable or burnt cells remain in the same state;
burning cells become burnt;
burnable cells compute an ignition probability based on their properties and the neighboring cells’ states, and randomly change to the burning state if their ignition probability is not null, as detailed below.
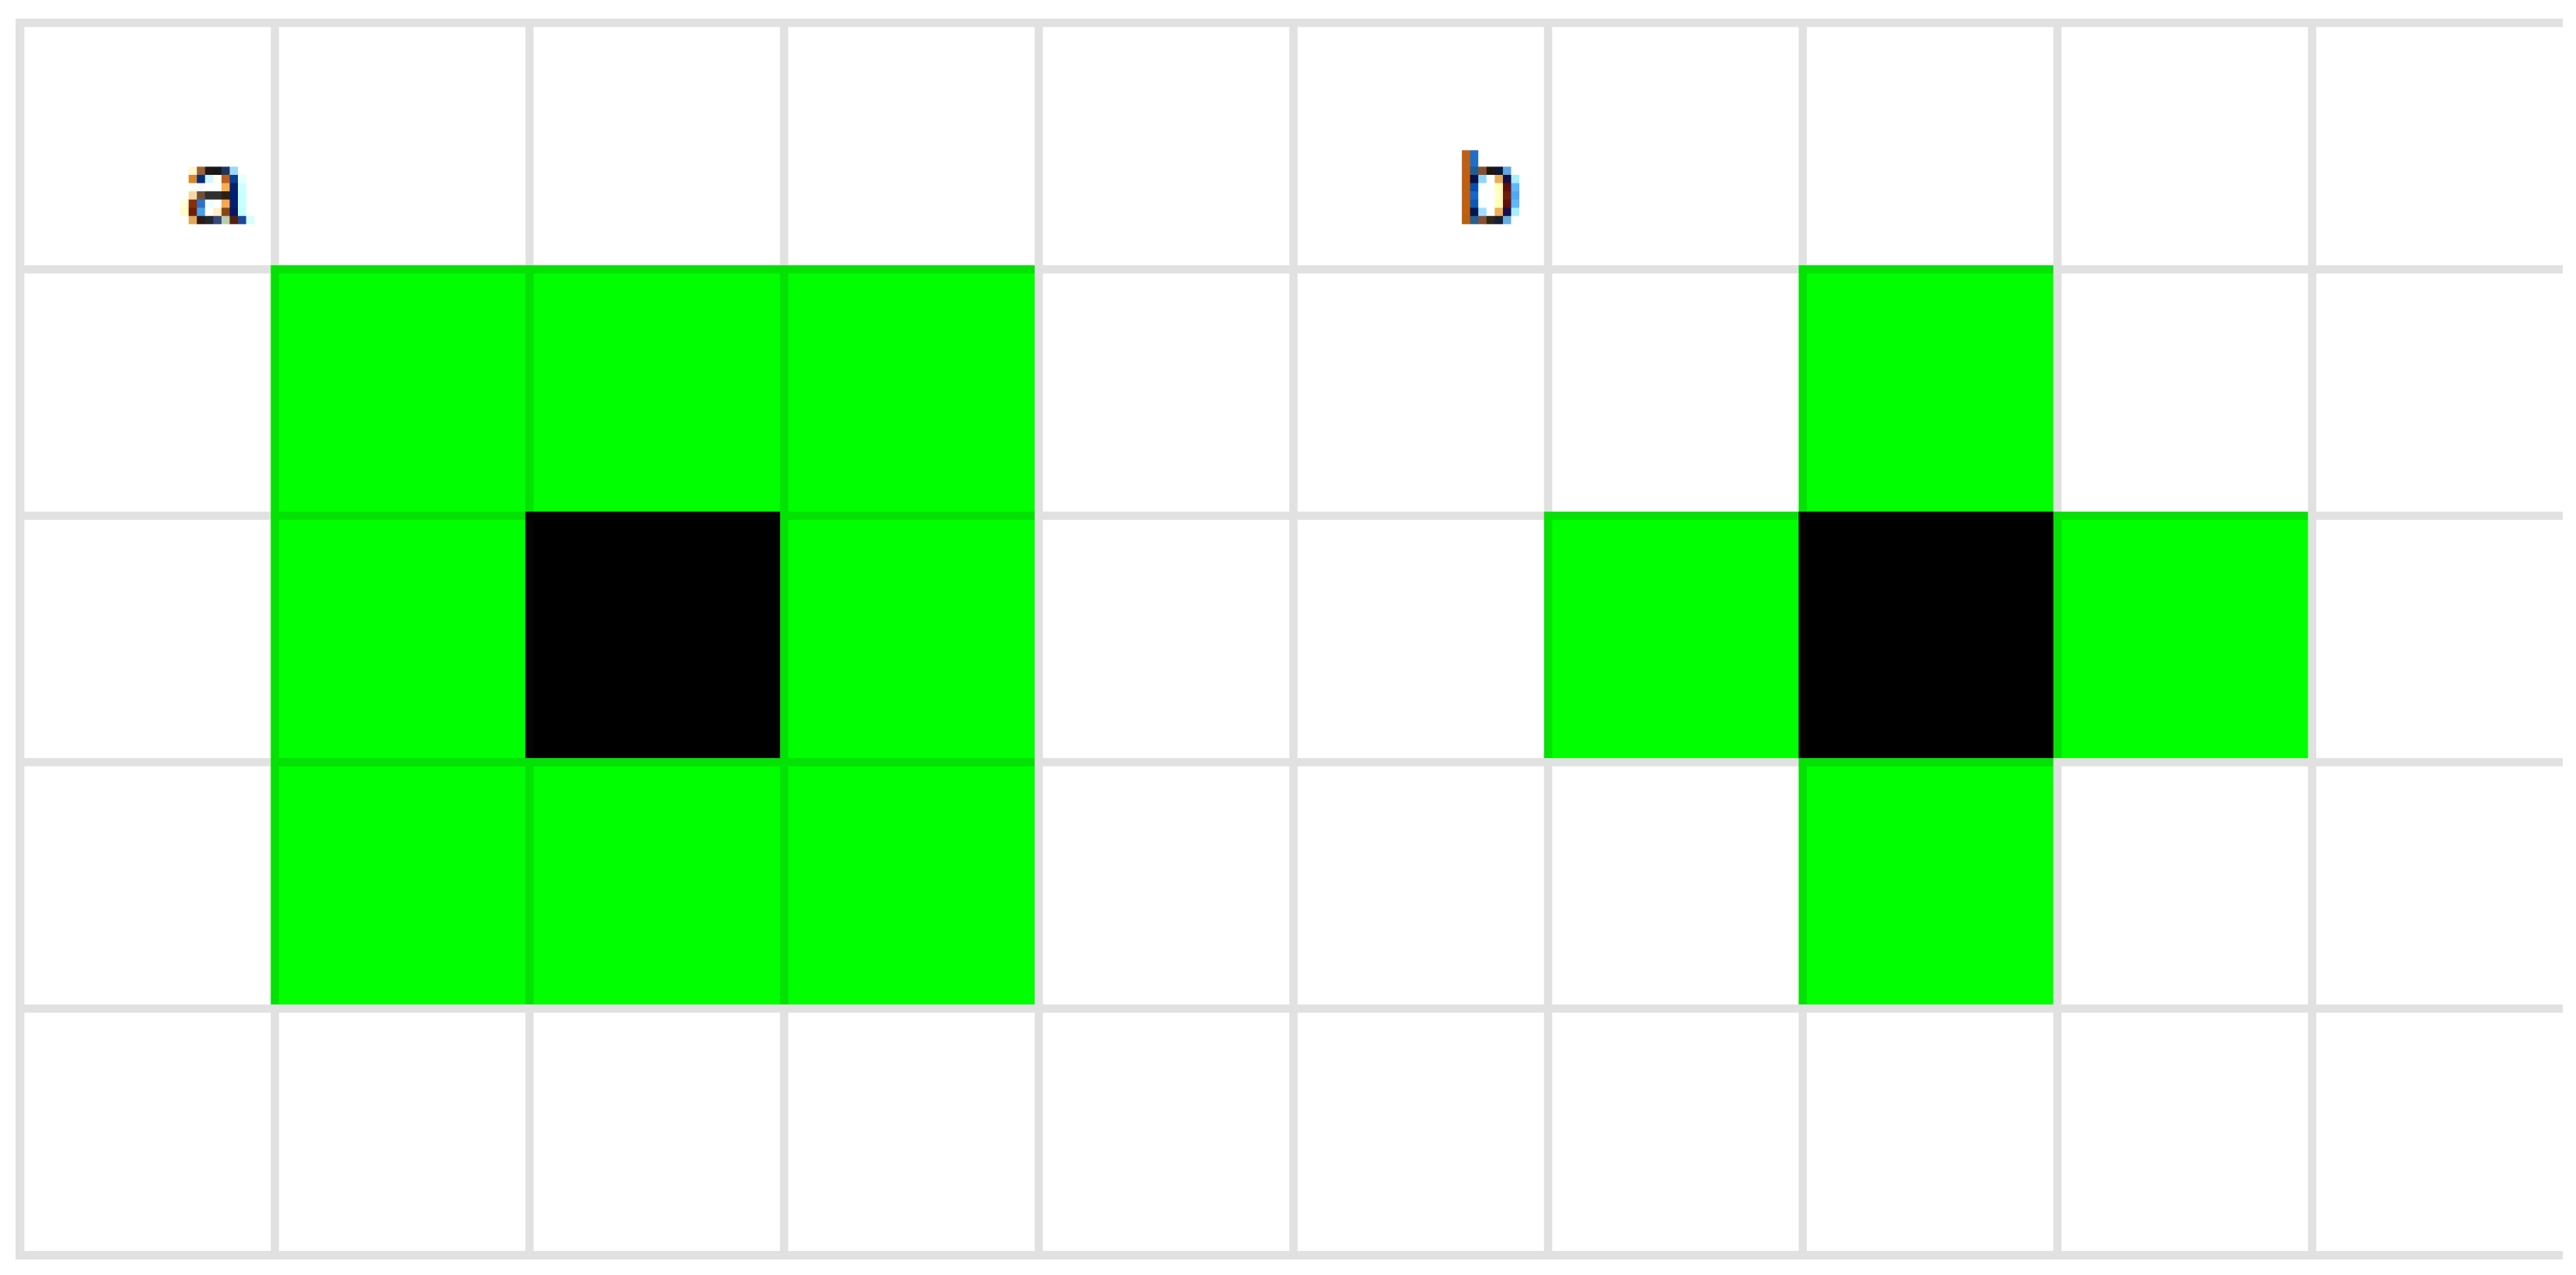
The automaton supports both Von Neumann and Moore [
37] neighborhoods, whose structures are shown in
Figure 3.
In our experiments, the full Moore neighborhood gives the best results, provided that the diagonal neighbors are handled appropriately.
The ignition probability of each burnable cell is estimated as:
where
is the base ignition probability,
is the moisture contribution, and
and
are factors depending on wind and slope, respectively.
In the VolcFire model,
is equal to the NDVI value and
is derived from the NDMI value as follows:
The slope factor
is computed from the slope between each cell and its neighbor as follows:
where
is the DSM height difference,
the DSM resolution, and
is a neighbor correction factor, equal to 1 for neighbors along a principal axis (Von Neumann neighbors) and
for diagonal neighbors. The slope is clipped to the
range and normalised to the
range to obtain the normalised slope
before computation of the slope coefficient:
where
is the sign function applied to
and
is the 5th order smooth-step function
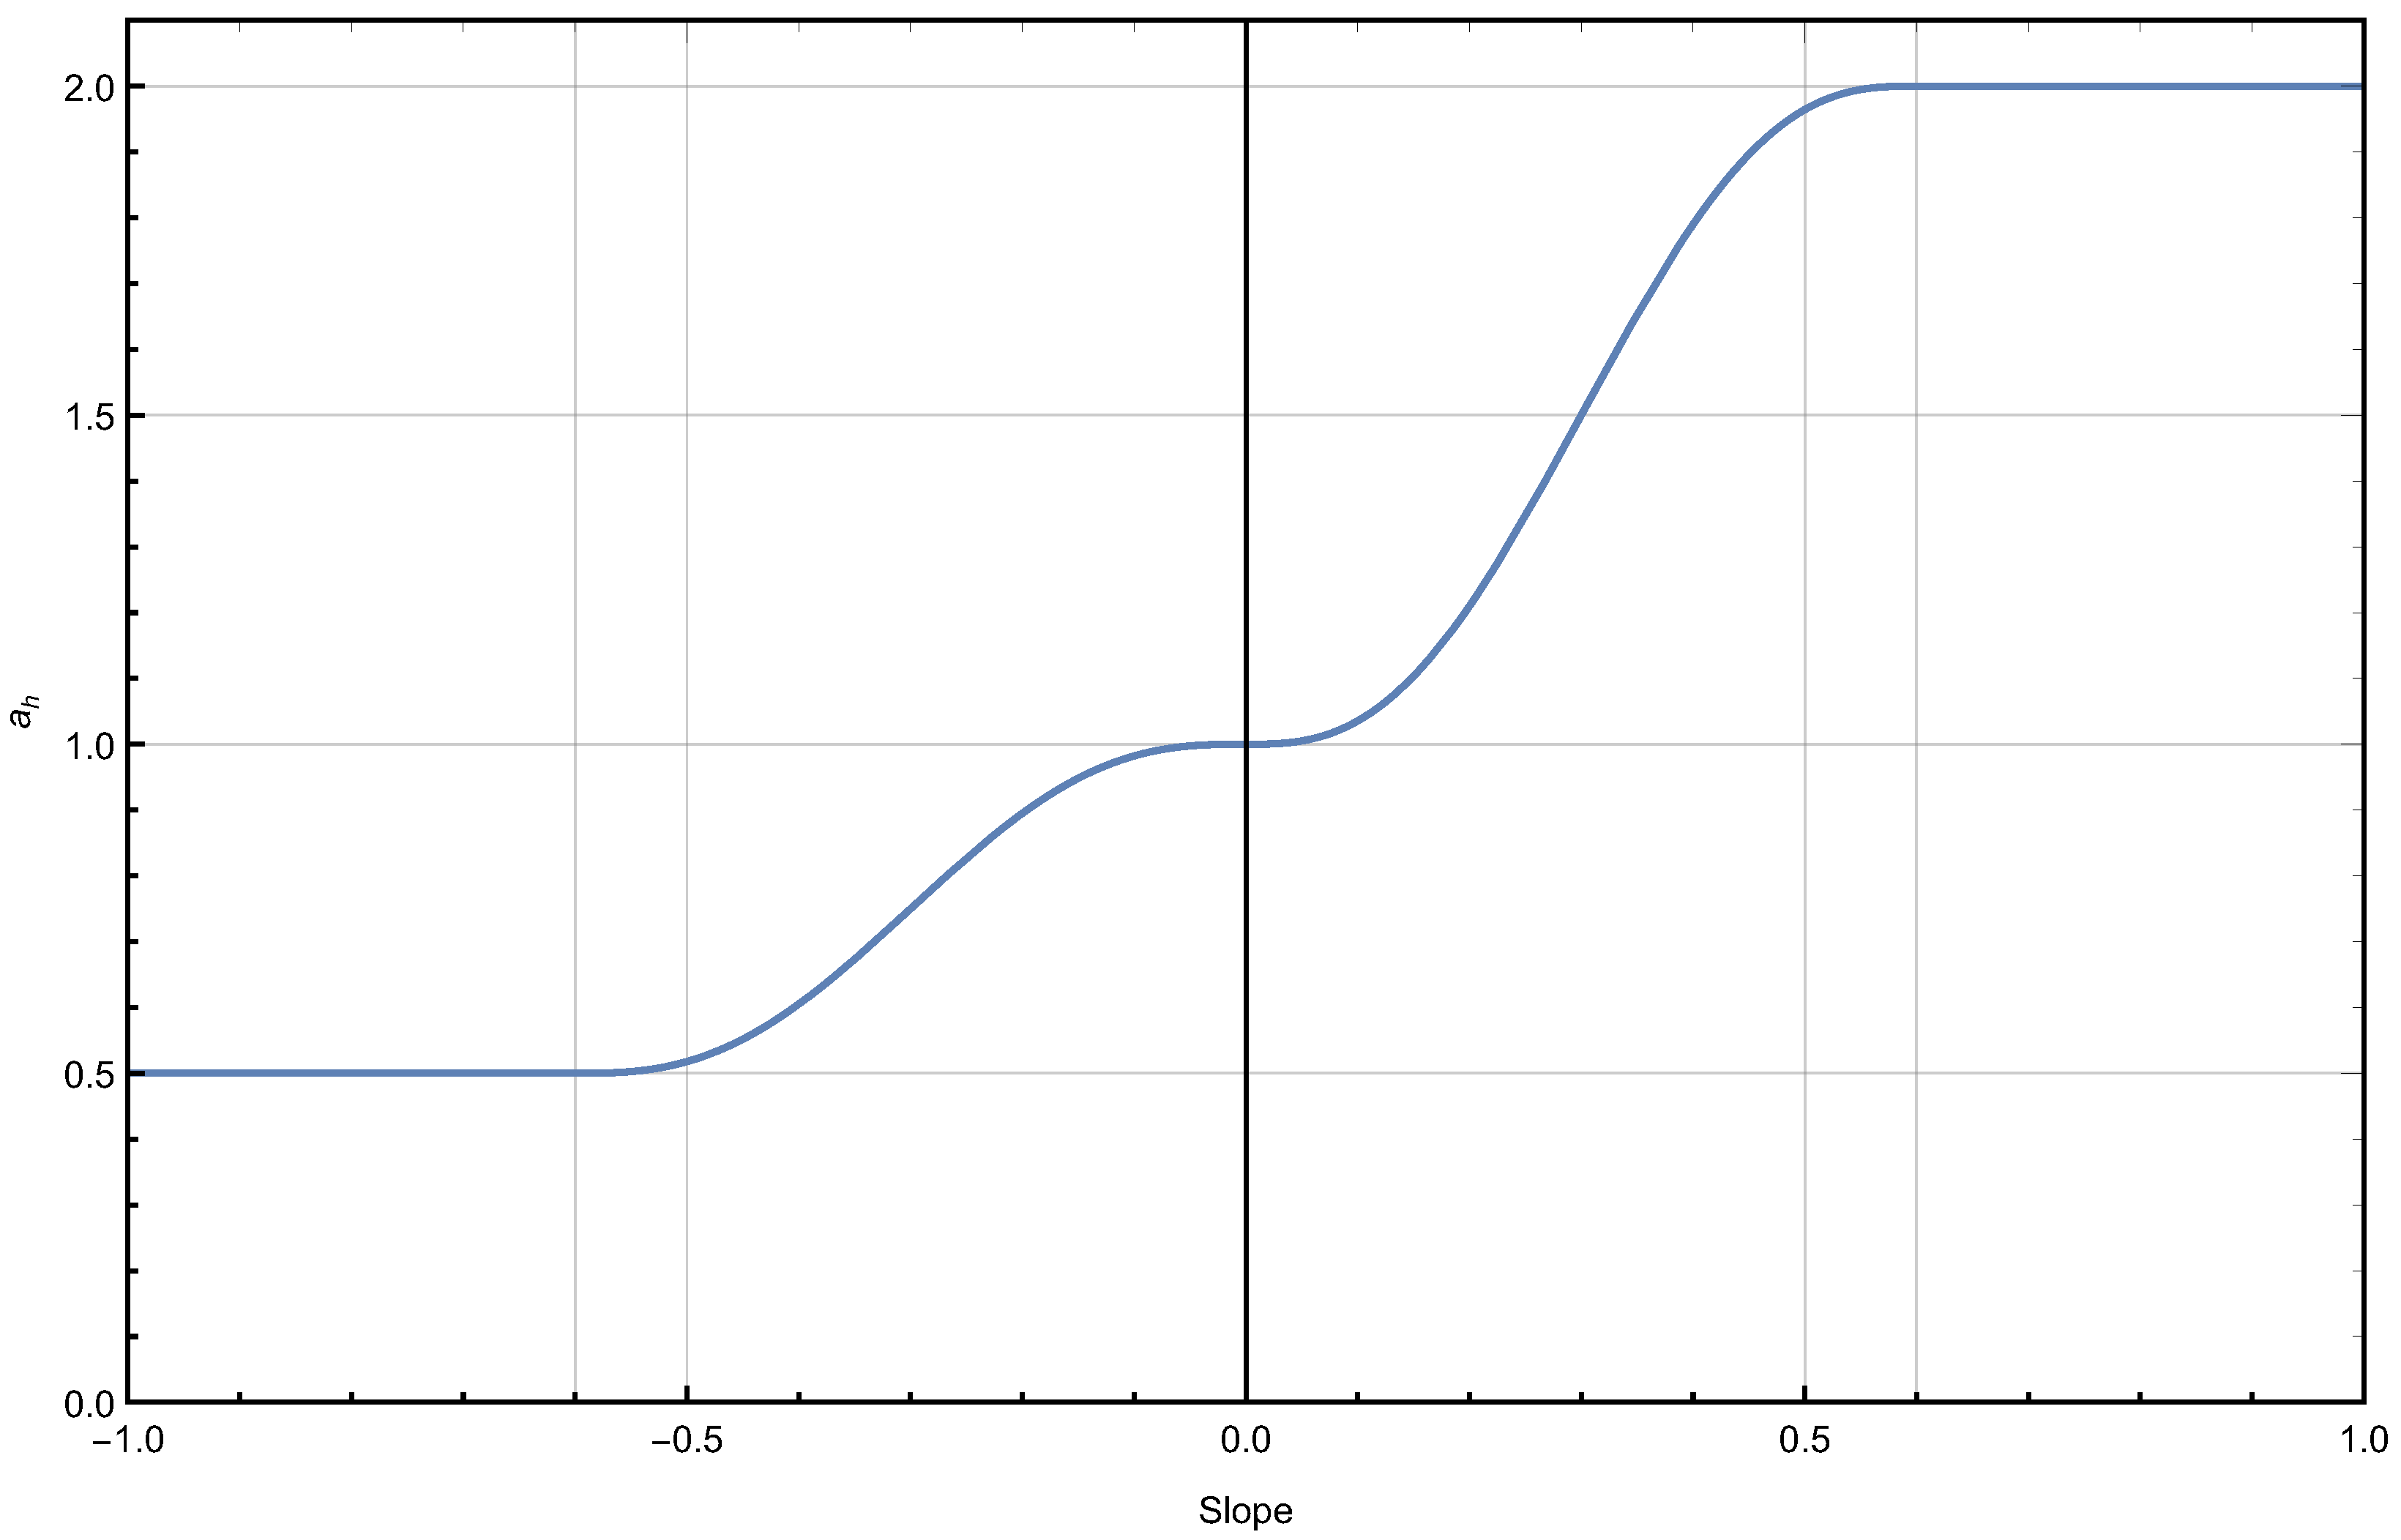
A plot of the slope coefficient over the entire slope range is shown in
Figure 4.
The wind factor
is the same as the one used in PROPAGATOR [
29].
If the resulting ignition probability is non-zero, a random number is generated and the cell changes to the burning state if . If the cell does not change state, the next neighbor is checked.
Fuel is taken into account by considering an initial value corresponding to the NDVI value, with a loss of 0.6 per iteration in which the cell is in the burning state. A cell is marked as burnt when the fuel drops to 0 or below.
Our model does not track time information, so the ROS is not taken into account. The automaton iterations are purely indicative of causality, and do not provide time-span information such as minimum travel time.
2.4. Run Termination and Aggregate Probability
A single run of the model repeats the fire-spreading iterations described in
Section 2.3 until no more burning cells are present in the automaton. Optionally, a maximum number of iterations can be set as a proxy in individual scenarios where it is known that there has been human intervention to cut fire propagation.
Due to the probabilistic nature of the model, multiple runs can provide different results. An aggregate probability of invasion can be computed by running the model multiple times and estimating the combustion probability for each cell as the ratio between the number of runs in which it is burnt to the total number of runs.
The code, the overall structure of which is shown in
Figure 5, is designed to produce directly the aggregate probability of invasion, running the model multiple times for a single simulation. By default, each simulation aggregates the result of 100 runs.
2.5. Model Validation
Since the model is probabilistic, the quality of the results of a simulation can be quantified by computing the Brier score [
38]
where
N is the number of burnable cells,
is the probability computed by VolcFire for each burnable cell to burn,
is 0 for cells that were not reached by the fire in the real event, and 1 for the cells that were burnt by the real fire.
To determine the burned area, we use the difference Normalised Burn Ratio index (dNBR) [
39]. This is obtained as the difference between the Normalised Burn Ratio (NBR) computed before and after the fire. The NBR is computed as
where B12 is the Sentinel-2 band whose properties are summarised in
Table 1, and the dNBR is
A cell is marked as burnt in the fire if dNBR is larger than 0.1
The reliability of the model was assessed by computing the Brier score of multiple simulations for each test case, and assessing its stability.
3. Results
To validate our model, we tested it using two fires that occurred on Stromboli island: one on 3 July 2019, caused by a paroxysmal eruption, and another on 25 May 2022, of anthropogenic origin. In both cases, fire-fighters and the local inhabitants intervened to stop the fire spreading. Since our model is not able to represent this aspect, we have set an upper limit of 400 iterations to artificially stop fire spreading in the model. This has proven to be significant in the 3 July 2019 test case, and less so in the 25 May 2022 case.
The Brier score stability for each test case was assessed by running 11 simulations per test case. The reported Brier score in each case represents the average and range of the scores across the 11 simulations.
3.1. Fire of 3 July 2019
On 3 July 2019, a paroxysmal eruption led to the fall of incandescent material on the southwest of the island, north of Ginostra village. This ignited a fire and caused one death [
3,
4]. According to media and satellite data, this fire propagated both west and east, reaching the shoreline on both sides, and it was stopped mainly by firefighter intervention (air-tankers) to the east and north-east of the Sciara del Fuoco.
For this fire, we considered an ignition point at 15.20328 E and 38.79035 N with a wind strength and direction equal to 13 km/h and 115 degrees, respectively, according to the information offered by the media and the wind map available at [
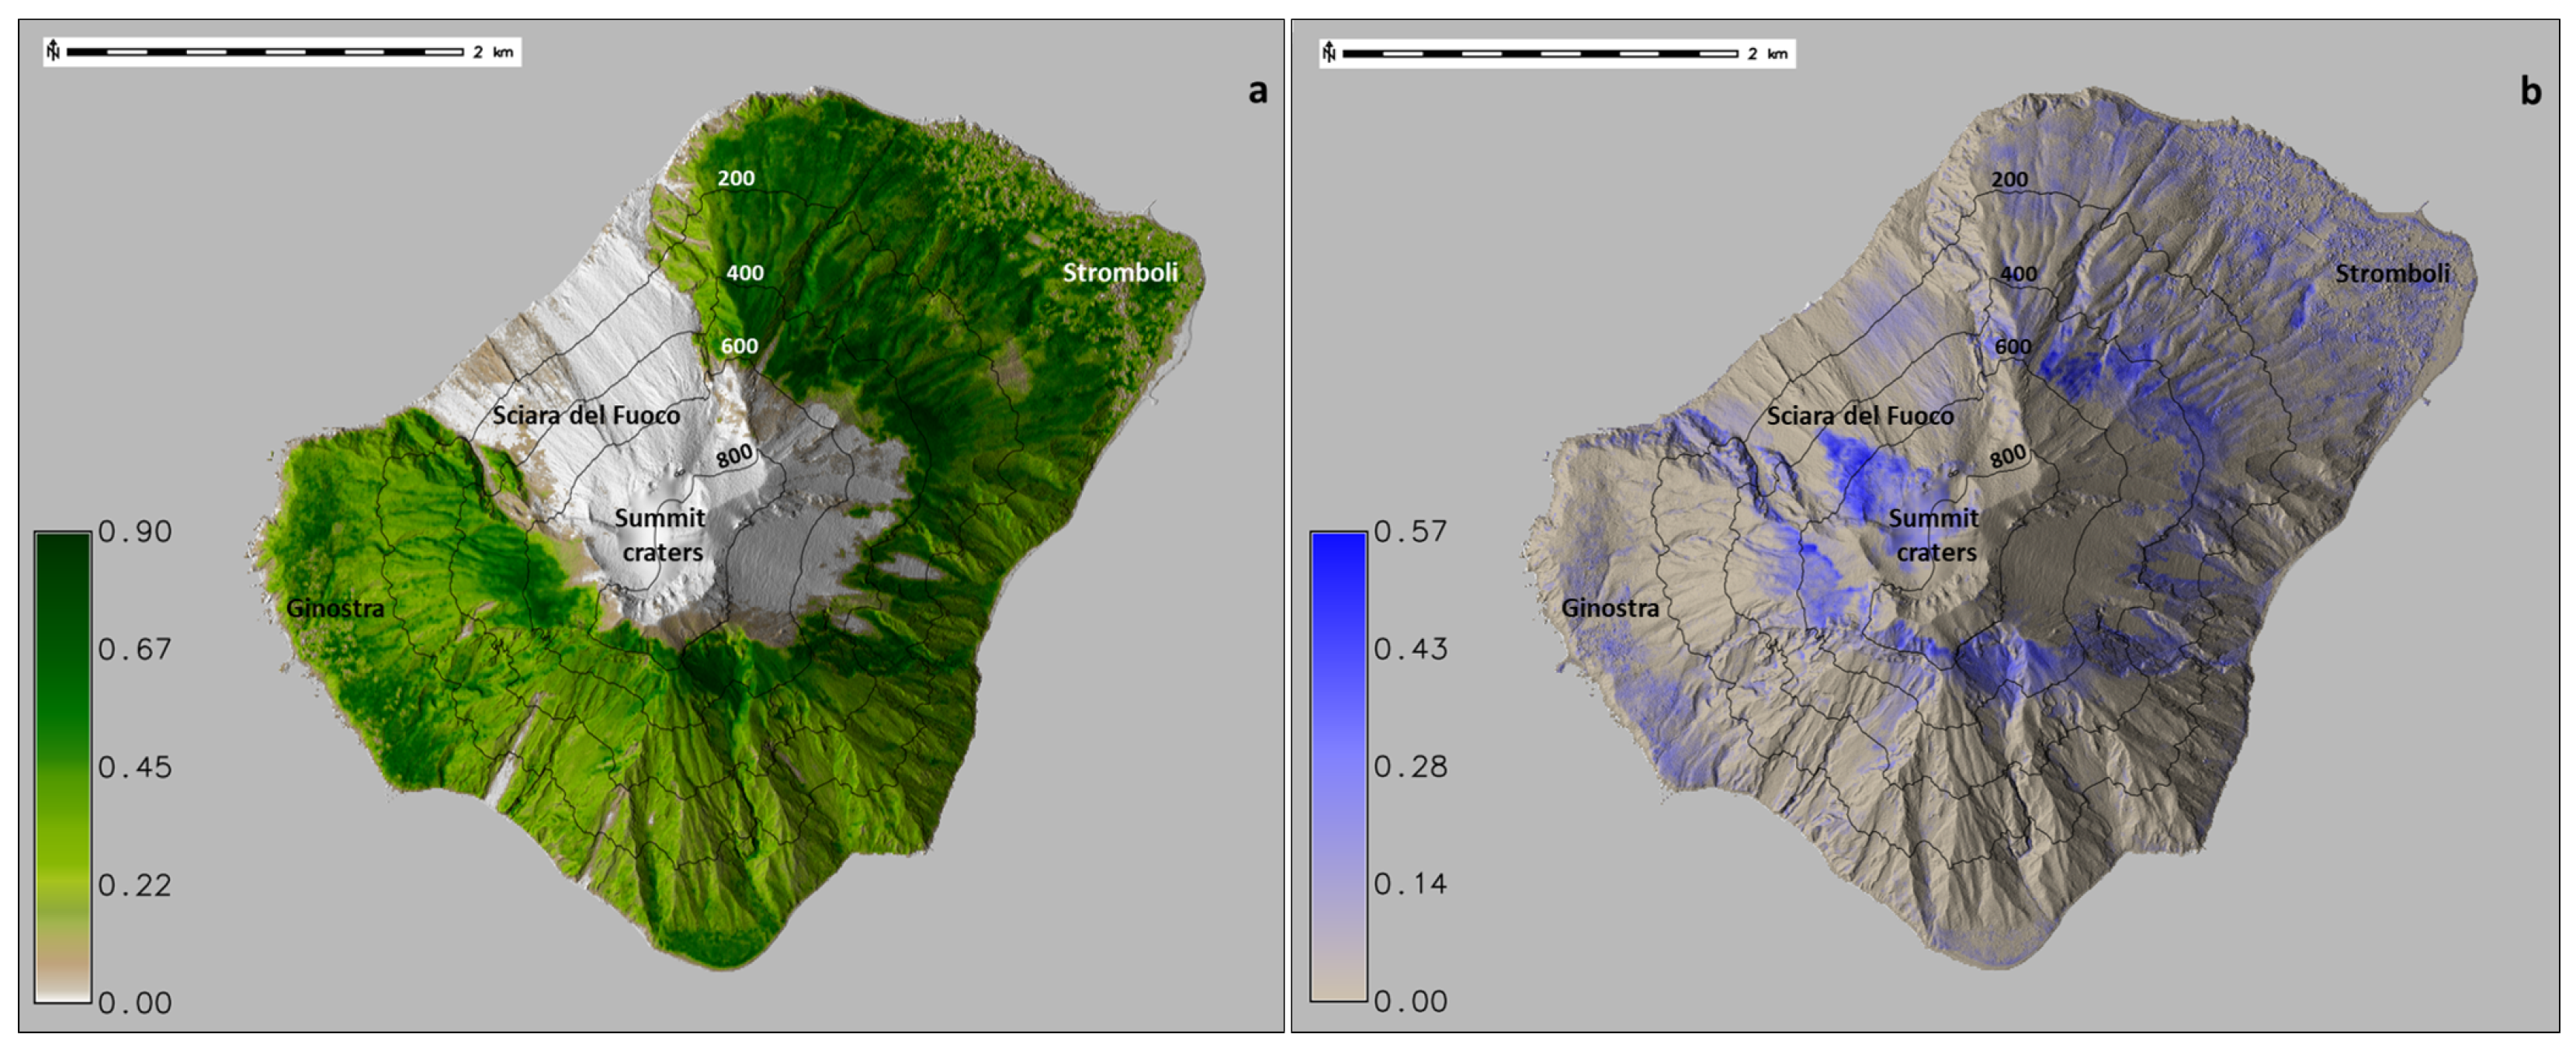
33]. The NDVI and NDMI derived from the Sentinel-2 image acquired on 2 July 2019 are shown in
Figure 6. An upper limit of 400 iterations was imposed, as a proxy for the firefighting interventions.
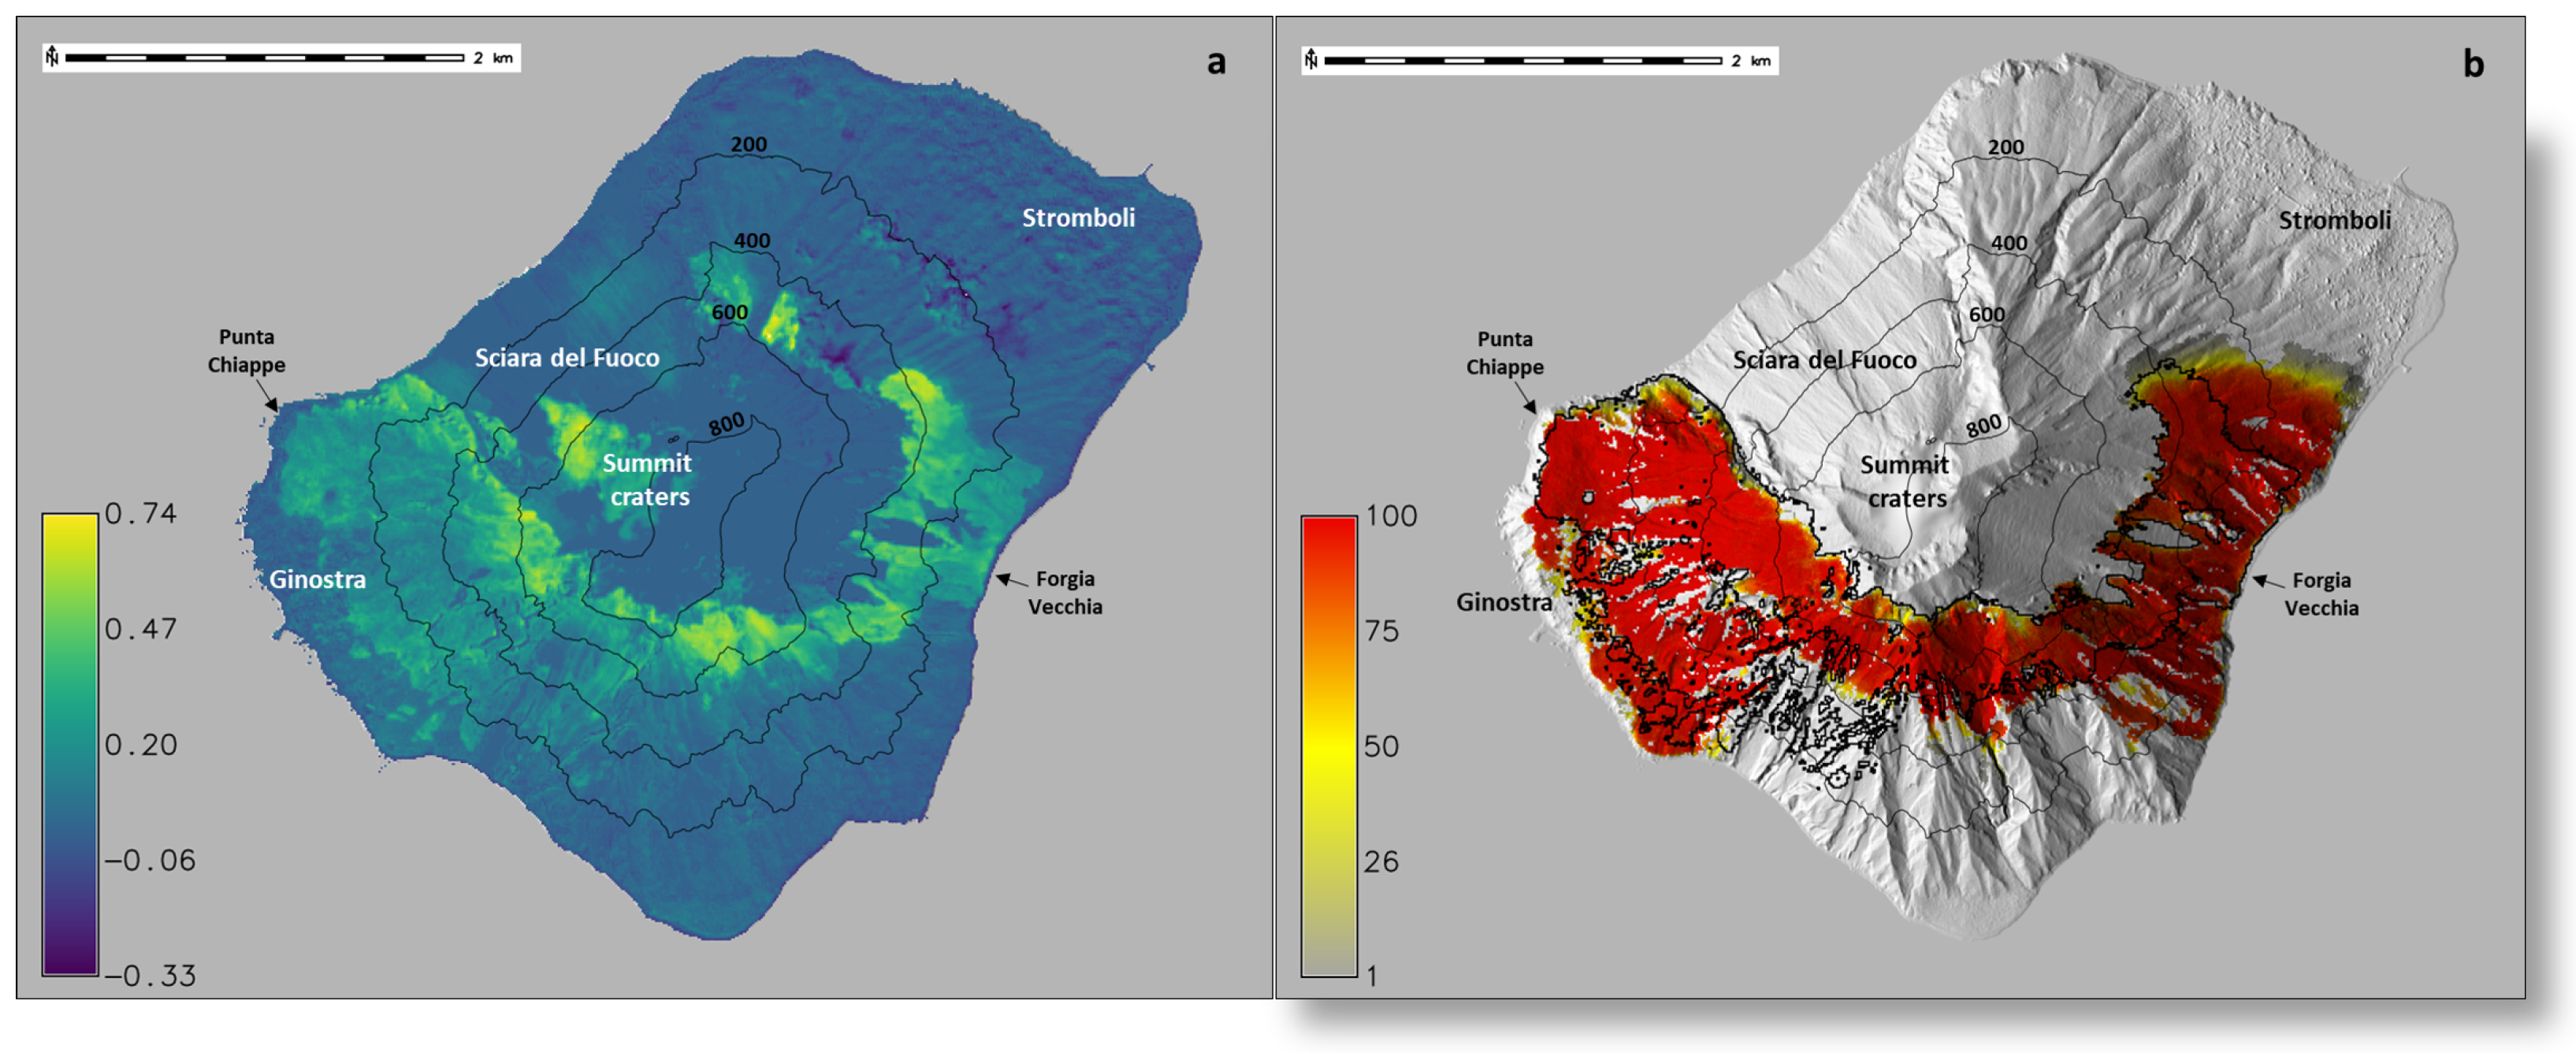
The results of a 100-run simulation offer a fire hazard map that follows overall the same area as the real fire, with the exception of the Ginostra area, where the inhabitants stopped the fire themselves. In the VolcFire model, the fire continues to propagate east, reaching the Forgia Vecchia area, and west, reaching the coastline at Punta Chiappe (
Figure 7). After 400 steps, simulations cover an area that closely matches the burnt area (calculated using the Sentinel-2 images acquired on 2 and 7 July 2019), with a Brier score of
. Without the 400-iteration limit, the fire propagates further north, reaching the town of Stromboli, highlighting the usefulness of the iteration limit as a proxy for firefighting interventions.
3.2. Fire of 25 May 2022
On 25 May 2022, an anthropogenic fire started about 500 m southwest from the C.O.A. (Advanced Operations Centre of Stromboli), southwest of the town of Stromboli, propagating all over the northeastern area of the island.
For this fire, we considered an ignition point at 15.23252 E and 38.80019 N with a wind strength of 12 km/h and a direction of 315 degrees, again according to the information offered by the media and the wind map at [
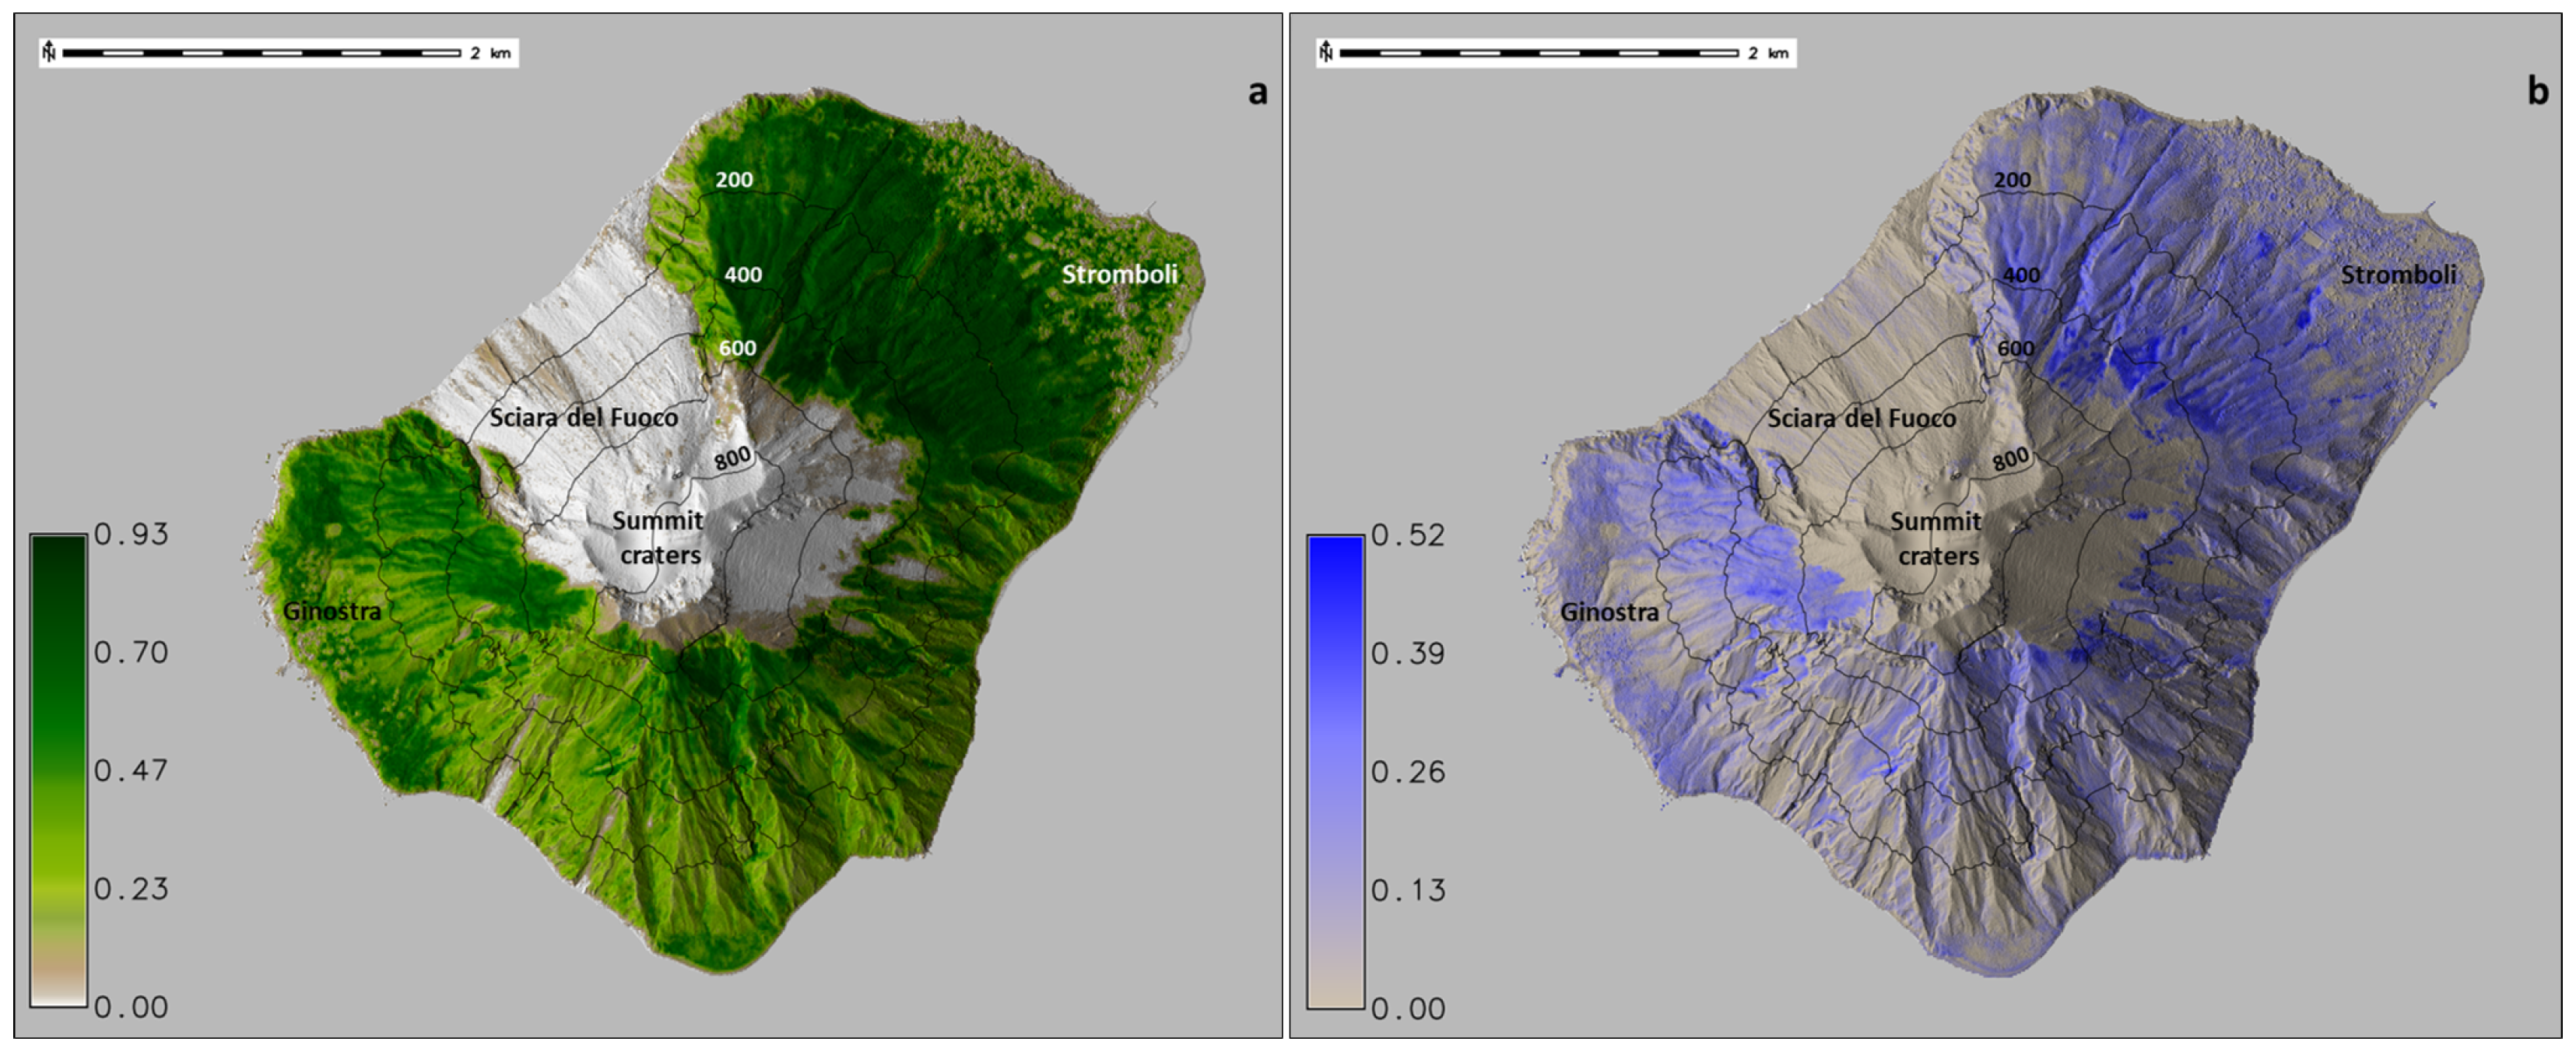
33]. The NDVI and NDMI derived from the Sentinel-2 image acquired on 22 May 2022 are shown in
Figure 8.
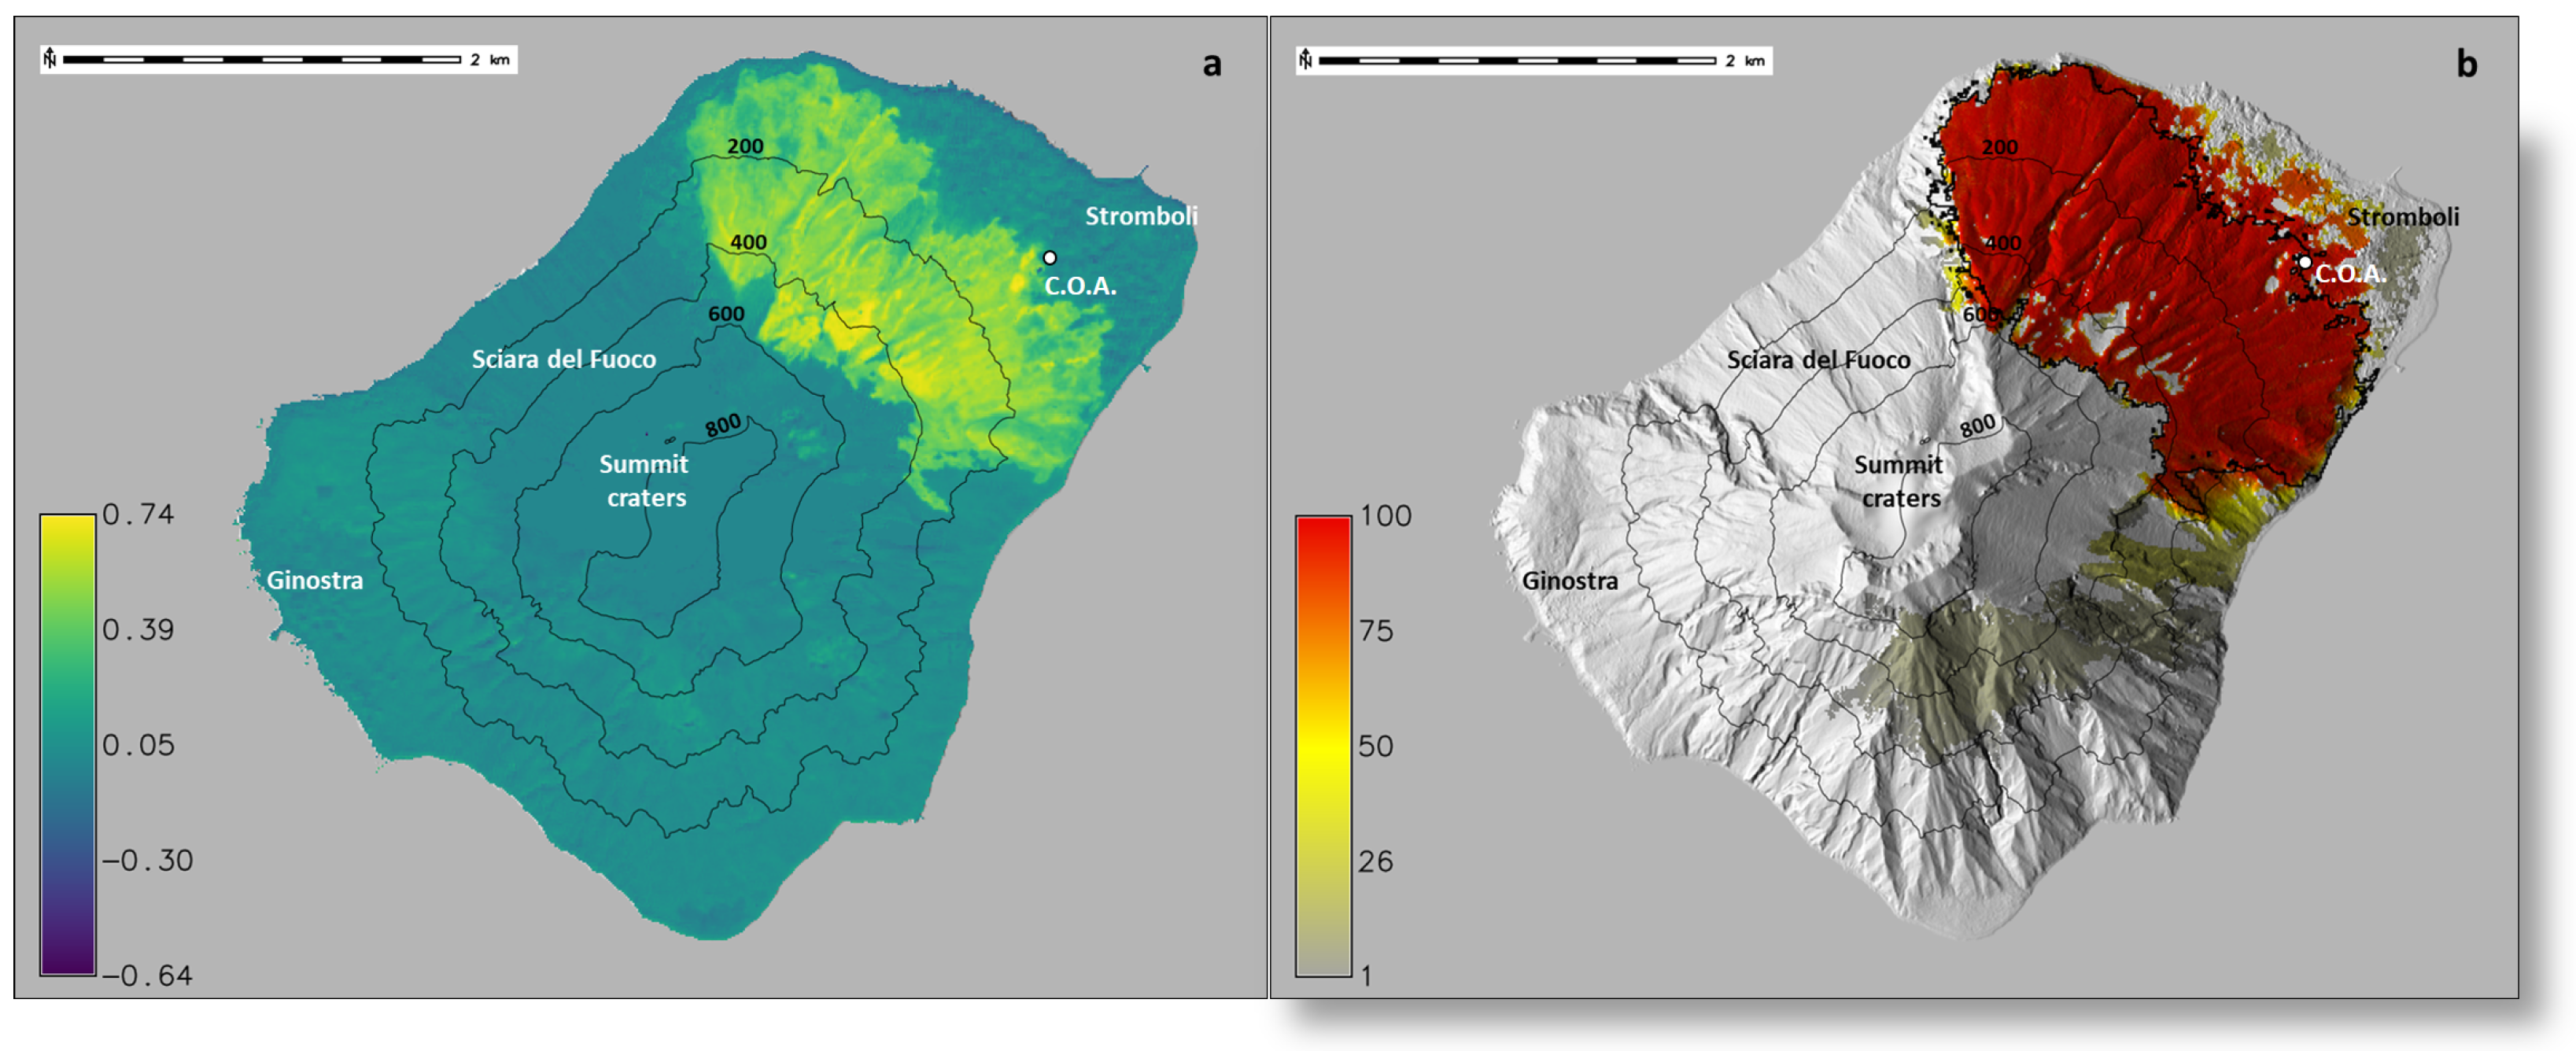
Simulations had average of 233 iterations per run (the upper limit of 400 iterations was never reached), and the Brier score of our simulated propagation area is
, compared to the burnt area obtained by dNBR thresholding from the Sentinel-2 images of 22 May and 1 June 2022 (
Figure 9).
The Brier score is low even though the spread estimated by our model includes an area with low probability of invasion that was not burnt in the actual fire, as it is located beyond the point where firefighting intervention prevented further spreading.
4. Discussion
In this paper, we have introduced VolcFire, a probabilistic cellular automata model for the evaluation of the probability of burning by volcano-induced fires. Since the aim of the model is the production of full-scale hazard maps, the evolution of the cellular automaton sacrifices physical accuracy in favour of simplicity and computational speed. Examples of these simplifications compared to other models include missing contributions from vegetation type, which is often used to fine-tune the ignition probability (compare [
10,
29]), the lack of timing information related to the ROS of the fire (compare [
5,
26,
29,
31,
40]), and a choice to assume that wind information is constant in time and space during a simulation (compare [
29]).
The model can still be applied to individual scenarios, a feature that has been used to validate the fire propagation mechanism in the two test cases presented. However, it is important to remark that the results obtained from the VolcFire simulations do not provide sufficient information to plan scenario-specific interventions, for which timing information is essential.
VolcFire has been validated against two real-world scenarios: the fire that occurred on 3 July 2019, caused by a paroxysmal eruption of Stromboli, and the anthropogenic fire that occurred on 25 May 2022. In both cases, the results show that the model is able to estimate the burnt areas with high accuracy, as indicated by the low Brier score, reproducing the overall real burn pattern obtained from the dNBR maps. Due to the inability to model scenario-specific firefighting interventions, we had to use an upper limit to the iterations in the simulations as a proxy. This still gives sufficiently accurate results, but it negatively affects the Brier score in the 3 July 2019 test case, which is around twice the score for the 25 May 2022 test case. The reliability of the model has been assessed by running multiple simulations and evaluating the changes in the Brier score, which varies by less than across 11 simulations for each test case.
A more detailed comparison of the model results with the actual spread allows us to derive additional information about the events. Specifically, in the simulation of the 3 July 2019 case, removing the upper limit of 400 iterations from the model results in the simulated fire consistently spreading through the entire island. The number of iterations used as a limit corresponds approximately to the number of steps needed for the simulated fire to reach the section of the island where firefighting intervention took place. This suggests that firefighting played a significant role in effectively curtailing the fire spreading. For the 25 May 2022 event, our simulations indicate on the other hand that the fire would have had a high probability of stopping before crossing over to the Forgia Vecchia area and progressing to the southern side of the island; the model still estimated a 1 in 10 probability of further spreading, once again justifying the air-tanker intervention.
A point of note concerns the classification of roads as fire barriers. The model runs at a relatively low spatial resolution of 10 m, which is insufficient to resolve the narrow roads on Stromboli island. Although the roads themselves could be accounted for from the higher resolution land-use map information, we have ultimately decided not to take them into account even as lower-dimensional fire barriers, since the surveyed road width is never larger than 2 m, and roads are surrounded by abundant, highly flammable vegetation, questioning their actual effectiveness as fire barriers.
Indeed, the volcano-flank vegetation mainly consists of
Arundo donax, which belongs to the top 100 most invasive alien species [
41], with the peculiarity of its fast growth (5 cm per day) and low water content. This type of vegetation, in a high humidity environment like that of Stromboli island, creates the perfect condition for fire ignition and propagation, and explains the wide spreading all over the island in the absence of firefighting intervention.
The results obtained with the current model are encouraging and highlight the opportunity to produce an island-wide fire hazard map, which may be used to plan preventive interventions to reduce the associated risk [
42]. The model proposed in this work has been designed with this specific intent, although it may not currently provide information to assist near-real-time firefighting efforts.
5. Conclusions and Future Works
The presented probabilistic cellular automaton model for fire propagation demonstrates promising capabilities in simulating the spreading of volcanic-induced fires, as evidenced by its application to previous scenarios on Stromboli island. The model sacrifices complexity and physical detail in favour of higher computational efficiency and simplicity of input, as it is being developed with the primary goal of generating island-wide fire hazard maps. Some of the input data needed by the model is long-term (the topography and land-use map), while others are seasonal (the wind direction and intensity, and the vegetation load and moisture content; the latter can be derived automatically from satellite imagery from which the model computes the NDVI and NDMI indices during initialisation).
The model currently employs the NDVI and NDMI indices directly as model data, with empirically-determined thresholds to identify unburnable cells and cells that can burn for more than one iteration. The values of these thresholds currently used in the model have been tuned for Stromboli, and may need to be calibrated to allow the model to be used accurately on other volcanoes.
A detailed sensitivity analysis of the model to these parameters is needed to estimate their relative importance on the model output, and to determine their optimal value. As part of this process, the model will also be tested on a broader range of volcanic-fire events and conditions (e.g., the Cumbre Vieja eruption of 2021 [
43]) to determine in what measure these values are location-dependent.
Taking into account the simplifications adopted for the model, the authors are also exploring the possibility to adapt the evolution function into a single-run probability propagation. This would allow the computation of the probability of combustion for each cell at each iteration without resorting to multiple runs of the automaton, and would make it easier to incorporate probabilistic information about the initial ignition points, allowing the volcano-related fire hazard map for the entire island to be computed in a single automaton run, given information about the probability of impact from incandescent pyroclasts over the source areas.
Author Contributions
Conceptualisation, R.G. and G.B.; methodology, R.G. and G.B.; software, R.G. and G.B.; validation, R.G., G.B., G.G. and A.C.; resources, R.G., G.G., F.Z. and D.A.; writing—original draft preparation, all authors; writing—review and editing, all authors; project administration, G.B.; funding acquisition, G.B. and G.G. All authors have read and agreed to the published version of the manuscript.
Funding
INGV-DPC Agreement All. B, 2022-2024-“Sistema Unico Stromboli”, OB.FU. 1138.010-CUP: D53C22002760001.
Data Availability Statement
Acknowledgments
This research has been conducted within the INGV-DPC Agreement All. B, 2022-2024-“Sistema Unico Stromboli”, Task 4.2: Risk analysis from fires of volcanic origin in Stromboli. The authors thank the CIMA foundation team that developed the PROPAGATOR software for the information about the wind equation. We thank the editor and the three anonymous reviewers for their comments which helped us improve the manuscript. This work was supported by the INGV project Pianeta Dinamico (CUP D53J19000170001) funded by MIUR (“Fondo finalizzato al rilancio degli investimenti delle amministrazioni centrali dello Stato e allo sviluppo del Paese,” legge 145/2018), Tema VT SAFARI (PI Gaetana Ganci), and “HARVEST- Integrating tHermal cAmeRa data and SPH modeling to quantify Volcanic dEposits at STromboli” (Bando di Ricerca Libera 2021 of INGV, PI Giuseppe Bilotta).
Conflicts of Interest
The authors declare no conflicts of interest.
Abbreviations
The following abbreviations are used in this manuscript:
| CA | Cellular Automaton |
| dNDBR | difference of Normalized Difference Burn Ratio |
| DSM | Digital Surface Model |
| GIS | Geographic Information System |
| NDBR | Normalized Difference Burn Ratio |
| NDMI | Normalized Difference Moisture Index |
| NDVI | Normalized Difference Vegetation Index |
| ROS | Rate of Spread |
References
- Areu-Rangel, O.S.; Bonasia, R.; Di Traglia, F.; Del Soldato, M.; Casagli, N. Flood susceptibility and sediment transport analysis of stromboli Island after the 3 July 2019 paroxysmal explosion. Sustainability 2020, 12, 3268. [Google Scholar] [CrossRef]
- Turchi, A.; Di Traglia, F.; Luti, T.; Olori, D.; Zetti, I.; Fanti, R. Environmental aftermath of the 2019 Stromboli eruption. Remote Sens. 2020, 12, 994. [Google Scholar] [CrossRef]
- Andronico, D.; Del Bello, E.; D’Oriano, C.; Landi, P.; Pardini, F.; Scarlato, P.; de’Michieli Vitturi, M.; Taddeucci, J.; Cristaldi, A.; Ciancitto, F.; et al. Uncovering the eruptive patterns of the 2019 double paroxysm eruption crisis of Stromboli volcano. Nat. Commun. 2021, 12, 4213. [Google Scholar] [CrossRef] [PubMed]
- Giordano, G.; De Astis, G. The summer 2019 basaltic Vulcanian eruptions (paroxysms) of Stromboli. Bull. Volcanol. 2021, 83, 1–27. [Google Scholar] [CrossRef]
- Hantson, S.; Andela, N.; Goulden, M.L.; Randerson, J.T. Human-ignited fires result in more extreme fire behavior and ecosystem impacts. Nat. Commun. 2022, 13, 2717. [Google Scholar] [CrossRef]
- Anderson, H. Fire spread and flame shape. Fire Technol. 1968, 4, 51–58. [Google Scholar] [CrossRef]
- Rothermel, R.C. A Mathematical Model for Predicting Fire Spread in Wildland Fuels; Intermountain Forest & Range Experiment Station, Forest Service, US Department of Agriculture: Ogden, UT, USA, 1972; Volume 115. [Google Scholar]
- Albini, F.A. Computer-Based Models of Wildland Fire Behavior: A User’s Manual; USDA Forest Service Intermountain Forest and Range Experiment Station: Ogden, UT, USA, 1976. [Google Scholar]
- Albinet, G.; Searby, G.; Stauffer, D. Fire propagation in a 2-D random medium. J. Phys. 1986, 47, 1–7. [Google Scholar] [CrossRef]
- Baranovskiy, N.V.; Ignateva, A.V. Mathematical Modeling of Human Activity on Forested Areas from Point Objects of Railway Infrastructure in a Two-Dimensional Statement. Int. J. Eng. Appl. 2022, 10, 15–28. [Google Scholar] [CrossRef]
- Kumar, M.; Li, S.; Nguyen, P.; Banerjee, T. Examining the existing definitions of wildland-urban interface for California. Ecosphere 2022, 13, e4306. [Google Scholar] [CrossRef]
- Masoudvaziri, N.; Bardales, F.S.; Keskin, O.K.; Sarreshtehdari, A.; Sun, K.; Elhami-Khorasani, N. Streamlined wildland-urban interface fire tracing (SWUIFT): Modeling wildfire spread in communities. Environ. Model. Softw. 2021, 143, 105097. [Google Scholar] [CrossRef]
- Carlson, A.R.; Helmers, D.P.; Hawbaker, T.J.; Mockrin, M.H.; Radeloff, V.C. The wildland–urban interface in the United States based on 125 million building locations. Ecol. Appl. 2022, 32, e2597. [Google Scholar] [CrossRef]
- Schug, F.; Bar-Massada, A.; Carlson, A.R.; Cox, H.; Hawbaker, T.J.; Helmers, D.; Hostert, P.; Kaim, D.; Kasraee, N.K.; Martinuzzi, S.; et al. The global wildland–urban interface. Nature 2023, 621, 94–99. [Google Scholar] [CrossRef]
- Margerit, J.; Séro-Guillaume, O. Modelling forest fires. Part II: Reduction to two-dimensional models and simulation of propagation. Int. J. Heat Mass Transf. 2002, 45, 1723–1737. [Google Scholar] [CrossRef]
- Bhattacharya, A.; Calmidi, V.; Mahajan, R. Thermophysical properties of high porosity metal foams. Int. J. Heat Mass Transf. 2002, 45, 1017–1031. [Google Scholar] [CrossRef]
- Séro-Guillaume, O.; Margerit, J. Modelling forest fires. Part I: A complete set of equations derived by extended irreversible thermodynamics. Int. J. Heat Mass Transf. 2002, 45, 1705–1722. [Google Scholar] [CrossRef]
- Mangiameli, M.; Mussumeci, G.; Cappello, A. Forest Fire Spreading Using Free and Open-Source GIS Technologies. Geomatics 2021, 1, 50–64. [Google Scholar] [CrossRef]
- Perestrelo, S.; Grácio, M.C.; Ribeiro, N.A.; Lopes, L.M. Modelling Forest Fires Using Complex Networks. Math. Comput. Appl. 2021, 26, 68. [Google Scholar] [CrossRef]
- Duarte, J. Fire spreading in natural fuels: A computational aspect. In Annual Reviews of Computational Physics; World Scientific: Singapore, 1997; Volume V, pp. 1–23. [Google Scholar] [CrossRef]
- Sun, L.; Xu, C.; He, Y.; Zhao, Y.; Xu, Y.; Rui, X.; Xu, H. Adaptive Forest fire spread simulation algorithm based on cellular automata. Forests 2021, 12, 1431. [Google Scholar] [CrossRef]
- Trucchia, A.; Meschi, G.; Fiorucci, P.; Gollini, A.; Negro, D. Defining wildfire susceptibility maps in Italy for understanding seasonal wildfire regimes at the national level. Fire 2022, 5, 30. [Google Scholar] [CrossRef]
- Xu, Y.; Li, D.; Ma, H.; Lin, R.; Zhang, F. Modeling Forest Fire Spread Using Machine Learning-Based Cellular Automata in a GIS Environment. Forests 2022, 13, 1974. [Google Scholar] [CrossRef]
- Richards, G.D.; Bryce, R.W. A computer algorithm for simulating the spread of wildland fire perimeters for heterogeneous fuel and meteorological conditions. Int. J. Wildland Fire 1995, 5, 73–79. [Google Scholar] [CrossRef][Green Version]
- Von Niessen, W.; Blumen, A. Dynamic simulation of forest fires. Can. J. For. Res. 1988, 18, 805–812. [Google Scholar] [CrossRef]
- Ferragut, L.; Asensio, M.; Monedero, S. Modelling radiation and moisture content in fire spread. Commun. Numer. Methods Eng. 2007, 23, 819–833. [Google Scholar] [CrossRef]
- Bürger, R.; Gavilán, E.; Inzunza, D.; Mulet, P.; Villada, L.M. Exploring a convection–diffusion–reaction model of the propagation of forest fires: Computation of risk maps for heterogeneous environments. Mathematics 2020, 8, 1674. [Google Scholar] [CrossRef]
- Pulvirenti, L.; Squicciarino, G.; Fiori, E.; Fiorucci, P.; Ferraris, L.; Negro, D.; Gollini, A.; Severino, M.; Puca, S. An automatic processing chain for near real-time mapping of burned forest areas using sentinel-2 data. Remote Sens. 2020, 12, 674. [Google Scholar] [CrossRef]
- Trucchia, A.; D’Andrea, M.; Baghino, F.; Fiorucci, P.; Ferraris, L.; Negro, D.; Gollini, A.; Severino, M. PROPAGATOR: An operational cellular-automata based wildfire simulator. Fire 2020, 3, 26. [Google Scholar] [CrossRef]
- Mossner, W.; Drossel, B.; Schwabl, F. Computer simulations of the forest-fire model. Phys. Stat. Mech. Its Appl. 1992, 190, 205–211. [Google Scholar] [CrossRef]
- Li, X.; Zhang, M.; Zhang, S.; Liu, J.; Sun, S.; Hu, T.; Sun, L. Simulating forest fire spread with cellular automation driven by a LSTM based speed model. Fire 2022, 5, 13. [Google Scholar] [CrossRef]
- Calvari, S.; Di Traglia, F.; Ganci, G.; Giudicepietro, F.; Macedonio, G.; Cappello, A.; Nolesini, T.; Pecora, E.; Bilotta, G.; Centorrino, V.; et al. Overflows and pyroclastic density currents in March-April 2020 at Stromboli volcano detected by remote sensing and seismic monitoring data. Remote Sens. 2020, 12, 3010. [Google Scholar] [CrossRef]
- Beccario, C. Earth. Available online: https://earth.nullschool.net/ (accessed on 22 January 2024).
- GDAL/OGR Contributors. GDAL/OGR Geospatial Data Abstraction Software Library. Available online: https://gdal.org (accessed on 22 January 2024).
- Collin, A.; Bernardin, D.; Sero-Guillaume, O. A physical-based cellular automaton model for forest-fire propagation. Combust. Sci. Technol. 2011, 183, 347–369. [Google Scholar] [CrossRef]
- EOS Data Analytics. NDMI (Normalized Difference Moisture Index). Available online: https://eos.com/make-an-analysis/ndmi/ (accessed on 22 January 2024).
- Toffoli, T.; Margolus, N. Cellular Automata Machines: A New Environment for Modeling; The MIT Press: Cambridge, MA, USA, 1987. [Google Scholar] [CrossRef]
- Benedetti, R. Scoring rules for forecast verification. Mon. Weather. Rev. 2010, 138, 203–211. [Google Scholar] [CrossRef]
- Keeley, J.E. Fire intensity, fire severity and burn severity: A brief review and suggested usage. Int. J. Wildland Fire 2009, 18, 116–126. [Google Scholar] [CrossRef]
- Maffei, C.; Menenti, M. Predicting forest fires burned area and rate of spread from pre-fire multispectral satellite measurements. ISPRS J. Photogramm. Remote. Sens. 2019, 158, 263–278. [Google Scholar] [CrossRef]
- Lowe, S.; Browne, M.; Boudjelas, S.; De Poorter, M. 100 of the World’s Worst Invasive Alien Species: A Selection from the Global Invasive Species Database; Invasive Species Specialist Group: Auckland, New Zealand, 2000; Volume 12. [Google Scholar]
- Bilotta, G.; Cappello, A.; Ganci, G. Formal Matters on the Topic of Risk Mitigation: A Mathematical Perspective. Appl. Sci. 2022, 13, 265. [Google Scholar] [CrossRef]
- Day, J.M.D.; Geiger, H.; Troll, V.R.; Perez-Torrado, F.J.; Aulinas, M.; Gisbert, G.; Carracedo, J.C. Bouncing Spallation Bombs During the 2021 La Palma Eruption, Canary Islands, Spain. Earth Sci. Syst. Soc. 2022, 2, 10063. [Google Scholar] [CrossRef]
| Disclaimer/Publisher’s Note: The statements, opinions and data contained in all publications are solely those of the individual author(s) and contributor(s) and not of MDPI and/or the editor(s). MDPI and/or the editor(s) disclaim responsibility for any injury to people or property resulting from any ideas, methods, instructions or products referred to in the content. |
© 2024 by the authors. Licensee MDPI, Basel, Switzerland. This article is an open access article distributed under the terms and conditions of the Creative Commons Attribution (CC BY) license (https://creativecommons.org/licenses/by/4.0/).
