1. Introduction
Wildfires have increasingly become a critical issue worldwide, marked by their growing frequency and intensity, as documented in recent studies [
1,
2,
3,
4,
5,
6,
7]. This escalation in wildfire activity presents complex socio-economic challenges, motivating a thorough investigation of wildfire dynamics and their environmental controls for effective management and/or mitigation strategies [
8,
9,
10]. Among various factors influencing wildfires like topography, weather conditions, and fuel characteristics, fuel moisture content (FMC) is identified as a key variable impacting fuel flammability, fire intensity, and the rate of spread [
11,
12]. Therefore, the accurate assessment of spatial and temporal FMC patterns is critical for fire forecasting, reconstructing historical fire scenarios, and understanding the spatial and temporal variability in fire activity [
13,
14].
Dead fuel moisture content (DFMC) is assessed in 1-h, 10-h, 100-h, and 1000-h fuel classes, which correspond to characteristic diameters varying from less than 0.25 inches to over 3 inches, and the rate of their response to changing environmental conditions. Measurements of 10-h DFMC are obtained through both direct and indirect methods. The direct method involves ½-inch-diameter ponderosa pine dowels that change their mass as they gain or lose moisture. These fuel moisture sticks are grouped in an array weighing 100 g when completely dry and connected to a weighing device to provide a measure of the 10-h dead fuel moisture in percent based on the additional weight of water. Indirect methods include 10-h electric fuel moisture sensors and remote sensing techniques. Ten-hour fuel moisture sensors are routinely used in remote automatic weather stations (RAWS), providing relatively widespread automatic fuel moisture monitoring. Regardless of the particular method, the described DFMC measurement techniques offer local observations but lack broad spatial coverage. To address this limitation, remote sensing approaches have been proposed. Such methods generate gridded fuel moisture datasets relying on statistical learning methods that find complex relationships between satellite data and DFMC [
15,
16]. These techniques have shown promising results but are highly limited by the availability as well as spatial and temporal resolutions of satellite data. For instance, the product created by McCandless et al. [
16] generates daily 10-h DFMC estimates, which do not provide adequate time resolution to capture diurnal fuel moisture fluctuations critical in the context of fire activity.
The need for a gridded spatial product motivated the development of fuel moisture models with gridded weather data as an input and spatial fuel moisture maps as an output. Since the early 2000s, the Nelson model [
17] has been widely adopted for estimating DFMC due to its reliability and minimal weather data inputs. Its accuracy and broad applicability have made it a critical part of the National Fire Danger Rating System [
18]. However, due to its complexity and relatively high computational cost, a simpler time-lag model has been developed for the purpose of coupled atmosphere–fire modeling [
19].
In addition to these models, there are also established gridded products, such as the Canadian Forest Fire Weather Index System (CFFWIS) [
20,
21]. The CFFWIS provides information about fuel flammability using the Fine Fuel Moisture Code (FFMC), Duff Moisture Code (DMC), and Drought Code (DC) executed based on gridded ERA5 weather data at a 0.25° × 0.25° resolution. However, unlike the Nelson and time-lag models, CFFWIS does not provide physical fuel moisture content (e.g., percentage or g/g). Rather, it uses indices to represent specific fuel layers’ moisture state, which is not directly translatable into the percentage moisture content typically required by fire spread and fire danger models requiring direct fuel moisture inputs.
Although the fuel moisture models and indices are invaluable, especially in the context of fuel moisture forecasting, it has to be noted that they are prone to errors and provide only fuel moisture estimates rather than actual observations. For that reason, relying solely on fuel moisture models or indices when assessing spatial and temporal fuel moisture trends is problematic.
Acknowledging these problems, this study aims to develop a comprehensive fuel moisture data assimilation system that provides spatial fuel moisture estimates, surpassing the accuracy of current fuel moisture models and removing some of the limitations of remote sensing estimates. By leveraging data assimilation alongside a fuel moisture model, this work seeks to produce a historical DFMC reanalysis dataset that leverages both the fuel moisture model and the observations. The mechanism to assimilate observations to a model mirrors techniques employed in weather reanalysis datasets like the Climate Forecast System Reanalysis (CFSR) and North American Regional Reanalysis (NARR). Such datasets leverage data assimilation to fill gaps in regions with sparse or absent observations in order to provide a continuous gridded weather dataset [
22,
23,
24,
25].
A fuel moisture data assimilation (FMDA) system that integrates 10-h fuel moisture observations from RAWS into a simplified fuel moisture model was proposed [
26], providing promising results. The FMDA system consists of a Trend Surface Model interpolating the observations into the prediction grid and a time-lag fuel moisture model, advancing the dead fuel moisture state depending on weather conditions. Then, an Extended Kalman Filter (EKF) is used to blend model results and observations. The system has been adopted operationally within the fire forecasting system WRFx [
27]. Since 2021, this system has been generating hourly DFMC estimates using weather data from the Real-Time Mesoscale Analysis (RTMA) product [
28] for the fire danger assessment and initialization of the fuel moisture fields in the coupled atmosphere–fire model WRF-SFIRE [
29] used to forecast wildfire behavior in the WRFx system. The gridded fuel moisture estimates, including covariates and RAWS observations, can be found on the dedicated web portal [
30].
Unfortunately, when testing the FMDA system in long-term historical cycles, the system exhibited significant limitations, making it unsuitable for generating a DFMC reanalysis. These limitations stem from several factors, such as inadequate tuning of uncertain parameters in the data assimilation process, neglecting valuable information from observations, as well as the suboptimal nature of the RTMA as a weather data source for historical applications suffering from limited historical data availability and a limited number of weather variables that could serve as covariates. These limitations motivated the work presented in this publication, which describes significant modifications to the system targeting its robustness in the context of generating long-term DFMC estimates. This study outlines the modifications implemented to the Vejmelka et al. [
26] FMDA system and thoroughly assesses the accuracy of the final fuel moisture reanalysis product. We anticipate that the presented methodology and the resulting dataset will play a crucial role in examining historical fire activity concerning climatological fuel moisture trends. Additionally, we expect that the reanalysis dataset will aid in enhancing fuel moisture models in the future.
2. Materials and Methods
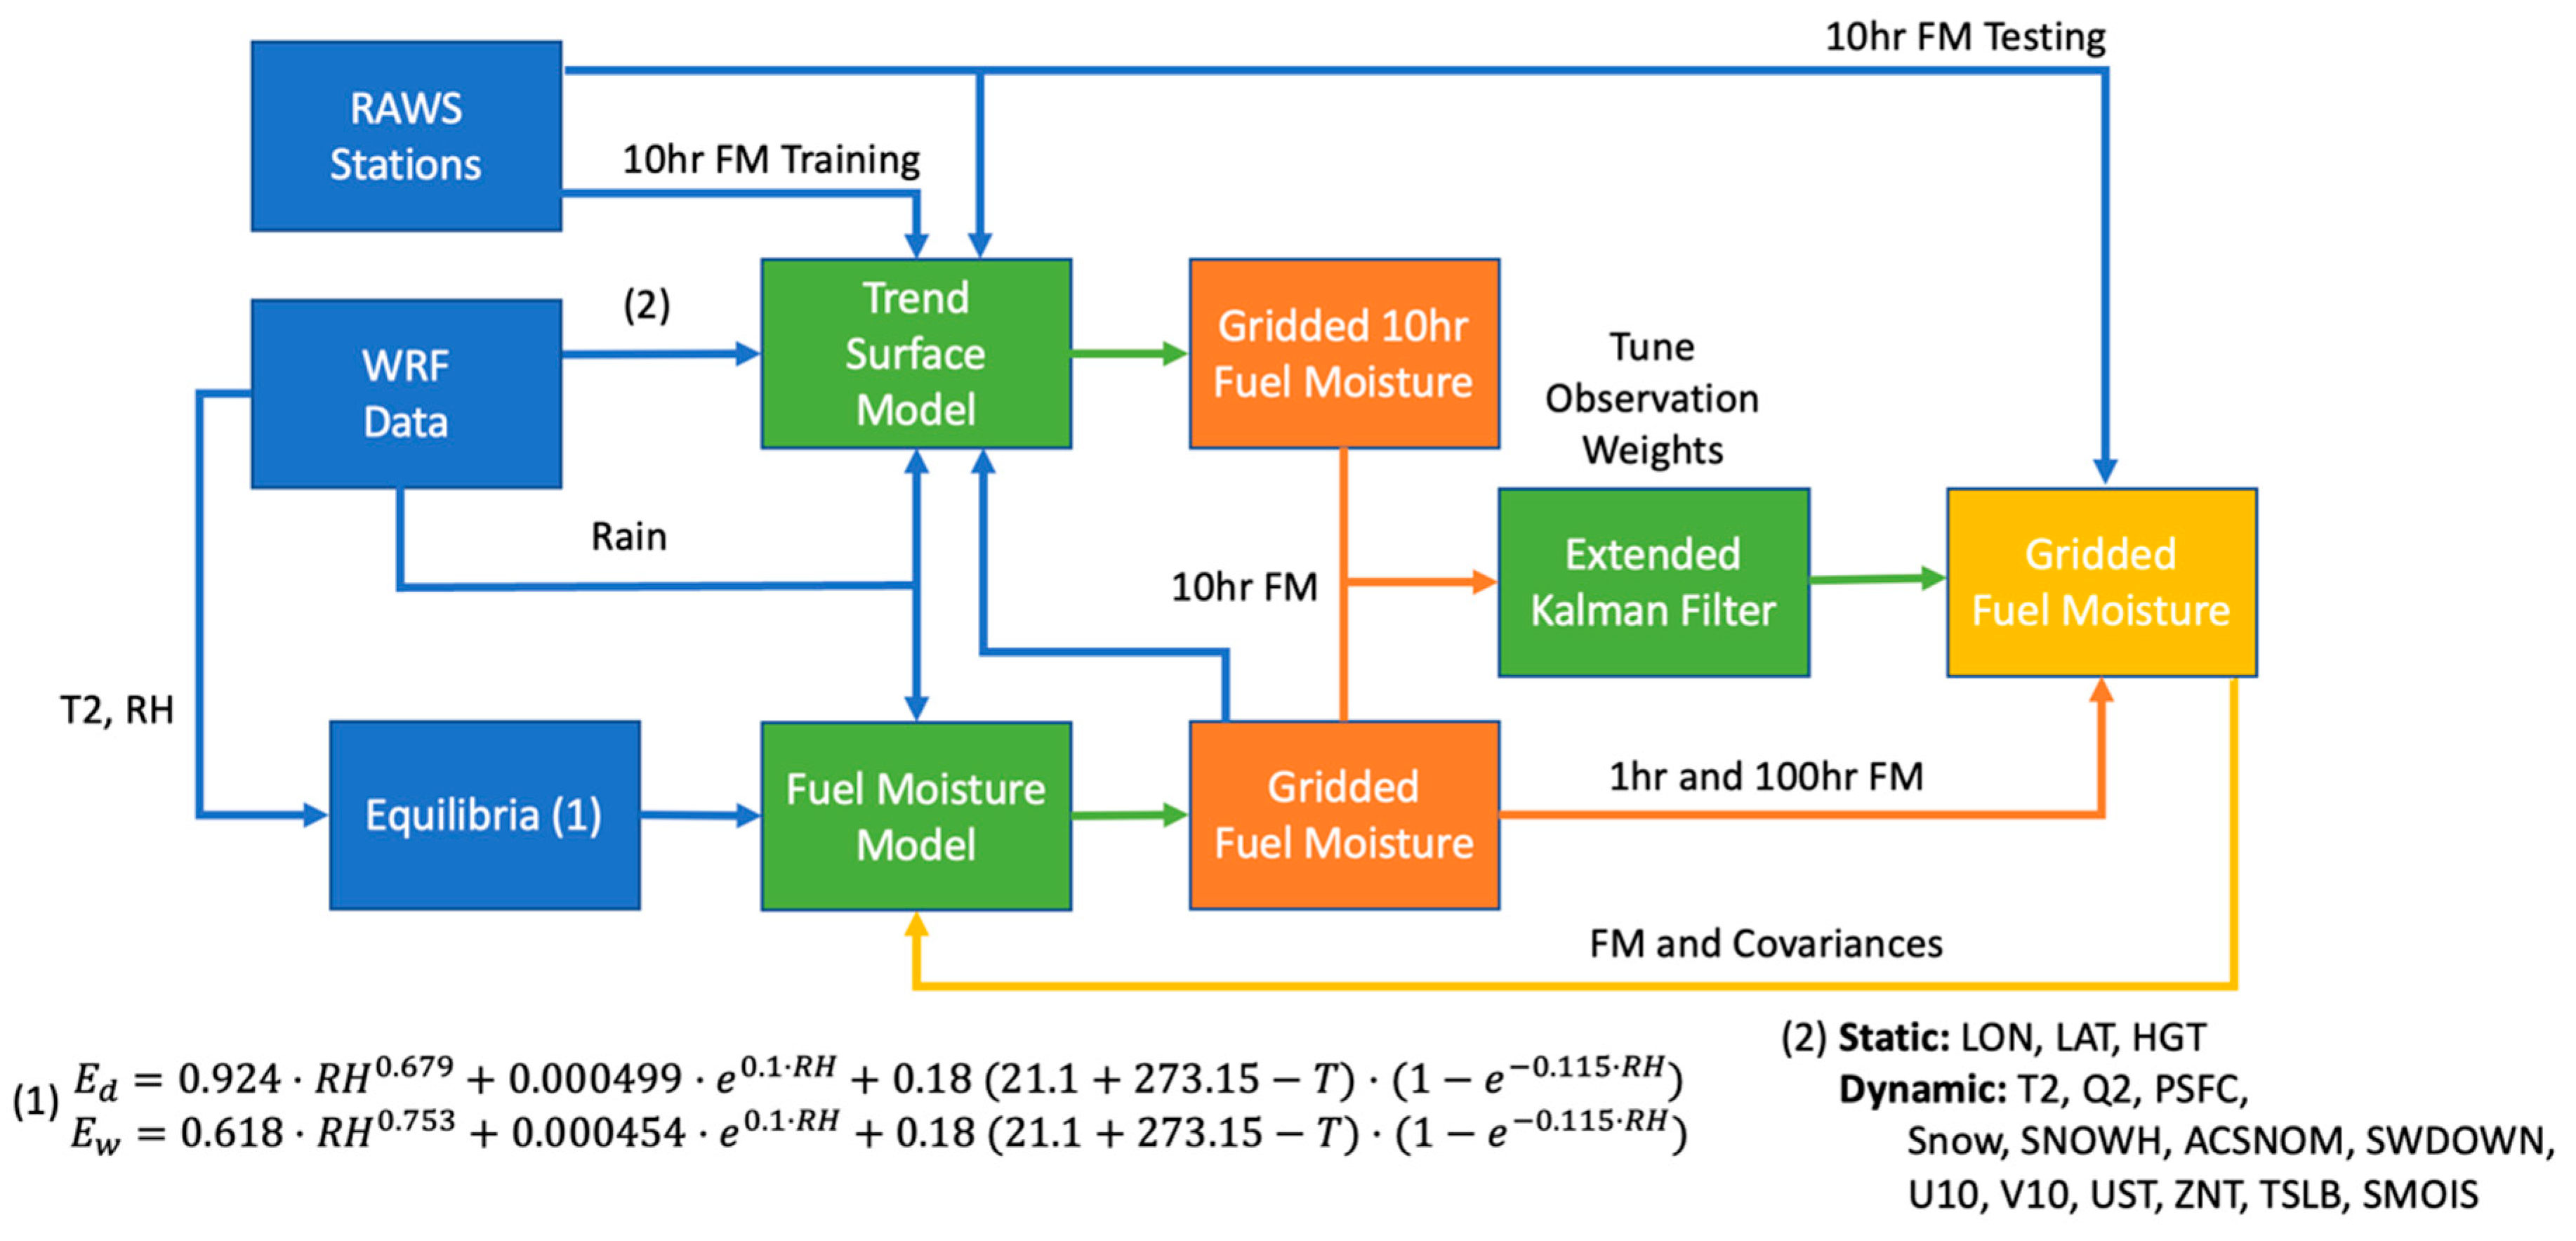
The fuel moisture data assimilation (FMDA) system used to generate the fuel moisture reanalysis dataset, depicted in
Figure 1, uses temperature, relative humidity, and rain to initialize or advance a time-lag fuel moisture model and combine the modeled fuel moisture with observations. The time-lag fuel moisture model has been extended to leverage tendencies estimated based on the observational data. Then, the FMDA system spatially interpolates observations from RAWS using a Trend Surface Model (TSM) leveraging multiple covariates to help with spatial fuel moisture distribution. After that, the fuel moisture model and the TSM results are blended together using an Extended Kalman Filter (EKF) to provide a gridded fuel moisture estimate based on the observations and the model. The system runs sequentially every hour, and the resulting fuel moisture values and the tendencies from one system iteration are used as the input in the next one. Furthermore, the tendencies learned during the data assimilation can be leveraged by the fuel moisture model, which is a part of the coupled atmosphere–fire model, WRF-SFIRE.
In the previous version of the FMDA by Vejmelka et al. [
26], the resulting fuel moisture values were very close to the ones from the time-lag fuel moisture model, with only minimal impacts from observations. The reason was that the process noise covariance that quantifies the uncertainty in the fuel moisture model was never properly estimated based on observations. This resulted in fuel moisture estimates that followed much closer the model than the observations. The process noise covariance in the Extended Kalman Filter (EKF) dominated the measurement noise, indicating unreliable measurements. To address this problem, cross-validation was performed to improve the data assimilation process by finding a better estimate of the uncertainty associated with the fuel moisture model. The data were selected using a random 80-20 split of all California stations measuring fuel moisture for the entire year 2020. The analysis of the testing score indicated that diagonal values of the initially guessed process noise covariance in the original system were underestimated by an order of magnitude. The optimization of these values allowed the system to fully harness the observational data, significantly improving its accuracy in estimating DFMC.
The RTMA weather product used as a data source for the original FMDA system has been validated against observations from RAWS. The results indicated that RTMA had difficulties in providing accurate local weather data, especially the amount of precipitation. Additionally, frequent RTMA system outages resulted in discontinuities in the input data that were problematic in the context of the reanalysis execution, which must be performed in a sequential mode due to the fact that the underlying fuel moisture model resolves only incremental changes in the fuel moisture. An additional limitation of the RTMA as a data source for the FMDA system stems from the relatively small set of available weather variables, limiting the number of weather covariates for the FMDA. To address these problems, RTMA has been replaced by a regional weather simulation. The hourly WRF-based 2 km high-resolution weather dataset, spanning from 2000 to 2020, included a much larger number of variables when compared to the RTMA. A subset of 25 variables were selected as covariates for the Trend Surface Model (TSM). The final covariates, including WRF naming conventions in parenthesis, are as follows: constant bias term, fuel moisture at the previous time step, elevation (HGT), longitude (XLONG), latitude (XLAT), rain (PREC_ACC_NC), air temperature at 2 m (T2), relative humidity computed at 2 m (RH), surface pressure (PSFC), snow (SNOW_ACC_NC), snow depth (SNOWH), snow melted (ACSNOM), soil temperature (TSLB) and soil moisture (SMOIS) at 4 levels, the two wind components at 10 m (U10 and V10), friction velocity (UST), roughness length (ZNT), and downward short-wave flux at the ground surface (SWDOWN). This extended set of covariates improved the TSM, with one caveat: the TSM does not have a unique solution if the number of observations is smaller than the number of covariates. In such cases, the TSM provided unreliable results, which contaminated fuel moisture estimates. Therefore, the system with the extended covariate set became sensitive to the observational data gaps (see the Discussion section for more details). To overcome this issue, whenever the number of observations was very limited (fewer than 10 observations for an hour in all of California), our new FMDA system would leverage the fuel moisture model to estimate fuel moisture without assimilating observational data. Additionally, the order of the covariates is important when the number of observations is larger than 10 but lower than the total number of covariates. In such a scenario, not all covariates will be utilized during assimilation. This is the reason why the covariates were organized by importance based on correlation with DFMC (as shown in the previous list of covariates). The WRF-based dataset significantly improved the rain representation and included the fuel moisture estimate generated using the Nelson model, which provided a reference point for the DFMC reanalysis product. Moreover, the fuel moisture model required relative humidity, so it was estimated from the WRF-based weather simulation outputs using the formulation from [
31] and added to the dataset.
Furthermore, a minor modification was performed to improve the robustness of the system. The observations with fuel moisture content larger than 50% were discarded from the assimilation and the validation. The reason for this is that larger observed values of DFMC proved to be often associated with measurement errors such as very sudden fuel moisture spikes, unrealistically high values, or constant elevated values unrealistically repeated over multiple measurement periods. Since the reanalysis product is targeted at producing high accuracy for the lower values of fuel moisture critical for fire spread and fire danger applications, preserving the accuracy in the lower fuel moisture end was a priority. Considering that this threshold is substantially larger than any fuel moisture of extinction (the fuel moisture content at which a fuel no longer supports combustion), we do not expect this filtering to have any negative impact on the final product. It is important to note that the fuel moisture time-lag model can still reach very large fuel moisture values in case of long rain events. This step only prevents nudging of the reanalysis values to low-quality observations.
To summarize, this study presents an extension of the previous FMDA system by (1) tuning the process noise covariance, (2) increasing the number of covariates integrating a new weather product, (3) creating a new strategy to deal with data scarcity, and (4) improving the quality control for fuel moisture observations.
3. Results
Our fuel moisture data assimilation (FMDA) system described in
Section 2 was used to create an hourly reanalysis dataset for California at 2 km spatial resolution from 2000 to 2020. The dataset includes fuel moisture estimates for 1-h, 10-h, 100-h, and 1000-h dead fuels. Henceforth, we will abbreviate hour with a letter h when talking about fuel moisture classes. The only fuel class directly assimilated was 10 h fuel moisture. However, other classes were affected by the data assimilation due to the equilibrium moisture content and rain saturation perturbations that were adjusted based on the observations. A cross-validation strategy was used for the whole of 2018 to validate the performance of the system. Also, an error analysis of the entire data range using all the observations was performed to analyze the quality of the product. All the results were compared to the Nelson model driven with the same weather data.
The cross-validation strategy for validating the system was performed by randomly dividing the data into 90% for training and 10% for testing for the whole of 2018. Then, the training set was used to assimilate the fuel moisture model using the EKF method at each hourly time step. The testing set was only used to compute the error between the results from the assimilation and observations. In other words, the system was tested on unseen data not used for the data assimilation. The training and testing datasets were used to assess the performance difference between the results with and without assimilated observations.
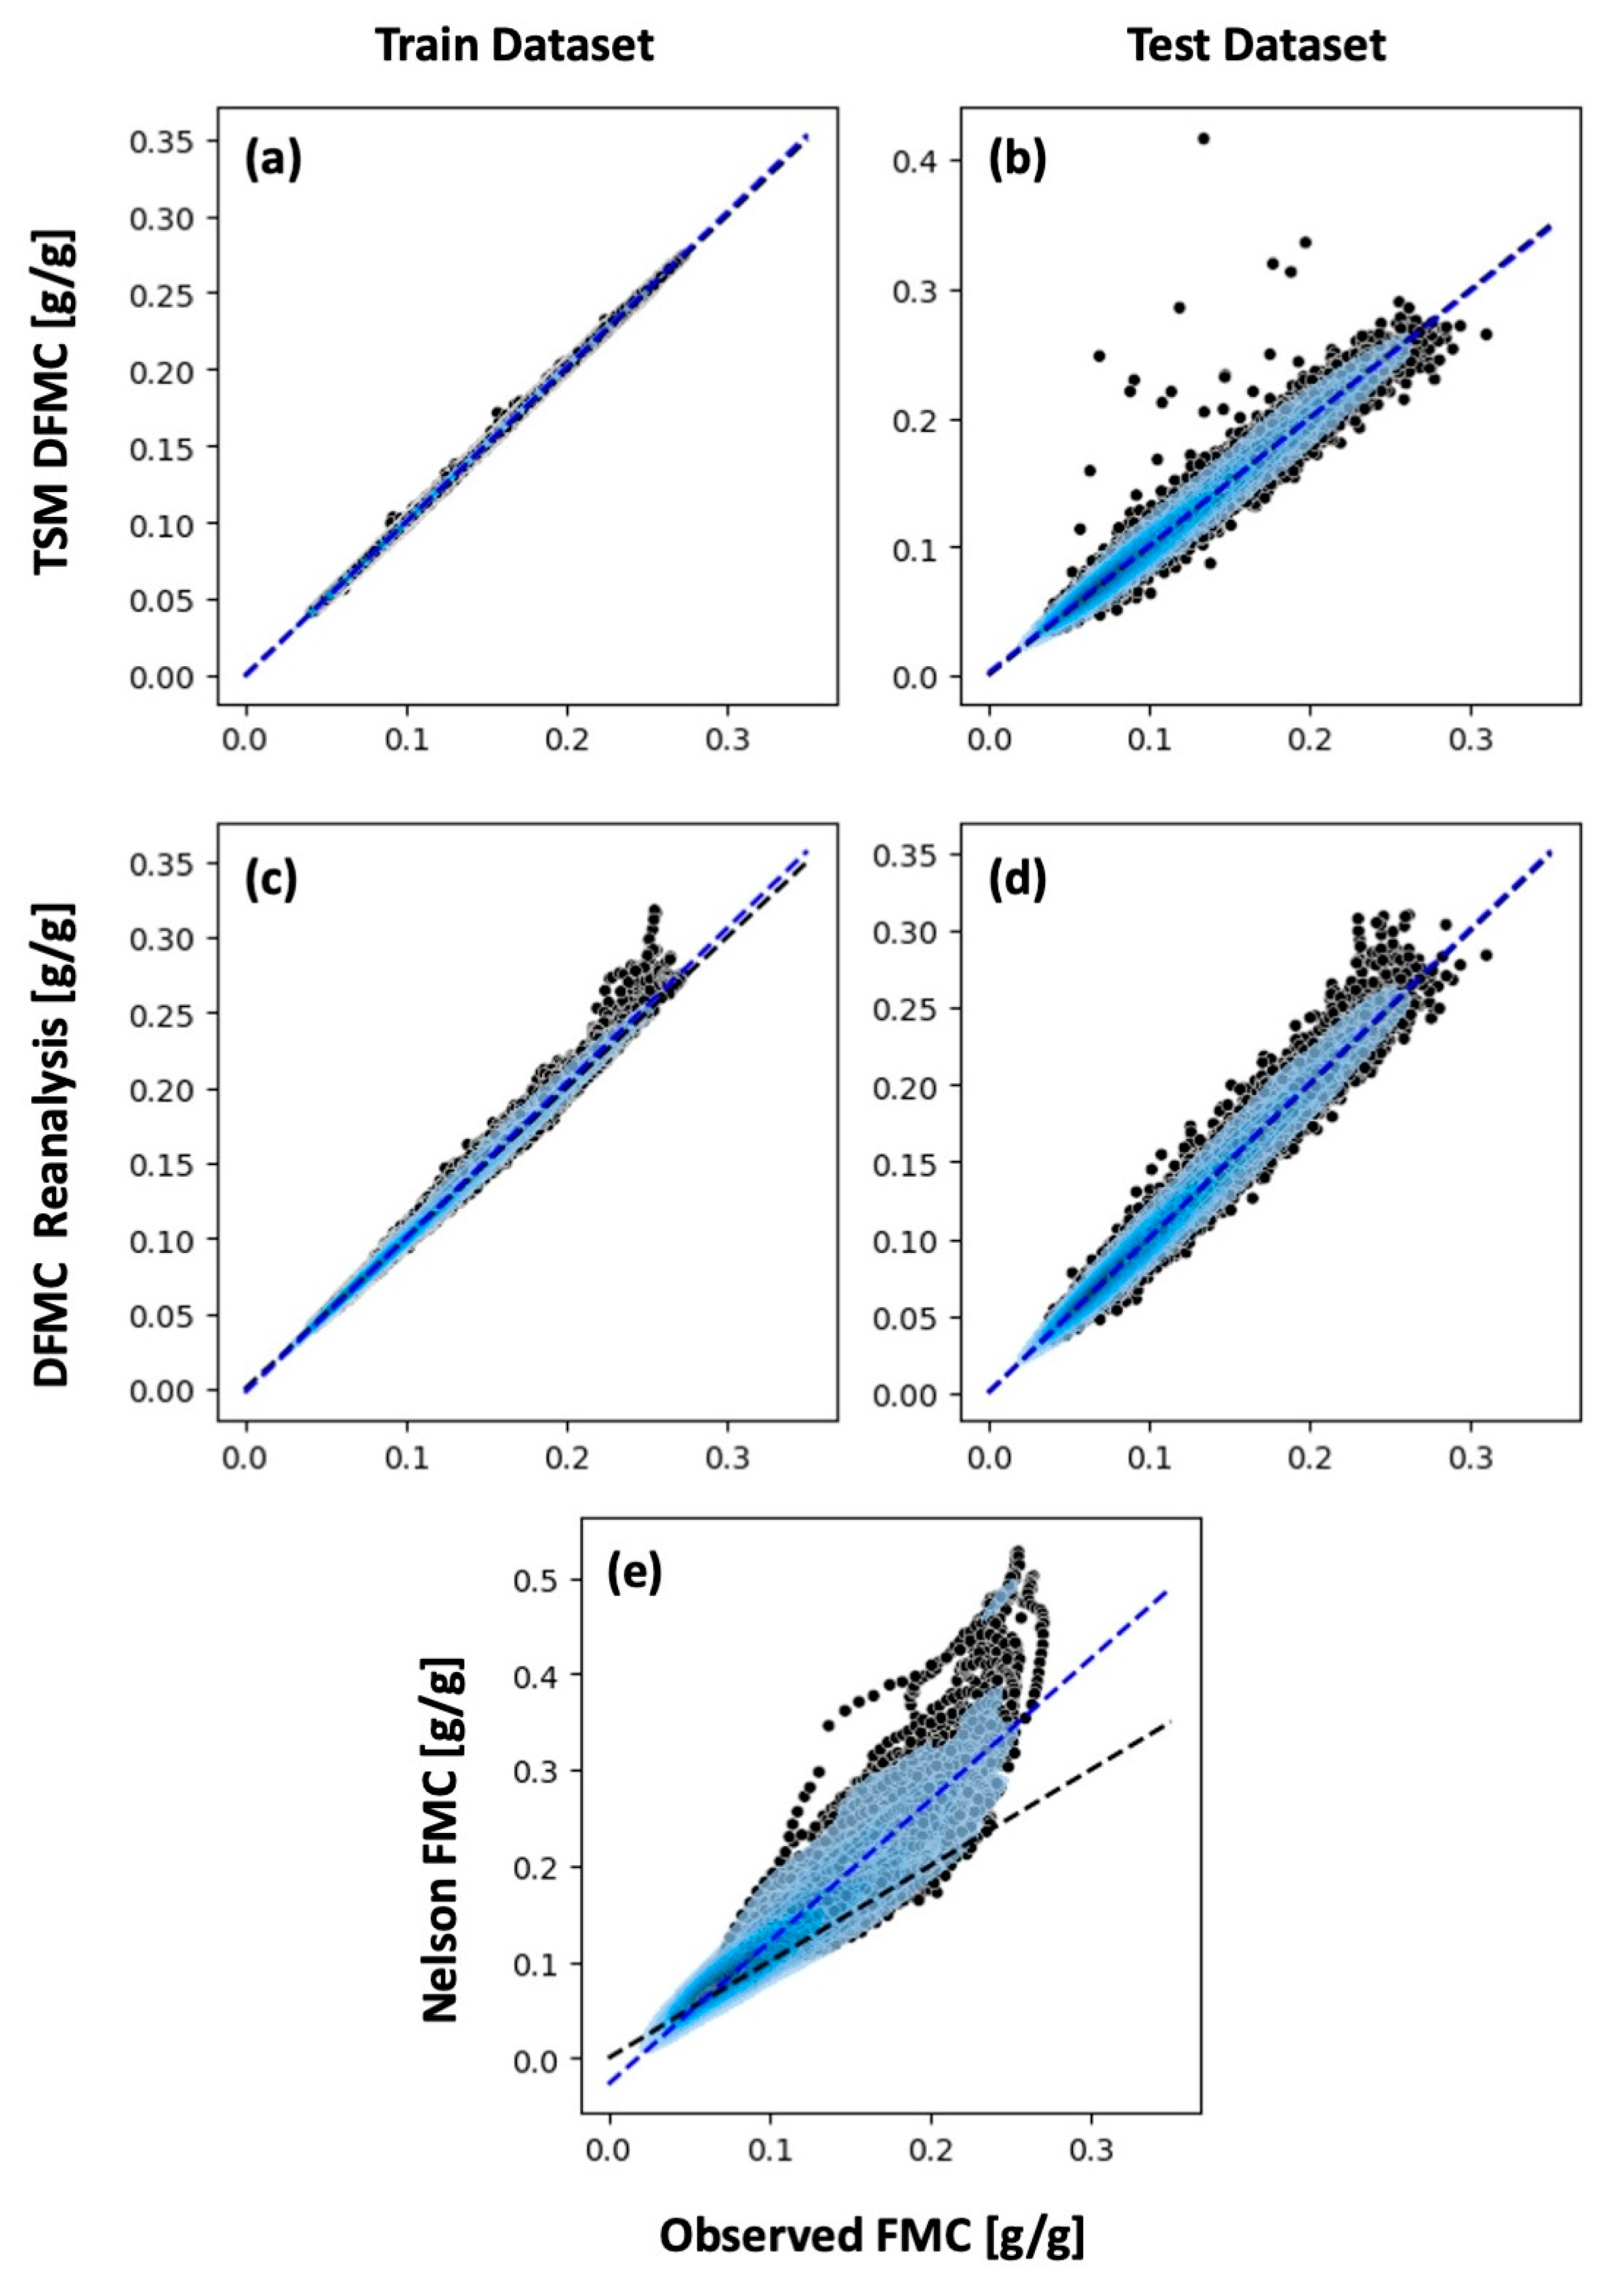
Figure 2 shows scatter plots comparing the TSM results (panels a and b) and the final DFMC reanalysis product that assimilates the fuel moisture model by the EKF (c and d), to the observations in the training (a and c) and the testing (b and d) datasets. For reference, this figure includes a similar scatterplot using the results from the Nelson model (panel e), not assimilating any data. The scatter plots in
Figure 2 use black dots to indicate the pairs of observed and estimated fuel moisture values, the dashed black lines indicate the perfect fit between observed and estimated values, the blue contours show the continuous probability density curve of the black dots estimated using the kernel density estimation (KDE) method, and the dashed blue line shows the linear best fit (in a least-squares sense) to the black dots. The best performance would be indicated by having the two overlapping lines with points located along them, as in
Figure 2a.
As shown in
Figure 2a, the TSM provided highly accurate estimations of the fuel moisture based on observational data. However, using the test dataset (
Figure 2b) as the input into the TSM led to a notable decline in performance, accompanied by an increase in uncertainty (larger blue area) and a small noticeable number of instances deviating significantly from the perfect fit line. The EKF used in the data assimilation successfully blended the results from the fuel moisture model with the ones coming from the TSM. Therefore, the final reanalysis product proved less prone to overfitting. This can be observed in
Figure 2c, showing that the train dataset performance slightly decreased compared to the TSM run (
Figure 2a). However, the DFMC reanalysis product was able to better generalize the estimation of fuel moisture content and significantly improved the performance when applied to the test data. This performance gain is evident when comparing the number of outliers located away from the perfect fit line (
Figure 2b compared to
Figure 2d). In the final scatter plot, the observed DMFC is plotted against the output from the Nelson model (
Figure 2e), driven by the same weather inputs as the TSM, as well as the reanalysis product. The Nelson model generally tended to overestimate fuel moisture content by about 10%, as indicated by numerous points above the perfect fit line (dashed black line). Additionally, Nelson’s linear polynomial fit of the points (dashed blue line) was significantly steeper compared to the perfect fit line (dashed black line), indicating reduced performance at higher fuel moisture values. The Nelson model also tended to diverge from the perfect fit line, while the TSM and the DFMC reanalysis data showed good alignment with the perfect fit line for all fuel moisture values.
Complementing the plots described in the previous paragraph, multiple statistics were computed and are displayed in
Table 1. The first three columns present error metrics for all cases shown in
Figure 2, comparing the final reanalysis product results for the year 2018 using both the training and testing datasets, alongside the error metrics for the Nelson model. The last two columns show the statistics computed across the whole analysis period from 2000 to 2020. As expected, the metrics of the DFMC reanalysis using the training dataset are always slightly better than those of the testing dataset. As shown above, the metrics of the TSM using the training dataset are slightly better than those of the DFMC reanalysis. Still, the DMFC reanalysis using the testing dataset scores slightly better than the TSM and outperforms the more complex Nelson fuel moisture model without data assimilation for all the analyzed metrics. Also, the Nelson model overestimated the fuel moisture content with a positive mean error of 2.7% for 2018 and 1.8% for the whole 2000–2020 period, while the mean error associated with DFMC reanalysis was much closer to zero (
for 2018 and
for the whole period). The final DFMC reanalysis error metrics for the training and testing datasets were very similar, suggesting that the system did not overfit the observations and suggested reliable error estimates for the entire analyzed period. Moreover, the final DFMC reanalysis product results show an over 2% improvement in the symmetric mean absolute percentage error compared to the Nelson model both for the year 2018 and the whole analyzed period. The error statistics for the entire climatology period of 2000–2020 (last two columns of
Table 1) closely align with those obtained from the 2018 cross-validation analysis. The Nelson model suffered from an overestimation indicated by a positive large mean error value, while the reanalysis product exhibited only a minor underprediction of fuel moisture content. The assimilation of fuel moisture observations resulted in the reduction in the mean absolute error from 5% (Nelson) to 3% (DFMC reanalysis), and the DFMC reanalysis product improved the symmetric mean absolute percentage error in 10 h fuel moisture estimates by over 2%.
The full data assimilation product for the years 2000–2020 has been analyzed in terms of temporal and spatial variability. Time series and map plots have been generated to assess the temporal and spatial pattern in the estimated DFMC error. The temporal variability is presented in
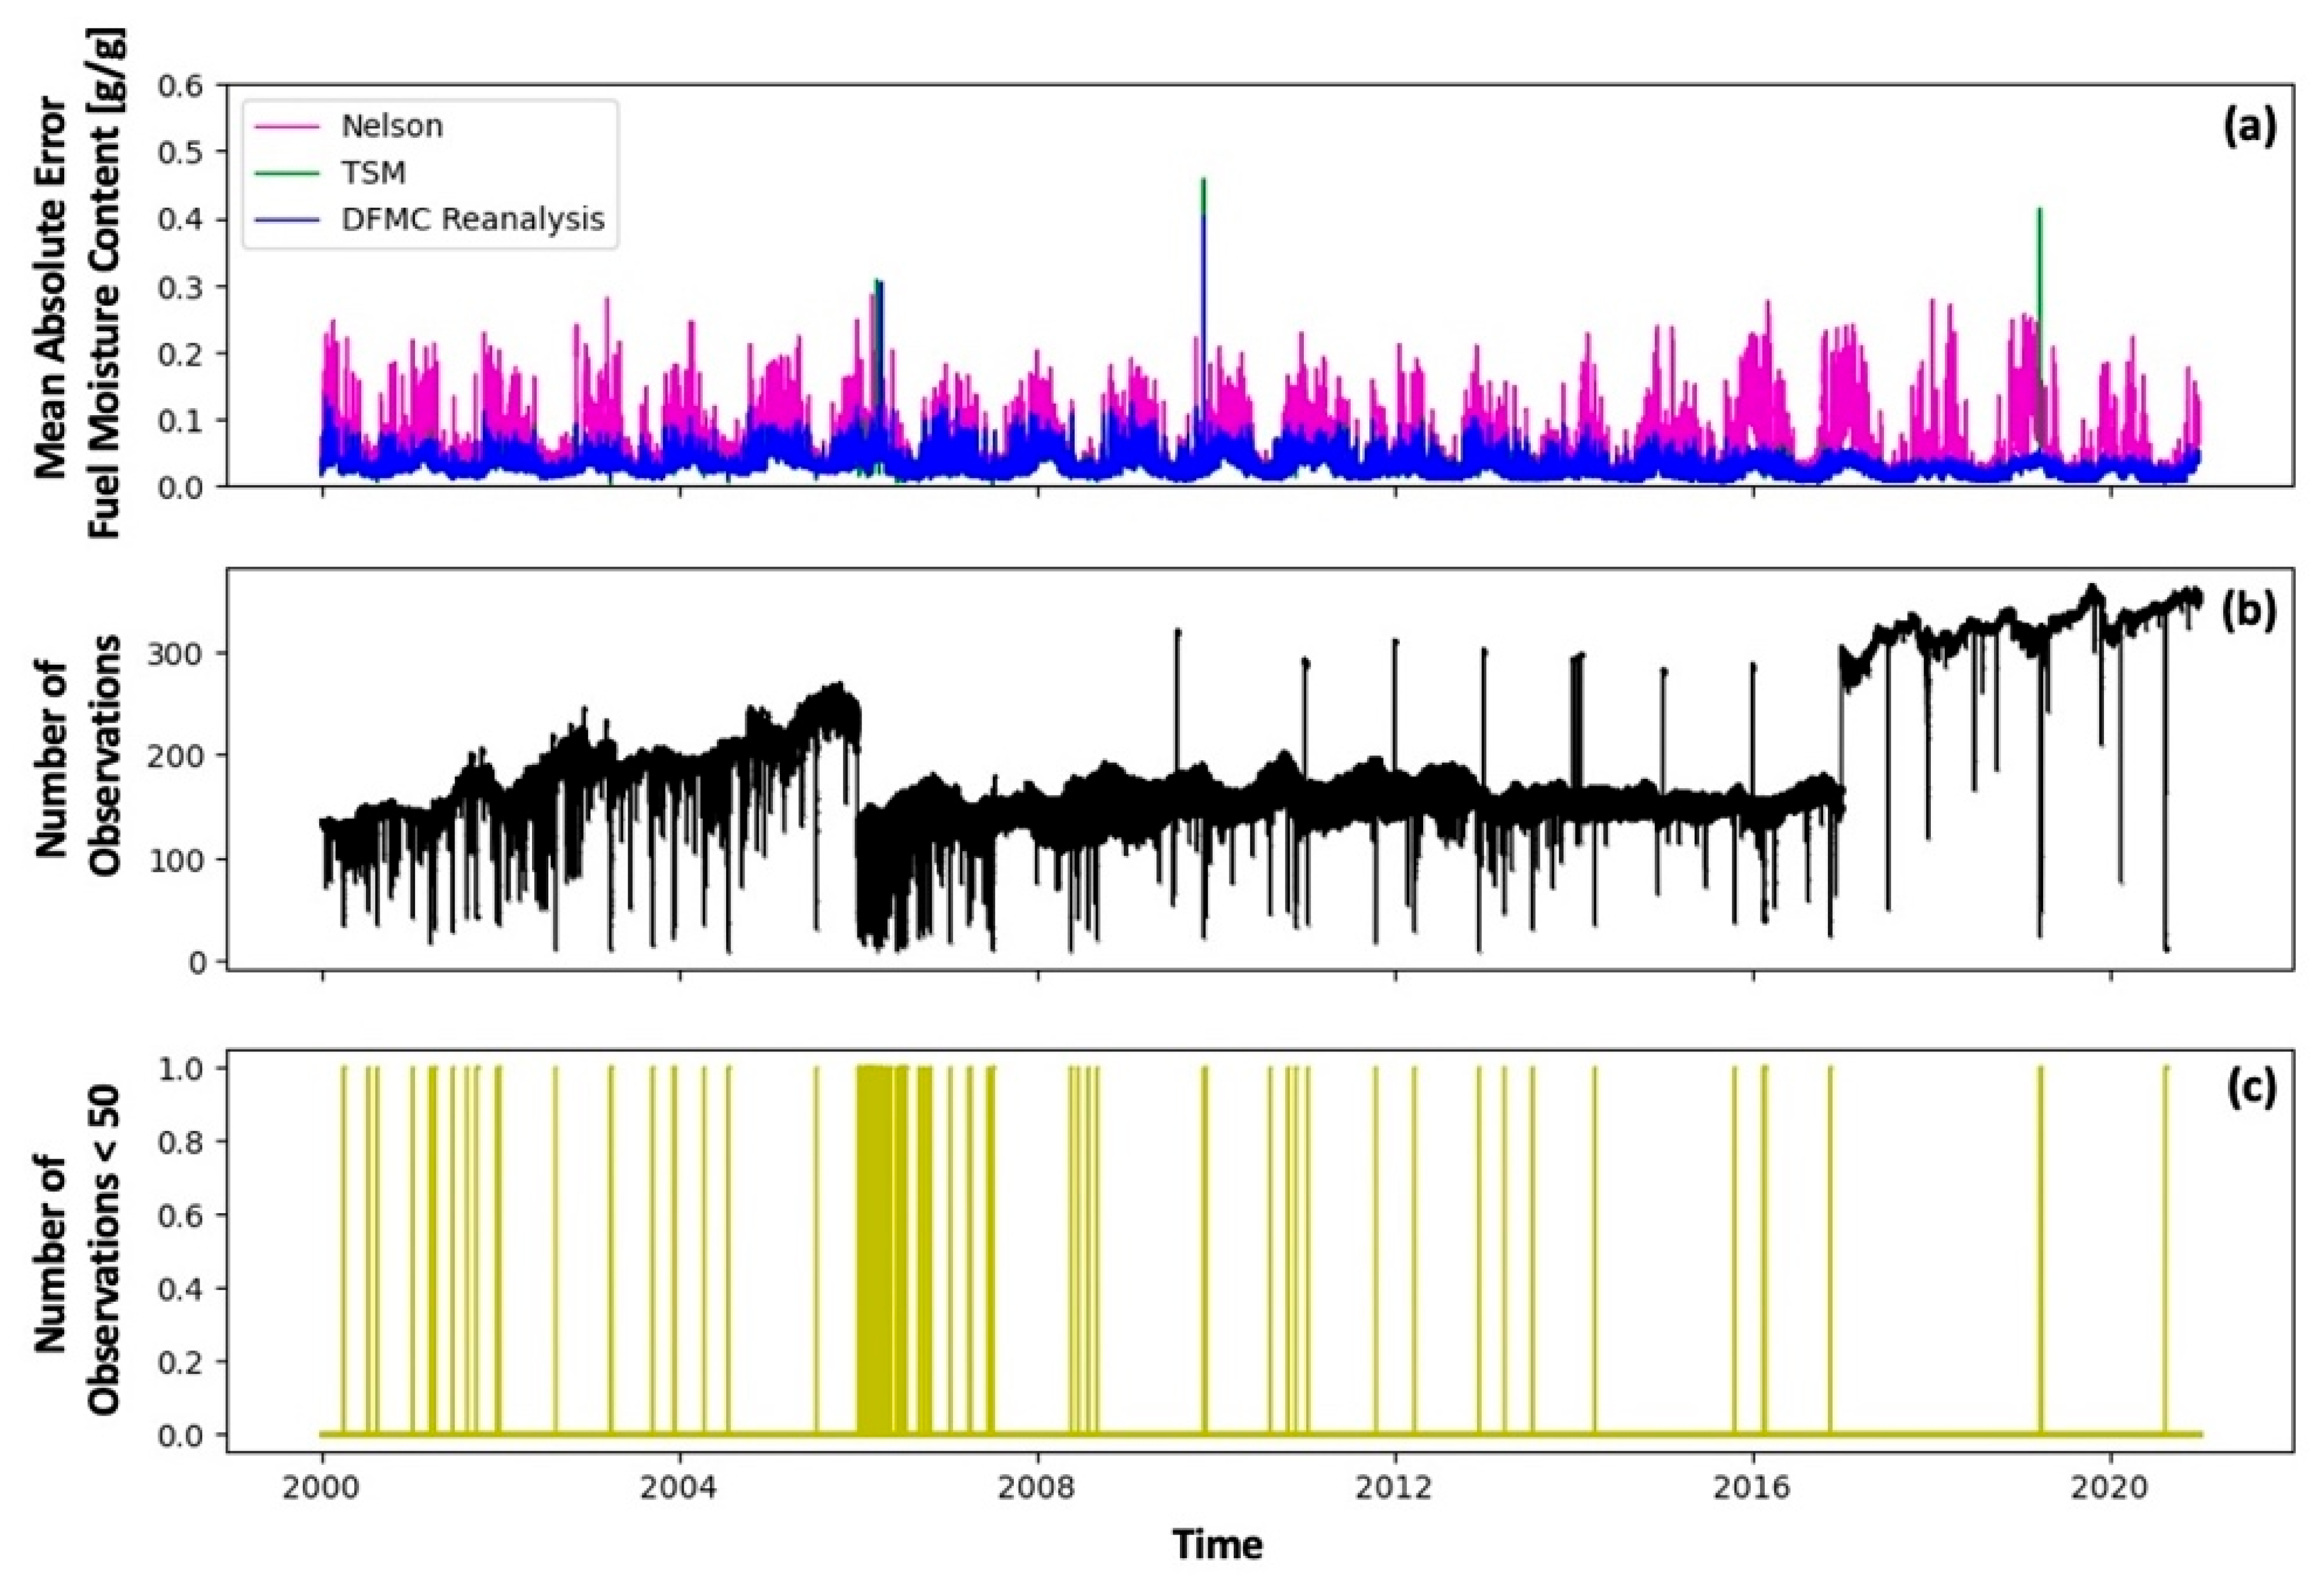
Figure 3, which includes three panels with time series for the entire analysis period.
Figure 3a illustrates the evolution of the mean absolute error in the fuel moisture content, revealing substantially lower errors for TSM (green line) and the reanalysis product (blue line) compared to the Nelson model (purple line). The order of plotting is the same as the legend, making any errors from the TSM larger than the reanalysis product visible. The number of available observations in California is shown in
Figure 3b. When comparing
Figure 3a,b, it becomes evident that the data assimilation is sensitive to the number of available observations, and the performance during multiple periods suffered from data scarcity. The last panel in
Figure 3c displays the periods with fewer than 50 available observations. These periods of a limited number of observations, negatively impacted the DFMC reanalysis product and resulted in worse performance as compared to the Nelson model. However, for some of these periods, like at the end of 2019, the DFMC reanalysis product was able to achieve a performance similar to that of the Nelson model. The sensitivity of the reanalysis product to the number of observations explains the improved product accuracy over the last decade due to improved RAWS fuel moisture observations coverage.
To assess the spatial pattern in the error in the DFMC estimates, the discrepancies between the estimated and measured 10 h dead fuel moisture have been estimated for the locations of RAWS reporting the DFMC observations.
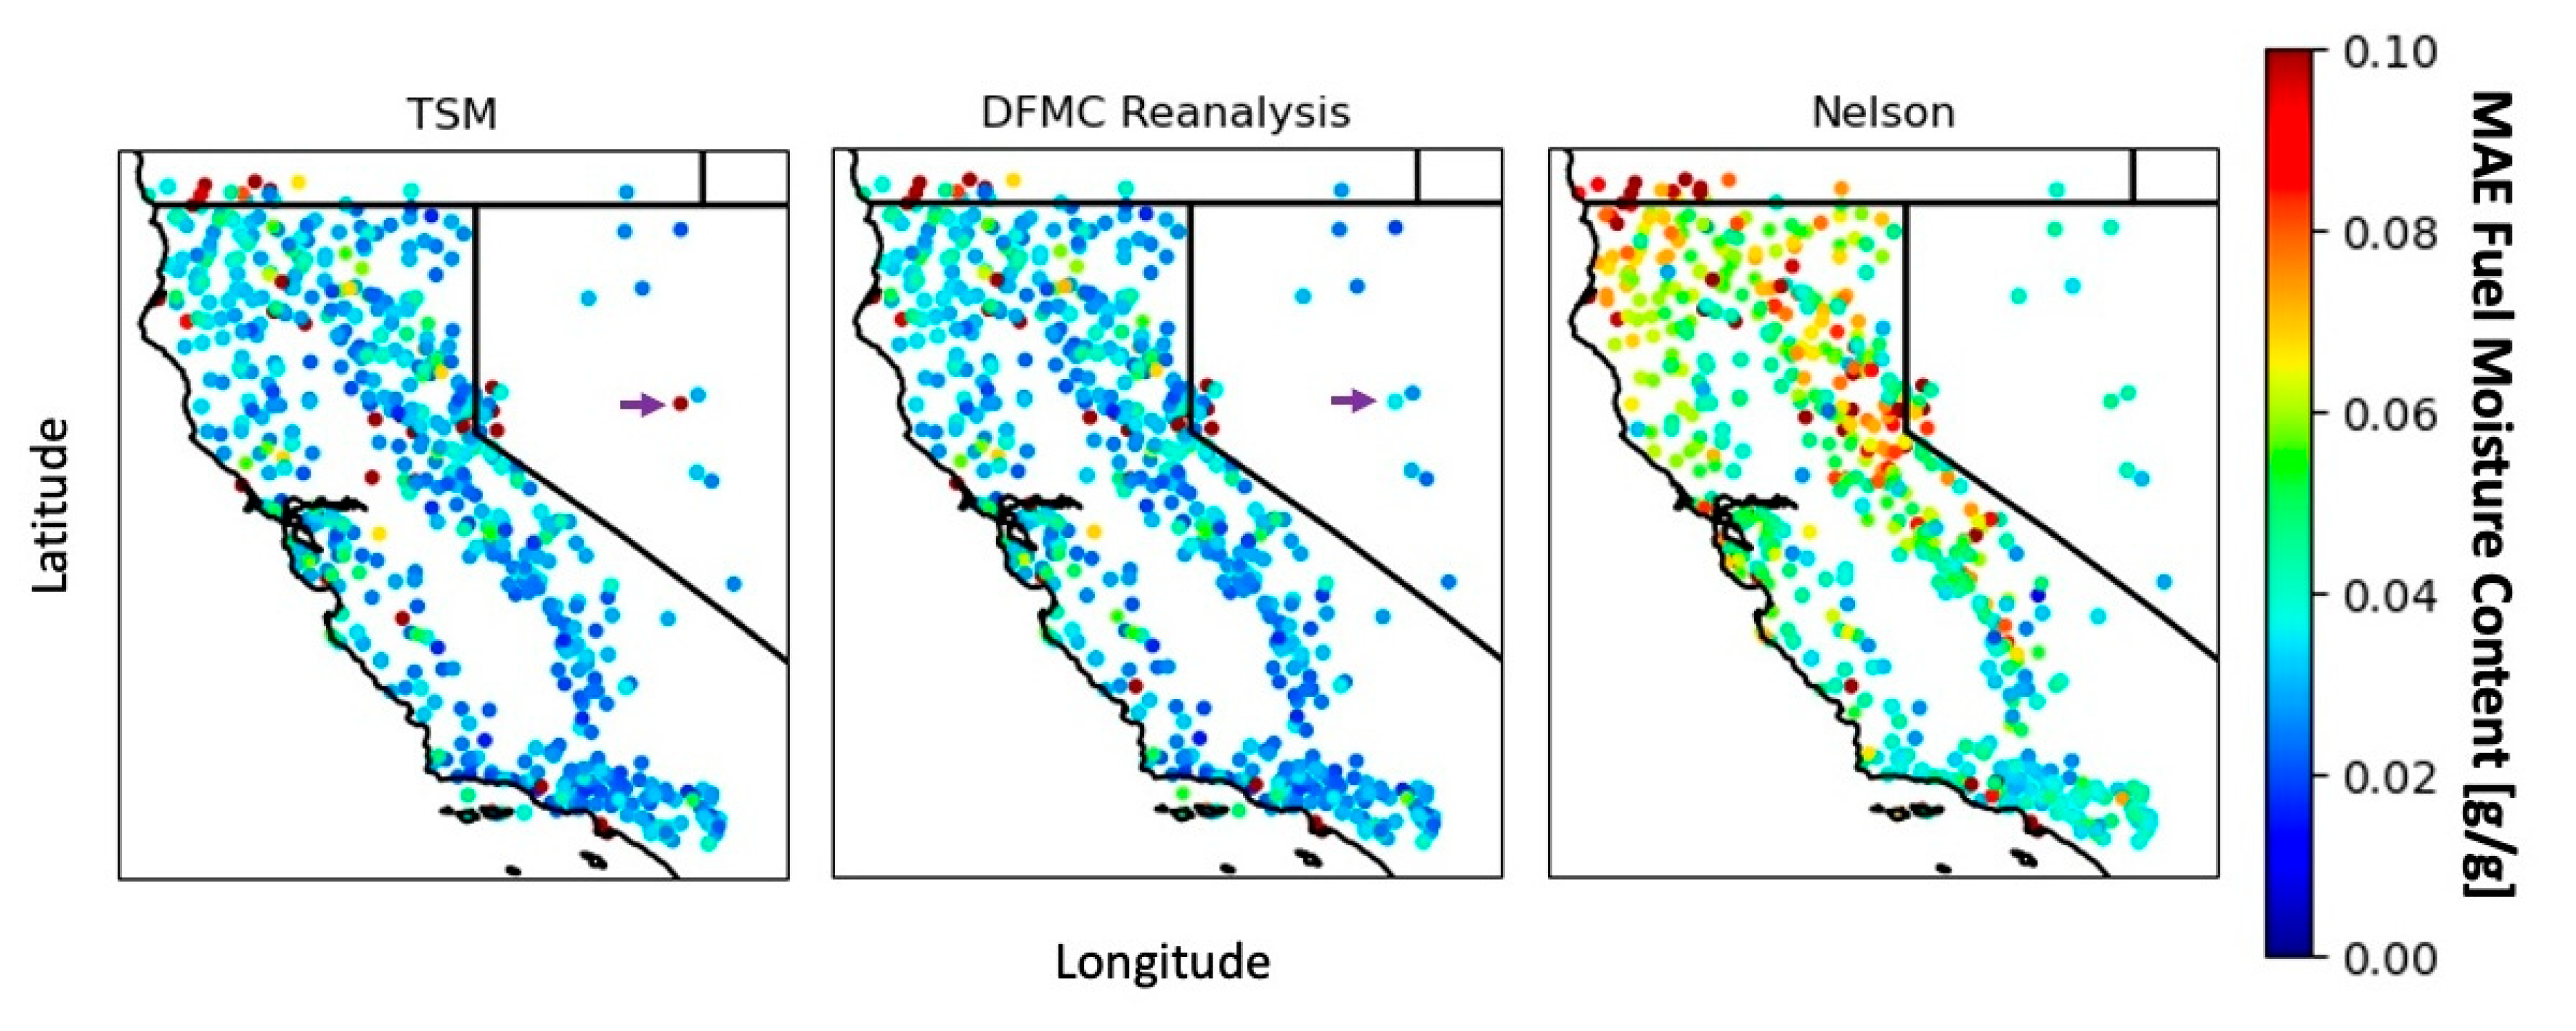
Figure 4 shows a spatial distribution of the mean absolute error for the entire geographical and temporal extent of the products for the TSM, DFMC reanalysis product, and the Nelson model. The errors observed in the Nelson model are significantly higher than in both TSM as well as our DFMC reanalysis. Although the performance of the TSM and DFMC reanalysis is very similar, the DFMC reanalysis did reduce the error at some specific RAWS locations. The station at the plot’s eastern side (pointed by a purple arrow) is a clear example of that. Analyzed locations with larger errors (red dots) primarily consisted of those harboring conflicting stations situated very close together, or stations encountering ongoing technical issues, which highlights the necessity for future improvements in observation quality control.
4. Discussion
This study introduces a method for generating a dead fuel moisture reanalysis product using a specially crafted fuel moisture data assimilation (FMDA) system. This FMDA system, driven by the high-resolution regional weather simulation and 10-h dead fuel moisture observations from RAWS stations, generated an hourly 2 km spatial resolution dead fuel moisture reanalysis dataset for the California region, covering years from 2000 to 2020. The regional climate data enabled increasing the number of covariates that can be used for the TSM from 6 to 25. After that, the process noise covariance was tuned using a cross-validation strategy to better estimate the error associated with the fuel moisture model. Finally, whenever fewer than 10 observations were available for a given hour in California, the data assimilation was bypassed, and the fuel moisture model estimates from the time-lag model were used.
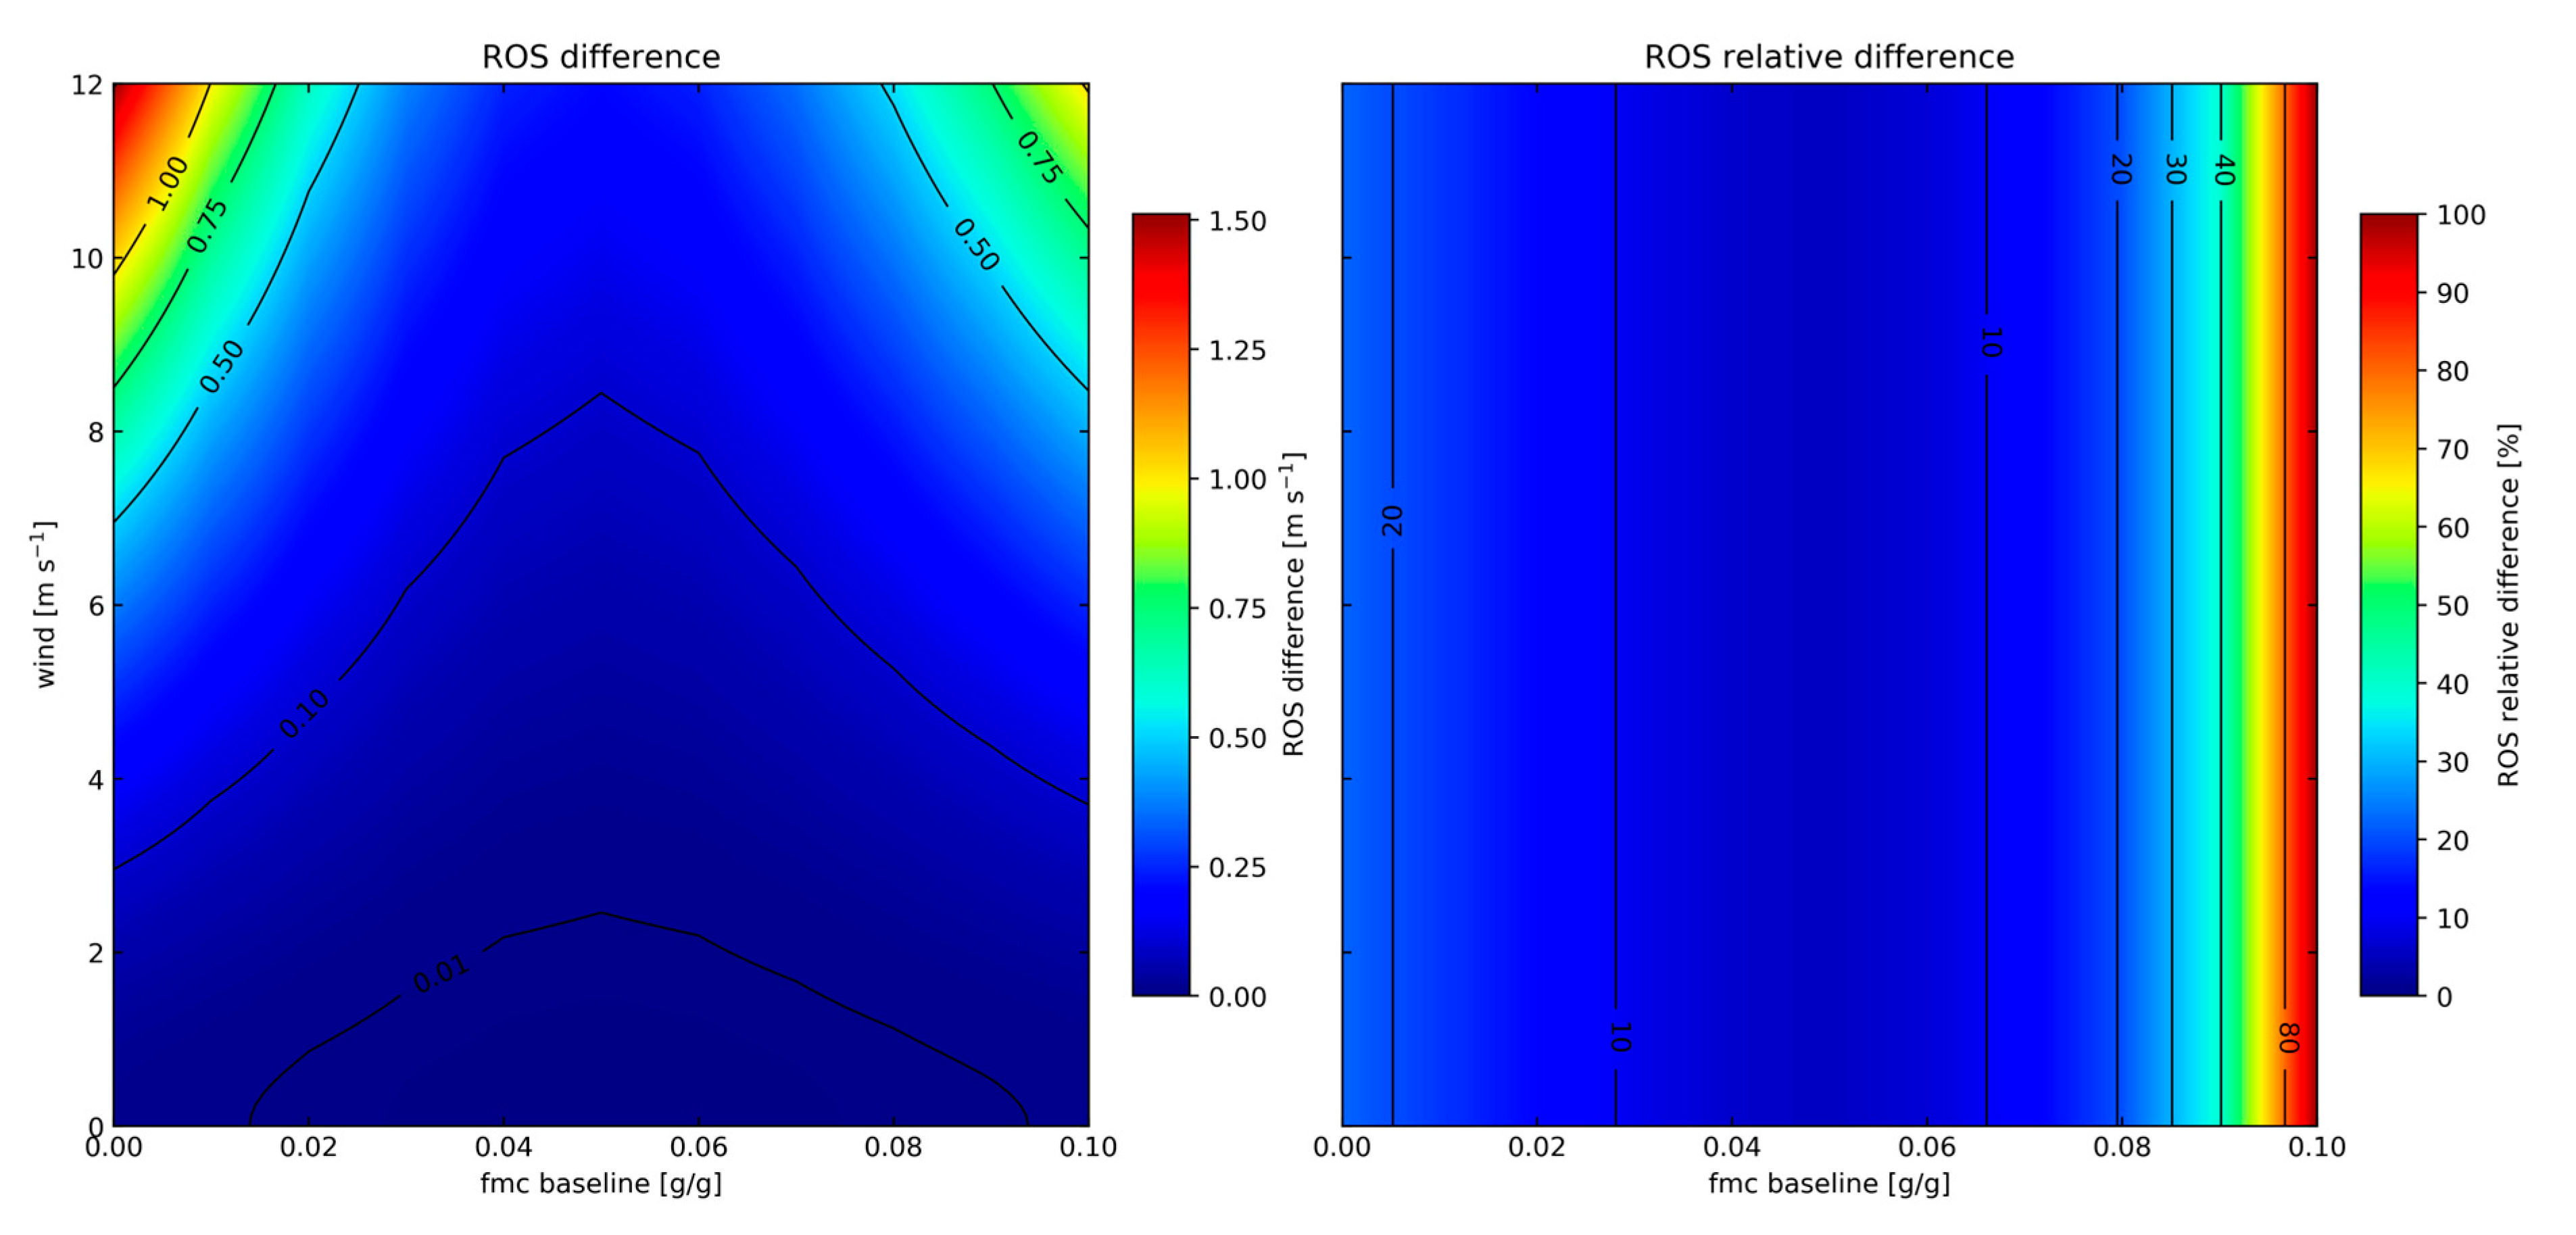
The modified FMDA system leveraging the simplified fuel moisture model based on the time-lag concept provides very accurate physical estimates of the fuel moisture content at a high resolution, providing a complementary dataset from existing products like the Canadian Forest Fire Weather Index System (CFFWIS). Furthermore, the system outperformed a much more complex fuel moisture model (Nelson model) executed without data assimilation. The final DFMC reanalysis product showed significant improvements compared to the Nelson model, evident in multiple error metrics, as well as the temporal and spatial error analysis, reaching an overall mean absolute error of about 0.03 g/g (3%), and the average error below 0.001 g/g (<0.1%). It has to be noted that such performance gains are significant. As seen in
Figure A1, decreasing the magnitude of the fuel moisture by 0.02 g/g can lead to an increase in the surface fire rate of spread by up to 25% (1.5 m/s) when using the Rothermel fire rate of spread model [
32] for grassy fuel (category 1 from the 13 Albini fuel types described in [
33]) burning under strong wind conditions (12 m/s). In marginal cases, an increase in fuel moisture of this magnitude can result in fire extinction if it surpasses the fuel moisture threshold required for fire sustainability, known as the fuel moisture of extinction. More details on the sensitivity of fuel moisture to fire spread can be found in
Appendix A.
All the observations from RAWS stations were used to assimilate the fuel moisture model as long as the reported DFMC was not larger than 50%. However, some stations suffered from errors associated with sensor failures, which were more difficult to filter out. In the future, it would be helpful to add more sophisticated quality control mechanisms to avoid feeding those erroneous observations into the data assimilation system.
Episodes of higher errors in the DFMC reanalysis product proved to be associated with the periods that had a small number of observations (typically fewer than 50 for the whole state of California). This was particularly evident prior to the year 2000. Therefore, although the original regional weather data started in the year 1989, the year 2000 was selected as the beginning of the fuel moisture reanalysis dataset to ensure high quality of the fuel moisture estimates. In order to extend the time coverage to years before 2000, a different data assimilation technique would be required to make the system less sensitive to the periods of sparse observations. A possible approach could be an adaptive selection of the covariates controlled by the number of observations. Each time the number of observations drops below the number of covariates, a feature selection technique could be used to select the best covariates to construct the TSM.
The analysis of the original FMDA system also demonstrated degraded performance in the simplified fuel moisture model during big rain events. To better capture the higher range of the fuel moisture, the rain parameters in the model would need to be tuned to better resolve fuel moistening.
Currently, the FMDA system only assimilates 10-h fuel moisture observations because of the limited data coverage for other fuel moisture classes. Sporadic measurements of 100-h and 1000-h fuel moisture content are collected using a process similar to that of live fuels (manually oven-drying samples). The system could be extended to incorporate those classes into the data assimilation system so that the observations of 100 h and 1000 h fuels are also incorporated. However, to accomplish that, a different technique would be needed to effectively assimilate these observations due to their spatial and temporal sparseness. Despite these challenges, our DFMC reanalysis product is still producing results that are far better than the widely adopted Nelson model.
