Article

Explosive Characteristics Analysis of Gasoline–Air Mixtures within Horizontal Oil Tanks

1
Petroleum, Oil and Lubricants Department, Army Logistics Academy, Chongqing 401331, China
2
Chongqing Key Laboratory of Fire and Explosion Safety Protection, Chongqing 401331, China
*
Authors to whom correspondence should be addressed.
Submission received: 21 November 2023 / Revised: 5 January 2024 / Accepted: 8 January 2024 / Published: 11 January 2024

Abstract

:
Horizontal oil tanks, like other oil storage containers, carry the risk of explosion when gasoline–air mixtures are ignited. With the widespread application of horizontal oil tanks in the petrochemical industry, attention to safety risks is increasing. However, currently, a limited amount of experimental research on such tanks exists. To explore the characteristics of gasoline–air mixtures combustion within the confined space of horizontal oil tanks, this study constructed a medium-scale simulated horizontal oil tank (L/D = 3, V = 1.0 m3) platform. By investigating the effects of different initial gasoline–air mixture volume fractions and ignition positions on explosion overpressure characteristic parameters, an analysis of the combustion characteristics was conducted. It was found that the most dangerous gasoline–air mixture volume fraction is 1.9% when ignited at the top position and 2.1% at the middle. It was also observed that the ignition position has a significant impact on the variation in explosion overpressure characteristic parameters, with ignition at the middle position resulting having a greater explosive force compared to ignition at the top position. Furthermore, using ignition at the middle position as an example, a study was conducted on the flame morphology characteristics at initial gasoline–air mixture volume fractions of 1.1%, 1.9%, and 2.7%. The conclusions from this research deepen our understanding of the explosion characteristics of different containers, providing theoretical insights for the safe storage and transportation of oil materials in horizontal oil tanks.

1. Introduction

Horizontal oil tanks, as common storage containers, have advantages over vertical oil tanks in terms of a lower center of gravity, higher stability, and ease of transportation and installation. Their structure and design provide good resistance to explosions, and the degree of attention to explosion risks is relatively small compared to other types of containers. As a result, there is relatively little research on explosion experiments specifically targeting this type of container. However, horizontal oil tanks are crucial containers for storing liquid fuels and chemical products. Widely utilized in the fields of petroleum, petrochemicals, and chemicals, their safety is of paramount importance.
Oil materials are hazardous, flammable, explosive, and volatile. The vapors generated from their evaporation can mix with air to form a combustible gasoline–air mixtures. When these mixtures reach a certain volume fraction, they can cause severe fires and explosions upon exposure to open flames, high temperatures, or static electricity. Throughout the processes of oil production, transportation, storage, and filling, incidents involving gasoline–air mixtures fires and explosions have consistently been ranked among the most destructive and expensive accidents [1,2]. For instance, on 13 June 2020, a major explosion involving a liquefied petroleum gas transport tank truck at the exit ramp of Wenzhou West on the Wenling section of the Shenhai Expressway in Wenling, Taizhou, resulted in 20 fatalities, 175 injuries, and direct economic losses of RMB 94.778 million. On 24 January 2004, at 20:45, a flash explosion suddenly occurred when a railroad tanker was unloaded at an oil depot in Jinan. This occurred when the railroad tanker, located at the far end of the railway, was nearly empty. When the crane valve was closed and the crane vertical air intake valve of the pipe was opened, a fireball emerged from the opening of the railroad tanker [3]. To prevent accidents, reduce casualties, and minimize economic losses, it is imperative to intensify research on the explosion characteristics of horizontal tank gasoline–air mixtures.
Numerous scholars have conducted research on confined spaces with different shapes and volumes. Wei and Du [4] conducted experimental studies on the explosion characteristics of a gasoline–air mixture in different–shaped confined spaces. Their research revealed that the pressure–time curves of pipelines (short and long pipes) are more complex than those of volume–type confined spaces (spherical and cubic containers). With an increase in the initial volume fractions of gasoline–air mixture, the explosion overpressure values and average pressure rise rates increased and later decreased. Zhang and Wang [5] conducted experiments on the explosion characteristics in sealed containers of different shapes and volumes (20 L spherical, 280 L rectangular, 1.15 m3 cylindrical, and 5.19 m3 cylindrical), and different shapes but the same volume (straight rectangular pipes and one–, two–, three–, and four–branched rectangular pipes). They found that under constant initial conditions, the maximum pressure rise rate and explosion index of spherical containers were greater than those of rectangular and cylindrical containers, respectively. When the container shapes were similar, an increase in the container volume resulted in a decrease in the maximum pressure increase rate and an increase in the explosion index. When the sizes of the test containers were similar but the shapes were different, the maximum overpressure and maximum pressure rise rate of the gasoline–air mixture explosions increased with the number of branches in the rectangular pipes. Cai [6] conducted experimental studies to simulate gasoline–air mixture explosions in vertical–domain oil tanks. They investigated the effects of the different initial volume fractions of the gasoline–air mixture, ignition positions, and liquid levels on explosion overpressure parameters and flame development. They found that the ignition positions and liquid levels considerably impacted the explosion overpressure parameters of the gasoline–air mixture. From the results of the aforementioned studies, current experimental research mainly focuses on vertical tanks, rectangular pipelines, cylinders, and spherical containers, while very few experimental studies have been carried out on horizontal tanks, and almost no experimental studies have been carried out on this type of mesoscale bench. Hence, it is essential to study the explosion characteristics of gasoline–air mixtures in horizontal tanks. Further, existing research has focused more on flammable gases, such as methane [7,8], acetylene [9], ethylene [10], coal dust [11], and methane/coal dust mixtures [12]. Limited experimental research has been conducted on gasoline–air mixture. Castellanos et al. [12] investigated the primary factors influencing the explosion process of methane/coal dust mixtures in a 20 L spherical standard container. Dong et al. [13] conducted experiments on methane–hydrogen–air mixture explosions in a 20 L spherical pressure vessel apparatus. All these studies found that flammable gases exhibited an increase in the explosion overpressure and pressure rise rate within a certain concentration range, followed by a decrease. Although gasoline–air mixtures explosions share some similarities with flammable gases, the complexity of their composition (possessing a greater variety of components) results in distinct explosion characteristics [14].
Previous studies explored the influence of different ignition positions on the explosion characteristics of premixed gases. Ferrara G. et al. [15] conducted experiments on pipeline releases and found that ignition in the middle position resulted in the greatest explosion overpressure destruction in containers with smaller spatial dimensions. Bauwens et al. [16], using the FM Global explosion test chamber, discovered that the ignition position, obstacles, and exhaust port size were all considerable factors affecting the maximum flame area, burning rate, and external explosion overpressure in the combustion chamber. Y. Cao et al. [17], using small cylindrical containers for experimentation, studied the effects of the ignition position and exhaust burst pressure on the pressure–time history of hydrogen–air mixed gas explosions and external flame propagation. The results showed that center ignition always resulted in the highest internal peak overpressure. Jin Guo et al. [18] investigated the venting behavior of hydrogen mixed gas with equivalence ratios ranging from 0.6 to 5.0 under three different ignition modes (rear, middle, and front ignition). They found that front ignition always resulted in the smallest internal and external overpressures, whereas center ignition generated the highest internal overpressure. The aforementioned studies demonstrated that the ignition position has a considerable impact on the explosion overpressure and flame behavior of different premixed flammable gases in different containers. When a horizontal oil tank is ignited at the middle position, the explosion pressure wave and turbulence exhibit a flattened lateral spread, distinct from other containers. Experimental research on this operating condition is equally indispensable.
Based on the aforementioned findings, the volume and shape of the experimental container and ignition source position considerably influence the explosion characteristics. In the industrial production, storage, and transportation of oil, oil leakage and volatilization are prone to hazardous situations. Any slight negligence could potentially lead to a fire or explosion, posing a safety hazard [19]. Based on this premise, we first investigated the influence of different initial gasoline–air mixture volume fractions and ignition positions on the explosion overpressure characteristic parameters of horizontal oil tanks and analyzed the detonation characteristics. Subsequently, the flame morphology was studied for low, medium, and high initial gasoline–air mixture volume fractions when ignited at the middle position. Finally, a comparative analysis of explosion overpressure characteristic parameters was conducted, revealing significant effects of different initial gasoline–air mixture volume fractions and ignition positions on these parameters and flame morphology. The purpose of the experimental research is to provide theoretical references for gasoline–air mixtures safety protection and equipment research to ensure the utmost safety in storage and transportation processes.

2. Experimental Configuration

2.1. Experimental System

The simulated horizontal oil tank had a weight, volume, total length, and diameter of 1010 kg, 1.0 m3, 2467 mm, and 800 mm, respectively, as shown in Figure 1. The main body was made of Q345R steel, while other pressure–bearing components were made of 16MnII. The design pressure was 2.5 MPa, and the operating pressures were 2 MPa each. It was equipped with 11 M20 × 1.5 threaded holes used in installing pressure sensors, ignition devices, and valves. Additionally, there were three DN100 mm sight glasses on the side for observing flame morphology after an explosion. The experimental system comprised a gasoline–air mixture supply system, high–energy non–interference igniter, GXH–1050 infrared analyzer, high–speed camera, dynamic data acquisition system, synchronous trigger controller, and the simulated horizontal oil tank. Experimental data were collected using a Dong Hua Testing DH8301 dynamic data acquisition system and a ZXP series of high–frequency transient pressure sensors. The schematic is shown below.

2.2. Experimental Conditions

The experimental medium used was a 92–octane automotive gasoline–air mixture, with gasoline as the national VI. Although preliminary experimental research found that the most dangerous gasoline–air mixture explosion volume fractions vary slightly in different confined spaces, the majority are approximately 1.7%. Therefore, in this study, initial gasoline–air mixture volume fractions were set within the range of the upper and lower explosive limits. Two different typical ignition positions were selected for the experiment and placed at the top (A12 in Figure 2) and middle (A7 in Figure 2). Each ignition position was tested for gasoline–air mixture explosions under lean and rich conditions. Nine initial gasoline–air mixture volume fractions (1.1%, 1.3%, 1.5%, 1.7%, 1.9%, 2.1%, 2.3%, 2.5%, and 2.7%) were selected. Each test group was equipped with 3 pressure sensors in the range of 0–2 MPa, the non–linear error was not greater than 0.25% FS, the repeatability and hysteresis error were not greater than 0.1% FS, and the supply voltage was 5 V, allowing an overload of 150%. IPT1 (A3 in Figure 2), IPT2 (A4 in Figure 2), and IPT3 (A13 in Figure 2) were the pressure measurement points for the A12 ignition position, whereas IPT4 (A3 in Figure 2), IPT5 (A12 in Figure 2), and IPT6 (A13 in Figure 2) were the pressure measurement points for the A7 ignition position. A high–speed camera was placed in the middle position on the side of the container (directly facing A7) to record the flame behavior, with a synchronous trigger controller set to synchronize pressure with flame images. When igniting at the top position, the ignition source A12 was set as the origin with coordinates (0, 0, 0). As shown in Figure 2b, the coordinates of the three sensors are A3 (645, 400, 0), A4 (1245, 400, 0), A13 (2467, 0, 0). When igniting at the middle position, the ignition source A7 was set as the origin with coordinates (0, 0, 0). As illustrated in Figure 2d, the coordinates of the three sensors are A3 (0, 400, 0), A12 (−1233.5, 0, 400), A13 (1233.5, 0, 400).
The GXH–1050 infrared analyzer was set at a flow rate of 0.5 L/min, ignition voltage of 1500 V, and ignition energy of 1.5 J. The pressure sensor used was the ZXP610 model, with a measurement range of 0–2 MPa. A high–speed camera was configured to capture images at a frame rate of 500 frames per second (fps). We set the data sampling frequency of the dynamic data acquisition system (DH8301) to 100 k, utilizing Origin 2021 software (version 9.8.0.200). The adjacent averaging method and Savitzky–Golay method were employed for noise reduction processing on the explosive overpressure data. The mixture was generated through the gasoline–air mixture supply system, allowing the mixture to circulate within the test stand for at least 3 min. Subsequently, the circulation was halted, and the gasoline–air mixture volume fractions were adjusted to the desired target value. This target value was maintained for at least 1 min, following which all valves on the experimental stand were closed, sealing the confined space. These operations aimed to achieve a uniform gas mixture. Upon completion of the explosion experiment, all valves were reopened, and exhaust gases were purged using a fan for no less than 5 min. Subsequently, a resting period of no less than 30 min ensued to ensure the complete exhaustion of exhaust gases. The stand was allowed to fully cool down before proceeding with the next set of experiments.
To prevent unexpected incidents and ensure the accuracy of the experimental results, each experiment was repeated thrice, as described in the literature [20]. The experimental settings and initial conditions are presented in Table 1.

3. Explosion Overpressure Analysis in a Horizontal Oil Tank When Ignition Occurs at the Top Position

The explosion of a gasoline–air mixture involves rapid physical and chemical changes, instantly releasing a significant amount of energy accompanied by a tremendous sound. Through experimental research, the behavior of the explosion can be reflected through the characteristic parameters of explosion overpressure. This chapter primarily analyzes the developmental patterns of numerical values, such as the maximum overpressure peak ( p m a x ), time to reach the maximum overpressure peak ( t m a x ), average pressure rise rate ( v a v e ), and explosion power index ( E m a x ) under different volume fractions.

3.1. Effect of Different Initial Gasoline–Air Mixture Volume Fractions of Hydrocarbons on the Overpressure Characteristics of Explosions

To some extent, the variation pattern of the explosion overpressure values reflects the development process of the explosion. Figure 3 shows the explosion overpressure time series curves for nine different initial gasoline–air mixture volume fractions (YCH) when ignition occurs at the top position. The development of the explosion overpressure shows an initial increase followed by a decrease. In other words, as YCH continues to increase, the overpressure peak increases and later decreases.
As shown in Figure 4, we conducted a detailed analysis of the explosion overpressure time series curves for three typical initial gasoline–air mixture volume fractions (YCH) of 1.1%, 1.9%, and 2.7%. The overpressure time series curves for different YCH values exhibit similar trends. As YCH continued to increase, the time required to reach the peak explosion pressure initially decreased and later increased. The times required to reach the peak explosion pressure for the YCH values of 1.1%, 1.9%, and 2.7% were 1.482, 0.547, and 4.178 s, respectively. This indicates that the time required for YCH = 1.1% was 171% longer than that for YCH = 1.9%, while the time required for YCH = 2.7% was 664% longer than that for YCH = 1.9%. This indicates that the effects of the lean and rich mixtures on t m a x were considerable, while the explosion developed rapidly at YCH = 1.9%. At YCH = 1.9%, when the explosion shockwave passed through the pressure sensor, the explosion overpressure rapidly increased and reached its maximum value of 903.38 kPa at 0.547 s. This was the maximum explosion overpressure obtained when igniting the top position of the experimental container with the most hazardous gasoline—air mixture volume fraction. At this point, the time required was the shortest and the peak value was the highest, thereby indicating that YCH = 1.9% was closer to the stoichiometric concentration, wherein the chemical reaction was most intense. After the explosion shockwave passed, the explosion overpressure gradually decreased. When YCH was low (high), the explosion inside the tank was characterized by lean (rich) combustion. At YCH = 1.1%, the maximum explosion overpressure was 1.482 s with a peak value of 543.05 kPa. At YCH = 2.7%, the gasoline—air mixture ratio increased, thereby intensifying the oxygen consumption and resulting in a longer time to reach the maximum explosion overpressure of 4.178 s, with a peak value of only 492.98 kPa. When compared to YCH = 1.9%, the peak value at YCH = 1.1% was 60% of that at 1.9%, and the peak value at YCH = 2.7% was only 55% of that at 1.9%. At this point, it took longer to reach the explosion overpressure value and the peak value was smaller [21], indicating that the chemical reaction was not as intense and that the severity of the explosion was somewhat reduced.
The maximum overpressure peak value is an important parameter that characterizes the explosive destructive capability of a gasoline–air mixture. This value can be obtained experimentally, while the average rate of the increase in pressure can be calculated by dividing the maximum overpressure peak value by the time required to reach that value. Experiments have found that both the flammability index [5,22,23] and explosive power index [24] can characterize the explosive destructive strength. Based on the characteristics of the experimental research, we selected the explosive power index as an important parameter for studying explosive strength. This can be obtained by multiplying the maximum overpressure peak value by the average rate of the rise in pressure.
The average rate of the rise in pressure can be expressed using Equation (1) [25], which mainly reflects the intensity of the changes in the explosion overpressure:
v a v e = d p d t a v e = P m a x t m a x
The explosive power index can be used to characterize the magnitude of the explosive destructive strength and assess the consequences and safety of gas explosions, as expressed in Equation (2) [26]:
E m a x = p m a x × v a v e
By performing statistical and data analyses on the experimental data, the characteristic parameters were obtained, as presented in Table 2.
To provide a more intuitive representation of the trends in terms of reaching the maximum overpressure time, t m a x , maximum overpressure, p m a x , average rate of pressure rise, v a v e , and explosive power index, E m a x , of the initial gasoline–air mixture volume fractions, YCH, Figure 5 illustrates the variation curves of t m a x ,   p m a x ,   v a v e ,   a n d   E m a x .
As shown in Figure 5a, with an increase in YCH, t m a x exhibits a trend of initially decreasing and then increasing. When the initial gasoline–air mixture volume fraction is 1.5–2.1%, the explosion overpressure reaches its peak value in 0.70 s. At YCH = 1.9%, the time to reach the maximum explosion overpressure is the shortest (0.547 s), while at YCH = 2.7%, owing to lean oxygen combustion, the limited oxygen for the reaction results in the longest time to reach the maximum explosion overpressure. As shown in Figure 5b, with an increase in YCH, p m a x increases and later decreases. Between 1.1% and 1.9% YCH, p m a x increases with YCH, thereby attaining its maximum at YCH = 1.9%. However, between 1.9% and 2.7% YCH, p m a x decreases as YCH increases, as shown in Figure 5c. With an increase in YCH, v a v e increases and later decreases, thereby attaining its maximum at YCH = 1.9%. Figure 5d shows the curve of the E m a x variation with different YCH values. As YCH continues to increase, the trend in the E m a x change increases and later decreases. p m a x , v a v e , and E m a x exhibit a similar trend of increasing and later decreasing with YCH. E m a x is at its maximum at YCH = 1.9%, thereby indicating that the explosive power is greatest at YCH = 1.9%. This experiment is a study conducted on a medium–sized simulated horizontal oil tank. From the analysis and comparison of t m a x , p m a x , v a v e , and E m a x under different YCH conditions, when ignited at the top position with YCH = 1.9%, the explosion develops most rapidly, thereby generating the highest explosion overpressure and producing the greatest explosive power. This scenario is the most dangerous, and real-time monitoring is required in practical engineering to prevent YCH from reaching values near this threshold.

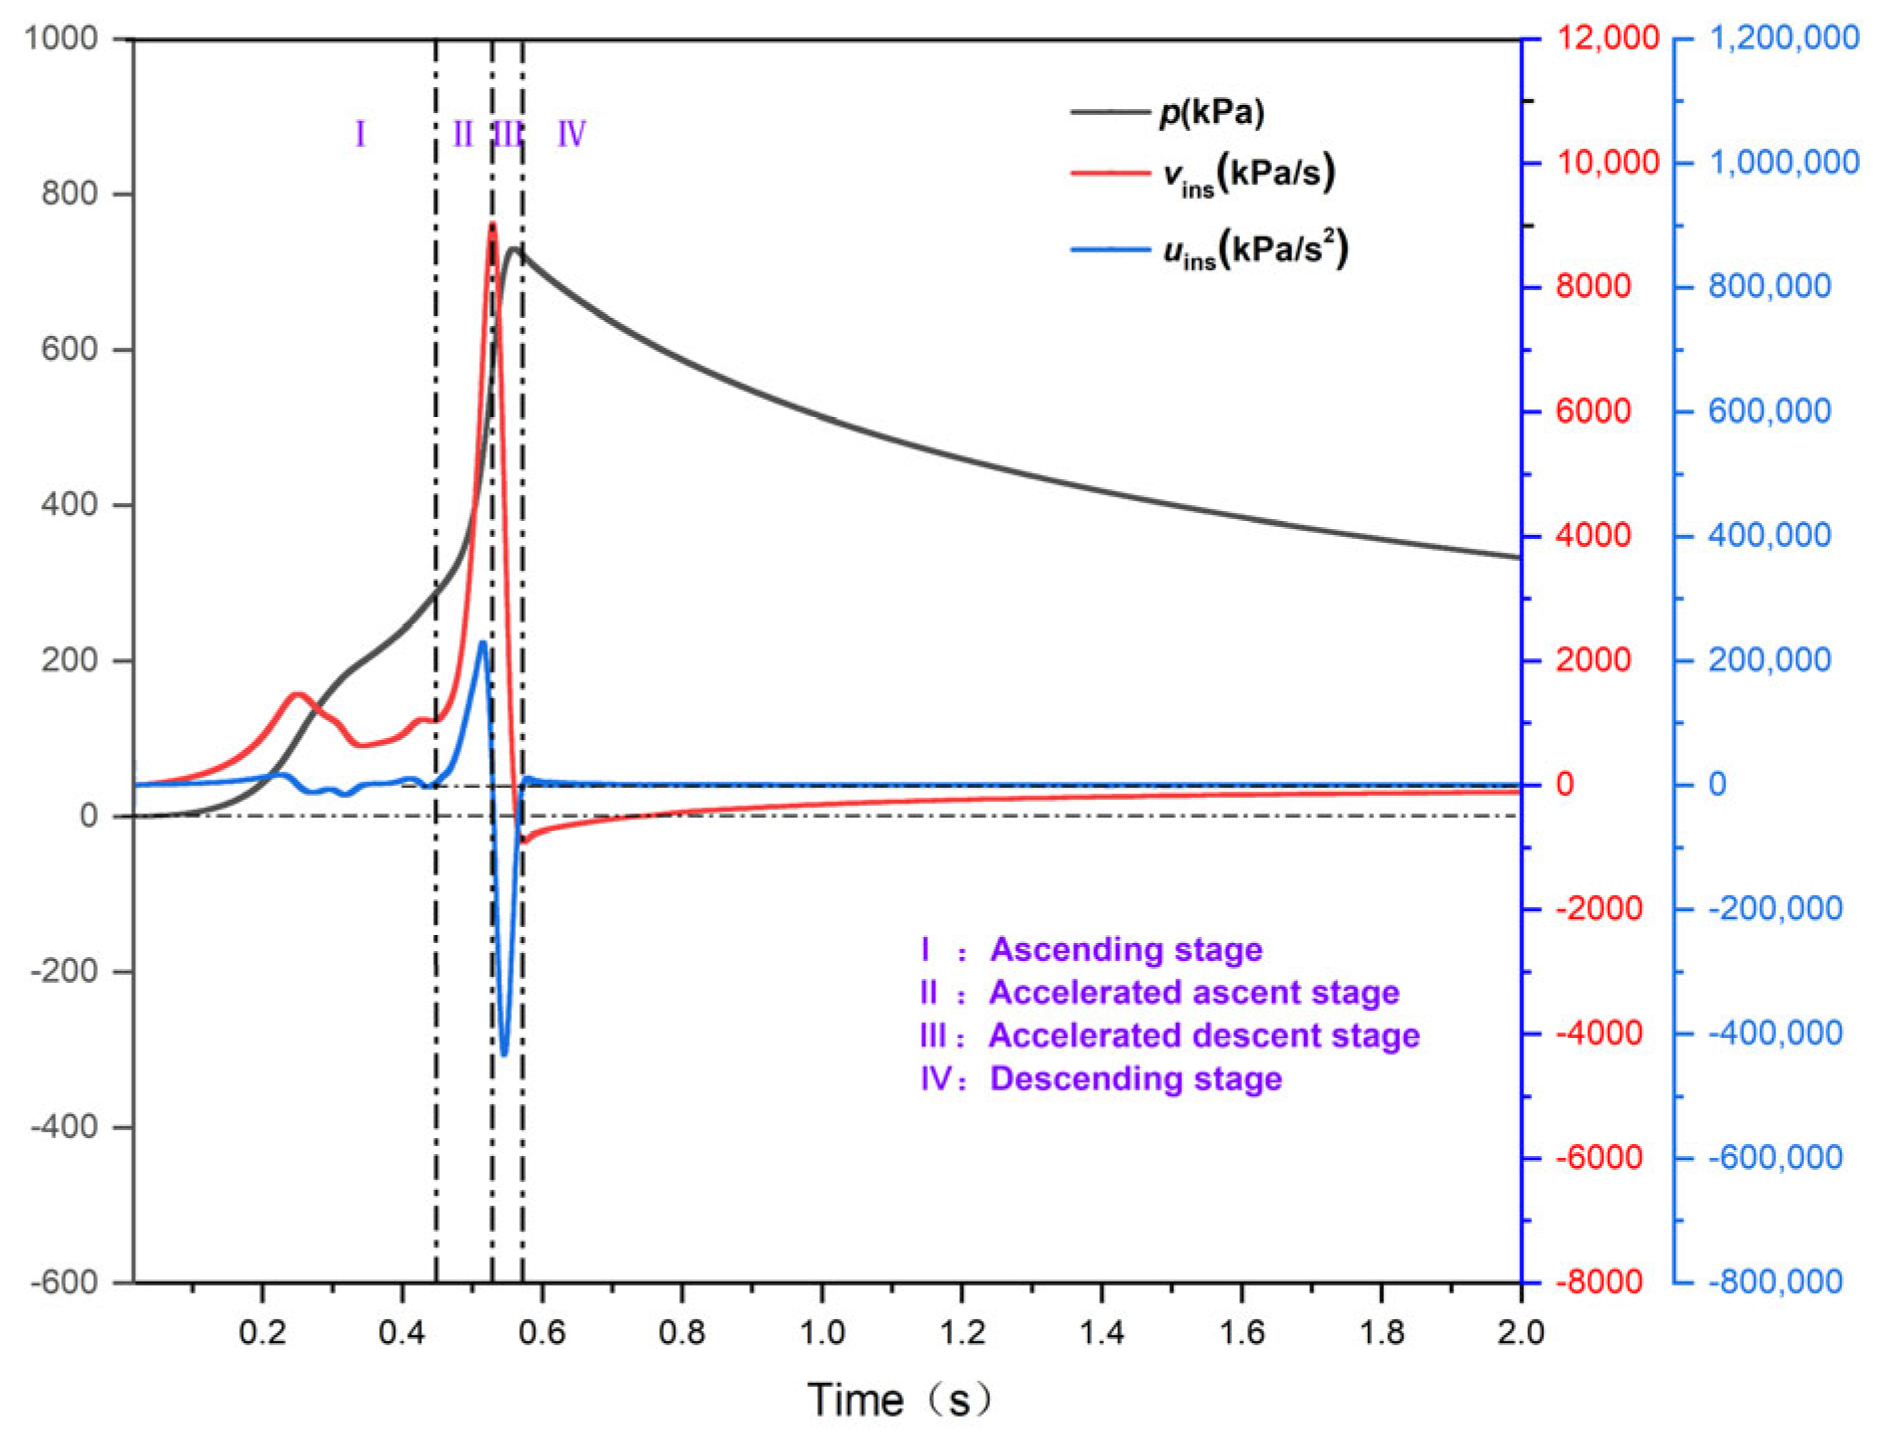
3.2. Analysis of the Explosion Overpressure Variation Process

The overpressure parameters were closely related to the volume and shape of the explosion container. The different volumes and shapes of the experimental containers resulted in different explosion characteristics, as presented in Table 3. For the oil–gas mixture with YCH = 1.9%, we obtained p m a x = 903.38 kPa and (dp/dt)max = 9032.00 kPa/s. However, values obtained from references [5,26,27,28] are inconsistent, thereby indicating a close correlation between explosion characteristics and the volume and shape of the experimental container. Wang [26] conducted experiments in a 907.50 L tank with YCH = 1.71%, which resulted in p m a x = 844.00 kPa and (dp/dt)max = 23,041.00 kPa/s. Zhang [5] conducted experiments on a 1150 L cylindrical platform with YCH = 1.7%, thereby yielding p m a x = 498.12 kPa and (dp/dt)max = 3520.00 kPa/s. Even in experiments with containers of similar volumes but different shapes, considerable differences in p m a x and (dp/dt)max were observed. Other data can be analyzed and compared based on Table 3. To further study the variation law of explosion overpressure in horizontal oil tanks, the change in the overpressure was divided into stages in this experimental study to determine the optimal explosion suppression timing. This approach has a theoretical reference value in terms of improving the safety and protection of oil materials and engineering practices.
Some researchers [6,26,29] divided the development of the explosion overpressure in confined spaces into stages based on different experimental characteristics, each with its own unique criteria. Research has shown that the magnitude of the instantaneous pressure rise rate v i n s does not only describe the characteristics of explosion overpressure change but also facilitates the division of overpressure change into stages. The first–order derivative of the instantaneous pressure rise rate, denoted as u i n s , is expressed by Equation (3) and was used to identify the inflection points in the time–pressure curve of the explosion overpressure.
u i n s = d d t ( d p d t )
Numerous scholars have used the Savitzky–Golay method to smoothen oscillation curves in the Origin software [30], thereby employing a second–order polynomial algorithm for calculation. Figure 6 shows the curves obtained using the Origin software with a second–order polynomial and a 3000–point data window for differentiation when YCH was 1.1%, 1.9%, and 2.7%. Within the “Analysis” tab, the “Mathematics” section was used to calculate the first and second derivatives, resulting in the curve plot. Upon comparison, the pressure–time curve changes minimally after the smoothing process. However, there exist considerable variations in the maximum pressure rise rate (dp/dt)max. Additionally, the variation patterns of (dp/dt)max trends for the three selected representative curves are consistent.
Based on the overall curve pattern, the explosion overpressure variation process was divided into four phases: smooth rise, accelerated rise, fast transitions, and decreasing attenuation [31]. The following is a specific analysis using YCH = 1.9% as an example:
As shown in Figure 7, the division of the explosion stages at YCH = 1.9% is as follows:
Smooth pressure rise stage (I: 0–0.458 s): In this stage, the v i n s and u i n s curves exhibit oscillatory development. The v i n s values are greater than zero, whereas the u i n s values fluctuate around the zero axis. The explosion overpressure steadily increases. However, the overall trend is relatively smooth. This is because after the ignition source ignites the vapor, there is a relatively small amount of fuel and oxygen participating in the reaction. As the flame begins to spread, the heat generated by combustion intensifies molecular collisions within the gasoline–air mixture, thereby resulting in more excited–state radicals. When these radicals accumulate at the flame front, the burning area rapidly increases, thereby resulting in an accelerated increase in the explosion overpressure. This stage ends at 0.458 s with an explosion overpressure of 297.94 kPa, v i n s = 1098.37 kPa/s, and u i n s = 12,902.95 kPa²/s.
Accelerated pressure rise stage (II: 0.458–0.528 s): In this stage, the v i n s values increase monotonically, while the u i n s values change from positive to negative. Here, the combustion intensifies, thereby causing the flame to gradually spread from the ignition source to filling the entire tank. Consequently, the rate of explosion overpressure increased until it reached a value of 569.78 kPa. At this point, v i n s = 9030.61 kPa/s and u i n s = −18,011.98 kPa²/s. For gasoline–air mixtures with different initial volume fractions, the explosion overpressure reaches its maximum value in the shortest time when the volume fraction (YCH) is 1.9%.
Fast transitions stage (III: 0.528–0.571 s): In this stage, the v i n s values monotonically decrease from positive to negative, while the u i n s values are less than 0. Considerable consumption of oil, gas, and oxygen occurred inside the tank. The rates of the gasoline–air mixture combustion reactions and energy release decreased. After reaching the maximum explosive overpressure, the pressure decreased to 720.31 kPa. At this point, v i n s = −908.87 kPa/s and u i n s = 0.
Decreasing attenuation stage (IV: 0.571–2 s): In this stage, v i n s values increase monotonically and gradually approach 0, while u i n s values remain positive. As the gasoline–air mixture inside the tank was depleted and oxygen was consumed, the flame was gradually extinguished. Hence, the explosion overpressure decreases progressively, eventually reducing to 0.

4. Explosion Overpressure Process and Characteristic Parameters for Different Initial Gasoline–Air Mixture Volume Fractions with Mid-Position Ignition

Similar to Section 3, this chapter primarily analyzes the developmental patterns of various numerical values, including the maximum overpressure peak ( p m a x ), time to reach the maximum overpressure peak ( t m a x ), average pressure rise rate ( v a v e ), and explosion power index ( E m a x ) under different initial gasoline–air mixture volume fractions with mid–position ignition.
Figure 8 illustrates the variation in explosion overpressure with time for different initial gasoline–air mixture volume fractions (YCH) with mid–position ignition. As YCH increases, the overpressure peak increases and later decreases. As shown in Figure 3, the maximum value is achieved at YCH = 1.9%, thereby reaching 903.38 kPa. As shown in Figure 8, the maximum value is obtained at YCH = 2.1%, thereby reaching 1435.14 kPa, which is approximately a 59% increase from the maximum value in Figure 3. This phenomenon is due to the fact that the aforementioned conditions are close to the stoichiometric concentration, while different ignition positions have a considerable impact on the development of explosion overpressure, thereby resulting in variations in the volume fraction at which combustion is fully reacted.
When YCH was similar, different ignition positions resulted in considerable variations in explosion overpressure. In the YCH range of 1.1% to 1.7%, the increase rate in the explosion overpressure with mid–position ignition compared to top ignition gradually increased at rates of 4.3%, 11%, 34.9%, and 35.1%. When YCH = 2.1%, the increase rate was 66%. This is because, compared to ignition at the top position, when ignition occurred at the middle position, the ignition source was closer to the center in the confined space. This required less time for the flame front to reach both ends of the tank wall. Consequently, the ignition and development of the gasoline–air mixture were faster, while the thermal losses to the tank wall were relatively small. Hence, higher explosive pressures were observed.
The characteristic parameters for mid–position ignition are presented in Table 4. Under a similar initial gasoline–air mixture volume fraction to that presented in Table 2, the explosion overpressure is higher, while the time to reach the maximum explosion overpressure peak is shorter. The general trend in the variation in the characteristic parameters corresponds with the experimental study of Ferrara G, Y. Cao, Guo et al. [15,17,18]. When YCH was 1.1% and 2.7%, it took more than 1.0 s to reach the maximum explosion overpressure. When YCH was 1.3–2.5%, the increase in the explosion overpressure was within 0.80 s. At YCH = 2.1%, p m a x , v a v e , and E m a x reached their maximum values. Compared to the values presented in Table 2 with top–position ignition, p m a x , v a v e , and E m a x were larger. Figure 9 shows the variations in t m a x , p m a x , v a v e , and E m a x with YCH for mid-position ignition, with the trend exhibited consistent with that shown in Figure 5.

5. Comparison of Ignition-Induced Explosive Overpressure Characteristics between Top and Middle Positions

This chapter compares the typical explosion overpressure characteristic parameters during ignition at the top and middle positions. Emphasis is placed on the comparison of the average rate of pressure rise, v a v e , the maximum rate of pressure rise, ( d p d t ) m a x , and the explosion power index, E m a x . Through comparative analysis, the study further explores the explosion behavior under different operating conditions.
As shown in Figure 10, compared to ignition at the top position, ignition at the middle position resulted in an increased explosion overpressure and a shorter duration. As shown in Figure 10a–c, when the explosion overpressure curves are within the range of 0 to 0.69 s, 0 to 0.35 s, and 0 to 0.39 s, respectively, the explosion overpressure is greater for ignition at the top position than that in the middle position.
As shown in Figure 11, for YCH = 1.1% (1.08 s), the maximum pressure rise rate (dp/dt)max for ignition at the top position reached 655.60 kPa/s; at 0.95 s, the (dp/dt)max for ignition at the middle position was 935.46 kPa/s. Regarding YCH = 1.9%, at 0.53 s, the (dp/dt)max for ignition at the top position reached 8985.28 kPa/s, and at 0.41 s, the (dp/dt)max for ignition at the middle position was 10,089.80 kPa/s. Finally, for YCH = 2.7%, at 3.87 s, the (dp/dt)max for ignition at the top position was 621.22 kPa/s, and at 2.40 s, the (dp/dt)max for ignition at the middle position was 2280.08 kPa/s. Compared to ignition at the top position, that at the middle position resulted in a shorter time as regards reaching the maximum pressure rise rate, with larger numerical values. This was particularly pronounced at YCH = 2.7%, wherein the change rate was the highest, thereby increasing by 267% and reducing by 38%. Based on the analysis of the aforementioned data, a comparison of a typical explosion overpressure characteristic parameters for ignition at the top and middle positions is presented in Table 5.
In Figure 10, the overpressure–time sequence curves for the two ignition positions are presented for YCH values of 1.1%, 1.9%, 2.1%, and 2.7%. Here, the explosion overpressure–time sequence curves change with rapid oscillations in the overpressure.
When Figure 12 is magnified, at YCH = 1.1%, the ignition overpressure curve at the top position exhibits oscillations, whereas the ignition curve at the middle position remains smooth. At YCH = 2.7%, the ignition curve at the middle position shows oscillations, whereas the ignition curve at the top position is smooth. Only when YCH is at 1.9% and 2.1% do the overpressure curves for both ignition positions oscillate back and forth. Furthermore, the oscillations are more pronounced when ignition occurred at the middle position than at the top position [26]. This is because the experimental test rig had relatively large specifications and dimensions, thereby providing sufficient space for the propagation and reflection of overpressure waves. Additionally, it increases the instability of the explosion overpressure and internal fluid turbulence. Further, when YCH approaches a stoichiometric concentration, it can result in the formation of large–scale unstable flames during explosion. The propagation and heat dissipation of these flames accelerated the release of energy, thereby resulting in oscillations.
The variation in overpressure is an important aspect of gasoline–air mixtures explosion research. The average pressure rise rate v a v e and maximum explosion power index E m a x are crucial indicators for evaluating the severity of explosions. Regarding v a v e and E m a x , their values initially increased as YCH increased from 1.1% to 2.7%, as shown in Figure 13. However, they peaked at YCH = 1.9% and YCH = 2.1%, respectively, before decreasing. As shown in Figure 13a, as YCH increases, the overall trend in v a v e increases and later decreases. This trend corresponds with the variation pattern of p m a x . When the YCH values were equal, the v a v e for ignition at the middle position was greater than that for ignition at the top position.
With the continuous increase in YCH, the value of E m a x increased and later decreased, as shown in Figure 13b. This trend corresponds with the variation in p m a x . Furthermore, when YCH was equal, the E m a x for ignition at the middle position was greater than that for ignition at the top position. At YCH = 2.1, the E m a x value was the greatest when ignited at the middle position, thereby showing an increase of 304% compared to that when ignited at the top position. At this point, the rate of change in E m a x was the highest. The results show that when ignited at the top position with YCH = 1.9% and at the middle position with YCH = 2.1%, the chemical reactions of gasoline–air mixtures combustion are most extensive, thereby resulting in the highest energy release and maximum destructive power.

6. Analysis of Typical Flame Morphology

The flame morphology exhibited distinct characteristics based on variations in initial gasoline–air mixture volume fractions and ignition positions. In this chapter, further analysis of flame morphology is conducted through the observation of typical flame propagation images. Based on previous analyses, when the ignition point was located at A7, the peak values of the maximum explosion overpressure p m a x and explosion power index E m a x at low, medium, and high initial gasoline–air mixture volume fractions (YCH) were higher than those at the top position. Here, the explosion developed more rapidly and was more prone to generating overpressure oscillations, thereby indicating that gasoline–air mixture explosions ignited at the middle position are more dangerous. In this section, three typical initial gasoline–air mixture volume fractions of YCH at 1.1%, 1.9%, and 2.7% were selected for comparison. After observing the images of the flame variations during the rapid development stage of the explosion and analyzing the changes in the flame morphology and color, we aimed to uncover the process of flame propagation in gasoline–air mixture explosions and the characteristic behavior of flames in such explosions [32,33].
Figure 14 shows an image of the flame at YCH = 1.1%. When the spark from the ignition rod is released, a high–voltage electric arc instantaneously breaks through the gasoline–air mixture between the electrodes. The released electrical energy is converted into thermal energy, thereby igniting the surrounding gasoline–air mixture within a small area and resulting in a high–temperature ignition kernel, as represented by the bright yellow region at 0.002 s in the image. This process is extremely brief and complex, and involves ionization, heat and mass transfer, and chemical reactions in the nucleus. However, a detailed discussion of these processes is not provided here. Once the ignition kernel is formed, heat begins to propagate outward, thereby igniting the surrounding gasoline–air mixture and forming a spherical flame front, as shown at 0.02, 0.05, and 0.10 s in the image. As the heat from the ignition kernel gradually dissipates, the color of the flame changes from bright to dark in this region, thereby forming a less distinct dark red area at 0.10 s. During this process, the darker–colored flame kernel is gradually shifting upwards. This is because the temperature in this region is higher and moves upwards owing to buoyancy effects. Similarly, the temperature in the burned region enclosed by the flame front is higher than that in the unburned region. Hence, in the case of a relatively slow flame propagation, it is possible to clearly observe the overall upward movement of the flame. At 0.23 s, the center of the flame is inclined towards the upper side, and this is owing to the effect of buoyancy. During the first 0.40 s, the flame propagation is relatively unaffected, and the flame front appears smooth without folds. As the flame front gradually approaches the radial container wall, the reflected pressure waves disturb the flame front, causing it to develop into folds. This was observed on the lower side of the flame front at 0.41 s.
As the flame continues to propagate, the disturbance caused by pressure waves becomes more pronounced, coupled with the folds on the flame front. For better observation, the contrast of the flame images at 0.54 s and 0.58 s was increased. A cellular flame front can be observed in the figure. This phenomenon increases the flame front area, enhances the flow of gases in the front region, intensifies the combustion reaction, accelerates heat release and explosion development, as demonstrated by the flame image at 0.63 s. After a period of development, the unburned gas was gradually consumed, and heat was lost. The flame gradually changed to orange and dark red and eventually extinguished.
As shown in Figure 15, the flame image at YCH = 1.9% exhibits similar early–stage development to that at YCH = 1.1% in the first 0.02 s. However, because the gasoline–air mixture at this point is closer to the stoichiometric concentration, the laminar flame speed is faster. A greater amount of the gasoline–air mixture participates in the reaction, thereby releasing heat. At 0.02 s, the bright yellow region inside the flame is larger compared to YCH = 1.1%, and the flame appears more vivid in color. Owing to the combined effects of the greater heat release and faster laminar flame speed, the flame front displacement speed at YCH = 1.9% was considerably higher than that at YCH = 1.1%. As shown in Figure 15, the flame area at 0.05 s is noticeably larger than the flame at 0.05 s in Figure 14. The flame in Figure 14 just reaches the edge of the observation window at 0.17 s, whereas in Figure 15, the flame image has already surpassed the observation window at 0.12 s. A further observation of the flame image in Figure 15 reveals that during the propagation of the flame front, folds gradually form at 0.08 s, 0.12 s, and 0.15 s. At this stage, the flame area was still relatively small, and the folds in the flame front were not formed due to the disturbance from the pressure waves as it gradually contacted the wall but due to the instability of the combustion process. As shown in Figure 14, there are no folds in the flame front during the first 0.23 s. This is because, at this time, the initial gasoline–air mixture volume fraction is lower, thereby resulting in a slower flame propagation. The expansion of the already burned area stretches the flame front, thereby inhibiting the formation of folds. Folds formation in the flame front as shown in Figure 15 further increases the disturbance in the front area, thereby prompting a more intense combustion reaction. Consequently, from 0.15 s to 0.45 s, the turbulence in the flow field of the combustion area intensifies, heat generation becomes more rapid, and the flame gradually changes from pale blue to orange–red. At 0.45 s, it becomes bright white, thereby indicating a highly intense reaction, accompanied by a rapid increase in pressure. As the unburned fuel is consumed and heat is lost through heat transfer to the walls of the oil tank, the flame temperature gradually decreases. Its color changes from bright yellow to dark red at 0.70 s to 1 s until it extinguishes, as shown in the figure.
Figure 16 shows the flame image at a gasoline–air mixture volume fraction of YCH = 2.7%. The ignition process in the early stage is similar to that of gasoline–air mixture explosions at other volume fractions. However, owing to the lower air–fuel ratio, the combustion reaction was slower. The flame area at 0.12 s is smaller than the flame at 0.05 s, as shown in Figure 15. However, because of the increased concentration of fuel per unit volume in the reaction, more heat was released, and there were more incomplete reactions. In high-temperature environments, carbon particles precipitate, thereby causing most of the flame region to appear as bright yellow. Additionally, floccule flames formed within the flame front. In the first 0.80 s, owing to the slow flame propagation, the burning area shifts upward under the influence of buoyancy. At 0.80 s, constrained by the upper sidewall, the flame begins to spread downward, as shown in the flame images at 1.20 and 1.50 s. At 1.90 s, a bright white flame formed, thereby indicating an intense explosive reaction. As the gasoline–air mixture is gradually consumed, the flame transitions to a bright yellow and dark red color at 2.60 and 2.80 s, respectively, until the flame is gradually extinguished. Comparing Figure 14, Figure 15 and Figure 16, when the volume fraction of the gasoline–air mixture is higher than the stoichiometric volume fraction, the flame front becomes more irregular. This is because the heat release is faster, the flame propagation is slower, and the buoyancy effect considerably impacts the flame front.

7. Conclusions

To explore the explosion characteristics of a horizontal oil tank within confined spaces, this paper first analyzed the impact of different initial gasoline–air mixture volume fractions and ignition positions on explosion overpressure characteristic parameters. It obtained the most critical gasoline–air mixture volume fractions under various operating conditions. Subsequently, a comparative analysis of the explosion overpressure characteristic parameters was conducted for ignition at two different positions. Finally, flame patterns were studied for typical low, medium, and high initial gasoline–air mixture volume fractions, and a preliminary analysis of flame development characteristics was performed. The research successfully achieved its experimental goals. The main conclusions of the study include the following:
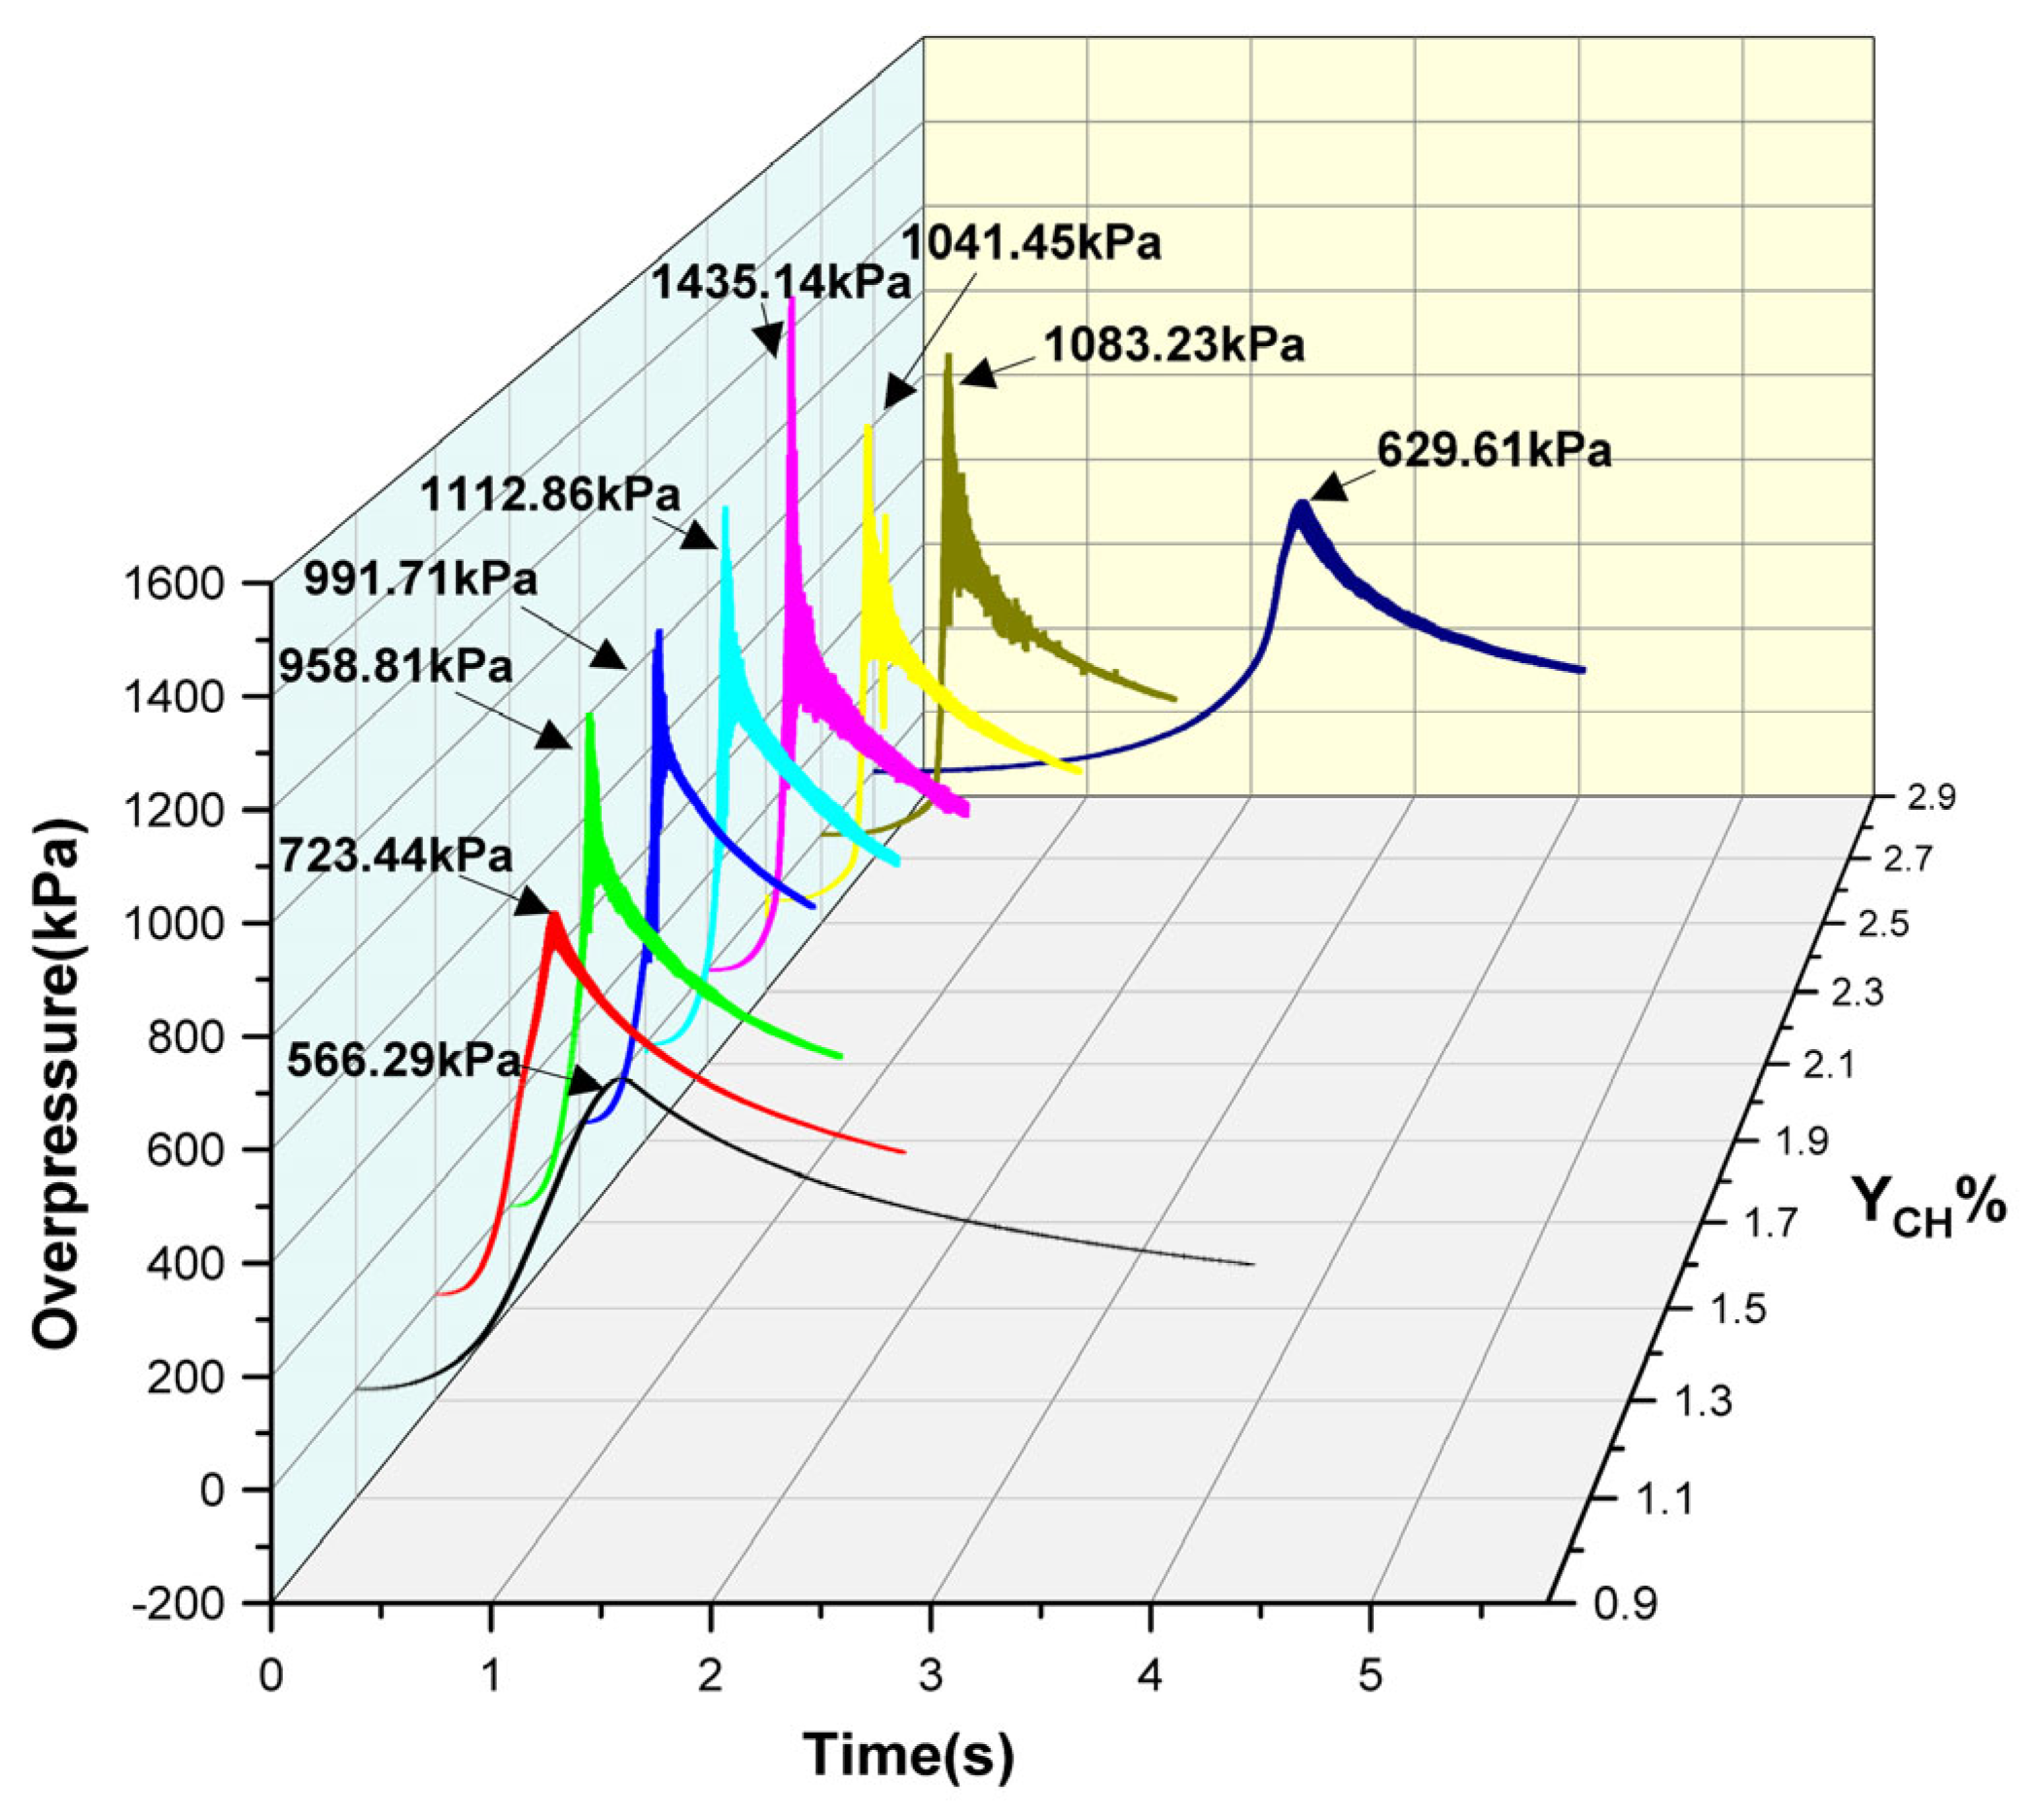
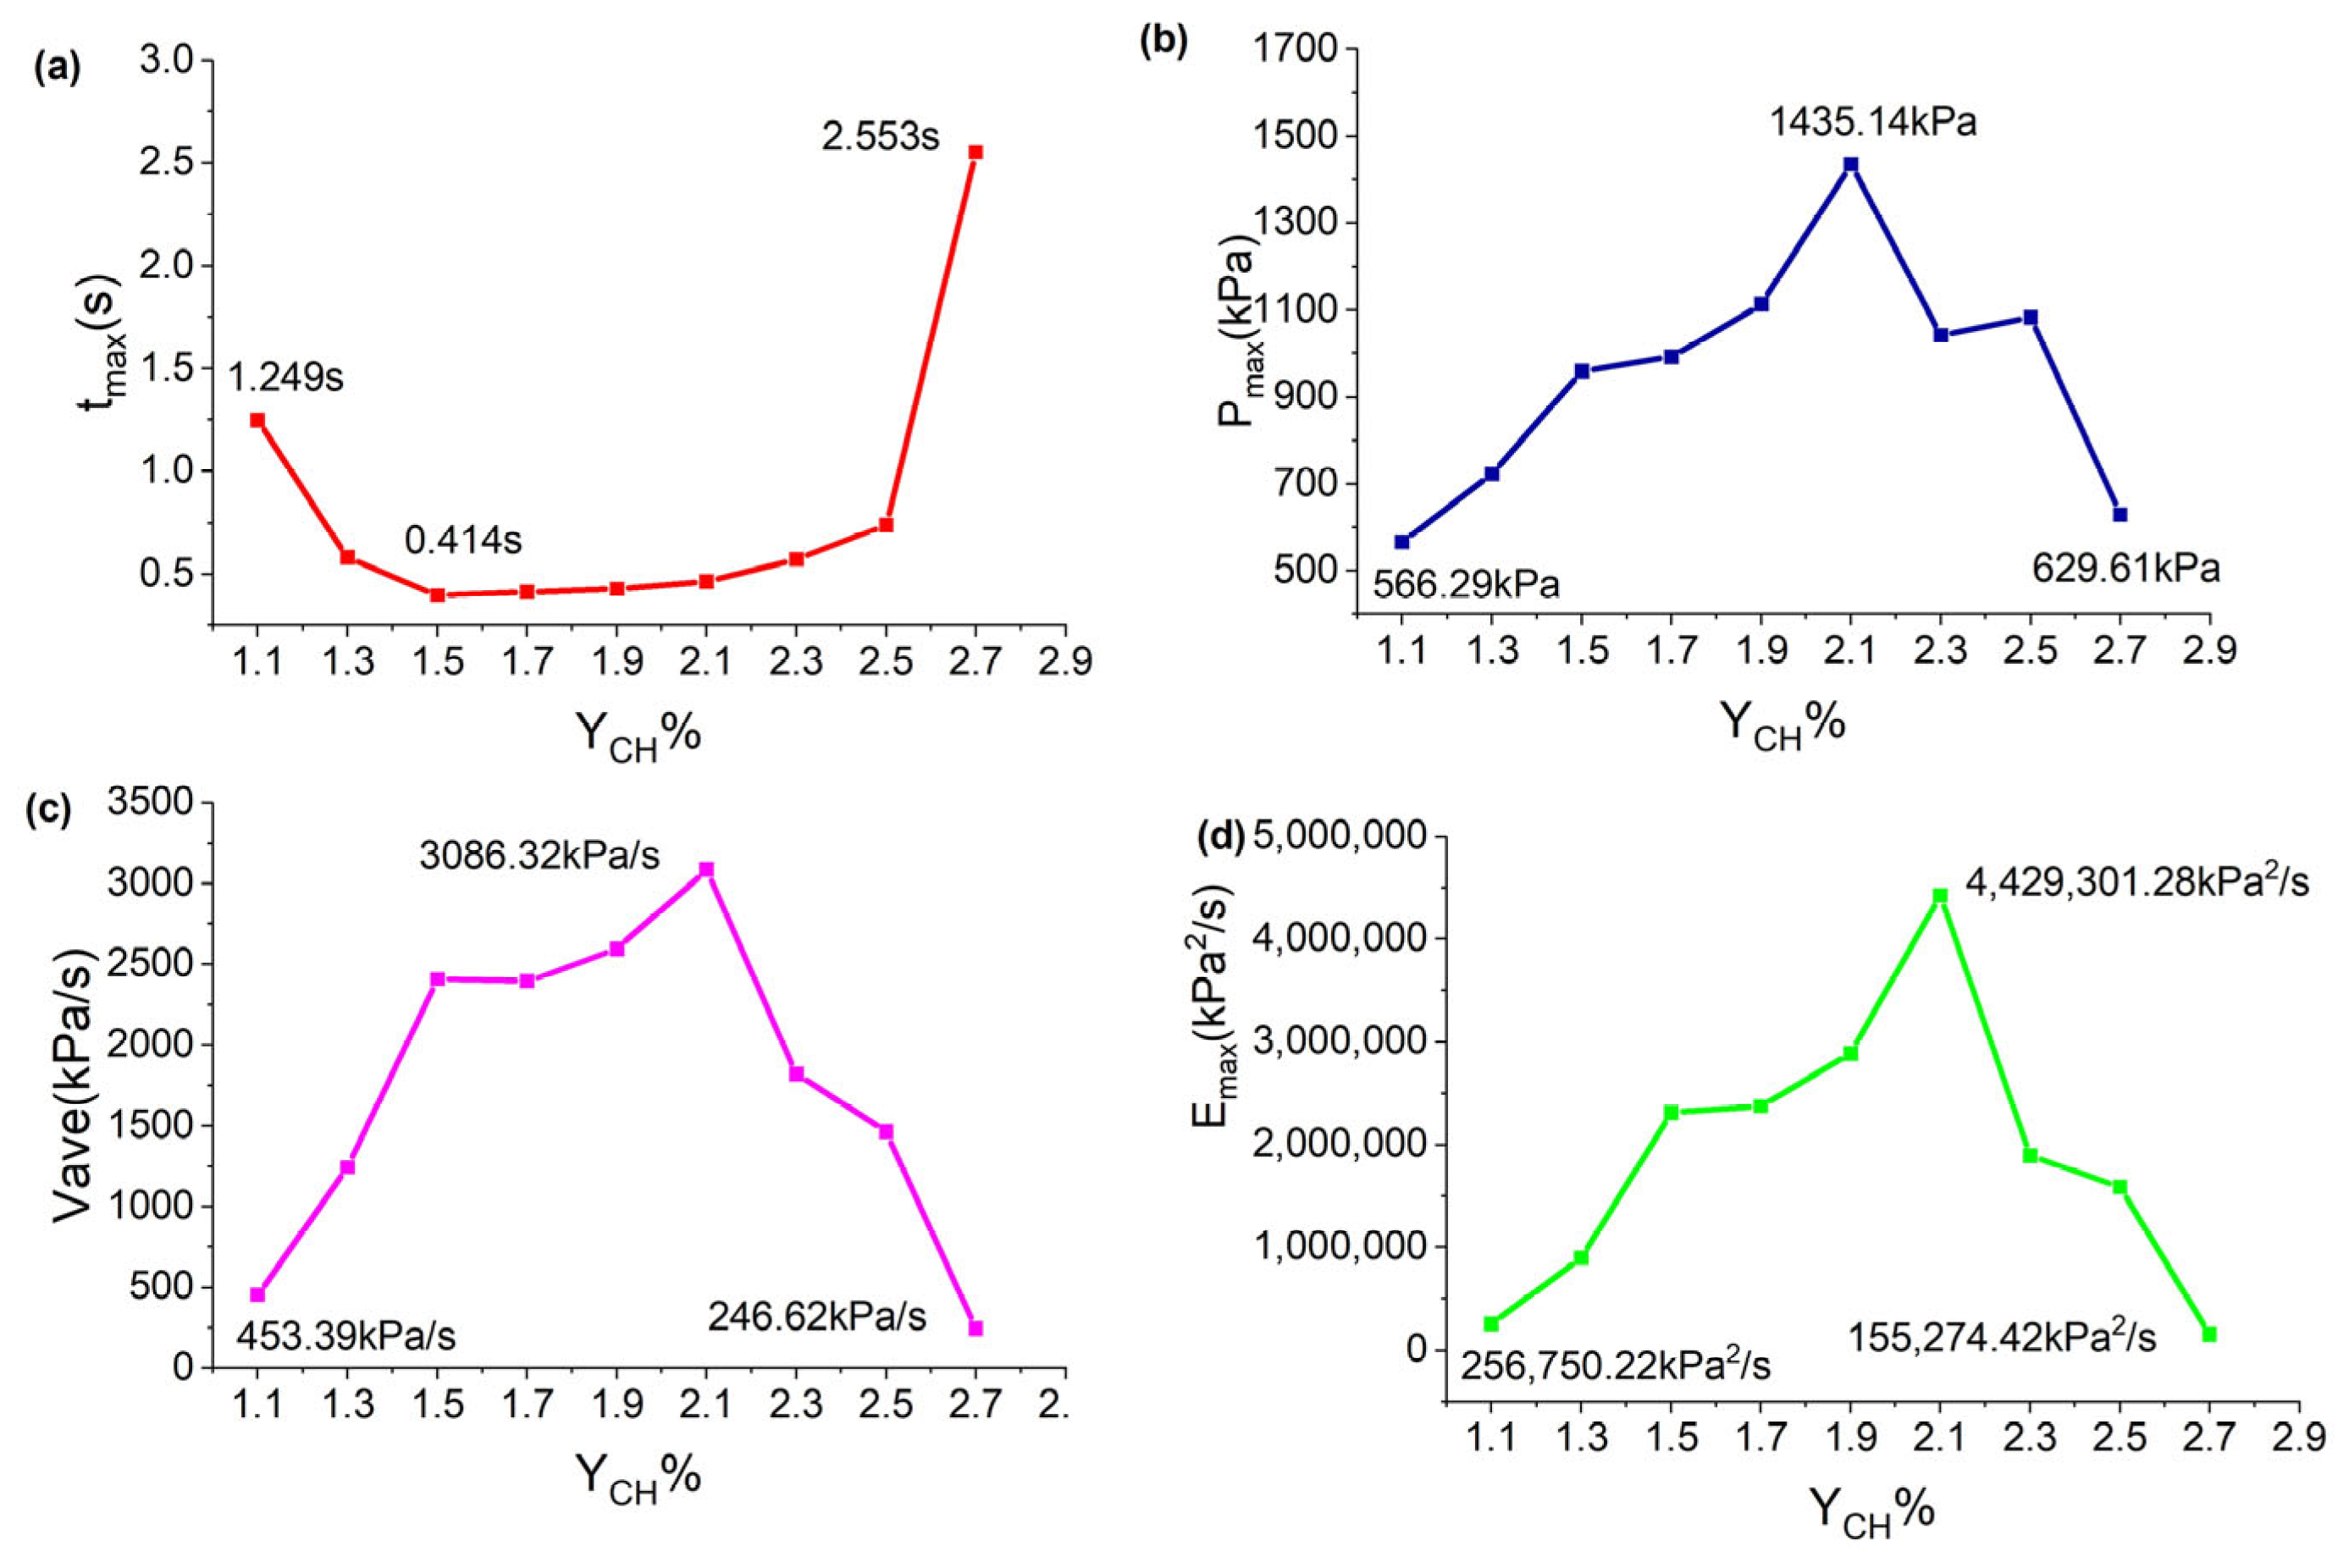
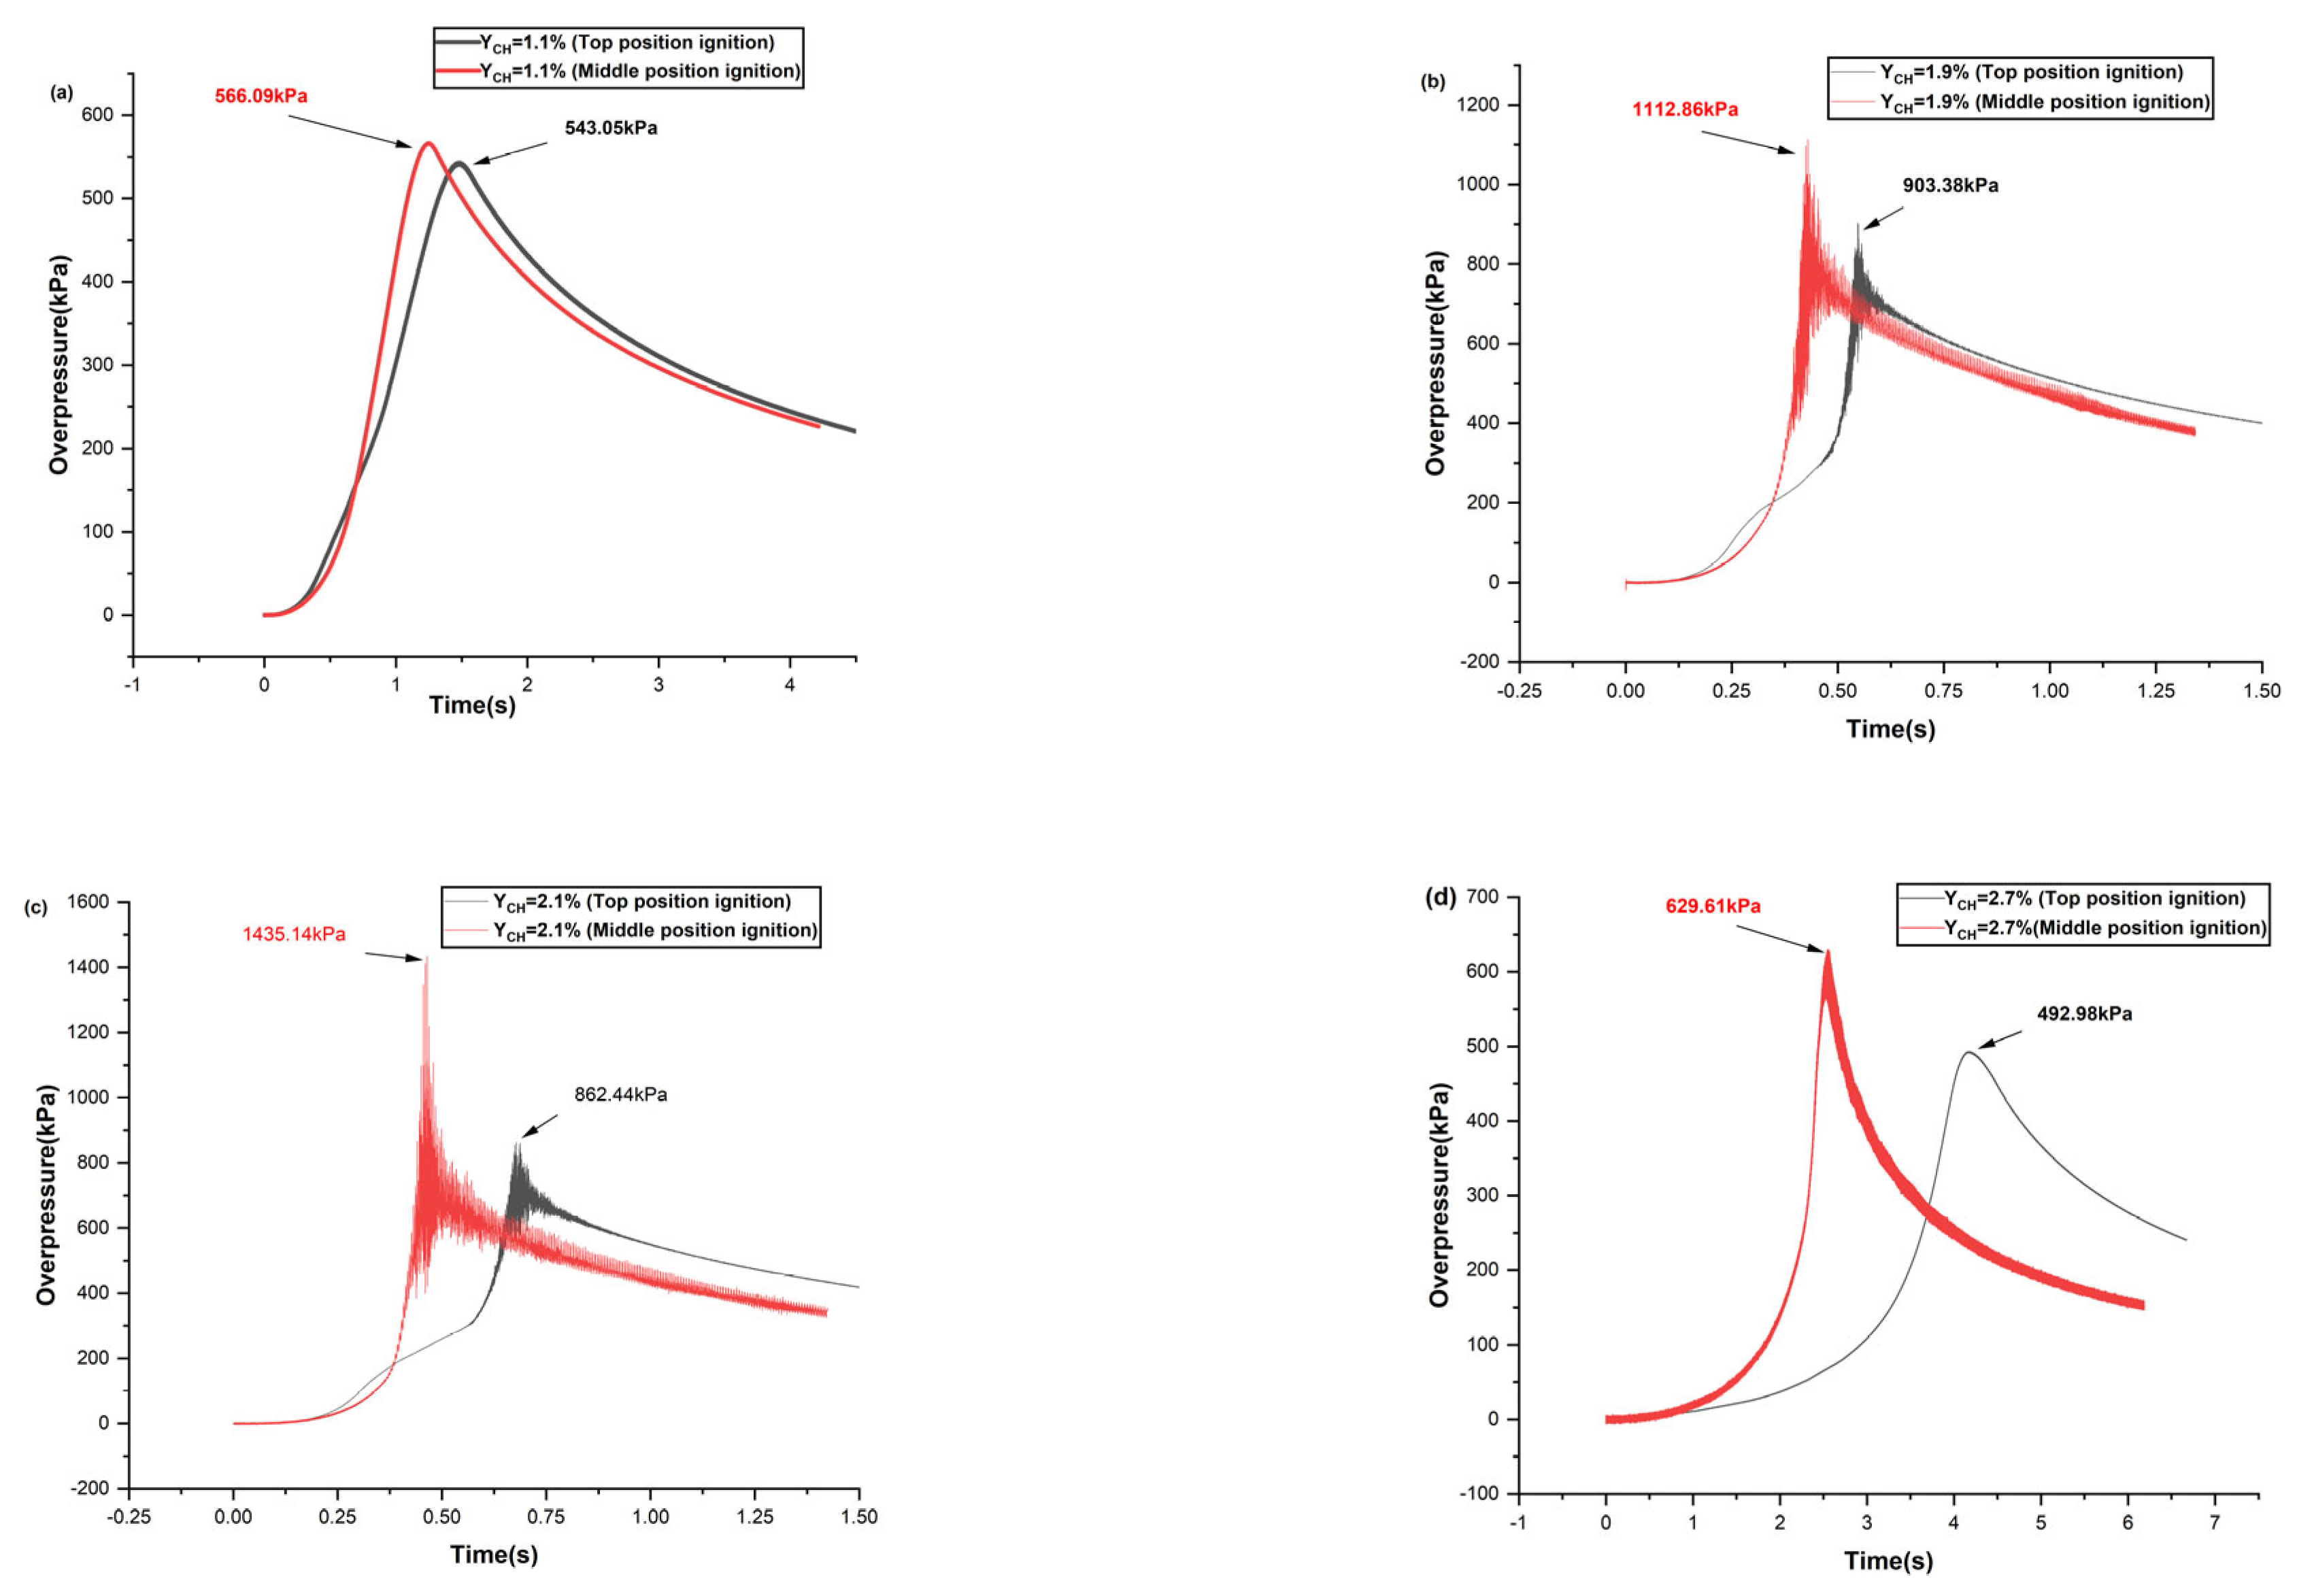
  • With an increase in the initial gasoline–air mixture volume fraction, the peak overpressure increased and later decreased. The development of internal overpressure exhibits four stages: smooth rise, accelerated rise, fast transitions, and decreasing attenuation. When ignited at the top position, the most dangerous gasoline–air mixture volume fraction was 1.9%, with a maximum overpressure p m a x of 903.38 kPa. When the gasoline–air mixture ignited at the middle position, the most dangerous gasoline–air mixture volume fraction was 2.1%, with a maximum overpressure p m a x of 1435.14 kPa. In practical engineering, efforts must be made to avoid reaching gasoline–air mixture volume fractions near the aforementioned values.
  • Different ignition positions exhibit similar trends in the variation in the explosion overpressure characteristic parameters. However, when YCH was equal, the values of v a v e , (dp/dt)max, and E m a x for ignition at the middle position were greater than those for ignition at the top position. Hence, ignition at the middle position results in a more powerful explosion, with greater destructive force at the top position.
  • Different initial gasoline–air mixture volume fractions and ignition positions result in distinct flame characteristics. When YCH = 1.9%, i.e., closer to the stoichiometric concentration, the laminar flame speed was faster than when YCH = 1.1%. The flame image exhibited more pronounced folds, thereby shortening the duration. At YCH = 2.7%, wherein the equivalent volume fraction is larger, the flame propagation is relatively slow owing to the rapid heat release, resulting in an irregular flame front.
  • The experimental research in this paper was conducted within a horizontal oil tank. The results of the study not only enriched various experimental setups but also deepened our understanding of the explosive characteristics of gasoline–air mixtures. Due to various constraints in the laboratory, we did not conduct a study with a prototype horizontal oil tank and numerical simulation. In the future, when conditions permit, we will conduct experiments and numerical simulation studies on a prototype experimental test stand.

Author Contributions

Conceptualization, D.Z., R.C. and S.W.; methodology, Y.C.; software, D.Z. and R.C.; validation, Y.C.; formal analysis, P.Z.; investigation, D.H.; resources, X.Q.; data curation, P.Z. and X.Q.; writing–original draft preparation, D.Z.; writing–review and editing, X.J.; visualization, Y.C.; supervision, X.J.; project administration, K.L.; funding acquisition, X.J. and P.Z. All authors have read and agreed to the published version of the manuscript.

Funding

This research was funded by the Key Basic Research Program, grant number 2019–JCJQ–ZD–198–04; Special Project for Technological Innovation and Applied Development in Chongqing City, grant number CSTB2023TIAD–KPX0089; Science and Technology Research Program of Chongqing Municipal Education Commission, grant number KJZD–M202112901; Natural Science Foundation of Chongqing, grant number CSTB2023NSCQ–MSX0127; Army Logistics Academy Program of PLA, grant number LQ–QZ–202227; and Chongqing Graduate Student Research Innovation Program, grant number CYB23297.

Institutional Review Board Statement

Not applicable.

Informed Consent Statement

Not applicable.

Data Availability Statement

The data used to support the findings of this study are available from the corresponding authors upon request.

Conflicts of Interest

The authors declare no conflicts of interest.

Nomenclature

YCHInitial gasoline–air mixture volume fraction,
P m a x Maximum overpressure peak
t m a x Time to reach maximum overpressure peak
v a v e Average pressure boost rate
E m a x Explosion power index
v i n s Instantaneous pressure rise rate
( d p d t ) m a x Maximum overpressure rise rates
u i n s First-order derivative of the instantaneous pressure rise rate

References

  1. Wang, S.M. Experimental Research and Numerical Simulation on the Evolution Characteristics of Oil and Gas Explosions in Confined Spaces with Weak Intensity Surface. Ph.D. Thesis, Army Logistics Academy, Chongqing, China, 2018. [Google Scholar]
  2. Guo, W.H.; Li, H. Prevention of Major Hazardous Fire and Explosion Accidents in Petrochemical Enterprises. Fire Sci. Technol. 2016, 35, 1335–1337. [Google Scholar]
  3. Yu, Z.B.; Lu, Y.L. Analysis of the Causes of Flash Explosion Accidents in Tanker Trucks and Countermeasures. Pet. Petrochem. Saf. Technol. 2005, 21, 12–13. [Google Scholar]
  4. Wei, S.H.; Du, Y.; Wang, S.M.; Li, M. Experimental Study on Oil and Gas Explosion Characteristics in Different Shaped Confined Spaces. China Saf. Sci. J. 2017, 13, 41–47. [Google Scholar]
  5. Zhang, P.L.; Wang, J.; Wang, D. Explosions of gasoline vapor/air mixture in closed vessels with different shapes and sizes. J. Loss Prev. Process Ind. 2018, 57, 327–334. [Google Scholar] [CrossRef]
  6. Cai, Y.X.; Jiang, X.S.; Wang, S.M.; Yu, B.B.; Wang, C.H.; Wang, Z.T.; Li, Y.X. Experimental Study on Oil and Gas Explosion in Simulated Vertical Domed Oil Tanks. Explos. Impact 2022, 42, 152–168. [Google Scholar]
  7. Huang, Y.; Xi, G.C.; Yang, J.; Xu, N.; Hao, Y.M. Research on the Flame Spread Law of Methane Pipeline Leakage and Explosion. Safety 2022, 43, 62–68. [Google Scholar] [CrossRef]
  8. Yu, J.L.; Kang, S.L.; Yan, X.Q.; Zhan, X.B. Study on Methane Explosion and Venting Characteristics in Pressurized Vessels. J. Saf. Environ. 2023, 1–9. [Google Scholar] [CrossRef]
  9. Hu, F.F.; Jia, Y.; Wang, W.T.; Jiang, B.Y.; Li, S.Z.; Cheng, Y.F. Study on the Combustion and Explosion Characteristics of Acetylene/Air Premixed Gas in Confined Spaces. Pyrotechnics 2022, 6, 50–55. [Google Scholar]
  10. Li, D.; Dai, S.J.; Zheng, H.W.; Cui, Z.Y. Research on the Maximum Explosion Pressure and Maximum Rate of Pressure Rise of Premixed Gas in Flameproof Enclosures. Coal Mine Saf. 2023, 54, 216–221. [Google Scholar] [CrossRef]
  11. Cao, W.G.; Huang, L.Y.; Liang, J.Y.; Miao, N.; Rao, G.N.; Pan, F. Study on the Explosion Characteristics of Coal Powder in Spherical Closed Containers. J. China Univ. Min. Technol. 2014, 43, 113–119. [Google Scholar] [CrossRef]
  12. Castellanos, D.; Carreto, V.; Skjold, T. Construction of a 36L dust explosion Apparatus and turbulence flow field comparison with a standard 20 L dust explosion vessel. J. Loss Prev. Process Ind. 2018, 55, 113–123. [Google Scholar] [CrossRef]
  13. Dong, B.Y.; Zha, Y.X.; Zou, Y.; Yin, P.P. Numerical Simulation and Experimental Study on Methane-Hydrogen-Air Explosion Process in Spherical Pressure Vessel. China Saf. Sci. J. 2023, 19, 157–163. [Google Scholar]
  14. Jiang, X.S.; Xie, W.; Zhao, Y.D.; Li, J.Y.; Li, J.; Yu, B.B. Experimental Study on Oil and Gas Explosion in Long and Narrow Pipes with Different Length-to-Diameter Ratios. Oil Gas Storage Transp. 2020, 39, 879–884. [Google Scholar]
  15. Ferrara, G.; Willacy, S.K.; Phylaktou, H.N.; Andrews, G.E.; Di Benedetto, A.; Salzano, E.; Russo, G. Venting of gas explosion through relief ducts: Interaction between internal and external explosions. J. Hazard. Mater. 2007, 155, 358–368. [Google Scholar] [CrossRef]
  16. Bauwens, C.R.; Chaffee, J.; Dorofeev, S. Effect of Ignition Location, Vent Size, and Obstacles on Vented Explosion Overpressures in Propane—Air Mixtures. Combust. Sci. Technol. 2010, 182, 1915–1932. [Google Scholar] [CrossRef]
  17. Cao, Y.; Guo, J.; Hu, K.; Xie, L.; Li, B. The effect of ignition location on explosion venting of hydrogen—air mixtures. Shock Waves 2017, 27, 691–697. [Google Scholar] [CrossRef]
  18. Guo, J.; Sun, X.X.; Rui, S.C.; Cao, Y.; Hu, K.L.; Wang, C.J. Effect of ignition position on vented hydrogen–air explosions. Int. J. Hydrog. Energy 2015, 40, 15780–15788. [Google Scholar] [CrossRef]
  19. Zhang, P.L.; Du, Y. Nitrogen Non-Premixed Inhibition Experiment for Oil and Gas Explosions. Explos. Impact 2016, 36, 347–348. [Google Scholar]
  20. Wang, S.M.; Yan, Z.H.; Li, X.D.; Li, G.Q.; Guo, H.; Wu, D.J. The venting explosion process of premixed fuel vapor and air in a half—open vessel: An analysis of the overpressure dynamic process and flame evolution behavior. Fuel 2020, 268, 117385. [Google Scholar] [CrossRef]
  21. Li, H.Z.; Xiao, H.H. Experimental study on the explosion characteristics of NH3/DME/air mixtures. Fuel 2023, 352, 129069. [Google Scholar] [CrossRef]
  22. Li, R.Z.; Si, R.J. Influence of Gas Concentration on Explosion Pressure and Pressure Rise Rate. J. Xi’an Univ. Sci. Technol. 2010, 30, 29–33. [Google Scholar] [CrossRef]
  23. Wang, X.F.; Shi, E.H.; Qi, C.; Yan, X.Q.; Zhang, Z.H.; Yu, J.L. Experimental study on aerosol explosion characteristics and flame propagation behavior of aluminum/ethanol nanofluid fuel. Fuel 2023, 352, 129022. [Google Scholar] [CrossRef]
  24. Zhang, Y.; Li, F.B.; Cai, R. Analysis of Accidental Acetone Explosion Effects in a Closed Container and Safety Measures. Chem. Eng. Manag. 2022, 7, 88–91. [Google Scholar] [CrossRef]
  25. Li, G.Q.; Zheng, K.; Wang, S.M.; Chen, W.Z. Comparative study on explosion characteristics of hydrogen and gasoline vapor in a semi-confined pipe based on large eddy simulation. Fuel 2022, 328, 125334. [Google Scholar] [CrossRef]
  26. Wang, S.M.; Wu, D.J.; Guo, H.; Li, X.D.; Pu, X.Y.; Yan, Z.H.; Zhang, P.L. Effects of concentration, temperature, ignition energy and relative humidity on the overpressure transients of fuel-air explosion in a medium-scale fuel tank. Fuel 2020, 259, 116265. [Google Scholar] [CrossRef]
  27. Zhang, P.L.; Du, Y.; Zhou, Y.; Qi, S.; Wu, S.L.; Xu, J.F. Explosions of gasoline—air mixture in the tunnels containing branch configuration. J. Loss Prev. Process Ind. 2013, 26, 1279–1284. [Google Scholar] [CrossRef]
  28. Qi, S.; Du, Y.; Zhang, P.L.; Li, G.Q.; Zhou, Y.; Wang, B. Effects of concentration, temperature, humidity, and nitrogen inert dilution on the gasoline vapor explosion. J. Hazard. Mater. 2017, 323, 593–601. [Google Scholar] [CrossRef] [PubMed]
  29. Wang, B.; Du, Y.; Li, G.Q.; Yuan, G.Q.; Wang, S.M. Study on the explosion characteristics of oil and gas in long and narrow confined pipelines. Vib. Impact 2017, 36, 80–85+145. [Google Scholar] [CrossRef]
  30. Ge, Y.; Ma, H.H.; Wang, L.Q. On the smoothing explosion pressure curves using Savitzky—Golay method. J. Loss Prev. Process Ind. 2022, 80, 104929. [Google Scholar] [CrossRef]
  31. Jiang, X.S.; Chen, R.; Zhang, P.L.; Cai, Y.X.; Zhou, D.L.; He, D.H.; Qin, X.Z.; Zhu, S.J. Study on Gasoline—Air Mixture Explosion Overpressure Characteristics and Flame Propagation Behaviors in an Annular Cylindrical Confined Space with a Circular Arch. Energies 2023, 16, 6944. [Google Scholar] [CrossRef]
  32. Jiang, H.P.; Bi, M.S.; Gao, W. Effect of monoammonium phosphate particle size on flame propagation of aluminum dust cloud. J. Loss Prev. Process Ind. 2019, 60, 311–316. [Google Scholar] [CrossRef]
  33. Shang, S.; Bi, M.S.; Zhang, T.J.; Jiang, H.P.; Zhang, S.L.; Gao, W. Synthesis of green nanomaterial and discussion on its suppression performance and mechanism to aluminum dust explosion. Process Saf. Environ. Prot. 2021, 151, 355–364. [Google Scholar] [CrossRef]
Figure 1. Schematic of the experimental system.
Fire 07 00024 g001
Figure 2. Front view (a,b) and top view (c,d) of the simulated horizontal oil tank.
Fire 07 00024 g002
Figure 3. Explosion overpressure time series curves for different YCH when igniting at the top position.
Fire 07 00024 g003
Figure 4. Explosion overpressure time series curves for YCH values of 1.1%, 1.9%, and 2.7%.
Fire 07 00024 g004
Figure 5. The relationship between explosion overpressure characteristic parameters and YCH when ignited at the top position: (a) the trend of t m a x with respect to YCH; (b) the trend of p m a x with respect to YCH; (c) the trend of v a v e with respect to YCH; (d) the trend of   E m a x with respect to YCH.
Fire 07 00024 g005
Figure 6. Typical maximum pressure rise rate: (a) the maximum pressure rise rate at YCH = 1.1%; (b) the maximum pressure rise rate at YCH = 1.9%; (c) the maximum pressure rise rate at YCH = 2.7%. The dashed line in the figure represents the trend at three points.
Fire 07 00024 g006
Figure 7. Division of the explosive stage at YCH = 1.9%.
Fire 07 00024 g007
Figure 8. Explosion overpressure time series curves for different YCH when igniting at the middle position.
Fire 07 00024 g008
Figure 9. The relationship between explosion overpressure characteristic parameters and YCH when ignited at the middle position: (a) the trend of t m a x with respect to YCH; (b) the trend of p m a x with respect to YCH; (c) the trend of v a v e with respect to YCH; (d) the trend of E m a x with respect to YCH.
Fire 07 00024 g009
Figure 10. Comparison of typical explosion overpressure-time curves when ignited at the top and middle positions: (a) curve comparison charts for YCH = 1.1%; (b) curve comparison charts for YCH = 1.9%; (c) curve comparison charts for YCH = 2.1%; (d) curve comparison charts for YCH = 2.7%.
Fire 07 00024 g010
Figure 11. Impact of YCH on the maximum pressure rise rate for ignition at two different positions: (a) the maximum pressure rise rate at YCH = 1.1%; (b) the maximum pressure rise rate at YCH = 1.9%; (c) the maximum pressure rise rate at YCH = 2.7%.
Fire 07 00024 g011
Figure 12. Time sequence curve and localized magnification diagram of typical explosion overpressure oscillations when ignited at the top and middle positions: (a) curve comparison charts for YCH = 1.1%; (b) curve comparison charts for YCH = 1.9%; (c) curve comparison charts for YCH = 2.1%; (d) curve comparison charts for YCH = 2.7%.
Fire 07 00024 g012
Figure 13. Trend and comparison of the (a) average boost rate v a v e and (b) explosion power index E m a x .
Fire 07 00024 g013
Figure 14. Images depicting the temporal evolution of flame morphology at YCH = 1.1%.
Fire 07 00024 g014
Figure 15. Images depicting the temporal evolution of flame morphology at YCH = 1.9%.
Fire 07 00024 g015
Figure 16. Images depicting the temporal evolution of flame morphology at YCH = 2.7%.
Fire 07 00024 g016
Table 1. Testing contents and initial conditions.
Initial ConditionsValue of Initial Parameters
Gas volume concentration1.1%, 1.3%, 1.5%, 1.7%, 1.9%, 2.1%, 2.3%, 2.5%, 2.7%
Ignition voltage1500 V
Ignition energy1.5 J
Ambient temperature294 k
Ambient pressure1 atm
Relative humidity65%
Experimental repetition times3
Table 2. The overpressure parameters for different initial gasoline—air mixture volume fractions when igniting at the top position.
YCH/% P m a x /kPa t m a x /s v a v e /kPa·s−1 E max /kPa2·s−1
1.1543.051.482366.43198,989.81
1.3653.230.794822.71537,418.85
1.5710.690.6371115.68792,902.62
1.7734.020.5691290.02946,900.48
1.9903.380.5471651.521,491,950.14
2.1862.440.6781272.041,097,058.18
2.3811.670.873929.75754,650.18
2.5761.471.435530.64404,066.44
2.7492.984.178117.9958,166.71
Table 3. Overpressure parameters for gasoline–air mixtures in closed vessels of different sizes.
Volume/LYCH/% P m a x /kPa ( d p d t ) m a x /kPa·s−1
Present work1000 (tank)1.90903.388985.28
Wang et al. [26]907.50 (tank)1.71844.0023,041.00
Zhang et al. [27]244 (straight tunnel)1.50870.008190.00
Zhang et al. [5]5190 (cylindrical)1.70932.112540.00
1150 (cylindrical)1.70498.123520.00
280 (rectangular)1.70398.753840.00
20 (spherical vessel)1.70626.5219,790.00
Qi et al. [28]20 (spherical vessel)1.62835.0034,381.00
Table 4. The overpressure parameters for different initial gasoline−air mixture volume fractions when igniting at the middle position.
YCH/% P m a x /kPa t m a x /s v a v e /kPa·s−1 E max /kPa2·s−1
1.1566.291.249453.39256,750.22
1.3723.440.5821243.02899,250.39
1.5958.810.3982409.072,309,840.41
1.7991.710.4142395.432,375,571.89
1.91112.860.4292594.072,886,836.74
2.11435.140.4653086.324,429,301.28
2.31041.450.5721820.721,896,188.84
2.51083.230.7401463.821,585,653.74
2.7629.612.553246.62155,274.42
Table 5. Characteristic parameters of explosion overpressure for typical ignition at the top and middle positions.
Ignition PositionYCH/%Maximum Overpressure Peaks (kPa)Time to Reach
Maximum Overpressure Peaks
Maximum
Overpressure
Rise Rates (kPa/ s)
Top–position ignition(a) 1.1543.051.482655.60
(b) 1.9903.380.5478985.28
(c) 2.1862.440.6785671.31
(d) 2.7492.984.178621.22
Middle–position ignition(a) 1.1566.291.249935.46
(b) 1.91112.860.42910,089.80
(c) 2.11435.140.4659324.29
(d) 2.7629.612.5532280.08
Disclaimer/Publisher’s Note: The statements, opinions and data contained in all publications are solely those of the individual author(s) and contributor(s) and not of MDPI and/or the editor(s). MDPI and/or the editor(s) disclaim responsibility for any injury to people or property resulting from any ideas, methods, instructions or products referred to in the content.

