Article

Modeling a Combustion Chamber of a Pulse Detonation Engine

by
Nickolay Smirnov
1,2,
Valeriy Nikitin
1,2,
Elena Mikhalchenko
1,2,* and
Lyuben Stamov
1,2
1
Moscow Center for Fundamental and Applied Mathematics, Lomonosov Moscow State University, 119992 Moscow, Russia
2
National Science Center Kurchatov Institute, Federal Science Center Scientific Research Institute for System Analysis of the Russian Academy of Sciences, 117218 Moscow, Russia
*
Author to whom correspondence should be addressed.
Fire 2023, 6(9), 335; https://doi.org/10.3390/fire6090335
Submission received: 26 July 2023 / Revised: 18 August 2023 / Accepted: 22 August 2023 / Published: 25 August 2023

Abstract

:
This paper presents the results of numerical simulation of a model combustion chamber of a pulse detonation engine using the authors’ developed software package. The main goal of the present study is to numerically investigate the effects of cyclic operation of pulse detonating chambers, as the former studies have been limited to simulating one cycle. To achieve this goal, a new mathematical model for heavy gas was applied simulating condensed fuel phase, which made it possible to accelerate computations and simulate multi-cycle operation of the device. Distributions of such characteristics as temperature, pressure, velocity, concentrations of reagents, intensity of reactions, and thrust force are obtained. A two-stage kinetic model of propellant combustion is proposed. Attention is paid to the main stages of PDE operation: filling of the chamber with reagents, ignition and transition to detonation, products exhaust, purification, and cooling the chamber with a neutral gas. The simulation of the working cycle with the shortest period for the specified system parameters was carried out, the execution time of each stage was obtained, and an assessment was carried out to minimize the main stages of the work cycle. Numerical results demonstrated that the characteristics of the engine cycle are stabilized already in the second cycle: the thrust in the first cycle differs from the thrust in the second by 5%, in the third from the second by 1%. Moreover, details of thrust dynamics in the second and third cycles were studied.

1. Introduction

The concept of using the detonation combustion regime for energy problems and the creation of jet engines was first proposed by Y.B. Zeldovich in 1940 [1]. His theoretical analysis of the cycles of operation of ramjet engines showed that the use of the detonation combustion of fuel provides maximum thermodynamic efficiency. The use of detonation mode of combustion in power devices instead of deflagration could increase their characteristics, which are close to their optimum now. In this regard, there was an interest in the design of detonation engines.
There are several main types of such devices: a pulse detonation engine (PDE), an engine with a rotating detonation wave (RDE), and an engine with stationary detonation wave (SDWE). Each type has its own advantages and disadvantages. The first type has potentially lower traction characteristics due to periodic operation; however, it is more stable due to the absence of the need to stabilize detonation.
The first prototype of a pulse detonation engine was proposed by Hoffman in 1940 [2]. This device was supplied with a gas mixture of acetylene, benzene, and liquid oxygen, and detonation was initiated via the process of spontaneous flame acceleration. In 1957, the results of studies of devices based on pulsed detonation combustion of mixtures of hydrogen and acetylene with oxygen were presented [3]. The results of further studies of detonation engines in the late 1990s were presented in [4,5,6,7]. The work in [4] presented a detailed review of experimental studies in the field of pulsed detonation engines. Assumptions were made about their applicability to real flights. The collection of abstracts in [5] provided an overview of achievements in the field of detonation research, and information on the current situation in this area with an emphasis on the application of detonation to propulsion technology. The articles [6,7] contained an analysis of the problems hindering the widespread use of pulse detonation engines and offered suggestions for overcoming these problems.
To date, most workable projects of detonation engines are based on the transition of combustion to detonation. The possibility of using mixtures of traditional hydrocarbon fuels with air was a subject of research by domestic scientific groups in the early 1980s [8]. As part of these studies, it was shown that liquid hydrocarbons mixed with air could serve as fuel for pulsed detonation engines. The collection [9] presented selected reports from the International Colloquium on Advanced Experiment and Computation of Detonation, which discussed recent advances in understanding the initiation, propagation, attenuation, and control of the detonation wave through experimental and computational research. Moreover, there were proposed schemes with the transfer of a detonation wave from a thin tube, where detonation was initiated, into a chamber of a larger diameter [10], versions with a rotating or pulsed detonation wave in an oncoming supersonic flow [11,12], and schemes with high-frequency resonators [13]. An overview of different configurations of pulsating detonation engines was presented in [14,15].
Interest in the study of such types of engines is increasing every year, as evidenced by the increase in the number of publications on this topic. In the paper [16], the results of the development of an air-jet pulse detonation engine were presented. The paper discussed many important aspects of development, such as initiation and propagation of detonation; valves, synchronization, and control; purging, heat transfer, and repetition rate; noise and effects of multi-tube systems; modeling of the transition between detonation and deflagration; etc. The book [17] contained articles by prominent scientists on fundamental and applied problems of organizing the working process in PDE, on the layout of combustion chambers, inlet/outlet devices, and optimizing their traction performance. In addition, the principles of operation and characteristics of several air-jet and rocket mock-up demonstrators are considered and the results of their firing tests are discussed.
Modeling gas-dynamic flows formed in detonation engines is one of the fundamental stages in the creation and analysis of detonation engine prototypes. Numerical simulation provides a unique opportunity to change the geometry and process parameters smoothly and independently, and to analyze the influence of each parameter. For example, the results of calculations presented in [18] show that the frequency of operation of pulse detonation chambers is limited by the time scale of detonation initiation. Direct initiation of detonation by an intensive energy source leads to a direct detonation setup, and achieves a high engine frequency; however, the associated losses for detonation initiation make the device energy inefficient. A weak ignition source does not allow instantaneous detonation formation, and the detonation combustion regime is achieved in the process of flame acceleration and subsequent transition to detonation, which requires significant spatial and temporal scales. Thus, the frequency characteristics of the engine operation are determined by the time required for the formation of detonation in the engine combustion chamber. In [19], an experimental work was conducted to investigate the impact of nozzle on the wall temperature of the detonation tube. In [20], a combined air valve was designed and tested with a single tube pulse detonation combustor at firing frequencies from 10 Hz to 25 Hz. In [21], an isolator was designed and combined with the optimized air valves to isolate the back-propagated pressure waves. The paper [22] considered various geometries of the pulse detonation engine combustion chamber to effectively suppress the propagation of detonation in the opposite direction using the 2-D numerical simulation. The authors experimentally investigated the effect of the inlets design to better understanding of the thrust generation and the pressure/flame reverse propagation of the air-breathing pulse detonation engines [23]. The experimenters studied the effect of adding hydrogen to biogas on the detonation characteristics of the pulse detonation engine [24].
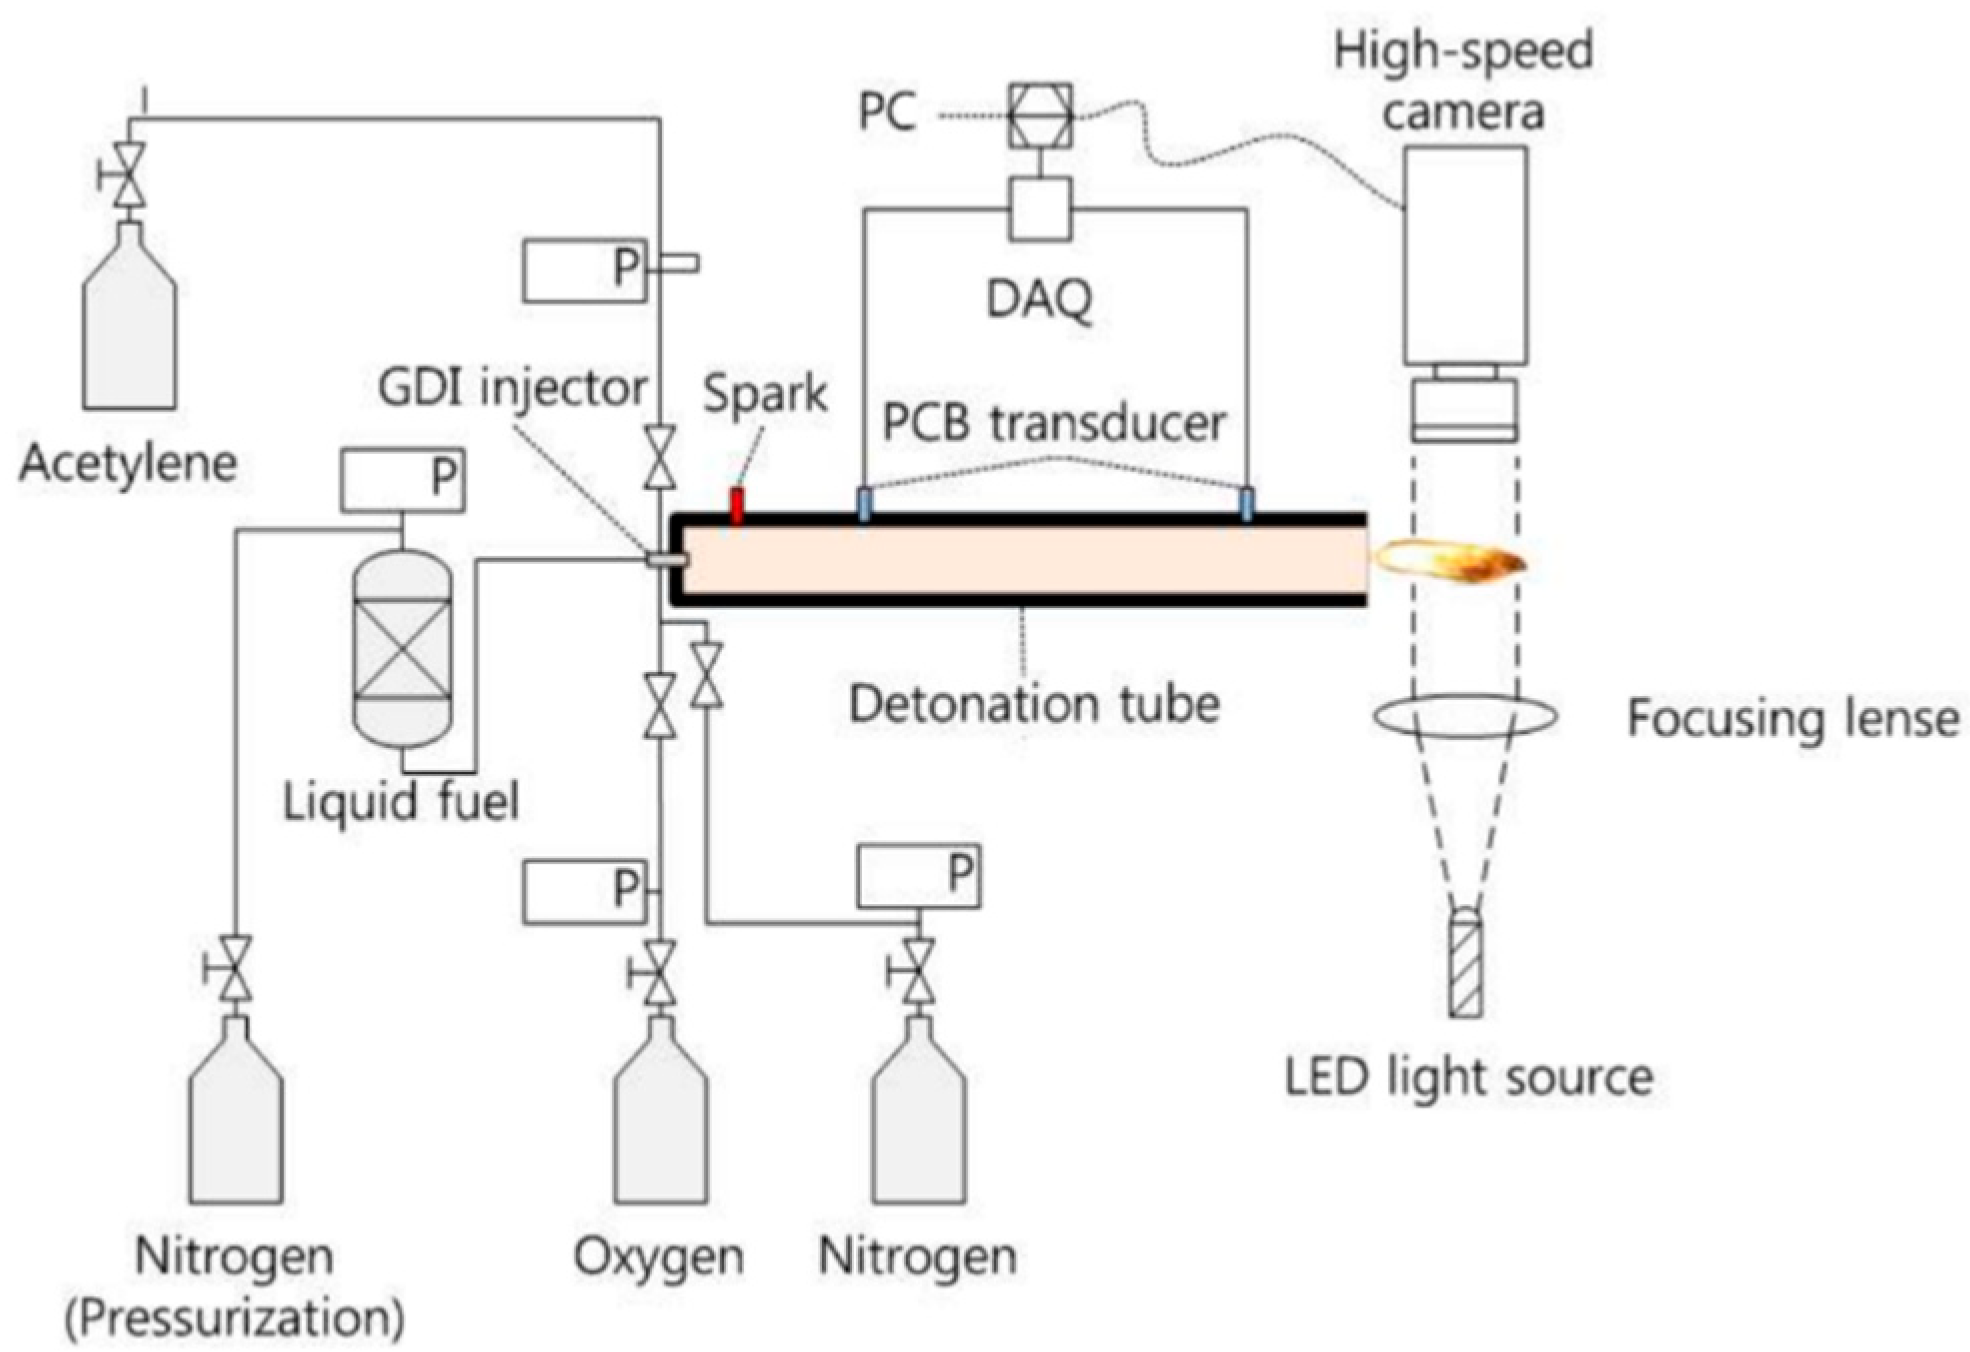
The topic of detonation propulsion devices is very relevant at the present time. One of the urgent problems in the design of propulsion devices is reducing the cost of their development. Computer simulation is of great help in this. In this paper, numerical research of the process in the combustion chamber of an engine is performed. The considered combustion chamber of the engine corresponds to the experimental PDE chamber and is shown in the Figure 1. The study of the influence of activation energy on the chemical processes occurring in the combustion chamber for this chamber was previously carried out in the work [25]. In the current research, attention is paid to the main stages of PDE operation cycle: filling the chamber with reagents, initiating detonation, products exhaust, purification, and cooling the chamber with a neutral gas. Traction characteristics are also evaluated. A simple model with a short kinetics was developed, which nevertheless models heterogeneous processes. The main purpose of the work is to conduct a simulation of the work cycle with the shortest possible period for the specified system parameters and to obtain the work stages duration. A more detailed description of the experimental procedure can be found in [26,27].

2. Mathematical Model

2.1. Mathematical Model of Multi-Component Gas

We simulate a condensed phase with a heavy gas component. This phase is inserted into the combustion chamber as a spray; thus, density of this component models density of the spray. Thus, the mathematical model is based on a gas-dynamic model considering chemical interactions for homogeneous gas mixtures from the works [6,7,18]. The main changes from those works are related to the kinetic mechanism used. The evaporation is also modeled as a chemical reaction, its rate being dependent on temperature and fuel content. One of the main advantages of this model is the following: it enables treating chemical reactions and phase transitions from unique position using the same methodology, which essentially accelerates the computing procedure. The model still has some limitations; in particular, for large droplets the process of their heating and atomization take a relatively long time, which makes the simplified model less valid. Thus, the model is valid for fine droplets and sprays, in which characteristic time for phase transition and diffusion of components is comparable with characteristic time of chemical reaction or less than that. The regime of reaction essentially depends on the dimensionless parameter Ve, which is the ratio of the reaction rate near the surface unit to the mass flow (diffusion rate) to the surface unit [28]. The last strongly depends on the particle’s diameter, which decreases in the process of combustion. The parameter Ve characterizes the mode of heterogeneous reaction: diffusion mode (Ve ≫ 1) or kinetic mode (Ve ≪ 1). The intermediate values of the parameter Ve need both kinetic and diffusion factors being taken into account. Thus, the present model is limited to the cases Ve ≤ 1.
The system of equations of unsteady three-dimensional gas dynamics with several components of perfect gases interacting with each other, using the Wilcox the ka-omega turbulence model and chemical interactions between species, looks as follows [26]:
ρ k t + x j ρ k u j J k j x j = ω ˙ k   ,
ρ u i t + x j ρ u i u j + p x i τ i j x j = 0 ,
E T t + x j E T + p u j x j J T j + u i τ i j = Q ˙ .
The designations are: t —time, x j —spatial coordinate, ρ k —partial density of a species, v j —a component of the Favre-averaged gas velocity, J k j —a component of the diffusion flow of a species, ω ˙ k —intensity of the gas component formation per unit mass due to chemical reactions, ρ —density of the gas phase, p —pressure in the gas phase averaged by Reynolds, τ i j —the component of the stresses tensor in the gas phase, E T —total energy per unit mass of gas, J T j —the component of the energy flus in gas, Q ˙ —intensity of heat energy inflow from an external source.
Algebraic relations modeling density, pressure, and total energy are:
ρ = k = 1 N C ρ k ,
p = R G T k = 1 N C ρ k W k ,
ρ E T = k = 1 N C ρ k e k ( T ) + ρ 2 u j u j + ρ K .
The diffusion flow of components, viscous and turbulent stresses, and the flow of thermal energy are modeled according to the hypothesis of constant Schmidt and Prandtl numbers:
J k j = μ Sc + μ T Sc T x j ρ k ρ ,
τ i j = μ + μ T u i x j + u j x i 2 3 u s x s δ i j 2 3 ρ K δ i j ,
J T j = μ Pr + μ T Pr T x j k = 1 N C ρ k ρ h k ( T ) .
Here, h k ( T ) is the enthalpy per unit mass of a species including the enthalpy of formation.

2.2. Turbulence Model

Turbulence in gas is modeled by two differential equations for turbulent energy K and the intensity of its attenuation ω :
ρ K t + x j ρ K u j = x j μ + σ k ρ K ω K x j + P T β ρ K ω ,
ρ ω t + x j ρ ω u j = x j μ + σ ω ρ K ω ω x j + γ ω K P T β ρ ω 2 + ρ σ d ω K x j ω x j ,
P T = τ i j u i x j ,   μ T = ρ K ω ˜ ,   ω ˜ = max ω , C lim 2 S ¯ i j S ¯ i j β .
Constants and parameters in Equations (10)–(12) correspond to the Wilcox turbulence model [29].

2.3. Gas Mixture Model

The kinetic mechanism used in the work is based on the one-step reaction combustion mechanism of surrogate fuel for kerosene [30]. Another irreversible reaction is added to it for simulating spray evacuation. Simulation of the combustion of a combustible mixture can be carried out quickly using this short kinetic mechanism. Main chemical transformations are modeled by a single irreversible reaction. The parameters of its rate are set by the model ones, they characterize the kinetic combustion mode.
C 12 H 23 + 17.75 O 2 = 12 CO 2 + 11.5 H 2 O , ω 1 = C 12 H 23 O 2 2.587 10 12 exp E 1 R T .
The second reaction simulates spray evaporation, and it is also irreversible. The kinetics of this process simulates properties of the evaporation process, i.e., there should be a sharp increase in the process in the vicinity of the boiling point of the fuel. The coefficients of this reaction used in the work correspond to this process. The spray is modeled by a heavy molecule (C12H23)10 which dissolves into kerosene molecules (C12H23) under thermal influence. Arrhenius law models the intensity of this process:
( C 12 H 23 ) 10 = 10 C 12 H 23 , ω 2 = ( C 12 H 23 ) 10 2.0 10 5 exp E 2 R T .
We used values E 1 = 75 kcal/mol and E 2 = 30 kcal/mol in our simulations.

2.4. Numerical Method

For numerical calculations, a uniform grid of cubic elements is used, each cell size in the presented calculations is 0.25 mm. All distributed parameters and their derivatives are placed in the centers of the cells, while the fluxes are calculated in the middle of the faces. The pseudo-Riemann method AUSM+ by Liou [31] is used to calculate the step of gas dynamics flow calculations applied to the “left” and “right” interpolations on each inner face by the MUSCL method [32] with the Koren variable gradient limiter [33] in order to provide second-order interpolation outside the regions of high gradients of variables. The flows on the outer faces corresponded to the boundary conditions set there. The AUSM method directly allows you to implement both supersonic and subsonic free output with back pressure setting using the same algorithm. A modified A-stable (4,2) Novikov method with a precision control was implemented to solve a stiff system of algebraic-differential kinetic equations simulating chemical reactions [34].
The validation of the program code was carried out on the basis of numerical experiments on the calculation of one detonation cycle by comparing the results with experimental data obtained with the help of equipment shown in Figure 1. The details of comparison can be found in the paper [26]. The results show that the qualitative and quantitative agreement between the experimental and simulation data is quite good, and the combustion and detonation phenomena are modeled with acceptable accuracy.

3. Geometry of the Combustion Chamber

A three-dimensional round tube with a radius R = 10 mm and a length of 200 mm is considered as the design area. The combustible mixture is supplied from a nozzle with a diameter of c = 6.35 mm. A Shchelkin spiral is used to maintain detonation or flame in the system. The diameter is b = 3.5 mm, and pitch a = 7.1 mm (Figure 2).
The geometry of the work area is shown in Figure 2. Initially, the combustion chamber is filled with nitrogen, the pressure in the chamber is 1 bar, and the temperature is 400 K. After the start of fuel supply, a spray (diesel) enters the chamber at a pressure of 15 bar and a temperature of 500 K. The chamber begins to fill with fuel and air, and at the time of 0.6 ms, ignition is carried out by the injection of energy.

4. Results

4.1. The First Cycle of Operation of the Detonation Combustion Chamber of the Engine

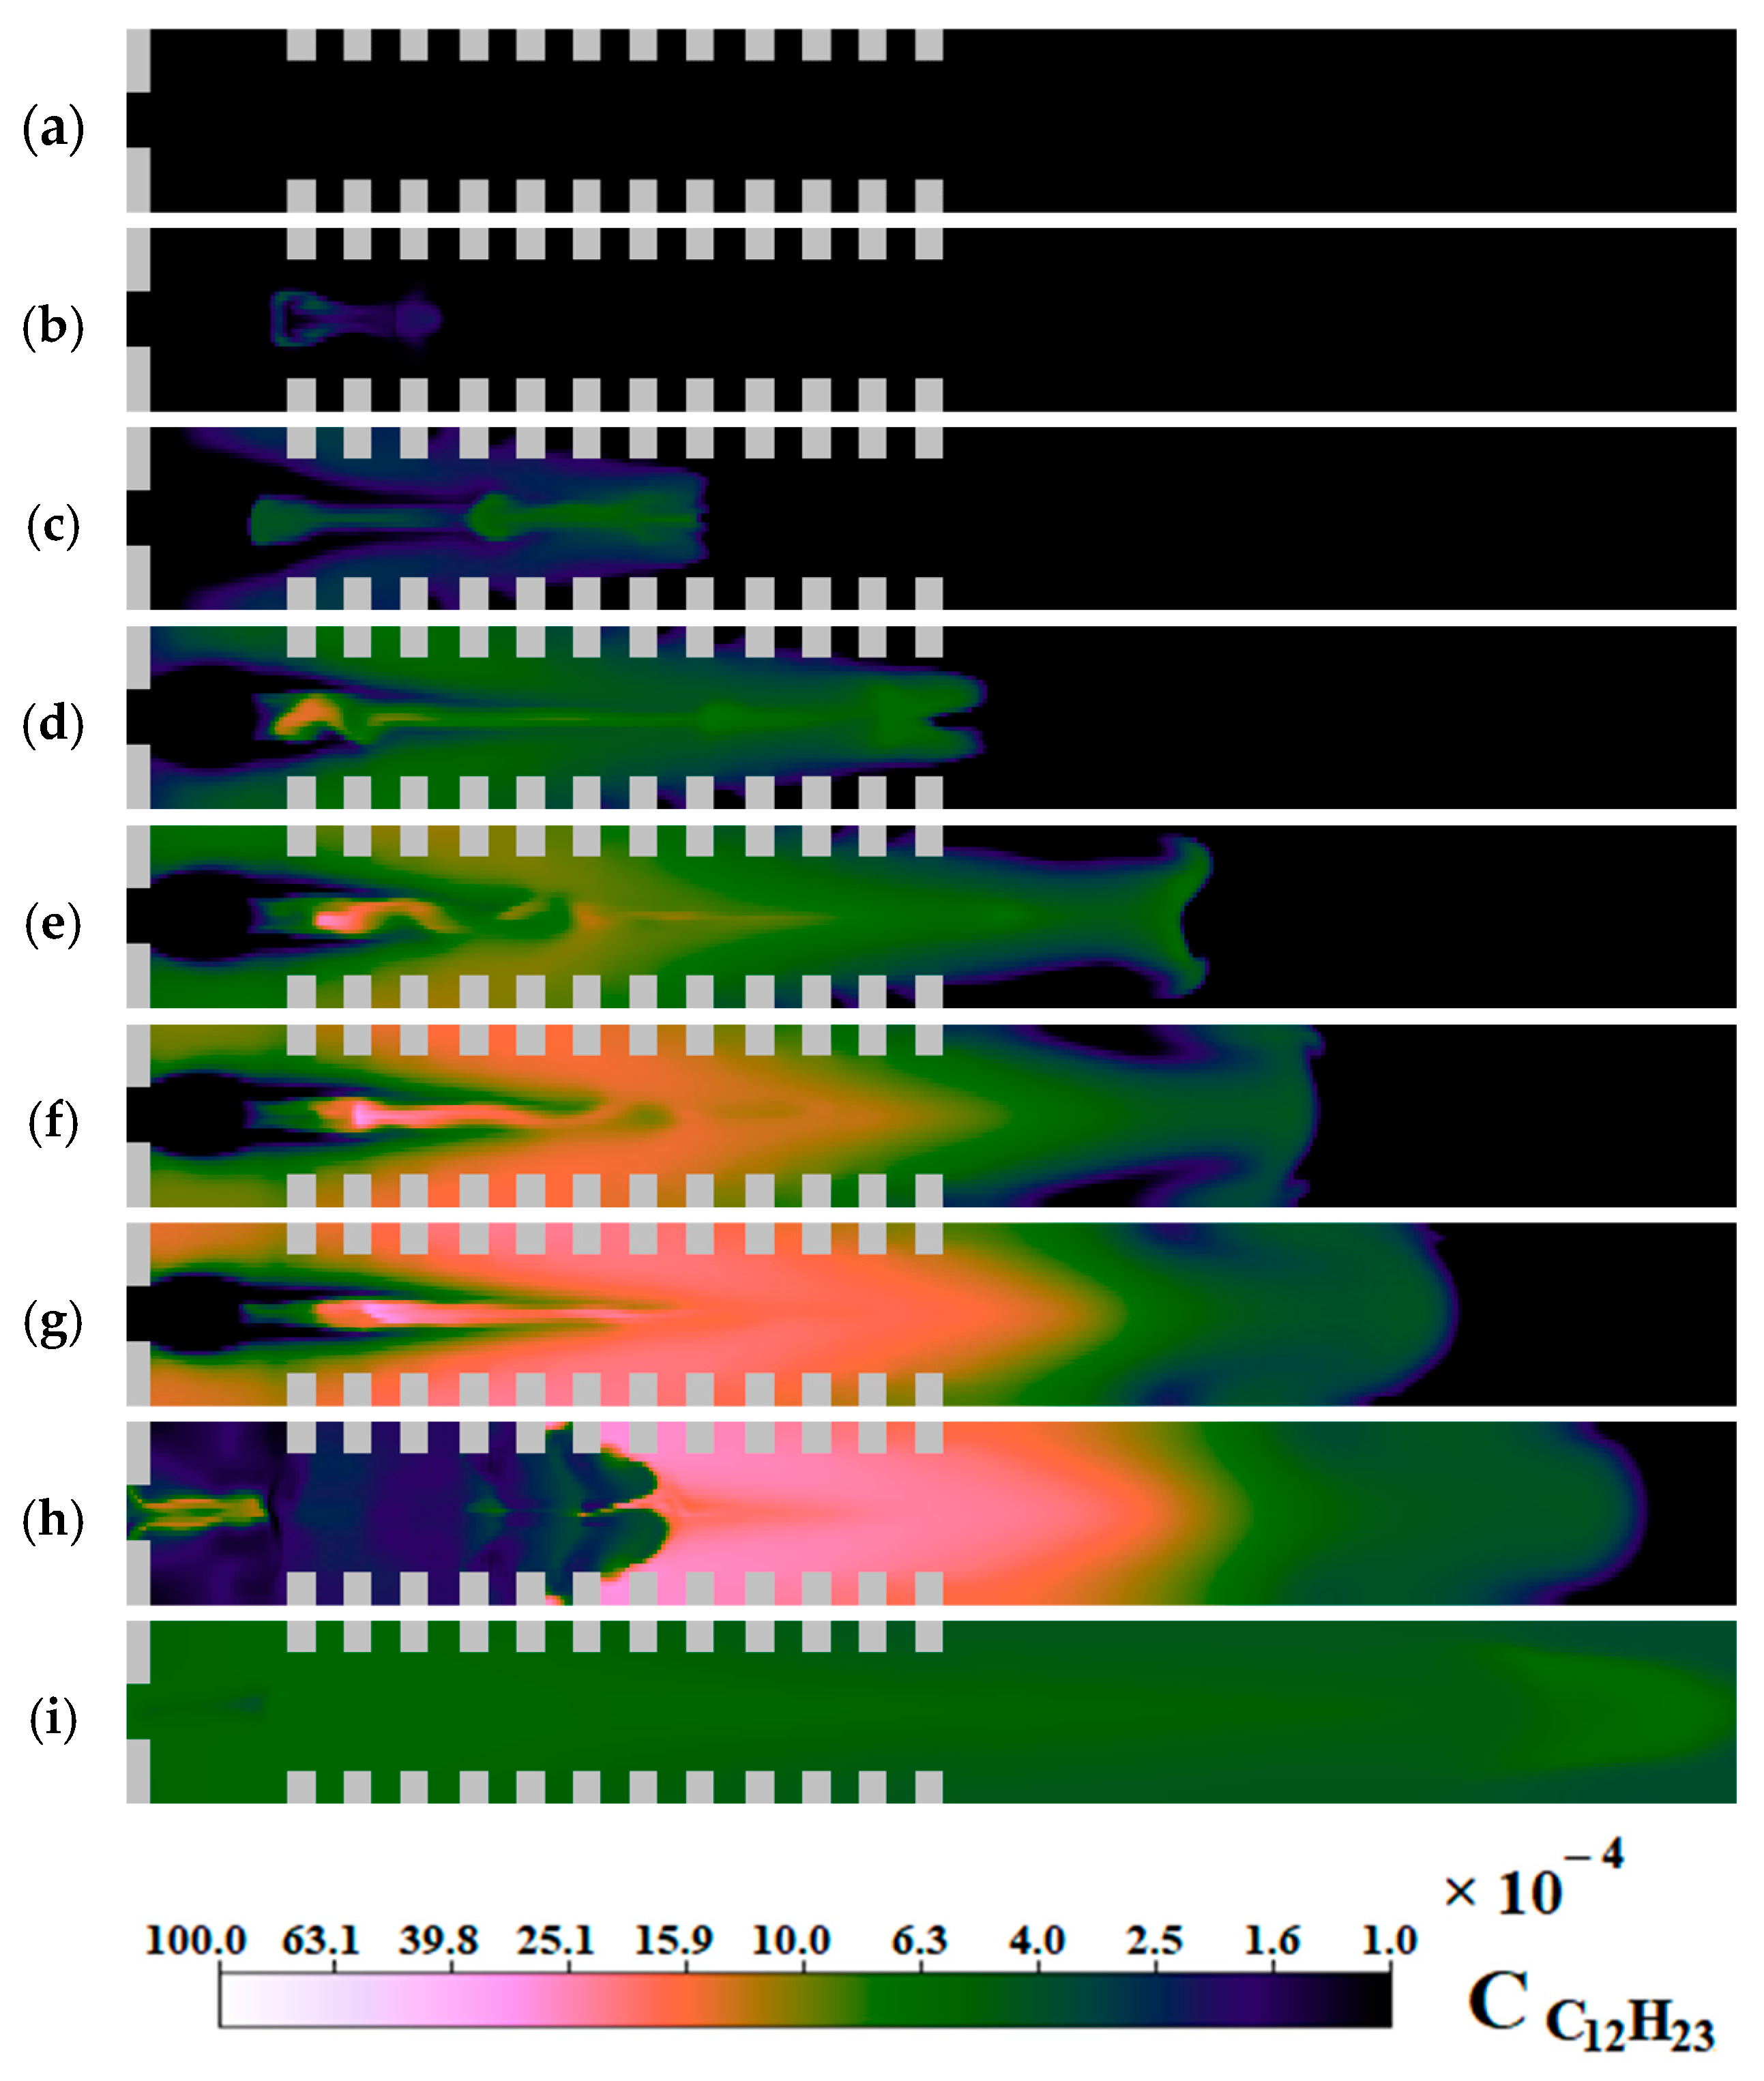
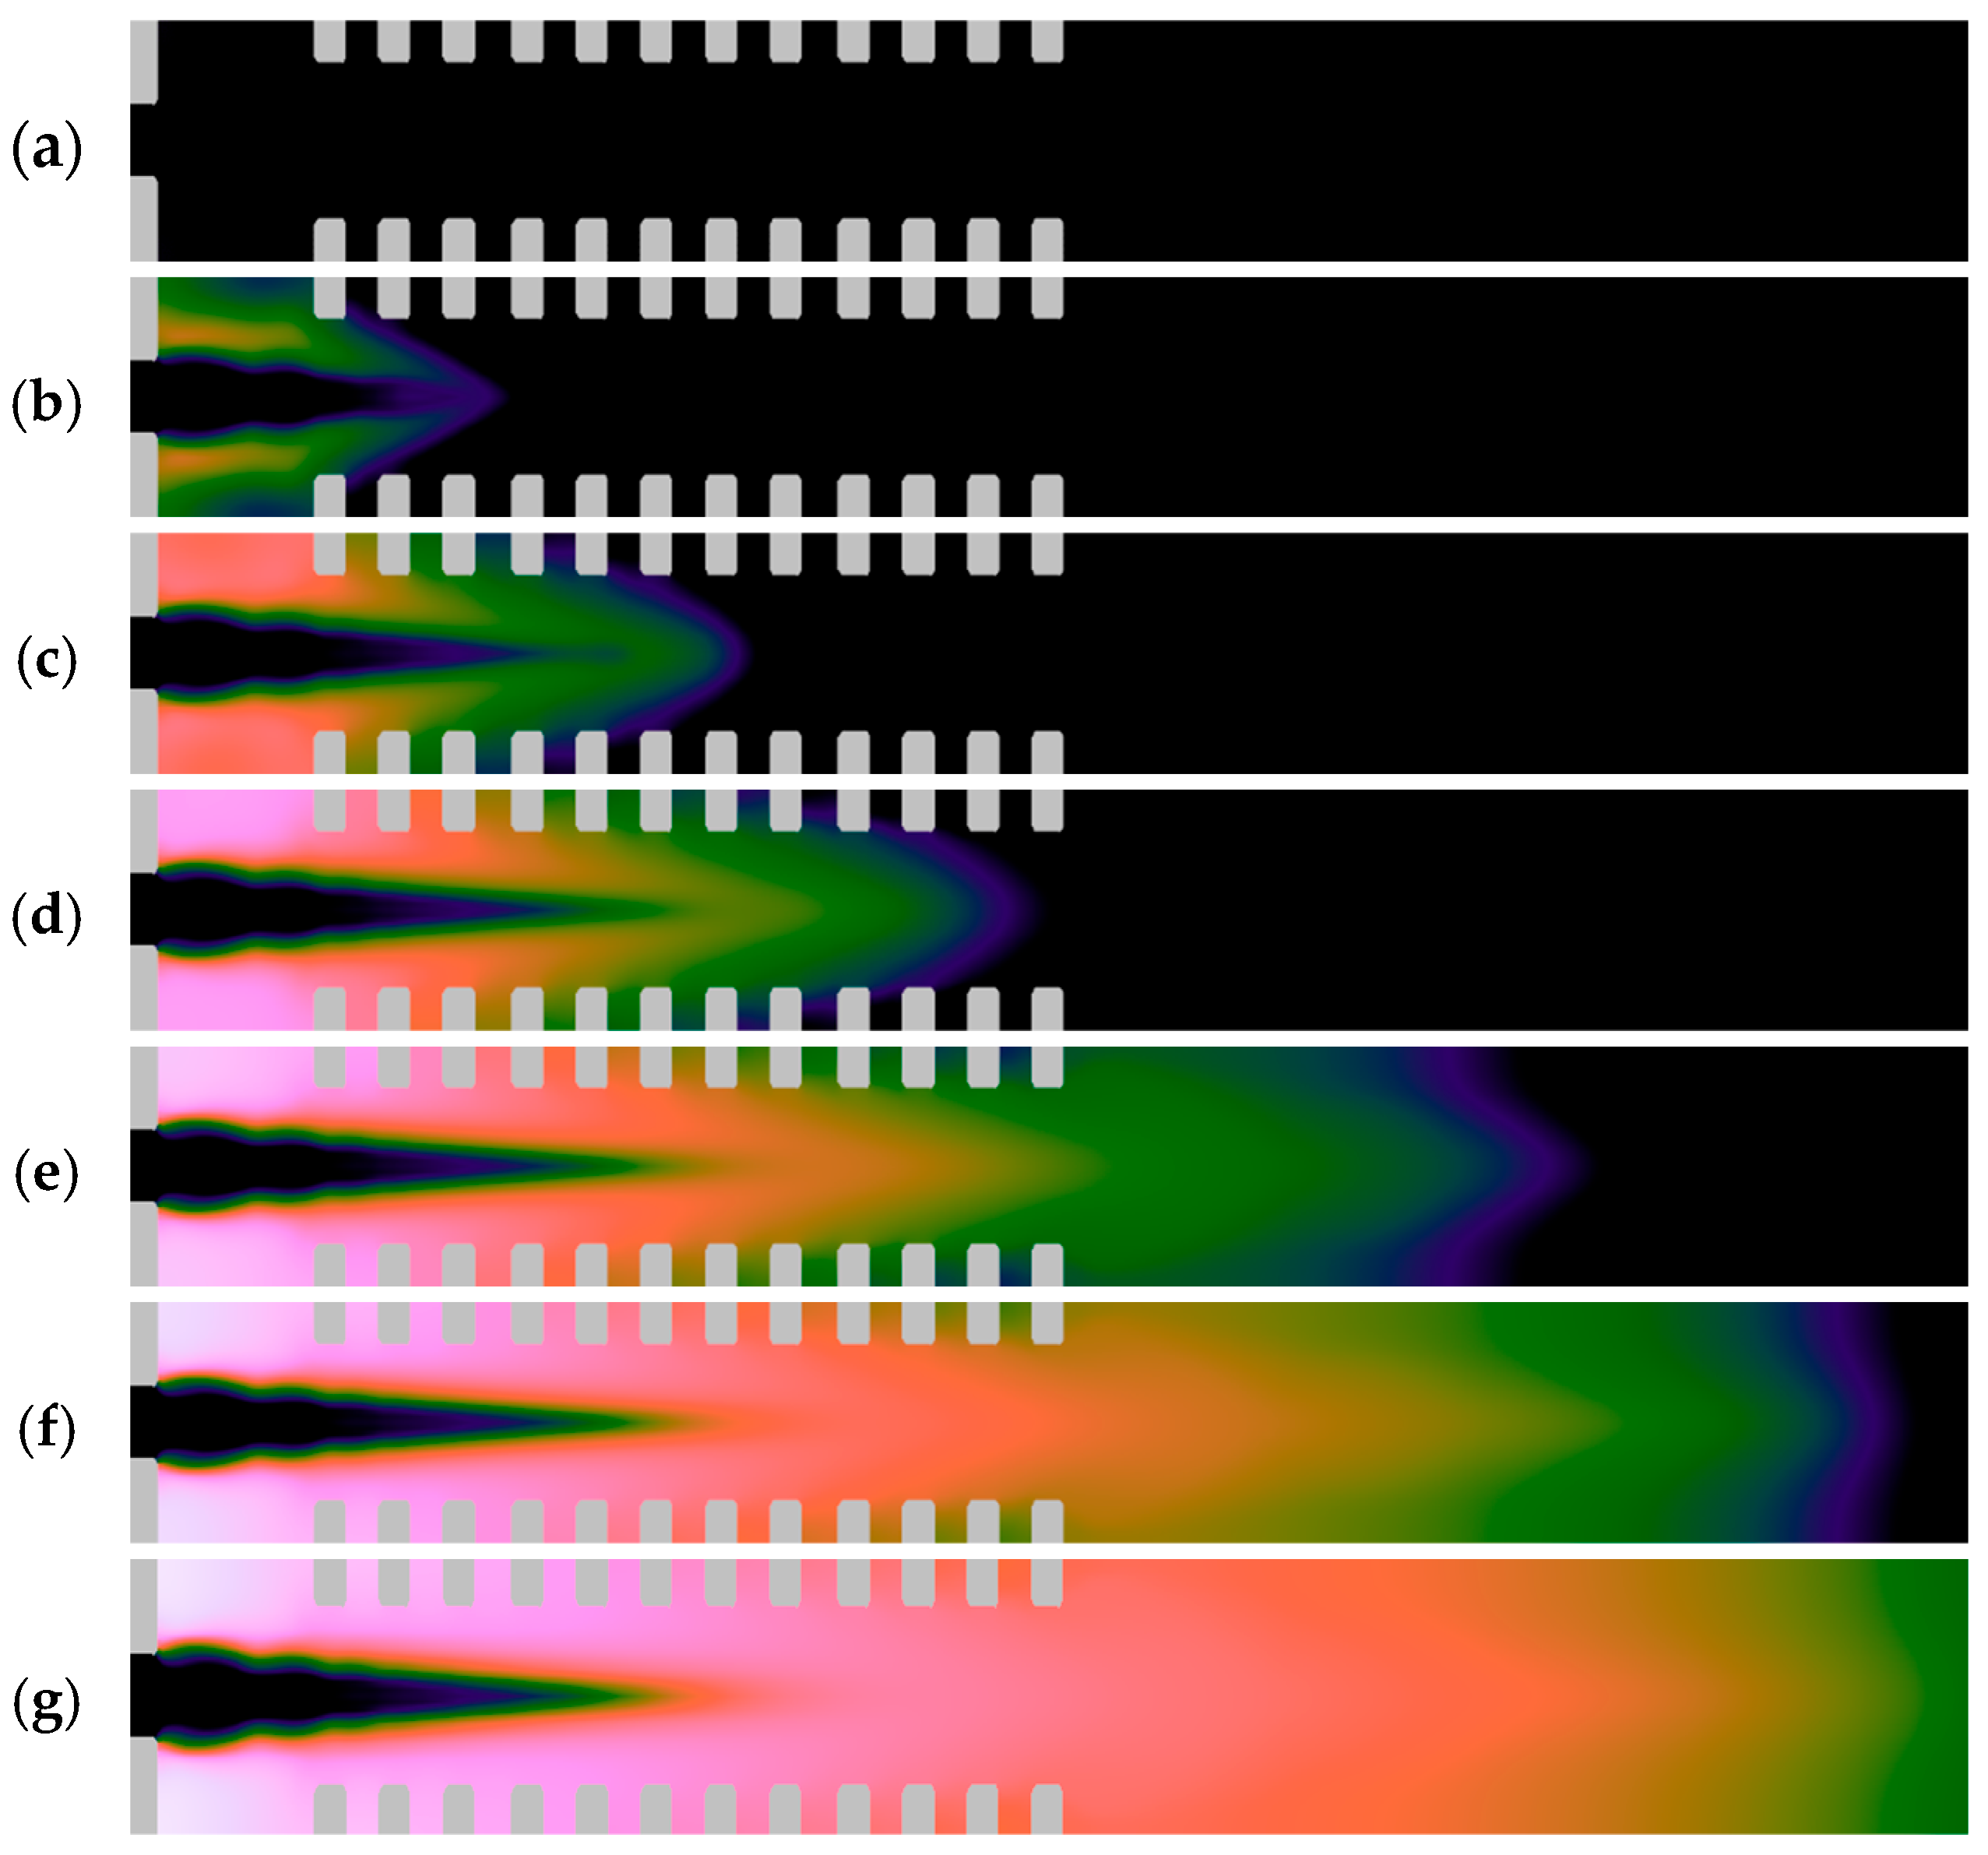
Figure 3 shows the distribution of diesel fuel droplets at different times. After the start of filling, the droplets are distributed in a symmetrical manner throughout the combustion chamber from the moment the supply starts and up to 200 µs. Further, due to instabilities, the distribution of spray becomes slightly asymmetric. The droplets begin to fall into the regions between the roughness of the Shchelkin spiral. At the time of 0.6 ms, after the ignition, the spray begins to evaporate more actively; in the figure, with the time of 0.6 ms, the initiation region is visible. At the time instant of 0.7 ms, after the initiation of detonation, the region with the absence of droplets increases due to their evaporation. From the moment of time 0.8 ms, there are almost no drops left in the chamber.
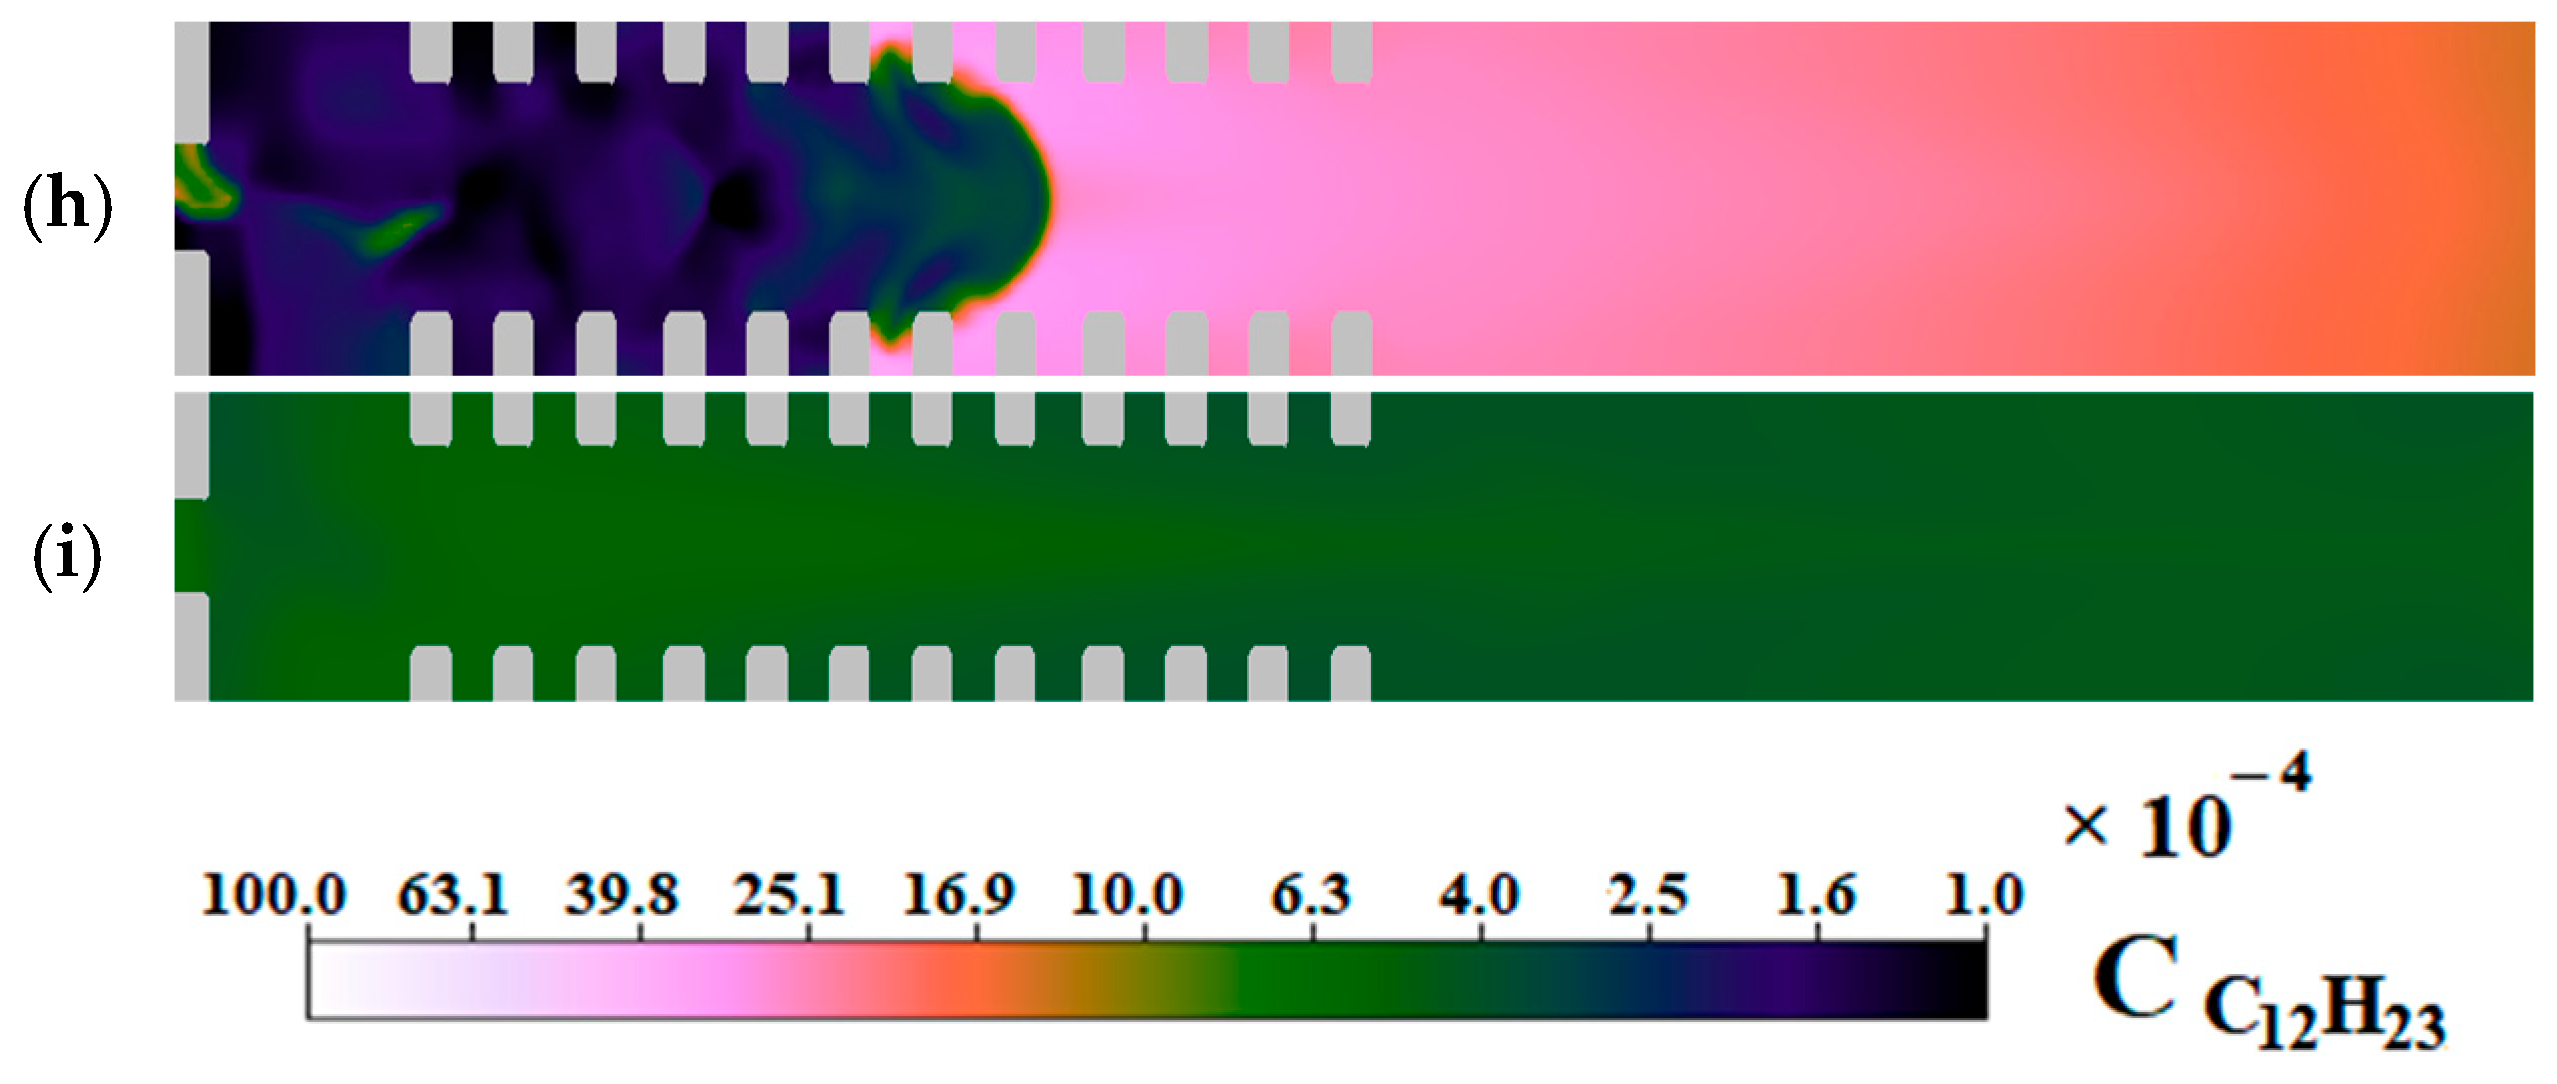
Figure 4 shows the distribution of the molar density of the gaseous phase of fuel at various points in time. The active evaporation phase is visible at a time of 0.1 ms in the region with an increased droplet density. Further, the process gradually intensifies until the start of initiation. After the formation of a detonation wave, the fuel begins to be actively consumed at its front. After 0.8 ms, a small concentration of fuel remains in the chamber, which may be enough to ignite again if not cleaned.
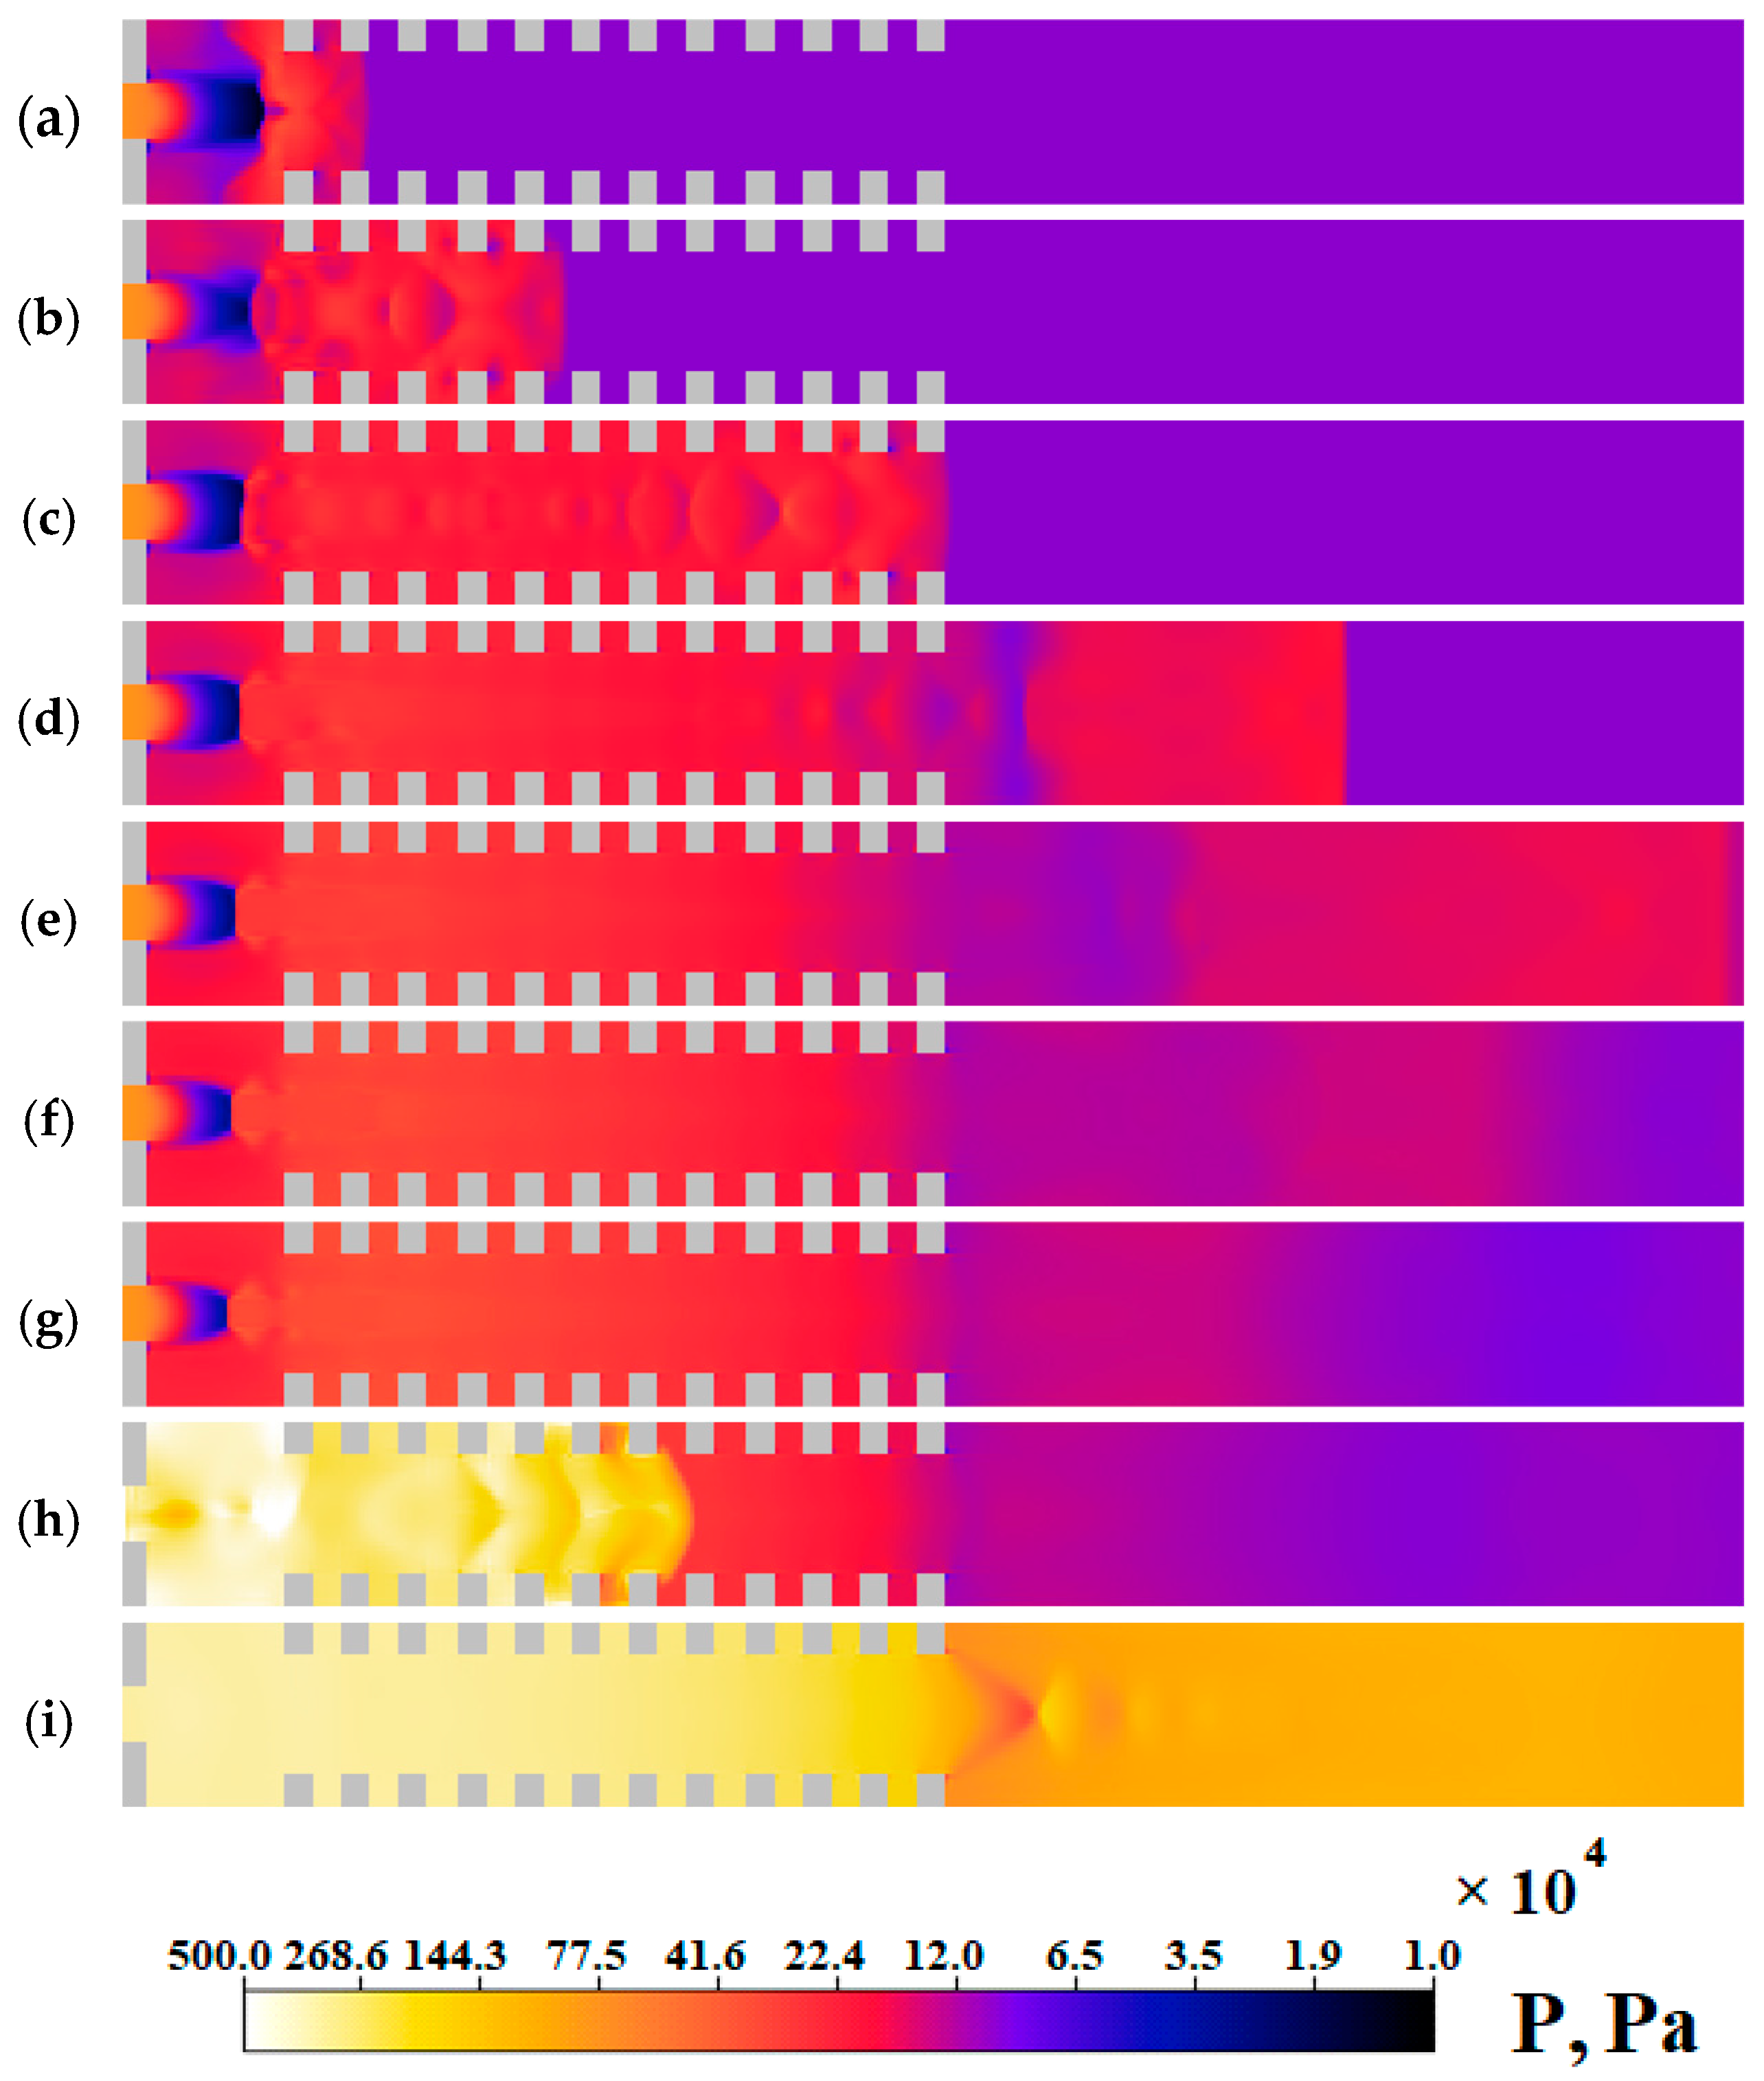
Figure 5 shows the distribution of the pressure field in the combustion chamber at different times. After switching on the supply of reagents, the pressure in the chamber begins to increase in the region of the jet, after the flow touches the Shchelkin spiral, the pressure in front of the spiral increases slightly due to the partial blocking of the flow by the spiral, Figure 5, the time point is 0.05 ms. Further, due to the waves reflected from the elements of the Shchelkin spiral, there are also areas of increased pressure at time points from 0.1 ms. The maximum pressure peak is observed after 0.6 ms, that is, after the start of the mixture initiation (time 0.7 ms). After the detonation wave passes along the entire length of the chamber, the pressure decreases gradually: this is the stage of burnt gases exhaust.

4.2. Cleaning the Combustion Chamber

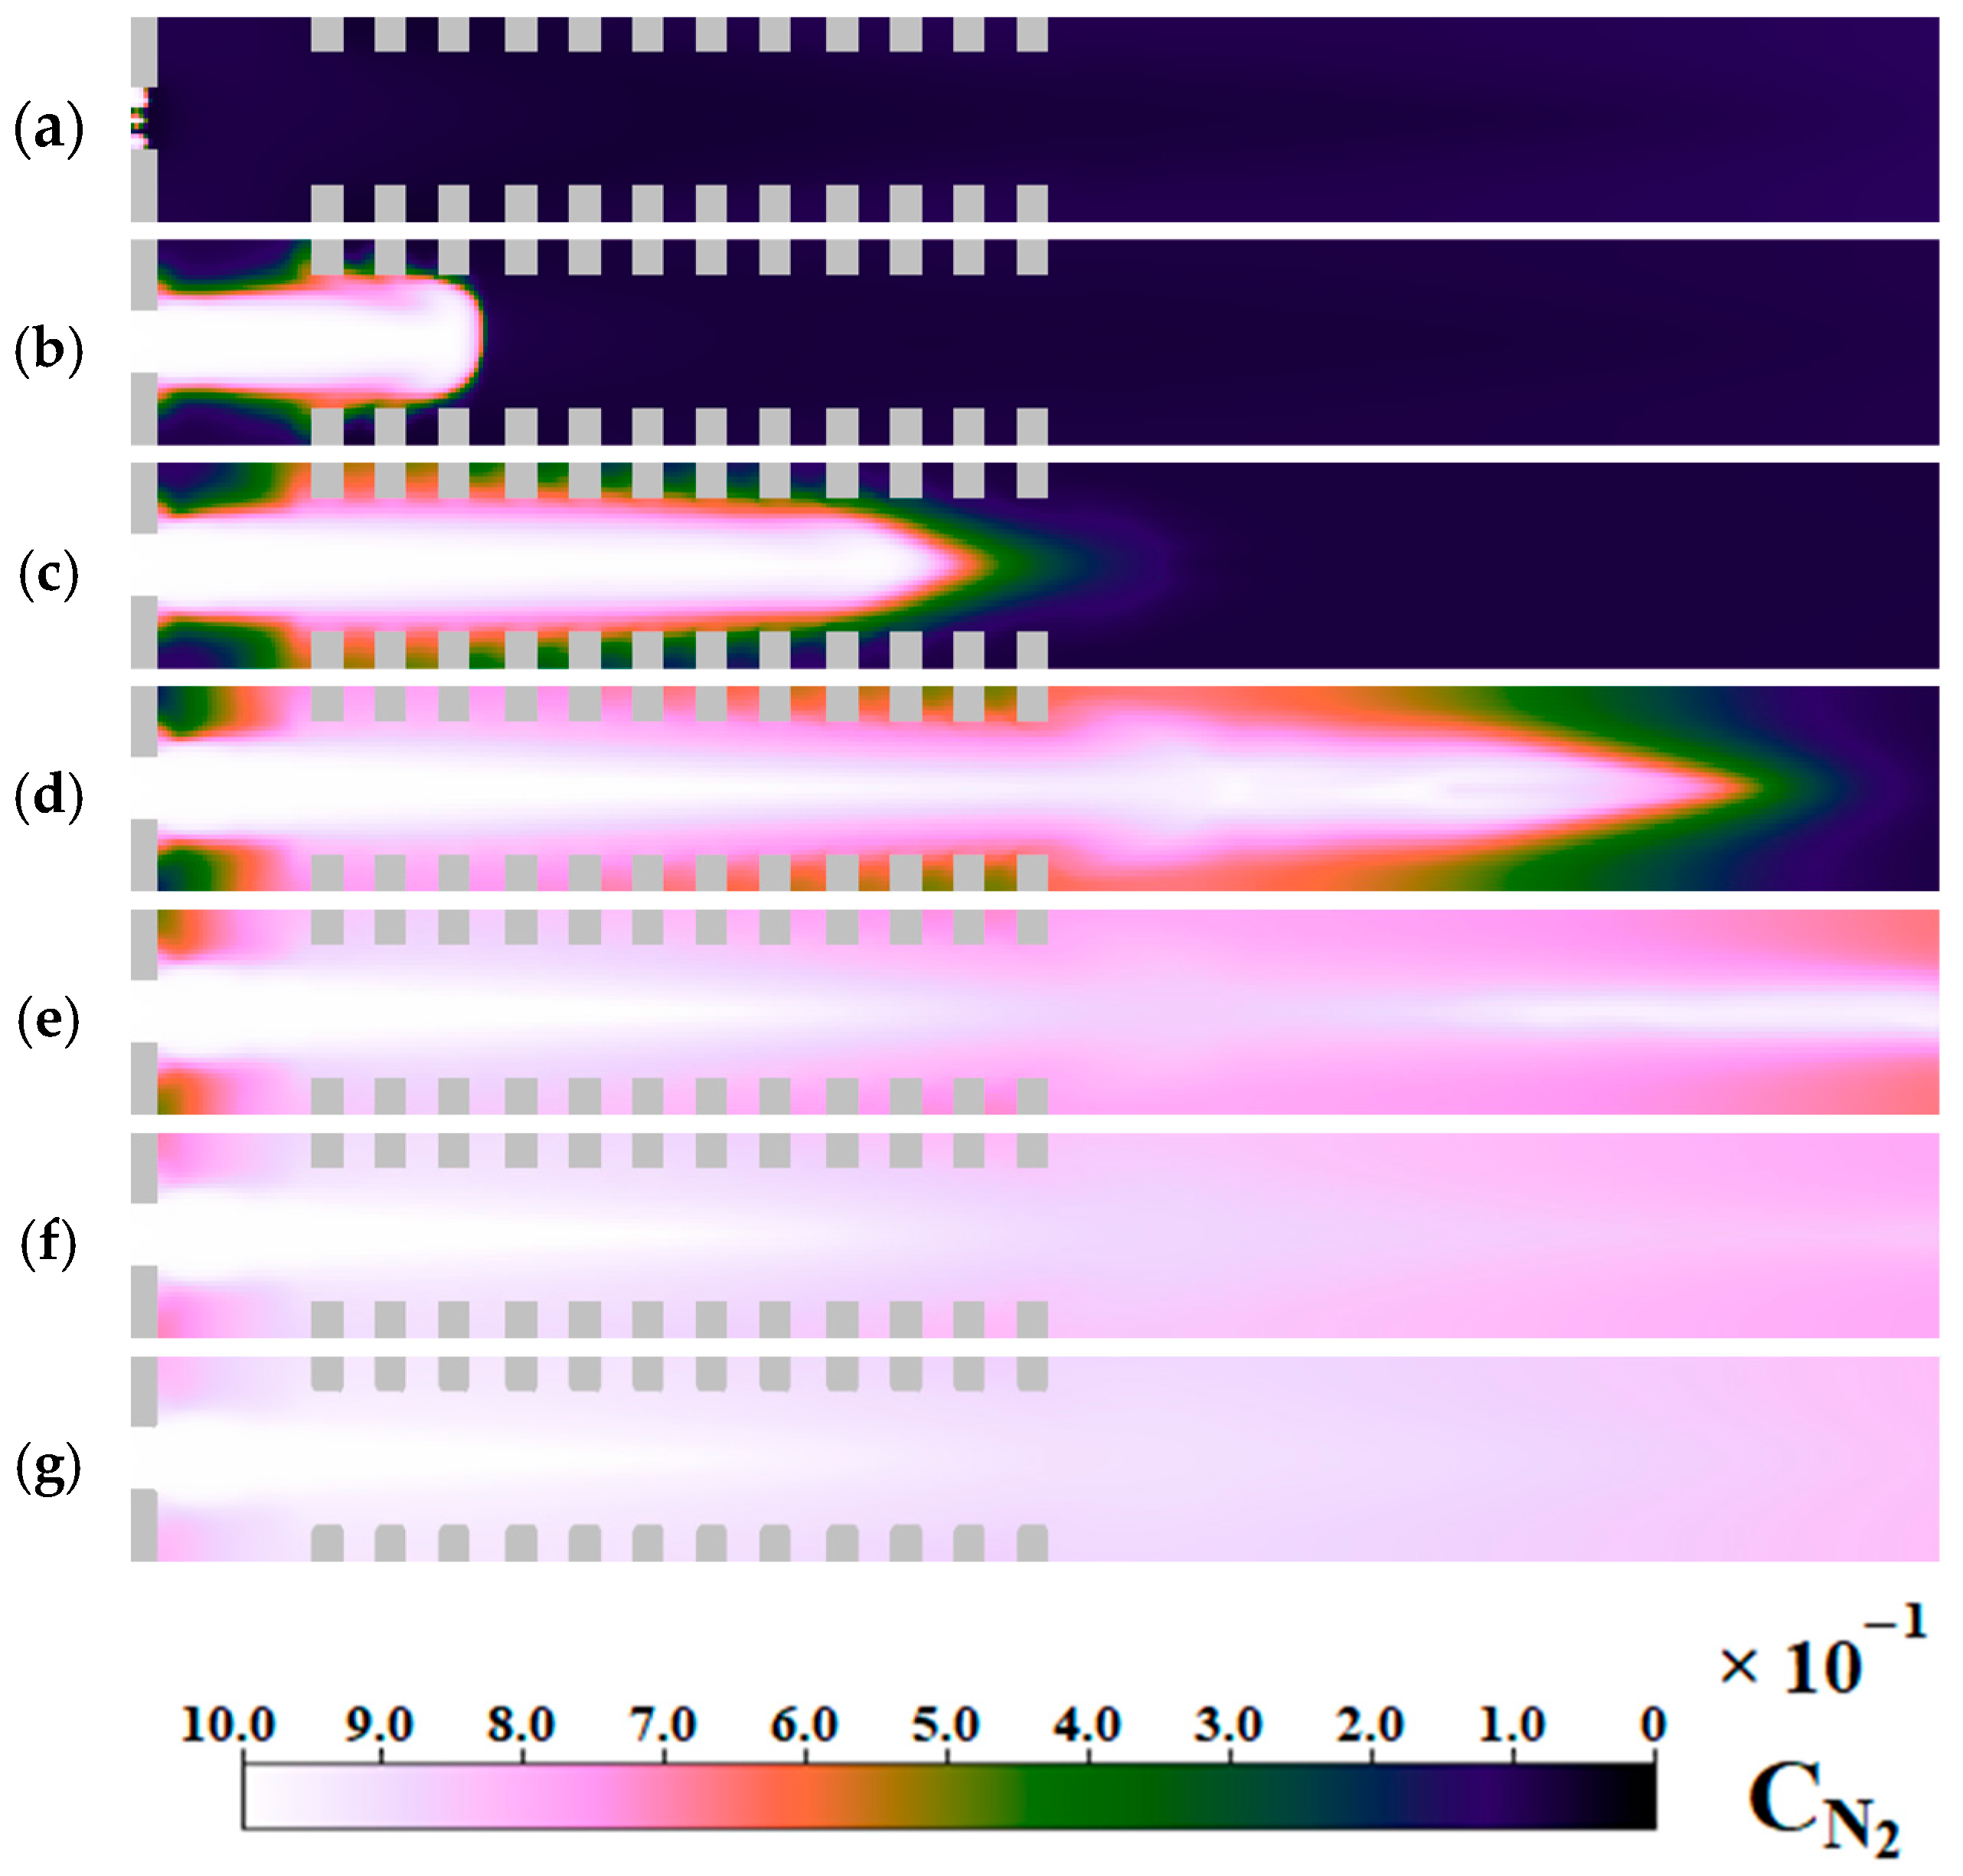
After the passage of the detonation wave and the pressure drop in the chamber, the process of cleaning the chamber from combustion products begins. This process starts at time 1095 μs. Figure 6 shows the nitrogen molar density distribution at the time from 1.1 ms to 1.7 ms. Nitrogen enters the combustion chamber and gradually displaces the combustion products. By the time of 1.7 ms, the chamber is almost completely filled with neutral gas.

4.3. Second Cycle, Filling Stage

After cleaning the combustion chamber from combustion products with the neutral gas, the next stage of filling with fuel begins. The second cycle lasts from 1.7 ms to 3.4 ms.
Figure 7 shows the evolution of the liquid phase molar fraction of fuel in the OXY section during the second cycle. Unlike the first cycle, the feed is already carried out into the moving system, the flow is distributed along a more elongated trajectory, the fuel concentration in the pockets of the Shchelkin spiral is slightly less than in the rest of the chamber cavity, and the concentration is also small from the end in the feed zone. After the detonation is initiated, the detonation wave pushes the fuel more actively with the flow.
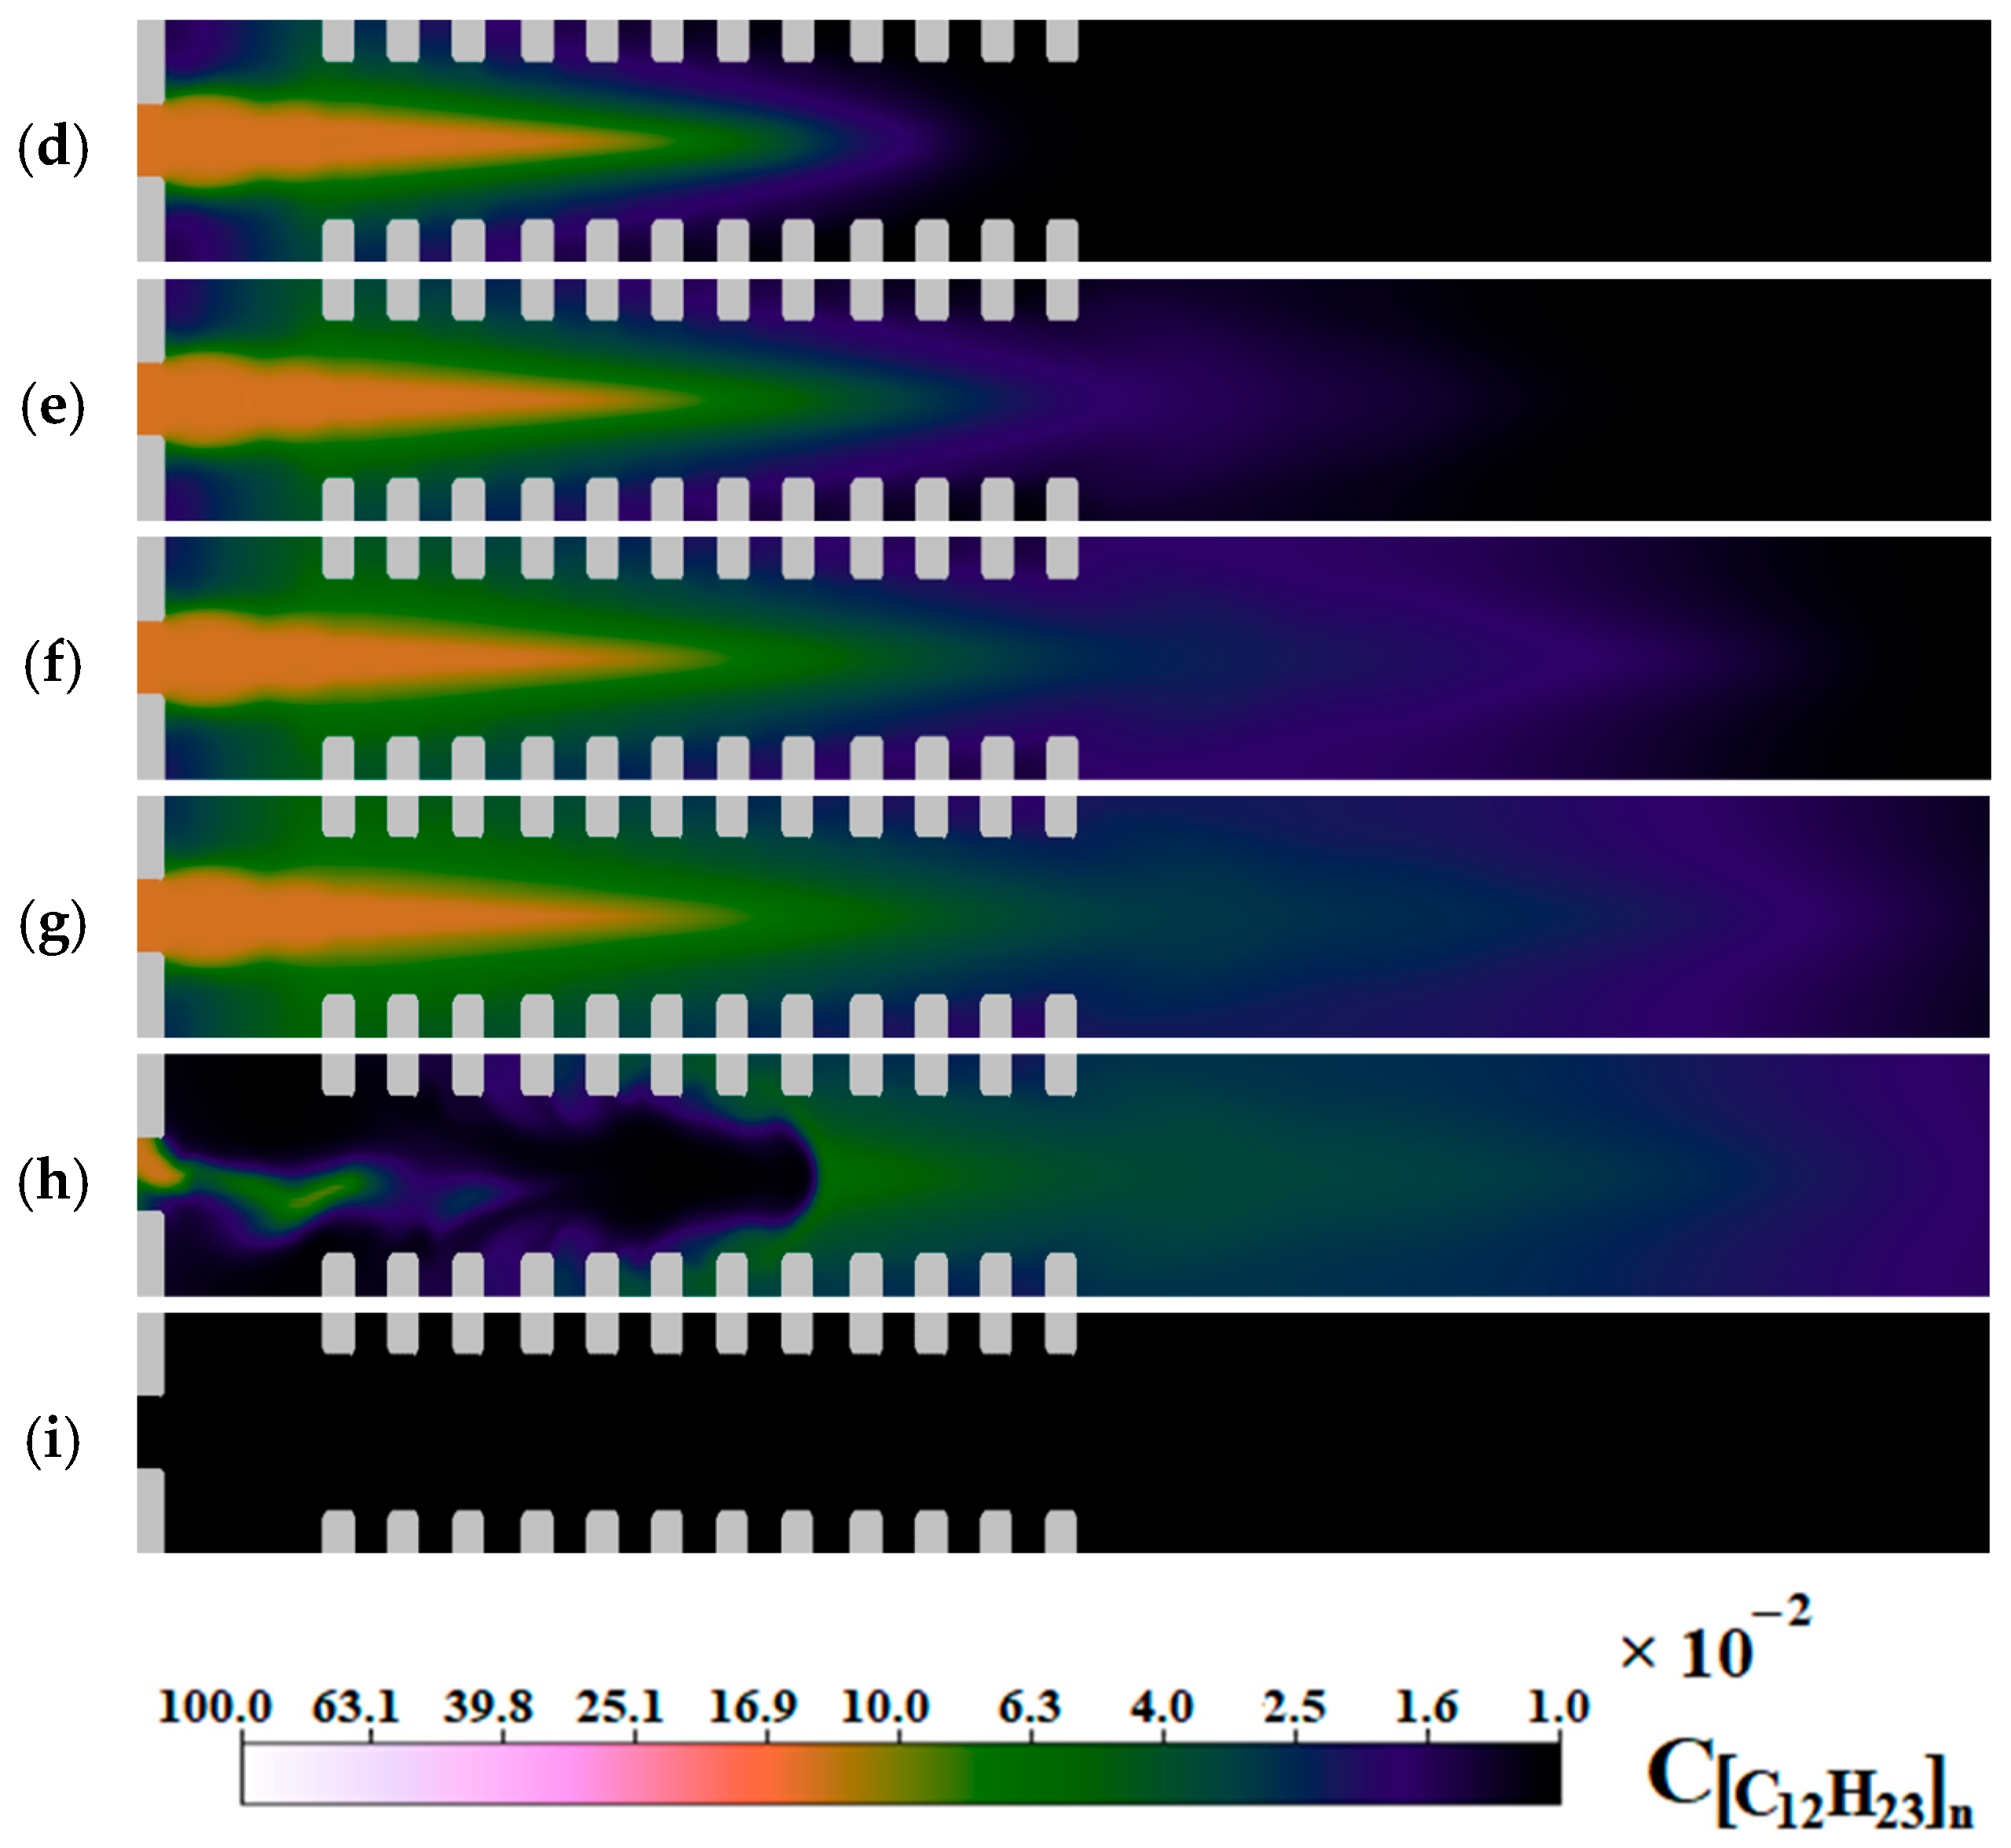
Figure 8 shows the distribution of the gas phase of the fuel. In the process of filling with spray, droplets evaporate and a cloud of the gas phase of the fuel is formed around the liquid phase flow. The process is like this in the first cycle. The ignition stage starts at 2.3 ms; the pressure and temperature graphs show the stages of development of the ignition of the 2nd cycle.
Figure 9 shows the pressure field in the OXY section. In this figure, one can see the trace of initiation in the form of an area of high pressure not far from the location of fuel supply. One can clearly see the increase in pressure at the time 2301 μs. Further, the waves diverge in a spherical manner and reflected from the walls, triple points are formed with a higher-pressure jump, in which the transition from combustion to detonation is formed. Passing along the Shchelkin spiral, the detonation wave is even more intensified.
Further, the chamber is again purged with the neutral gas. By the end of the purge (3.4 ms), the maximum concentration of nitrogen is in the chamber, as in the first purification stage, a small amount of reaction products remains in the zone of the Shchelkin spiral and in the supply area. After the cleaning stage, the filling of the chamber with fuel is switched on again.
On average, for three cycles of operation of the combustion chamber, the following results were obtained according to the time characteristics of the processes: up to 600 µs primary fuel injection, 600–601 µs ignition, 850 µs switching of boundary conditions, 1100 µs actual start of blowing, 1700 µs end of blowing and switching to fuel injection, 2300–2301 µs the second ignition, 2550 µs switching of the boundary conditions, 2812 µs the beginning of the second purge, 3400 µs the end of the second purge and the start of fuel supply, then initiation at 4000 µs, and the stage of detonation fuel combustion and the beginning of a new chamber purge at 4523 µs.

4.4. Traction Characteristics

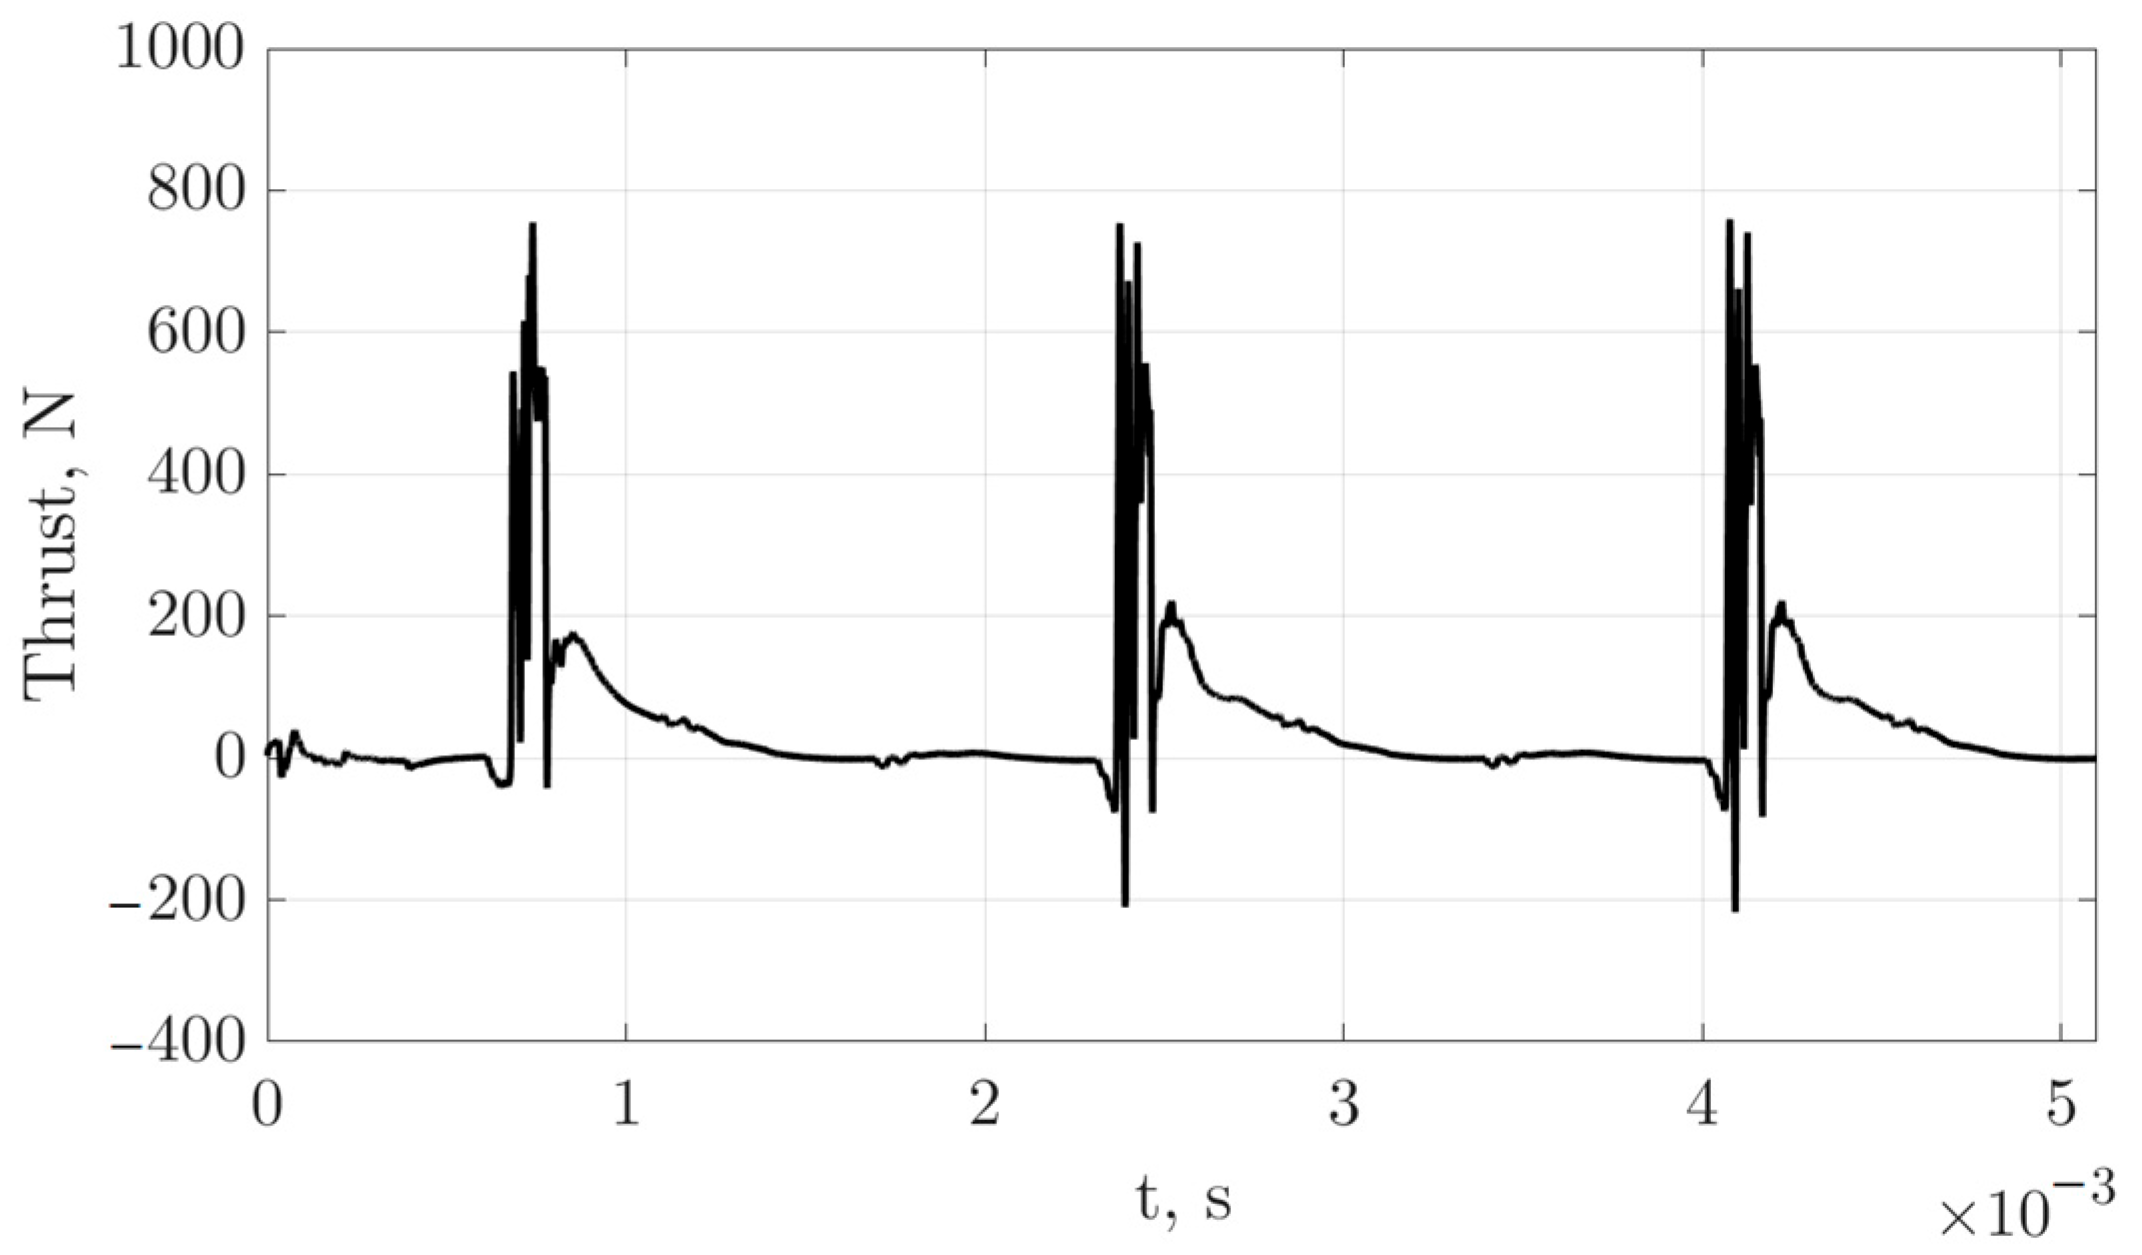
Figure 10 shows the change in thrust over time for all three cycles. At the stage of fuel supply, the thrust is minimal, then increases sharply, giving several peaks, then drops rapidly at first, after which it reaches almost zero.
The average power characteristics obtained during three cycles of the device operation are presented in Table 1.
The thrust indicators in each cycle are close, but in the first cycle, they differ from the second by 5%, while the indicators of the second cycle differ from the third by 1%. Such a small difference indicates the stabilization of the device already in the second cycle.
Due to long periods of filling and cleaning, in terms of traction characteristics, a pulse engine is significantly inferior to a continuous one, the thrust of which would be comparable in order of magnitude with the same parameters of the supplied reagents and chamber dimensions to the thrust of a pulsed engine at the stage of combustion and exhaust. Nevertheless, the pulse engine is distinguished by the stability of its cycle, since the latter is determined by external influences at each cycle, while in a continuous detonation engine, after it has been started, only the supply of reagents can be affected.

5. Discussion

As a result of three-dimensional numerical simulation of several cycles of the detonation combustion chamber, it was found that the characteristics of the engine cycle are stabilized already in the second cycle: the thrust in the first cycle differs from the thrust in the second by 5%, in the third from the second by 1%. In addition, such details of thrust dynamics coincide or are very close, such as the magnitude of the peaks formed due to the impact of the detonation wave on the internal elements of the combustion chamber, including the Shchelkin spiral, which serves to turbulize the flow and accelerate the transition from combustion to detonation.
It was found that the ignition should be carried out close enough to the front end of the combustion chamber that the exhaust pipe of the chamber should not be too long, or the filling of the chamber should be incomplete, but the area of the Shchelkin spiral must be filled with reagents before ignition. The activation energy of the fuel should not be too high, otherwise the transition to detonation will not occur, and the ignited part of the fuel will not be able to ignite the rest before being thrown into the exhaust. However, it should not be too small, since too sensitive fuel will ignite immediately at the beginning of the cycle due to the parts of the chamber that have not yet cooled down: for them to cool down enough, it will be necessary to increase the time it is purged with cold gas, which will lengthen the cycle and reduce the average thrust.
An ignition energy of 0.33 J is released in a region with a radius of 2 mm for 0.01 ms. Such a sufficiently high energy and a short time of its release are needed to ignite the reagents in the supersonic flow, while the resulting hot region was powerful enough not to be knocked down by this flow and, therefore, the ignition would reliably lead to a rapid ignition of the turbulent mixture in sufficient volume. The lower ignition energy led to the fact that the hot area was blown away by the flow and did not have time to ignite the reagents in the combustion chamber in an acceptable time, without delaying the cycle time of the device. The indicated energy leads to the fact that the burnt gases lead to local deceleration of the supersonic flow, which adiabatically raises the temperature and contributes to an even faster spread of the flame. This speed is fundamental: the sooner the flame reaches the Shchelkin spiral, the sooner the transition to the detonation regime will occur.
The reagents were supplied mixed and in such a way that, upon complete evaporation of the initial fuel, the combustible gases formed a stoichiometric mixture. The combustion of such a mixture leads to the highest yield of combustion products per unit mass of supplied reagents and, accordingly, to the highest energy, which leads to an optimally high pressure in the chamber at the time of combustion of the reagents and thus to the best traction characteristics. For the studied fuel C12H23, there are 17.5 molecules of oxygen O2 per molecule of the gaseous state in the stoichiometric mixture. This gives the required ratio of reactants: 3.36 mass units of oxygen should be per unit mass of fuel.
With these cycle parameters, the frequency of operation is 688 Hz, and the cleaning time is approximately equal to the fuel injection time. The engine stroke time (burning and exhaust before cleaning) is about a third of the cycle, other characteristics that we have tested increase the fuel supply time or the cleaning time, thereby reducing the stroke time and, accordingly, the average thrust. Comparison with the experiments conducted in [26,27] showed that it is possible to increase the frequency of work due to incomplete filling of the combustion chamber.
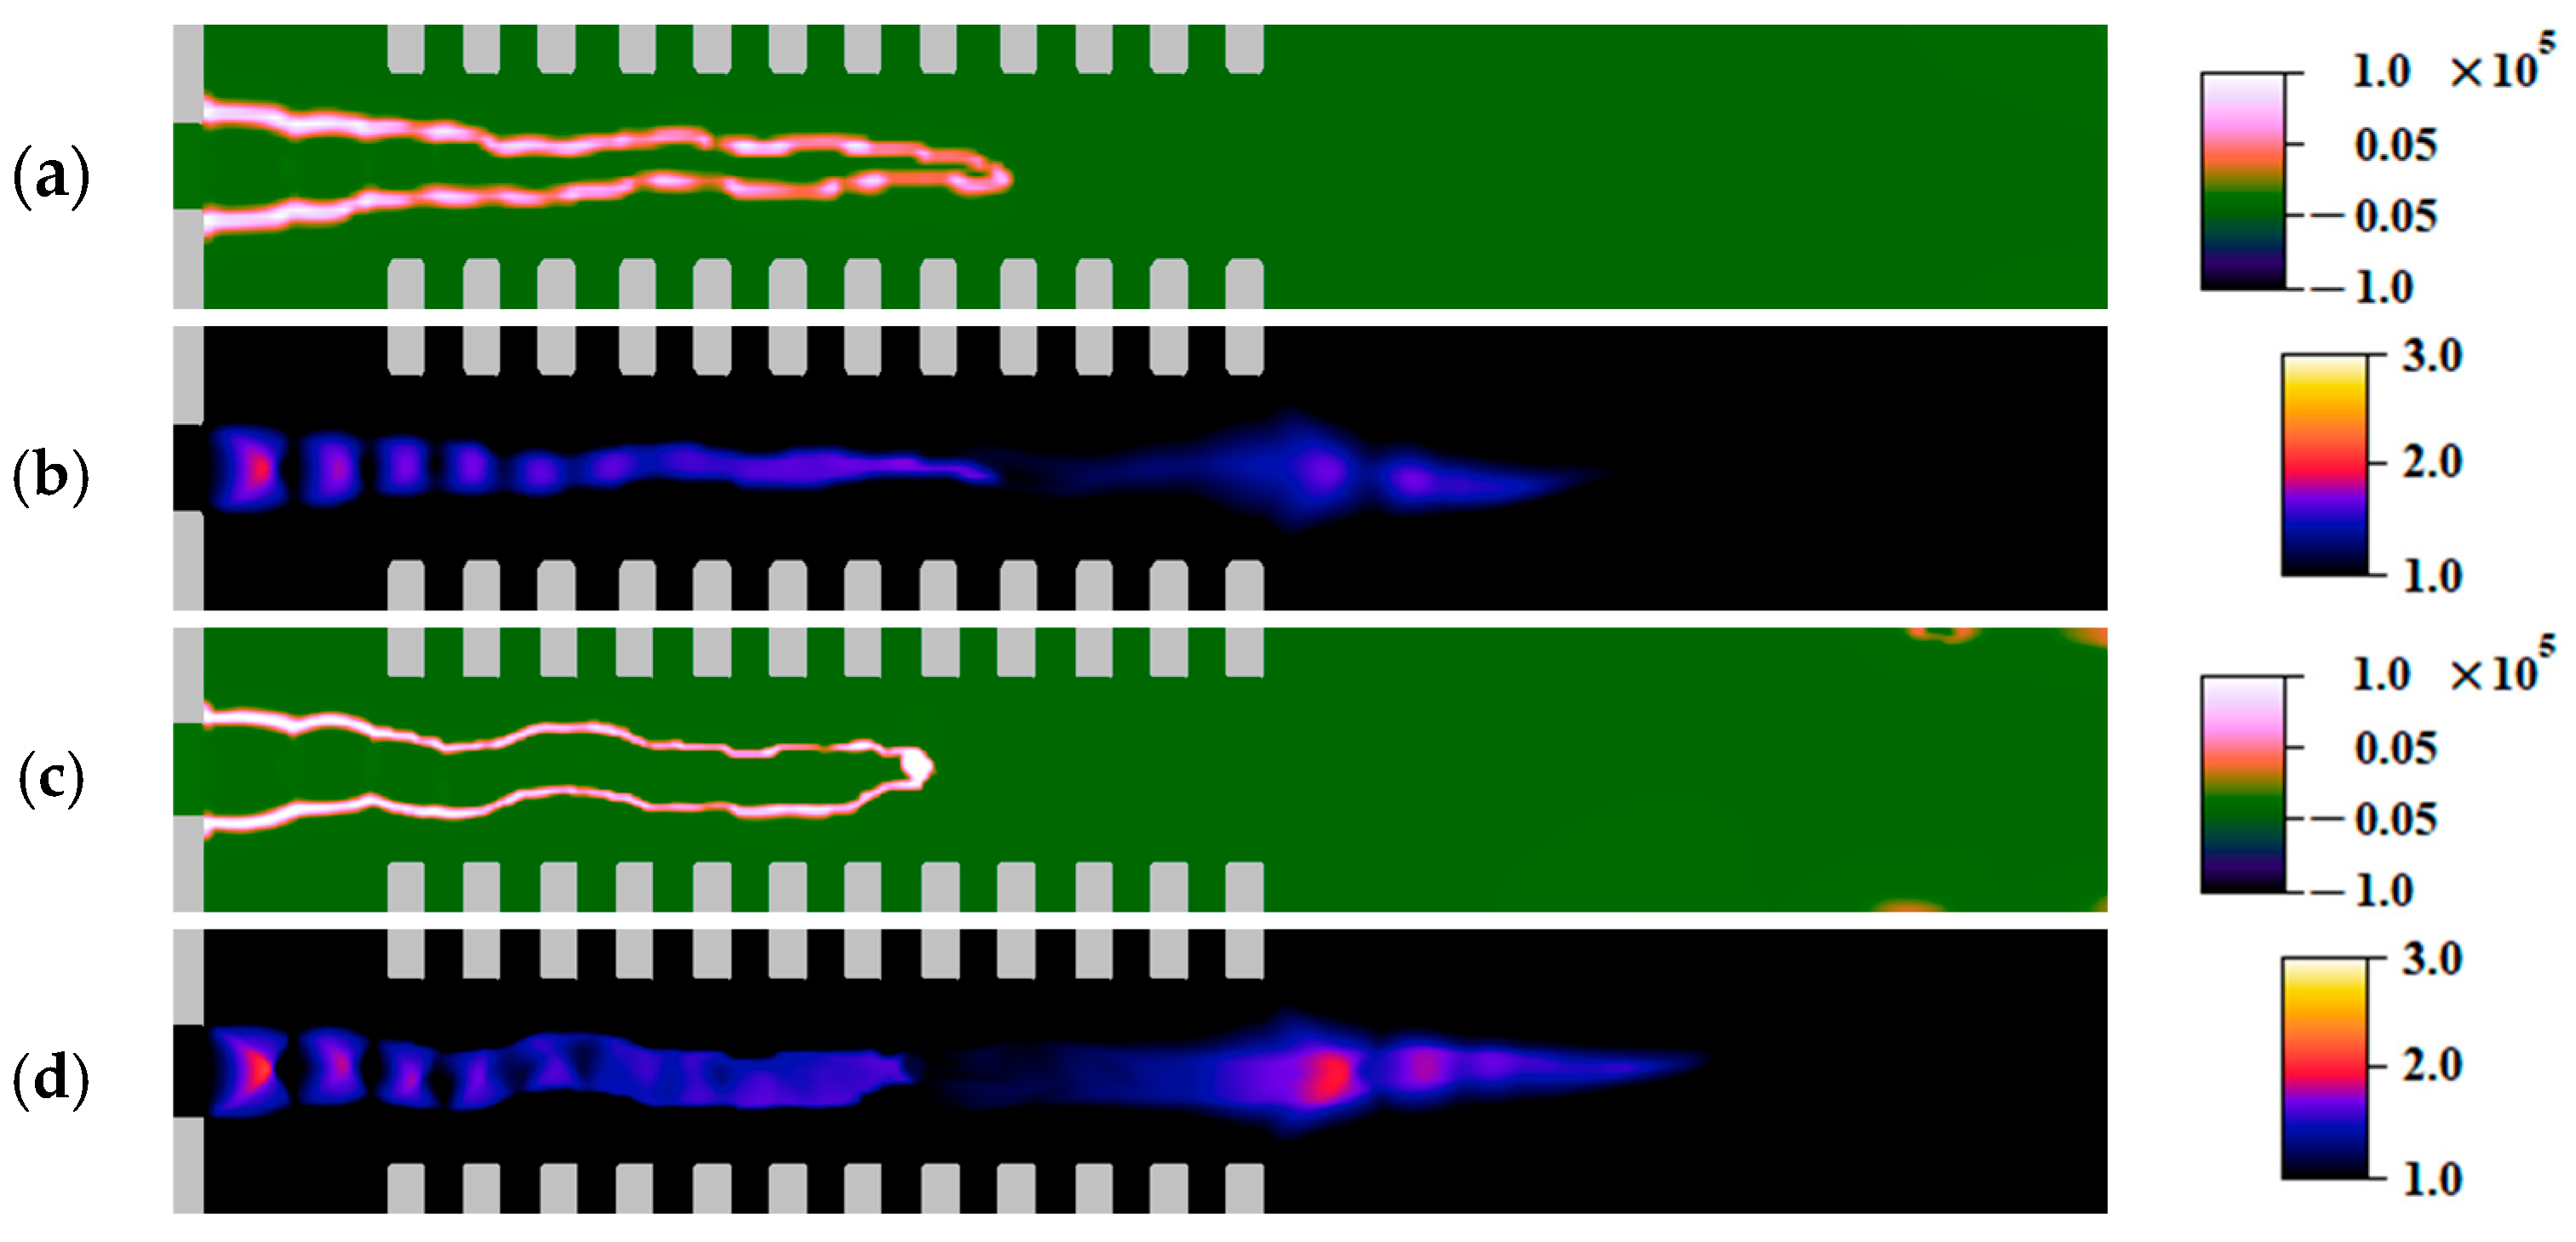
The analysis of the influence of the size of the computational grid on the simulation results showed that the nature of the processes does not change with the grinding of the cell (Figure 11). The wave structure becomes sharper, the width of the reaction front decreases slightly, some additional turbulent fluctuations appear, and the maximum values become slightly larger due to less blurring.
The developed software model allows computational modeling of the combustion chamber of a pulsed detonation engine with a sufficiently fast speed and accuracy. However, the question of using reduced kinetics instead of the full mechanism remains open.
6. Conclusions

The results of three-dimensional numerical simulation of several cycles of the detonation combustion chamber are obtained. As a result, a detailed distribution of such characteristics as temperature, pressure, speed, concentrations of reagents, intensity of reactions, and thrust force at all times of the calculation was clarified.
The obtained results showed that the critical stages affecting the frequency of operation of the device are filling and cleaning with cooling of the chamber using cold neutral gas. The initial assumption that adiabatic cooling of the chamber would be sufficient to cool the remaining gases and prevent the ignition of a new combustible mixture was incorrect. It was found that purging with neutral cold gas after reducing the pressure in the system because of the release of burnt gases is a very important and long stage of the work process. These effects should be taken into account in designing pulse detonating engines destined for long and durable operation.

Author Contributions

Conceptualization, N.S. and V.N.; methodology, N.S. and V.N.; software, E.M. and L.S.; validation, E.M., L.S. and V.N.; formal analysis, N.S., E.M., L.S. and V.N.; investigation, N.S., E.M., L.S. and V.N.; resources, N.S.; data curation, E.M.; writing—original draft preparation, E.M.; writing—review and editing, N.S.; visualization, E.M. and L.S.; supervision, N.S.; project administration, L.S.; funding acquisition, N.S. All authors have read and agreed to the published version of the manuscript.

Funding

This work was supported by the subsidy given to the Scientific Research Institute for System Analysis of Russian Academy of Sciences (No. FNEF-2022-0021).

Institutional Review Board Statement

Not applicable.

Informed Consent Statement

Not applicable.

Data Availability Statement

The datasets obtained during the current study are available on reasonable request.

Acknowledgments

The authors acknowledge the support from the Moscow M.V. Lomonosov State University within the frame of the scientific program of Moscow Center for Fundamental and Applied Mathematics.

Conflicts of Interest

The authors declare no conflict of interest.

References

  1. Zeldovich, Y.B. On the theory of the propagation of detonation in gaseous systems. J. Exp. Theor. Phys. 1940, 10, 542–568. (In Russian) [Google Scholar]
  2. Eidelman, S.; Grossmann, W.; Lottati, I. Review of propulsion applications and numerical simulations of the pulsed detonation engine concept. J. Propuls. Power 1991, 7, 857–865. [Google Scholar] [CrossRef]
  3. Nicholls, J.A.; Wilkinson, H.P.; Morrison, R.B. Intermittent detonation as a thrust producing mechanism. JET Propuls. 1957, 27, 534–541. [Google Scholar] [CrossRef]
  4. Eidelman, S.; Grossmann, W. Pulsed detonation engine experimental and theoretical review. In Proceedings of the 28th Joint Propulsion Conference and Exhibit, Nashville, TN, USA, 6–8 July 1992. [Google Scholar]
  5. Roy, G.; Frolov, S.; Kailasanath, K.; Smirnov, N. Advances in Experimentation and Computation of Detonations; ENAS: Moscow, Russia, 1988. [Google Scholar]
  6. Nikitin, V.F.; Dushin, V.R.; Phylippov, Y.G.; Legros, J.C. Pulse detonation engines: Technical approaches. Acta Astronaut. 2009, 64, 281–287. [Google Scholar] [CrossRef]
  7. Smirnov, N.N.; Nikitin, V.F.; Ivashnyov, O.E.; Kulchitskiy, A.V.; Shevtsova, V.M.; Legros, J.C. Pulse detonating devices—Constraints for PDE applications and possible ways to overcome that. In Proceeding of the 16th ONR Propulsion Meeting, Los Angeles, CA, USA, 9–11 June 2003; Roy, G., Gundersen, M., Eds.; USC: Los Angeles, CA, USA, 2003; pp. 204–210. [Google Scholar]
  8. Smirnov, N.N.; Boichenko, A.P. Deflagration to detonation transition in gasoline-air mixtures. Combust. Explos. Shock Waves 1986, 22, 65–67. [Google Scholar] [CrossRef]
  9. Roy, G.; Frolov, S.; Kailasanath, K.; Smirnov, N. Gaseous and Heterogeneous Detonations: Science to Applications; ENAS: Moscow, Russia, 1999. [Google Scholar]
  10. Brophy, C.M.; Sinibaldi, J.O.; Netzer, D.; Kailasanath, K. Initiator diffraction limits in a pulse detonation engine. In Confined Detonations and Pulse Detonation Engines; Roy, G., Ed.; Torus Press: Moscow, Russia, 2003; pp. 59–72. [Google Scholar]
  11. Alexandrov, V.G.; Kraiko, A.N.; Reent, K.S. Mathematical model of a supersonic pulsed detonation Ramjet engine. In High Speed Deflagration and Detonation: Fundamentals and Control; Roy, G., Ed.; ELEX-KM: Moscow, Russia, 2001; pp. 333–344. [Google Scholar]
  12. Vasil’ev, A.A. About a detonation engine with external combustion. In High Speed Deflagration and Detonation: Fundamentals and Control; Roy, G., Ed.; ELEX-KM: Moscow, Russia, 2001; pp. 303–314. [Google Scholar]
  13. Levin, V.A.; Nechaev, J.N.; Tarasov, A.I. A new approach to organizing operating cycles in pulsed detonation engines. In High Speed Deflagration and Detonation: Fundamentals and Control; Roy, G., Ed.; ELEX-KM: Moscow, Russia, 2001; pp. 223–238. [Google Scholar]
  14. Korobeinikov, V.P.; Markov, V.V.; Semenov, I.V.; Pedrow, D.D.; Wojcicki, S. On modeling of a pulse detonation engine. In High Speed Deflagration and Detonation: Fundamentals and Control; Roy, G., Ed.; ELEX-KM: Moscow, Russia, 2001; pp. 271–289. [Google Scholar]
  15. Wolanski, P.; Kindracki, J.; Fujiwara, T.; Oka, Y.; Shima-Uchi, K. An Experimental Study of Rotating Detonation Engine. In Proceedings of the 20-th ICDERS, Montreal, QC, Canada, 31 July–5 August 2005; p. 107. [Google Scholar]
  16. Schauer, F.; Stutrud, J.; Bradley, R.; Katta, V.; Hoke, J. Detonation studies and performance results for a research pulse detonation engine. In Confined Detonations and Pulse Detonation Engines; Roy, G., Ed.; Torus Press: Moscow, Russia, 2003; pp. 287–302. [Google Scholar]
  17. Frolov, S.M. Pulse Detonation Engines; Torus Press: Moscow, Russia, 2006. [Google Scholar]
  18. Phylippov, Y.G.; Dushin, V.R.; Nikitin, V.F.; Nerchenko, V.A.; Korolkova, N.V.; Guendugov, V.M. Fluid mechanics of pulse detonation thrusters. Acta Astronaut. 2012, 76, 115–126. [Google Scholar] [CrossRef]
  19. Tan, F.; Fan, W.; Wang, K.; Jin, S.; Yao, S.; Chen, S. Impact of nozzles on the wall-temperature in a valveless pulse detonation engine. Exp. Therm. Fluid Sci. 2023, 146, 110925. [Google Scholar] [CrossRef]
  20. Jie, L.; Hao, Z.; Wenhao, T.; Longxi, Z. Isolation of back pressure waves in a valveless pulse detonation combustor with inlet air of high total temperature. Fuel 2023, 331, 125866. [Google Scholar] [CrossRef]
  21. Lu, J.; Zheng, L.; Tan, W.; Peng, C.; Zhang, H. Suppression of the back-propagated pressure waves originated from a liquid-fueled valveless pulse detonation combustor with combined aero-valves. Acta Astronaut. 2022, 197, 269–279. [Google Scholar] [CrossRef]
  22. Wang, Z.; Yang, Y.; Huang, J.; Wang, Y.; Wei, L.; Qin, W. Numerical study of back-propagation suppression and intake loss in an air-breathing pulse detonation engine. Aerosp. Sci. Technol. 2022, 126, 107566. [Google Scholar] [CrossRef]
  23. Chen, W.; Fan, W.; Luo, F.; Tang, G.; Long, Y. Effect of inlet-valve structures on thrust of air-breathing pulse detonation engines. Propuls. Power Res. 2021, 10, 332–346. [Google Scholar] [CrossRef]
  24. Elhawary, S.; Saat, A.; Wahid, M.A.; Ghazali, A.D. Experimental study of using biogas in Pulse Detonation Engine with hydrogen enrichment. Int. J. Hydrogen Energy 2020, 45, 15414–15424. [Google Scholar] [CrossRef]
  25. Mikhalchenko, E. Injected fuel burning in a combustion chamber. Heat Transf. Res. 2023, 54, 1–10. [Google Scholar] [CrossRef]
  26. Smirnov, N.N.; Betelin, V.B.; Nikitin, V.F.; Phylippov, Y.G.; Koo, J. Detonation engine fed by acetylene–oxygen mixture. Acta Astronaut. 2014, 104, 134–146. [Google Scholar] [CrossRef]
  27. Son, M.; Seo, C.; Lee, K.W.; Koo, J.; Smirnov, N.N. Effect of spiral turbulent ring on detonation performances of acetylene–oxygen mixture. J. Korean Soc. Propuls. Eng. 2013, 17, 9–15. [Google Scholar] [CrossRef]
  28. Tyurenkova, V.; Smirnova, M.; Nikitin, V. Two-phase fuel droplet burning in weightlessness. Acta Astronaut. 2020, 176, 672–681. [Google Scholar] [CrossRef]
  29. Wilcox, D.C. Turbulence Modeling for CFD; DCW Industries, Inc.: La Canada, CA, USA, 1993. [Google Scholar]
  30. Zeng, W.; Liang, S.; Li, H.; Ma, H. Chemical kinetic simulation of kerosene combustion in an individual flame tube. J. Adv. Res. 2014, 5, 357–366. [Google Scholar] [CrossRef] [PubMed]
  31. Liou, M.-S. A Sequel to AUSM: AUSM+. J. Comput. Phys. 1996, 129, 364–382. [Google Scholar] [CrossRef]
  32. Leer, V. Towards the Ultimate Conservative Difference Scheme. A Second Order Sequel to Godunov’s Method. J. Com. Phys. 1979, 32, 101–136. [Google Scholar] [CrossRef]
  33. Koren, C.B. Numerical Methods for Advection, Diffusion Problems; Vieweg: Braunschweig, Germany, 1993. [Google Scholar]
  34. Novikov, E.A. Investigation of (m,2)-methods of stiff systems calculation. Vychislitel’nye Tekhnologii Calc. Technol. 2007, 12, 103–115. (In Russian) [Google Scholar]
Figure 1. Diagram of the combustion chamber, its injection system, and measurement and control systems on the stand from works [26,27].
Fire 06 00335 g001
Figure 2. Geometric parameters of the problem, where c—diameter of the inflow nozzle, R—radius of the tube, a and b—pitch and diameter of a Shchelkin spiral correspondingly.
Fire 06 00335 g002
Figure 3. Evolution of the molar fraction of the liquid phase of diesel fuel in the OXY section z = 0.01 m at the time points: (a) 0.05 ms, (b) 0.1 ms, (c) 0.2 ms, (d) 0.3 ms, (e) 0.4 ms, (f) 0.5 ms, (g) 0.6 ms, (h) 0.7 ms, (i) 0.8 ms.
Fire 06 00335 g003aFire 06 00335 g003b
Figure 4. Evolution of the molar fraction of the gas phase of diesel fuel in the OXY section z = 0.01 m at the time points: (a) 0.05 ms, (b) 0.1 ms, (c) 0.2 ms, (d) 0.3 ms, (e) 0.4 ms, (f) 0.5 ms, (g) 0.6 ms, (h) 0.7 ms, (i) 0.8 ms.
Fire 06 00335 g004
Figure 5. Distribution of the pressure field in the OXY section z = 0.01 m at the time points: (a) 0.05 ms, (b) 0.1 ms, (c) 0.2 ms, (d) 0.3 ms, (e) 0.4 ms, (f) 0.5 ms, (g) 0.6 ms, (h) 0.7 ms, (i) 0.8 ms.
Fire 06 00335 g005
Figure 6. The distribution of the molar density of nitrogen in the OXY section z = 0.01 m at the time of cleaning the combustion chamber from 1.1 ms to 1.7 ms: (a) 1.1 ms, (b) 1.2 ms, (c) 1.3 ms, (d) 1.4 ms, (e) 1.5 ms, (f) 1.6 ms, (g) 1.7 ms.
Fire 06 00335 g006
Figure 7. Evolution of the molar fraction of the liquid phase of diesel fuel in the OXY section z = 0.01 m at the time points: (a) 1.7 ms, (b) 1.8 ms, (c) 1.9 ms, (d) 2.0 ms, (e) 2.1 ms, (f) 2.2 ms, (g) 2.3 ms, (h) 2.4 ms, (i) 2.5 ms.
Fire 06 00335 g007aFire 06 00335 g007b
Figure 8. Evolution of the molar fraction of the gas phase of diesel fuel in the OXY section z = 0.01 m at the time points: (a) 1.7 ms, (b) 1.8 ms, (c) 1.9 ms, (d) 2.0 ms, (e) 2.1 ms, (f) 2.2 ms, (g) 2.3 ms, (h) 2.4 ms, (i) 2.5 ms.
Fire 06 00335 g008aFire 06 00335 g008b
Figure 9. Pressure field in the OXY section z = 0.01 m at the time points: (a) 2.3 ms, (b) 2.301 ms, (c) 2.31 ms, (d) 2.37 ms, (e) 2.375 ms, (f) 2.4 ms, (g) 2.5 ms.
Fire 06 00335 g009
Figure 10. Thrust pulse detonation engine during three cycles of work.
Fire 06 00335 g010
Figure 11. Reaction rate and Mach number correspondingly for cell size 0.5 mm (a,b) and for 0.25 mm (c,d) in the OXY section z = 0.01 m at the time point 0.4 ms.
Fire 06 00335 g011
Table 1. Average thrust of the impulse engine on each of the cycles.
Time, ms F ¯ x ( t 0 , t 1 ) ,   N
Cycle 10.0–1.751
Cycle 21.7–3.448
Cycle 33.4–5.148
Disclaimer/Publisher’s Note: The statements, opinions and data contained in all publications are solely those of the individual author(s) and contributor(s) and not of MDPI and/or the editor(s). MDPI and/or the editor(s) disclaim responsibility for any injury to people or property resulting from any ideas, methods, instructions or products referred to in the content.