1. Introduction
As one of the most crucial components commonly exploited in urban high-rise buildings, float glass is extensively utilized in doors, windows, ceilings, walls, and other parts of buildings [
1]. As a brittle material with relatively weak mechanical properties, float glass is susceptible to breakage and dislodgement under the action of fire heat loads, which in turn can give rise to new fire spread channels, accelerating the spread of fire and threatening the safety of the building structure and occupants. The frame-supported installation approach is the most common way of installing glass in construction projects [
2,
3]. Analyzing the dynamic performance of frame-supported float glass under thermal loads and studying the physical and chemical properties of the glass can help reveal the fracture mechanism of frame-supported float glass and further elucidate the relationship between glass breakage time and temperature difference between the sheltered and non-sheltered areas of glass in building fires and explore the relationship between glass cracking and the degree of damage and collapse behavior [
4,
5,
6]. Therefore, understanding the safety properties of glass components in construction engineering is crucial for building fire safety and fire accident investigation.
Emmons [
7] first suggested in 1986 that the breakage of glass in a fire is significant research value. Since then, scholars have scrutinized the mechanism of glass breakage through many experiments and numerical simulations. Skelly et al. [
6] designed a simulation compartment to study the breaking process of glass in an actual building fire. Finally, they found the theoretical, critical temperature difference that leads to the breaking of edge-protected glass. Pagni et al. [
8,
9] developed the glass breakage program BREAK1 accounting for the coupling between the heat transfer model and the glass breakage criterion. Their established numerical model could predict the first occurrence of glass breakage and calculate the temperature field on the glass surface. Harada et al. [
10] predicted the first rupture time of glass based on box-fired heating conditions and showed it through a simple formula. Based on many studies and experiments, Pope et al. [
11] proposed a Gaussian glass fracture model and applied this model to fire dynamics simulation software. Hietaniemi J [
12] analyzed the probability of glass shedding and breakage in a fire environment utilizing Monte Carlo simulation and BREAK1. Ni et al. [
13] investigated the fire performance of double facades made with double glazing in three different heat release rate fire scenarios. Wang et al. [
14,
15,
16,
17,
18] utilized a finite element program to assess the glass crack expansion process in the context of differences in boundary constraint methods and thermal impacts by employing a large amount of fundamental theory. Wong et al. [
19] studied the fallout behavior of glass samples under thermal radiation and established a probabilistic prediction model of glass fallout. Debuyser et al. [
20] further studied the thermal characteristics and mechanical behavior of laminated glass in fire and proposed a numerical heat transfer model based on the experiment. Under different working conditions, Wang et al. [
21,
22,
23,
24] investigated the fracture mechanism of glass curtain walls under a fire environment through full-scale experiments and numerical simulation. They obtained the fracture rule of glass curtain walls under different installation methods in a fire environment. In addition to the crack observation and experiment of glass, Mauro et al. [
4] also studied the molten state of glass at high temperatures, proposed the visco-temperature relationship model of glass, and profoundly discussed the glass transition, which is also helpful in describing the cracking mechanism of glass.
In 2017, Chiara [
25] carried out a systematic review of the research on glass structures in fire, comprehensively introduced the research results produced in this field in recent decades, thoroughly discussed the existing design methods and existing problems, and pointed out that the future research should pay attention to the adoption of multidisciplinary methods. Since then, scholars have conducted additional detailed and in-depth studies in this field. Lu et al. [
26] performed thermal load tests on five different types of point-supported glass curtain walls, established thermodynamic models, and performed optimization simulations using the constrained optimization of the quadratic approximation method to obtain better thermal resistance performance of the glass facades. Chen et al. [
27,
28] examined the simulation and design of various fire scenarios based on the developed programs to solve for the glass temperature field and quasi-dynamic crack expansion. The first breakage time and quasi-static dynamic crack expansion process of glass under different conditions were then predicted. Wang et al. [
29,
30] conducted an in-depth exploration of the relevant studies from the two perspectives of experiment and simulation to provide further a theoretical basis for the fire prevention of building glass curtain walls. Firstly, three different importance analysis methods are used to find that the type of glass, fire location and installation method are crucial factors for the fire protection of building glass curtain walls. Second, by validating the finite element method model, it was found that the difference in the stress distribution due to size and shape effects is the main reason for the different fire resistance of glass surfaces. In terms of the thermal behavior of glass melting, Cassetta et al. [
5] further studied the correlation between vibrational-elastic properties and viscosity. A vibrational property of parental glasses is proposed, and the glass behavior can be predicted based on elasticity. In addition, some scholars have studied the thermal performance of lightweight concrete walls containing glass from the architectural perspective and deduced the influence of different glass ratios on the fire resistance of walls, which can also provide some referential conclusions for the thermal fracture behavior of glass [
31,
32].
In general, there has been a great deal of research on glass installation methods, glass materials, temperature domains, and crack solution calculations by domestic and international scholars. However, there are still extremely few concrete studies on the properties of frame-supported glasses in terms of thermal breakdown behavior, and it is difficult to monitor the true dynamical process from microscopic damage accumulation to macroscopic damage of glasses due to the existing testing conditions and testing costs. This paper aims to provide a theoretical reference for scientific installation and fire investigation of framed glass in buildings by studying thermal fracture theory and the microscopic damage process of framed glass under elevated temperature loading conditions.
The glass was therefore chosen as the object of study, and full-scale experiments and numerical simulations of fire were performed on frame-supported glass using a self-built experimental bench and particle flow software. We have analyzed the characteristic behavior parameters, such as surface temperature, crack initiation location, and expansion pattern, to determine the macroscopic thermal breakup behavior of frame-supported float glass. In addition, the microfracture process of glass under thermal load has been simulated with the PFC2D code to reveal the mechanism of microcrack expansion under thermal load and thus to understand the fracture behavior and mechanism of frame-supported glass.
3. Results and Discussion
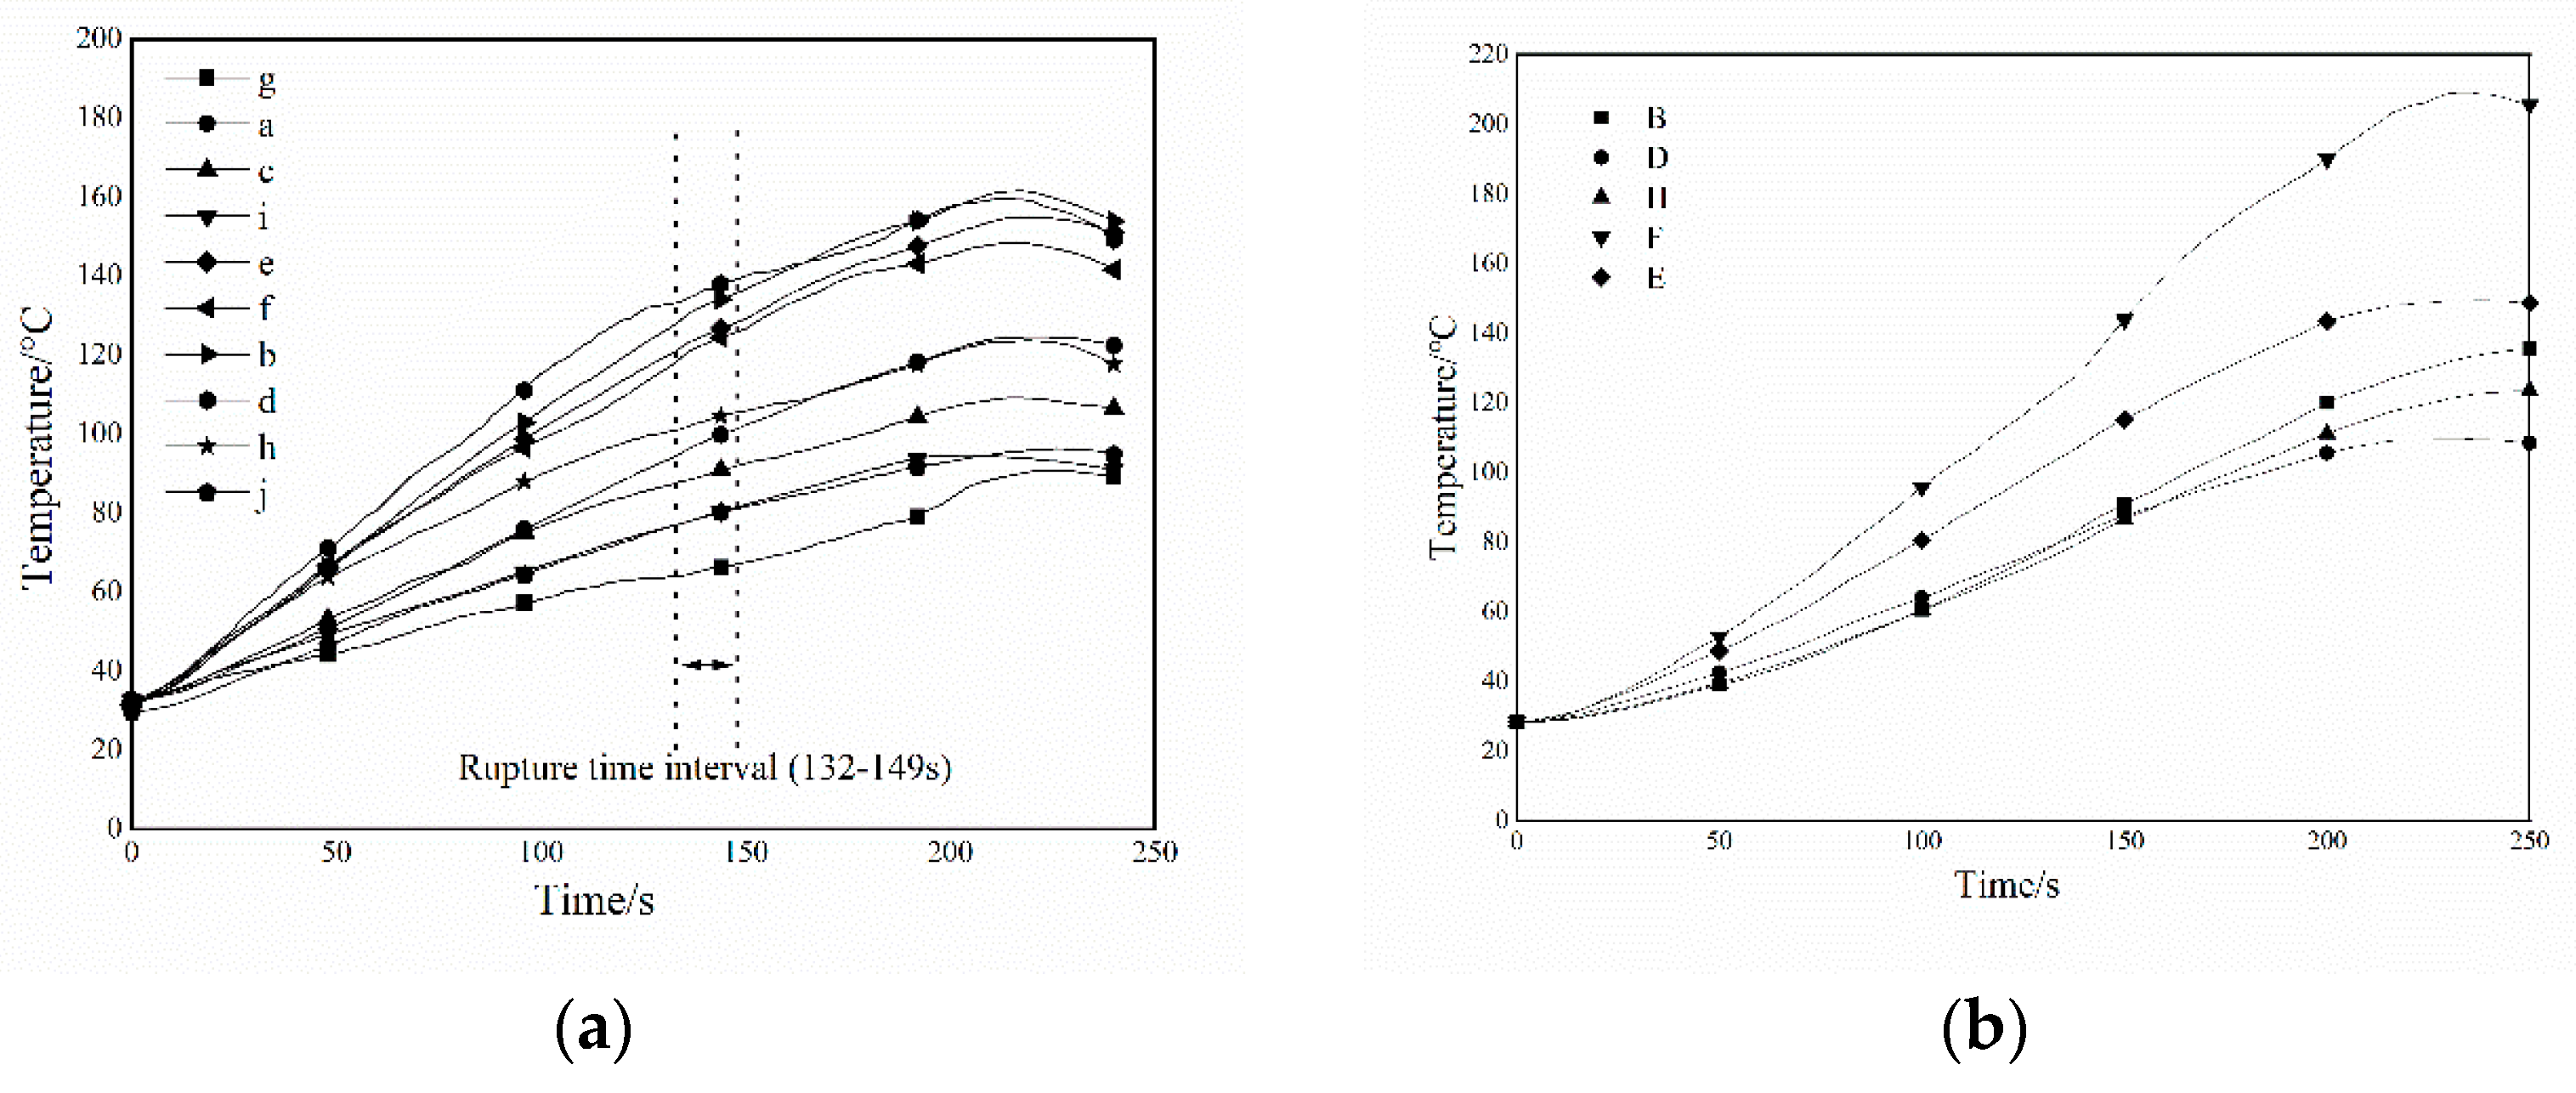
3.1. The Temperature Fields of the Glass Surface and Air
Based on the research of Wang Yu and other investigators [
27,
28], it can be seen that the maximum temperature gradient on the glass surface is mainly concentrated between the exposed surface of the glass and the sheltered surface of the frame. Therefore, the present experiment is carried out by placing thermocouples on the surface of the float glass. These are positioned about 5 mm from the center of the fireward surface of the float glass to monitor the temperature change of the glass surface and air. The experimentally obtained results have been demonstrated in
Figure 5.
The overall increase in the temperature of the frame-supported float glass under high-temperature thermal loads is observable. As the non-shaded area of the float glass is directly exposed to the thermal radiation in the air, the temperature rises in the non-shaded area measured by the thermocouples e, f, b, d, and h is relatively fast and follows the same trend, indicating a uniform distribution of the heat load on the surface of the non-shaded area of the float glass. While the temperature rises in the shaded area measured by thermocouples a, g, c, and i are relatively slow because the four sides of the float glass are subjected to the shading effect of the metal frame. The temperature rise is relatively low compared to the glass in the non-shaded area, where the measurement point a is located in the shaded area; nevertheless, the hot smoke from the fire source rises under the action of the plume, resulting in the measurement point being in the hot air layer and the temperature rise is faster compared to the other shaded areas. The difference in the rate of temperature rise between the shaded and unshaded areas of the glass surface leads to a temperature gradient on the glass surface.
Furthermore, since glass is a poor conductor of heat, it takes more time for heat to transfer from the glass to the backside of the fire. The temperatures measured by the thermocouples b, d, h, and e on the glass to the fireside are higher than those measured by thermocouples B, D, H, and E on the backside of the fire. It implies a remarkable temperature gradient in the glass thickness direction.
If the temperature gradient increases and the resulting thermal stress is higher than the local load on the glass surface, the glass will break. The temperatures of the shaded and unshaded areas at the moment of glass breakage in each group of experiments are compared. Then the maximum temperature difference of the glass is evaluated. It is detectable that the experimental critical temperature difference for the breakage of the frame-supported float glass is about 65 °C. These results indicate that the temperature difference between the shaded and unshaded areas of the frame-supported float glass is the main cause of the rupture phenomenon under thermal loading.
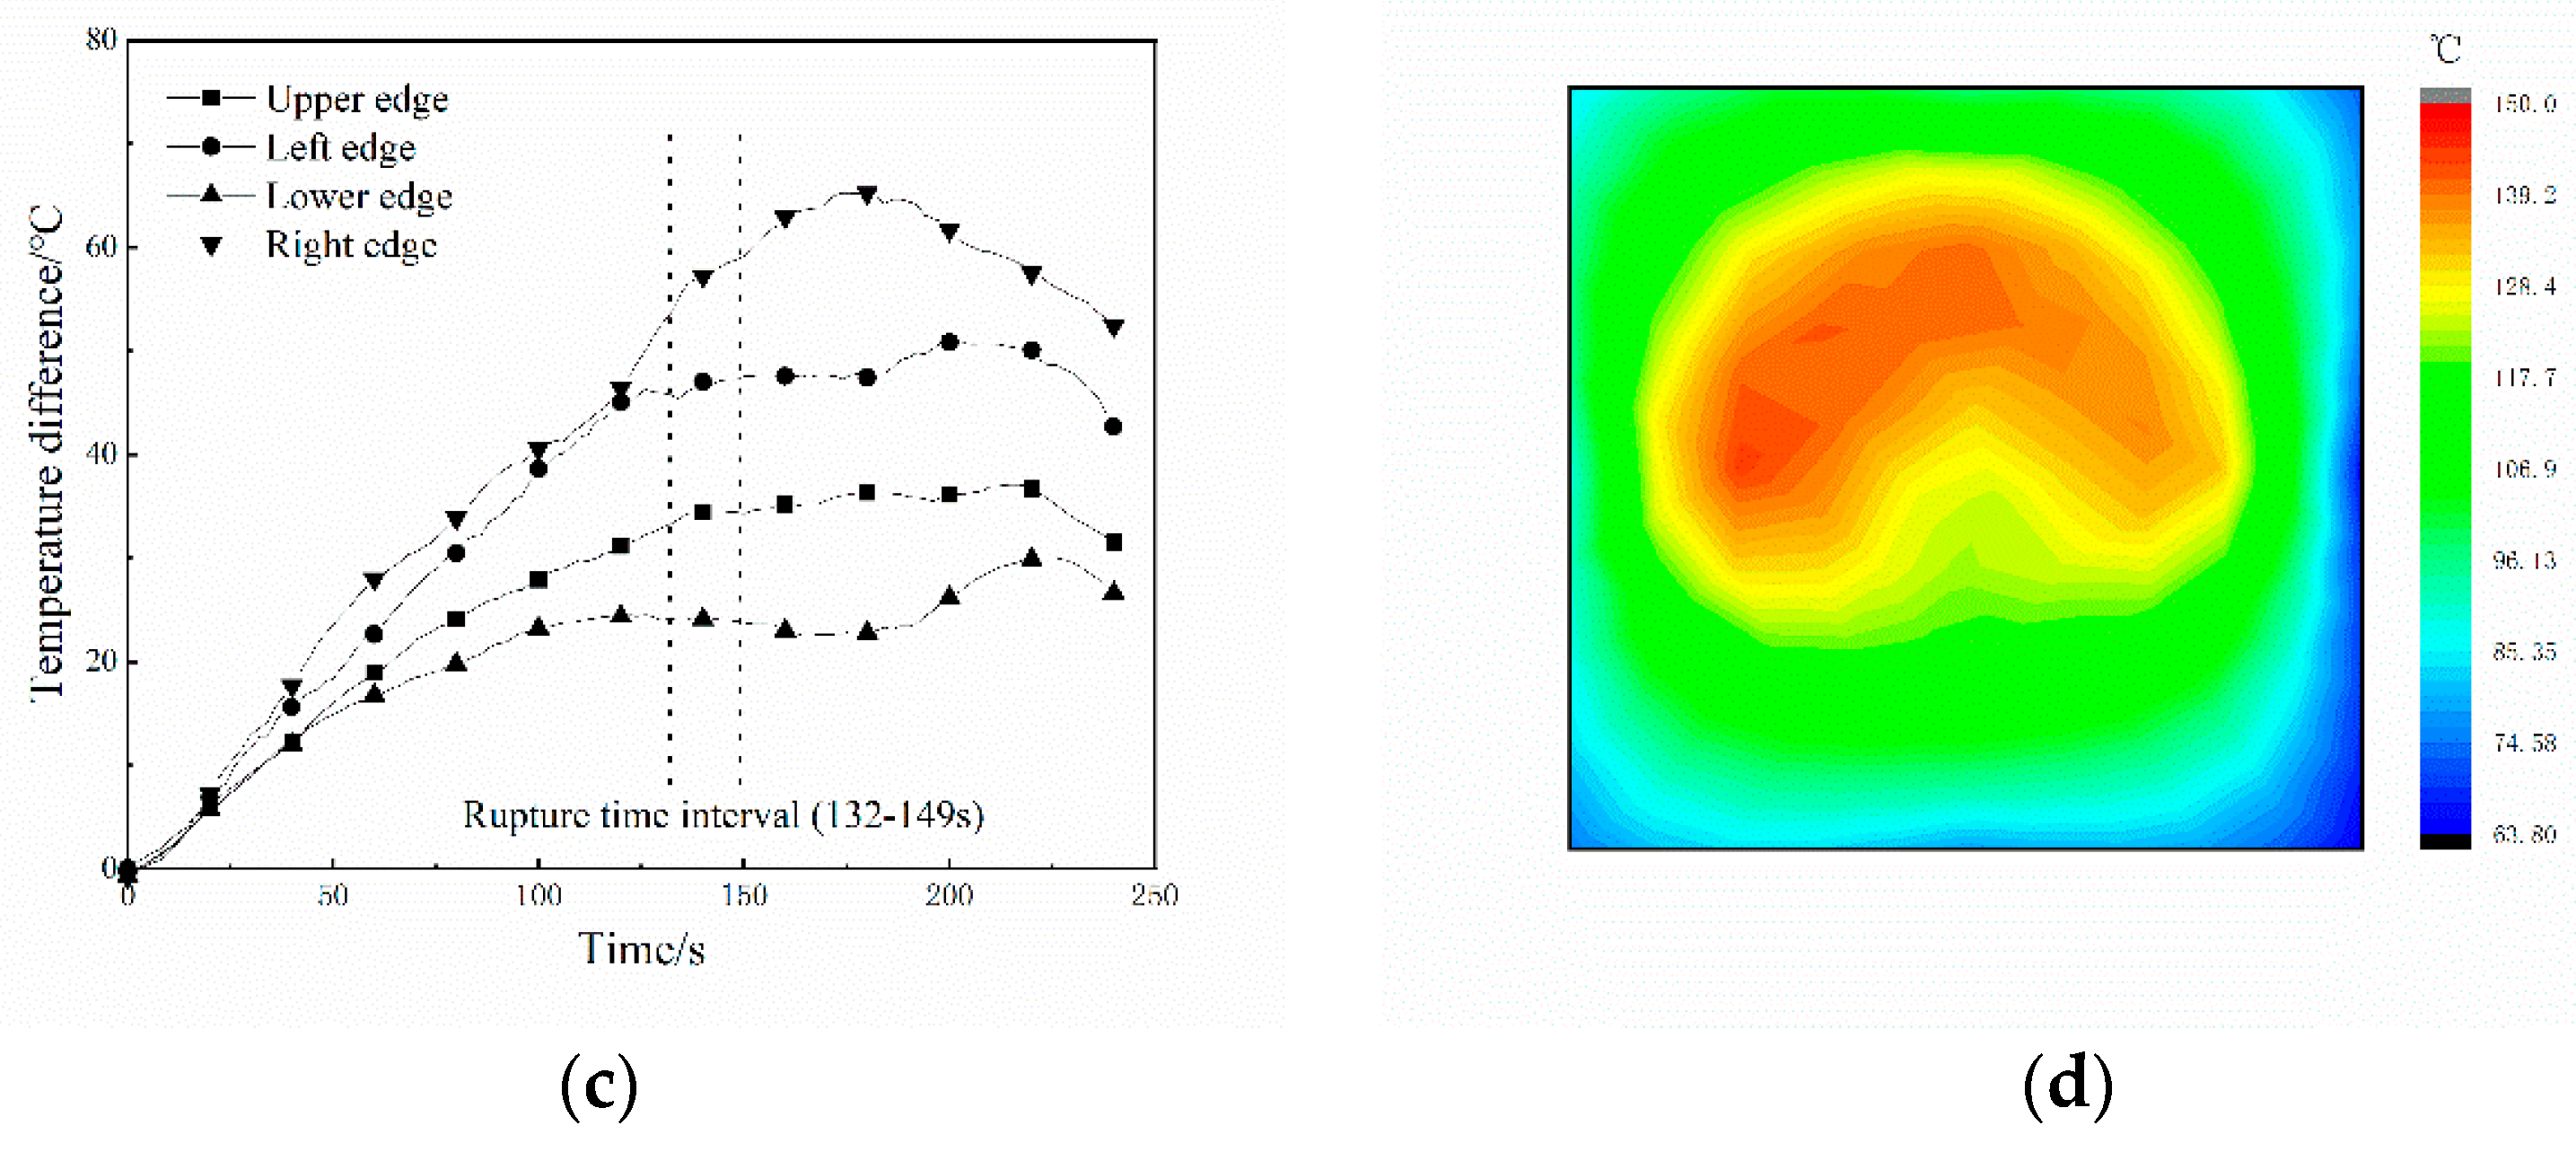
3.2. Time to First Breakage and Crack Evolution of the Glass
The glass’s first breakage time is from the start of ignition to when the glass first cracks. As a substantial characteristic parameter of the thermal breakage behavior of the glass, the time of the first breakage has a crucial influence on the dynamic development of building fires. The first break time of the float glass in the test is determined from the image recordings of the high-speed camera. The breakage of the float glass occurs in all four groups of experiments. The temperature corresponding to the first break of the float glass is shown in
Figure 5. And the first break time of the float glass and the location of the crack initiation have been presented in
Table 4. The crack expansion and the final form of the frame-supported float glass are demonstrated in
Figure 6, and the glass in the picture is a full-size shot.
The average time to the first cracking of the frame-supported float glass in the experiment is 140 s. The high-speed camera recording shows that the cracks sprout from the left and right edges of the glass due to the large temperature difference at the glass level; therefore, the cracks appear more frequently from the left and right sides of the glass. By comparing the location of the crack initiation and the area of maximum temperature difference, it is found that the cracks all initiate from the edge of the glass surface where the temperature difference is the greatest. The cracks appear from the edge and then rapidly expand to the central area of the glass or other edges before stopping to expand. Eventually, two to three bifurcated cracks are observed on each main crack, with crack islands forming after the cracks intersect. Due to the constraint of the glass support frame and the stress effect of the surrounding glass, the crack islands remain in their original positions (i.e., no cracked island is dislodged in any of the four sets of experiments).
3.3. The Morphology of the Microcrack Rupture
Using the PFC
2D combined with Fish language to prepare the loading command flow and adjust the measurement sphere function, the microcracking characteristics of the calculated model during high-temperature loading are obtained through iterative calculation, as shown in
Figure 7, where the red areas exhibit the rupture regions. When loading steps are less than 5270, microcracks are produced on the glass surface, and the rupture range is small. As the temperature rises, the thermal stress on the glass surface gradually increases, the number of microcracks continues to grow, the glass produces microcracks, and the rupture area shows irregular expansion. In high temperatures, microcracks continue to sprout and develop, mainly exhibiting as along-crystal, intra-crystal, and through-crystal cracks exist in large numbers. The crack-linked network structure is formed, destroying the heat conduction between the particles. By approaching the number of loading steps to 25,301, the glass structure fails, the number of cracks no longer increases, and the microcrack area tends to be stabilized. During the loading stage, the number of cracks in the model is dominated by the longitudinal and small tangential cracks, indicating that the model is essentially controlled by tension cracking damage with a small amount of shear damage.
Under thermal loading, glass behaves like a brittle material so that the microcracks can be readily developed as the stress and displacement fields change.
Figure 8 demonstrates a cloud plot of the stress field distribution of the float glass under high-temperature loading. For the number of loading steps lower than 5270, the contact force distribution is relatively uniform, and no concentrated distribution occurs. Regarding the number of loading steps in the range of 5270–25,301, the glass is heated quickly since the temperature load in the normal direction generates large thermal stresses. In such a case, the consisting particles of the model move due to extrusion, and thereby, the contact forces between the particles increase, and the peak value of the contact force in the particle model increases by the growth of the thermal loading. When the number of loading steps exceeds 25,301, the contact force at the end of the crack gradually grows such that the concentration of the contact force produces microcracks. At the moment when the normal temperature load reaches its peak, the contact force at the end of the crack decreases, leading to the gradual reduction of the contact force inside the whole model. Subsequently, cracks are formed, and the squeezing effect between the constituent particles decreases, yielding the vanishing contact force in the middle section of the crack. Therefore, the peak contact force gradually lessens. At the later loading stage, the contact stress concentration zone on the inner boundary of the glass disappears, the contact force is completely released, and no new cracks are formed on the inner side of the glass. At this point, the crack expansion results from the continuous release of tensile stress.
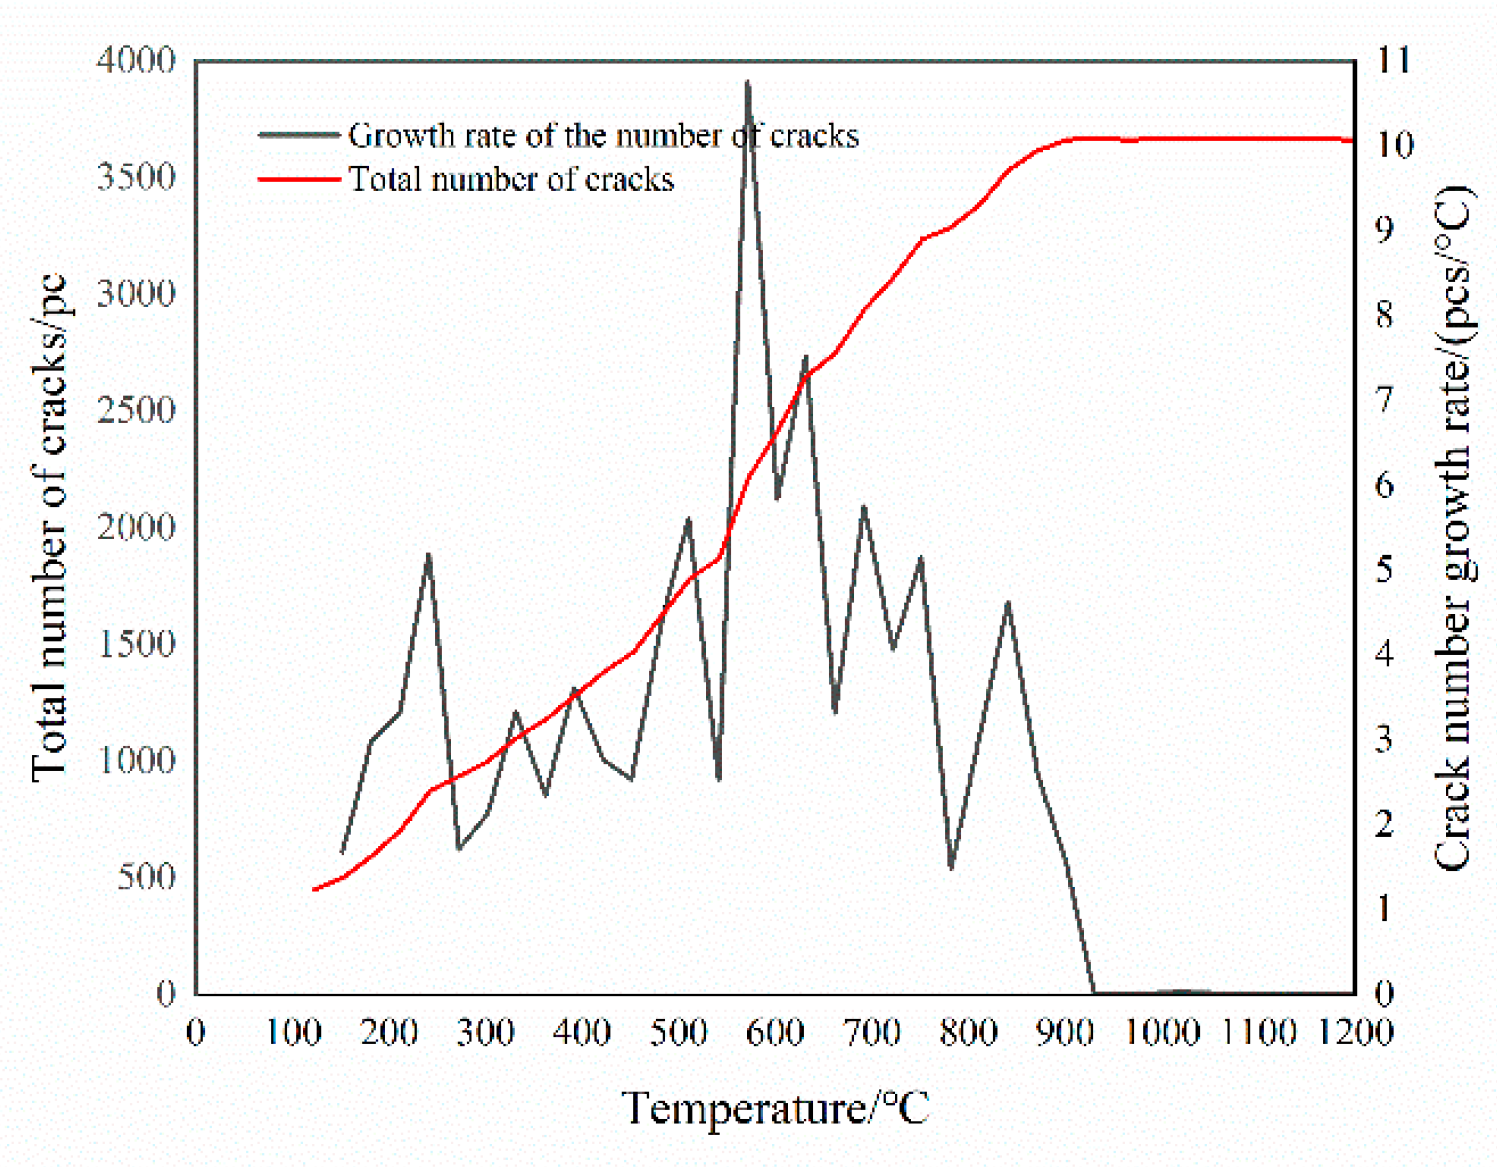
3.4. Characteristics of the Microcrack Evolution
The number of microcracks in the glass increases with temperature growth, and their distribution is irregular. At 5270 steps of loading, large crack bands and large cracks are gradually produced between the glass particles. For the case of 7231 steps of loading, numerous small cracks join gradually and interconnect to form microcracks, accompanied by noticeably damaged areas. In the case of 25,301 steps of loading, the number of microcracks reaches a peak, and thereafter, the number and length of microcracks tend to be stabilized at the temperature of about 650 °C. It is therefore believed that the microcracks in the float glass, under high-temperature action, first sprout continuously and then expand rapidly in the longitudinal and transverse directions, forming macrocracks.
To reflect the temperature sensitivity of microcracks during loading,
is defined as the rate of change in the number of cracks in a given temperature range, calculated by:
where
and
to represent the number of microcracks in the glass at the (
)-th and
-th stages of loading, while
and
denote their corresponding temperatures applied to the glass surface.
According to the numerical simulation results, the variation of
and the total number of microcracks with the loading temperature during the heating process has been plotted in
Figure 9. During the loading process, the graph of
in terms of the loading, temperature exhibits an oscillatory trend. This issue is because the generated thermal stress promotes the sprouting of the microcracks as well as their expansion in both longitudinal and transverse directions. At the beginning of loading, the
the value fluctuates above and below of
= 3. When the temperature reaches 600 °C, the
suddenly increases and reaches a peak level; subsequently, the plots of Mn exhibit a large “oscillating” reduction as the temperature reaches 940 °C, the
value drops to 0 and remains unchanged. During the whole loading process, the trend of the total number of microcracks in terms of temperature increases sharply and then becomes stable.
Under thermal loading, microcracking occurs longitudinally and transversely in most cases. As demonstrated in
Figure 10, with the increase in the number of thermal cycles, the cracks expand in the longitudinal direction in a “straight line”. During the formation and development of the glass microcracks, some of the microcracks gradually intersect and join each other to form a “tortoiseshell”.
3.5. The Extension Mechanism of Microcracks
By analyzing the microstructure and process of microcrack origination and expansion within the glass in the presence of the thermal loading, it is found that the model failure process under thermal load can be divided into three apparent stages: microcrack emergence stage, microcrack expansion stage, and crack penetration failure stage.
In the microcrack emergence stage, crack emergence occurs throughout the micro rupture process, and crack initiation is discontinuous, following discontinuous emergence and expansion. The physical characteristics, such as the initial angle of the crack as well as the position of the crack nucleus, are mainly random and disordered. As the temperature grows, the damage zone gradually increases, mainly due to the differences in the connection bond and particle size as well as the thermal expansion characteristics of the particles, resulting in uncoordinated deformation. This issue yields a reduction in the ratio between the long and short axes of some of the microcracks during the warming process, forming a damage zone. At this stage, the cracks develop along the boundaries of the particles (see
Figure 11a), where the emerging cracks originate and develop at the boundaries of the model particles or inside them. Then, the cracks are influenced by the shape, arrangement, and bond length of the glass particles during their formation, where the initial angles of the cracks exhibit their randomness.
In the microcrack extension stage, crack extension occurs within the model with a tendency to extend into the grain, and the direction of extension is perpendicular to the stress direction (see
Figure 11b,e). After the model is uniformly heated during thermal loading, the difference in the internal thermal expansion coefficients leads to a non-uniform thermal expansion state for each structure, and various thermal strains will produce a non-uniform thermal stress field within the glass body. When the thermal stress is greater than the yield limit of the material, microcrack extension occurs in both longitudinal and transverse directions.
During the crack penetration failure stage (see
Figure 11c,f), the glass particles are thermally expanded, and the number of small cracks grows as the load continues to increase. The grain boundary cracks of the model further expand along the grain boundary. In continuous thermal stress, the cracks along the grain and grain boundary cracks are connected, and numerous small cracks gradually join each other and interconnect to form macroscopic cracks.
The microscopic cracking mechanism of the heated glass can be further examined by the above microstructure cracking and extension. When the resulting thermal stress between the particles exceeds the corresponding tensile or shear bond strength, microcracks begin to sprout and expand along the boundaries of the constitutive particles. For the small thermal stresses, the large particles delay the expansion of the sprouting cracks, eventually forming dendritic cracks; however, when the thermal stress is large, these interlaced cracks form tortoise back cracks. Under the repeated action of thermal shock, the bonding of the particle interface fails, and the bonding damage and cracks at the grain interface become increasingly evident, eventually extending, joining, and penetrating each other to form macroscopic cracks, leading to the failure of the glass structure.
4. Conclusions
(1) By conducting dimensional experiments, the rupture behavior of frame-supported float glass is elucidated from a macroscopic standpoint. Under thermal loading, the temperature difference between the sheltered and non-sheltered regions is identified as the main cause of the rupture of the frame-supported float glass. Based on the experimentally observed data, the critical temperature difference leading to glass rupture is reported to be about 65 °C. The time of the rupture is in 132–149 s, and the cracks commonly sprout from the edge of the glass surface with the greatest temperature difference. The cracks appear from the edge and then rapidly expand to the central region of the glass or other edges before stopping expansion. There are bifurcation cracks and shock cracks formed after the first rupture of the glass, and the cracks intersect to form crack islands, but no shedding phenomenon occurs.
(2) Based on the discrete element model for the thermally induced glass, the PFC2D program is adopted to establish a model for the microcracks generation in glass subjected to thermal fracturing. With the increase in the loading temperature, the number of microcracks in the glass sharply grows and then stabilizes, and the growth rate of the microcracks exhibits an oscillatory shape. The model is mainly broken and damaged by a small amount of shear damage. In the simulation of the 5270–25,301 step, the glass was formed in the 5270–10,271 step, which was in the glass center, which was located in the glass center, and eventually reached the peak, the crack in the heat stress after 25,301, and the peak displacement increased (but the peak displacement concentration area was a gradual loss).
(3) The damage process of the glass acted upon by the thermal loading is commonly divided into three main stages: the crack initiation stage, the crack expansion stage, and the crack penetration failure stage. During the loading process, the microcrack emerges When the heat stress between the particles exceeds the corresponding tensile or shear bond strength. When a specific temperature is reached, the expansion of microcracks becomes the main form. As the microcracks extend and connect, macroscopic cracks are formed, while the intersection of macroscopic cracks configures crack islands, eventually leading to the failure of the glass structure. In conjunction with experiments, the discrete element method can be exploited. The proposed numerical model can predict the temperature, stress distribution, and fracture behavior of glass, providing rational propositions for engineering applications.


