1. Introduction
Guangzhou International Financial City is located southeast of the Tianhe District, Guangzhou City, starting from the Zhongshan Avenue and Huangpu Avenue in the north, bordering the Pearl River in the south and Tianhe District in the east, with a total area of 8 km
2 (
Figure 1). The Starting Area of the Guangzhou International Financial City is located in the middle of the overall planning area of the Financial City, from the Keyun Road in the west to the Chebei Road in the east, and from the Huangpu Avenue in the north to the Pearl River in the south. The underground space in the starting area was developed as a multifunctional composite stereotype (
Figure 2).
The development of the underground space in the Starting Area has saved resources and improved the land benefits. However, its high-density development has resulted in large fire loads, poor ventilation and lighting, and difficult evacuation. In the case of a fire, personnel safety and normal operation of the financial center will be seriously affected [
1]. Therefore, it is necessary to study the laws of smoke flow and personnel evacuation behavior in the underground space in the Starting Area to reduce personal and property losses.
Research methodology for fire development and personnel evacuation behavior mainly involves experimental and simulation analysis [
2,
3,
4,
5]. The accuracy, scientificity, and reliability of fire experiments are higher than those of the simulations; however, experimental research has disadvantages, such as high cost, long research cycles, and com-plicated research processes. With the rapid development of computer technology, simulations are increasingly being used in fire and evacuation simulation analyses.
With the rapid improvement in computing speed and modeling techniques, the use of computational fluid dynamics (CFD) has become an integrated component in fire assessment [
6]. There are three types of methods to account for turbulences in CFD models: direct numerical simulation (DNS), Reynolds averaged Navier–Stokes (RANS)-based turbulence models, and LES [
7]. DNS can give a most detailed simulation of the flow but requires too many computing resources. The RANS
k–
ɛ turbulence models and LES are both popularly used. However, there are inherent limitations in RANS for modeling transient unsteady flow. The nature of RANS models, however, is a steady-state methodology. Large Eddy Simulation (LES) is a CFD method capable of predicting unsteadiness and intermittency in turbulent flows. So, it is still considered by fire researchers as the most feasible option in field modeling [
8]. Currently, academia is more inclined to use fire dynamic simulators (FDS) to study the flow laws of fire smoke [
9,
10]. Gu et al. [
11] investigated the characteristics of hydrogen jet fires in tunnels under different conditions using FDS simulations. Janardhan and Hostikka [
12] presented an FDS-based fire-spread simulation method that used the ignition temperature model for pyrolysis and introduced a correction for the mesh dependency of the fuel surface area. Ferrero et al. [
13] evaluated a new method to calculate the plume rise of smoke emitted from the fires and performed numerical simulations of the plumes originating from the prescribed burning. However, the FDS software requires researchers to compile codes to provide instructions, which have a high operational threshold. Therefore, based on the FDS, the National Institute of Standards and Technology, United States, developed new building fire simulation software called the “PyroSim”. PyroSim has several advantages, such as a 3D graphical pre-processing function, visual editing, FDS, and the Smokeview dual module, which are conducive to improving the efficiency of simulation pre-processing [
14]. In this study, PyroSim was used as a simulation platform for smoke flow in the underground space in the Starting Area.
At present, the commonly used personnel evacuation simulation models are mainly divided into two categories: macroscopic fluid dynamics model and micro models based on individual behavior descriptions. Microscopic models include cellular automata model, social force model, agent-based model, etc. [
15]. Individual characteristics and interactions are ignored in the macro model, so it is not considered. For the micro model, the limitation of individual degrees of freedom in the discrete model represented by cellular automata model affects the accuracy of the evacuation path results [
16]. Therefore, this study chooses the combination of social force model and agent-based model to simulate the evacuation of people in underground space. That is, the individual characteristics are defined and then the agent evacuation simulation is carried out based on the social force model. At present, the evacuation simulation software platforms based on the agent model mainly include Anylogic, Pathfinder, and Repast [
17,
18,
19,
20]. Feng et al. [
20] used AnyLogic to complete the environmental and visitor behavior modeling of a gold museum and analyzed the personnel evacuation process and potential safety hazards. Qin et al. [
17] utilized the Pathfinder software to simulate evacuation in a special subway station. Evacuations in dissimilar statuses were analyzed by setting up a fire scenario and changing the flow rate at the station. Because both Pathfinder and PyroSim were developed by Thunderhead Engineering, Pathfinder is more compatible with PyroSim than the other evacuation simulation software. Therefore, this study selected the Pathfinder as the simulation platform for personnel evacuation from the underground space in the Starting Area.
2. Fire Simulation of Underground Space in the Starting Area
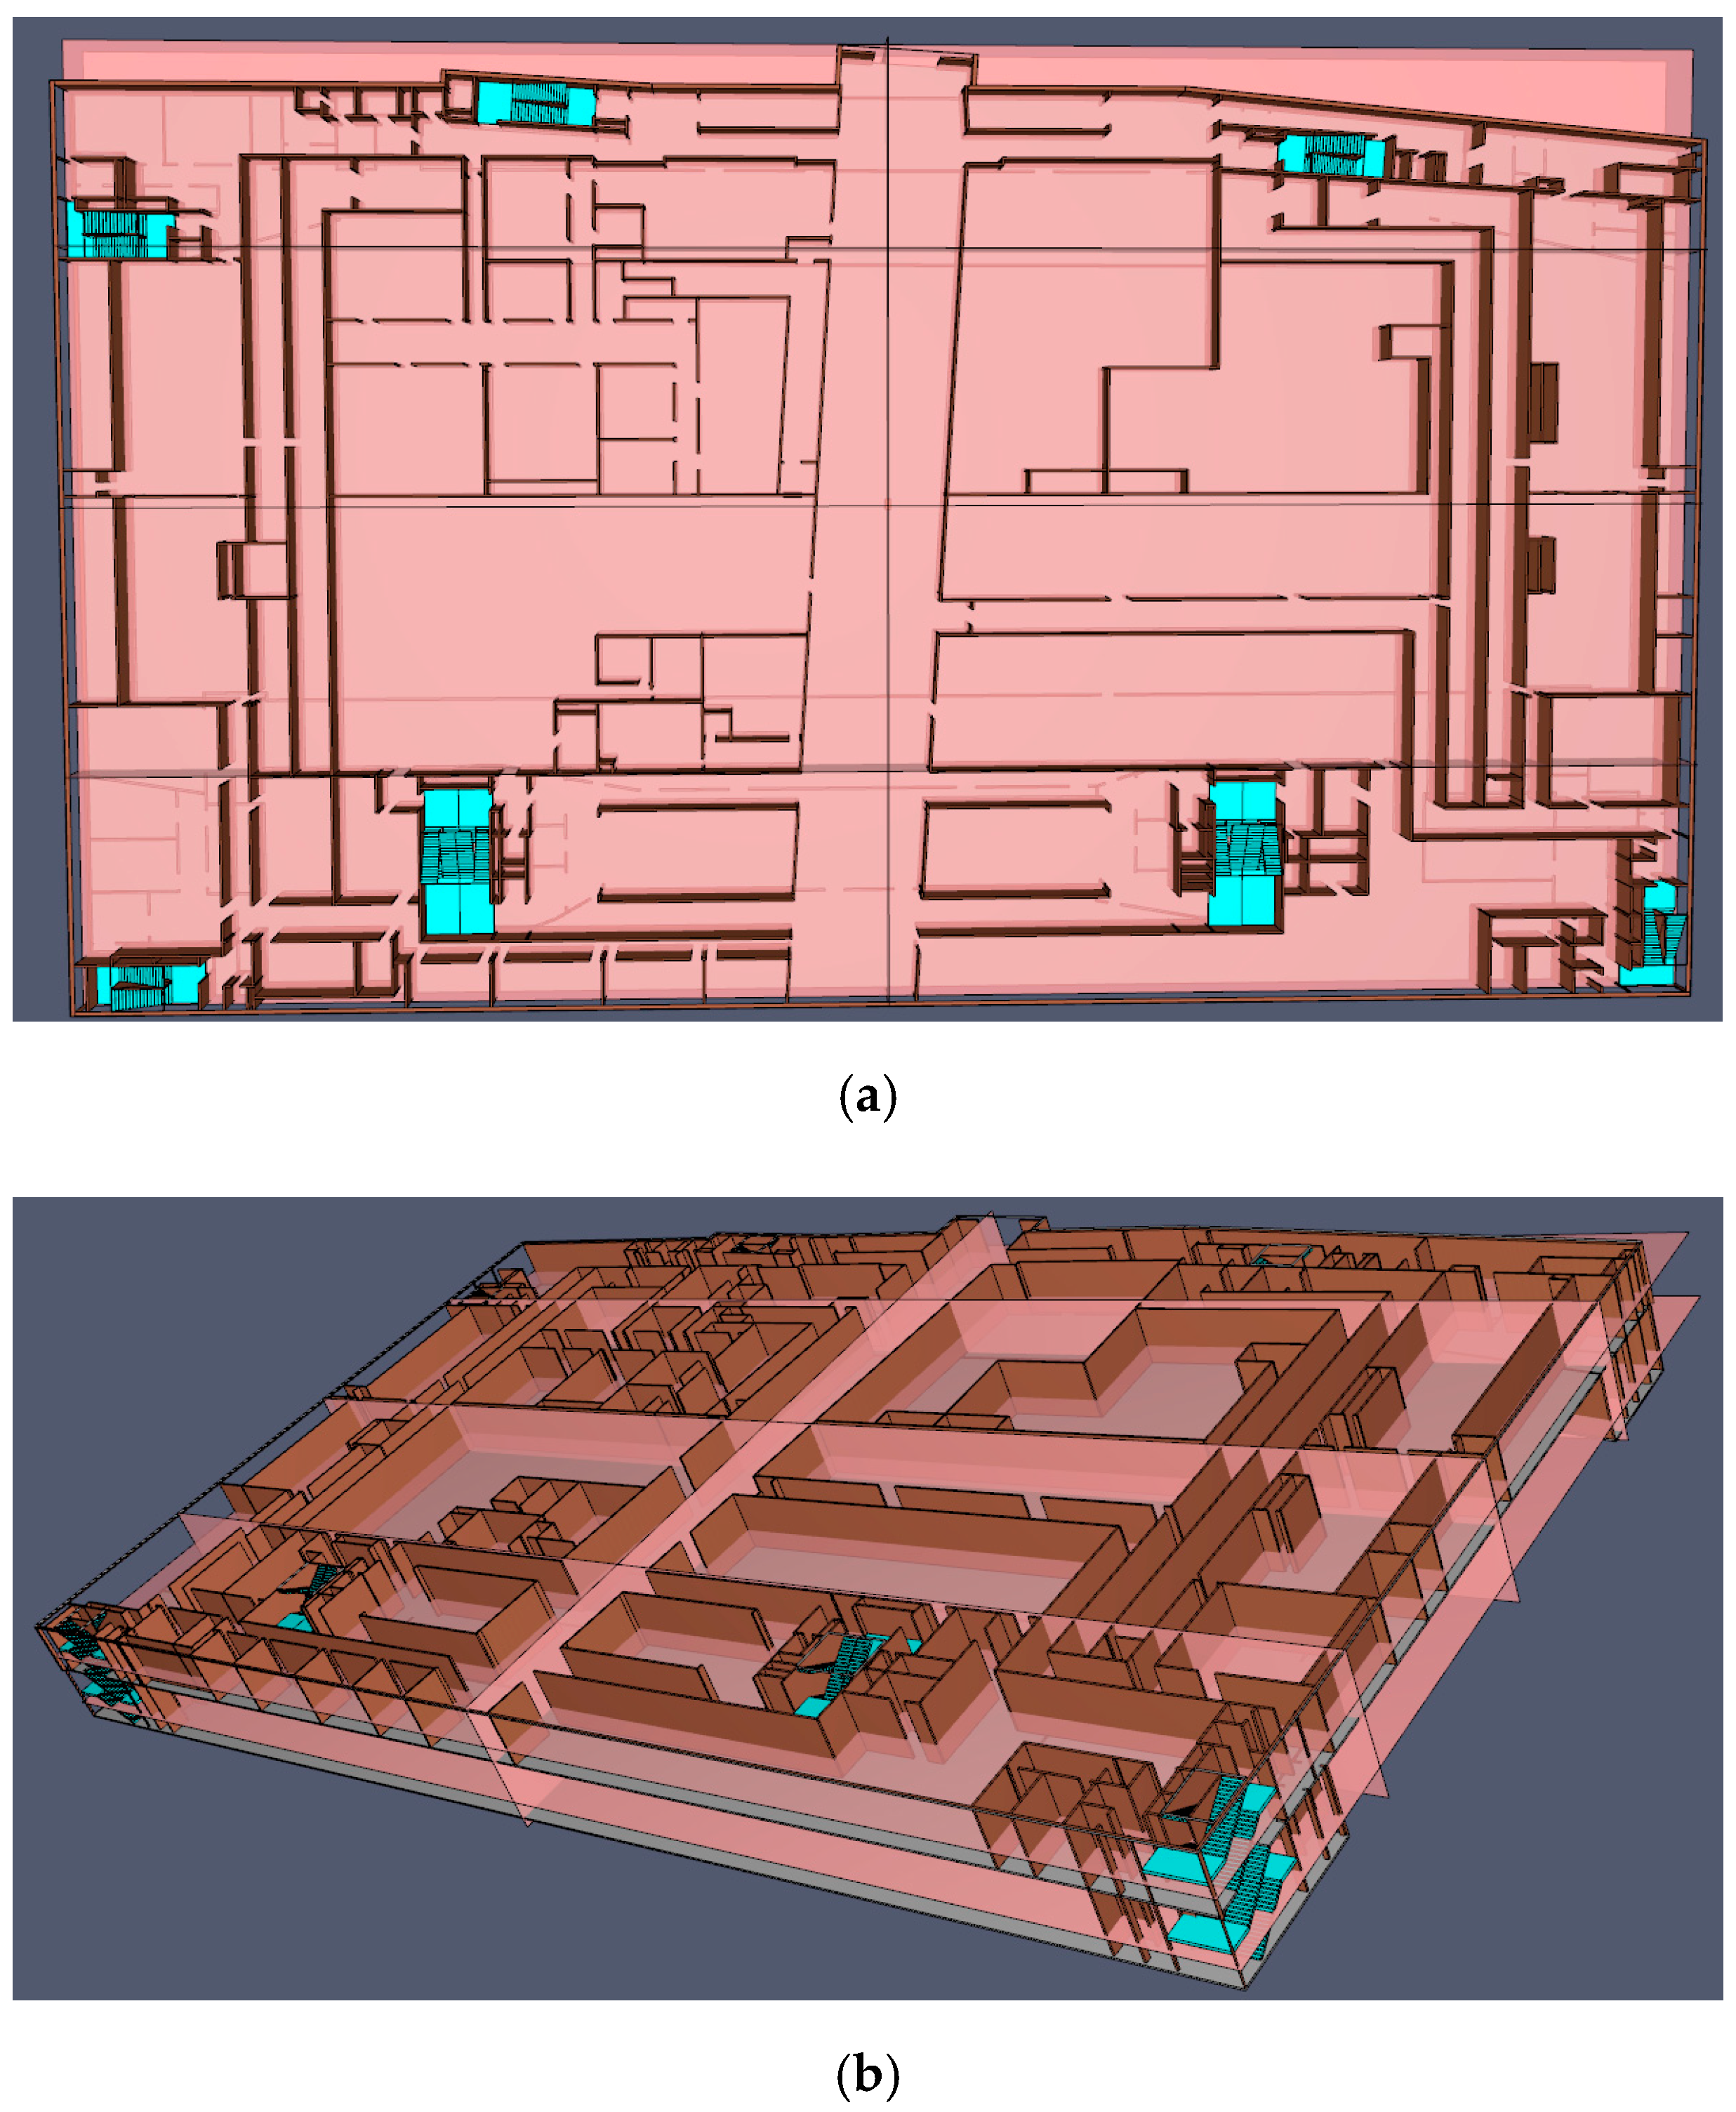
2.1. Import of PyroSim Model
Figure 3 shows a BIM ichnography of the Starting Area in the Guangzhou Interna-tional Financial City. The BIM of Zones I and II, shown in
Figure 3, were imported into the PyroSim, as shown in
Figure 4 and
Figure 5, respectively. Because the imported model retains the component color of BIM, users can set the surface thermodynamic properties of different types of components according to the color [
21].
2.2. Parameter Setting
2.2.1. Mesh Division and Environmental Parameters
The size of the mesh division affects the accuracy of fire simulation results. The smaller the mesh division, the more accurate the simulation result. In this study, the mesh was divided into 0.5 × 0.5 × 0.5 m
3, and the boundary of the PyroSim model of Zones I and II is presented in
Table 1.
The initial temperature was set at 20 °C, pressure at 1 standard atmosphere, relative humidity at 55%, and there was no wind speed. Polyurethane was used as the combustion reaction model. The sprinkler flow coefficient used in this project was 80, sprinkler flow was 61.3 L/min, and trigger temperature was 68 °C.
2.2.2. Mathematical Model of Fire
A fire model is a mathematical model used to describe the fire development. Typically, stable and unstable models are used to describe the fire development. The stable model considers the heat release rate of a fire to be constant, which is an idealized treatment of the fire. The burning process of an unstable model is a development process with initial, full development, and decay stages [
22,
23]. In this study, a non-stable model was selected. The heat release rate in the initial stage can be expressed as
where
Q denotes the heat release rate (KW); α is the fire growth coefficient (KW/s
2); and
t is time of fire development (s). α can be determined according to the combustible categories in the urban underground space, as shown in
Table 2. Owing to the large number of goods in the urban underground complex, the fire growth rate in this study was fast; that is, the fire growth coefficient was 0.0469 KW/s
2. As the time increased, the heat release rate in the building reached its maximum value. The maximum fire heat release rates corresponding to the different building types are listed in
Table 3. The length of fire in the X and Y directions are 0.5 m and 1 m, respectively.
2.2.3. Sensors
Temperature and smoke sensors were integrated in this study and were set to a height of 2 m [
26]. Environmental changes near the evacuation exit of each fire zone should be the key position of evacuation research; therefore, the temperature and smoke sensors were set in the BIM. The BIM data were extracted to obtain the name, coordinates, and other information of the sensors based on the Dynamo. Finally, the sensor name and coordinates were set in the PyroSim model based on the sensor information.
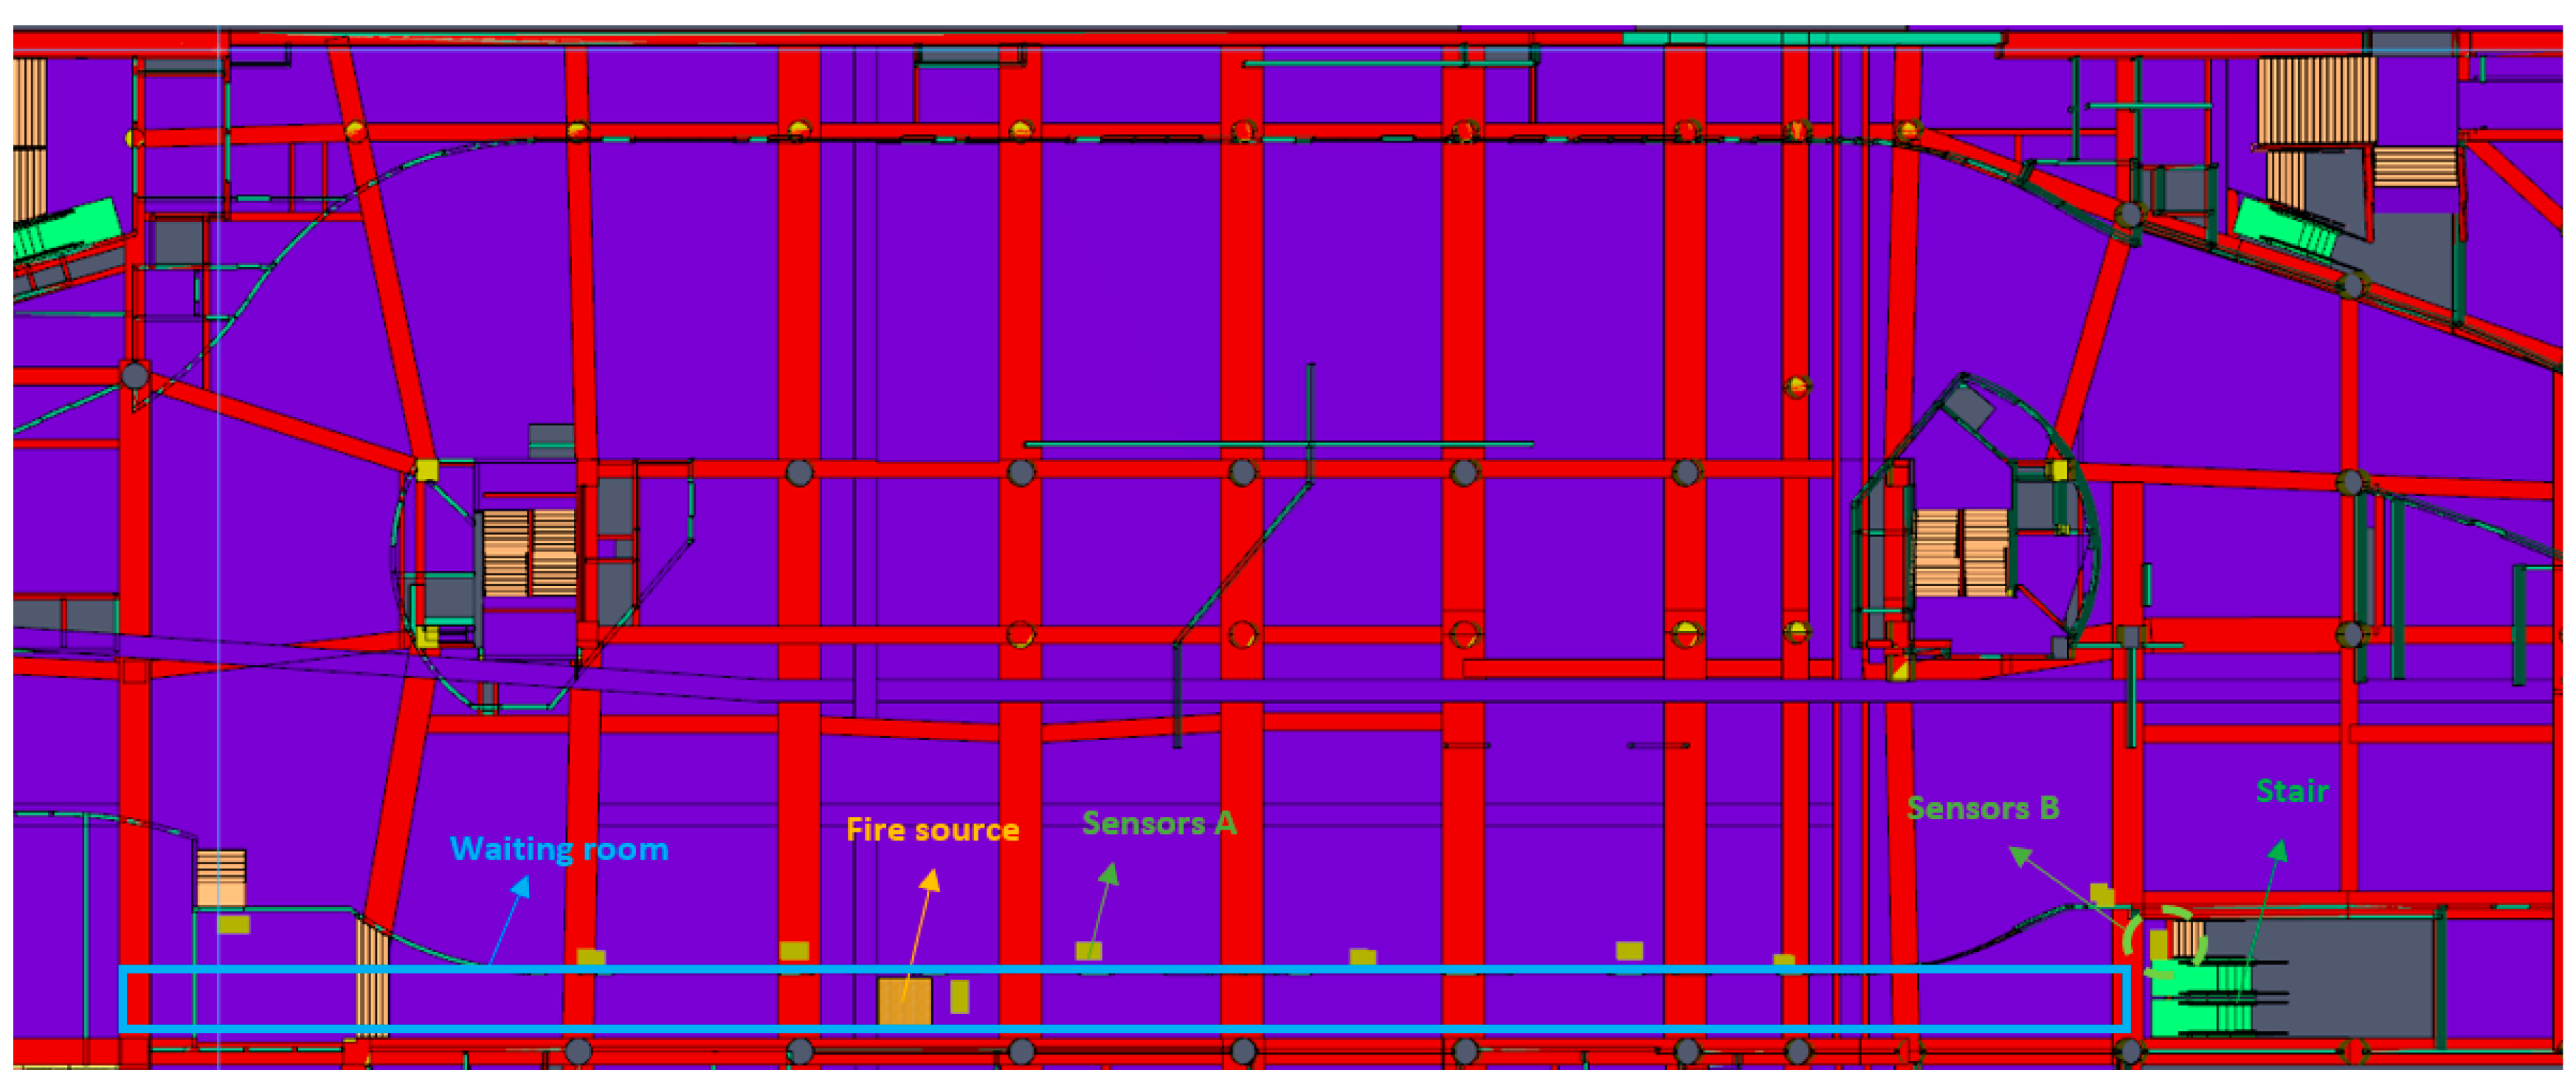
2.3. Fire Simulation Results of Zone I
The PyroSim model of Zone I is composed of multiple floors: the roof, pipe gallery, public mezzanine, and underground loop from high to low. The fire risk in the waiting room of a bus station in a public mezzanine is high because there is a large flow of people, personnel composition is complex, and most of the luggage carried by the passengers is easy to burn. Therefore, a fire source was installed in the waiting room. The locations of the fire source and waiting room in the public mezzanine are shown in
Figure 6. The small green squares in
Figure 6 represent the temperature and smoke sensors.
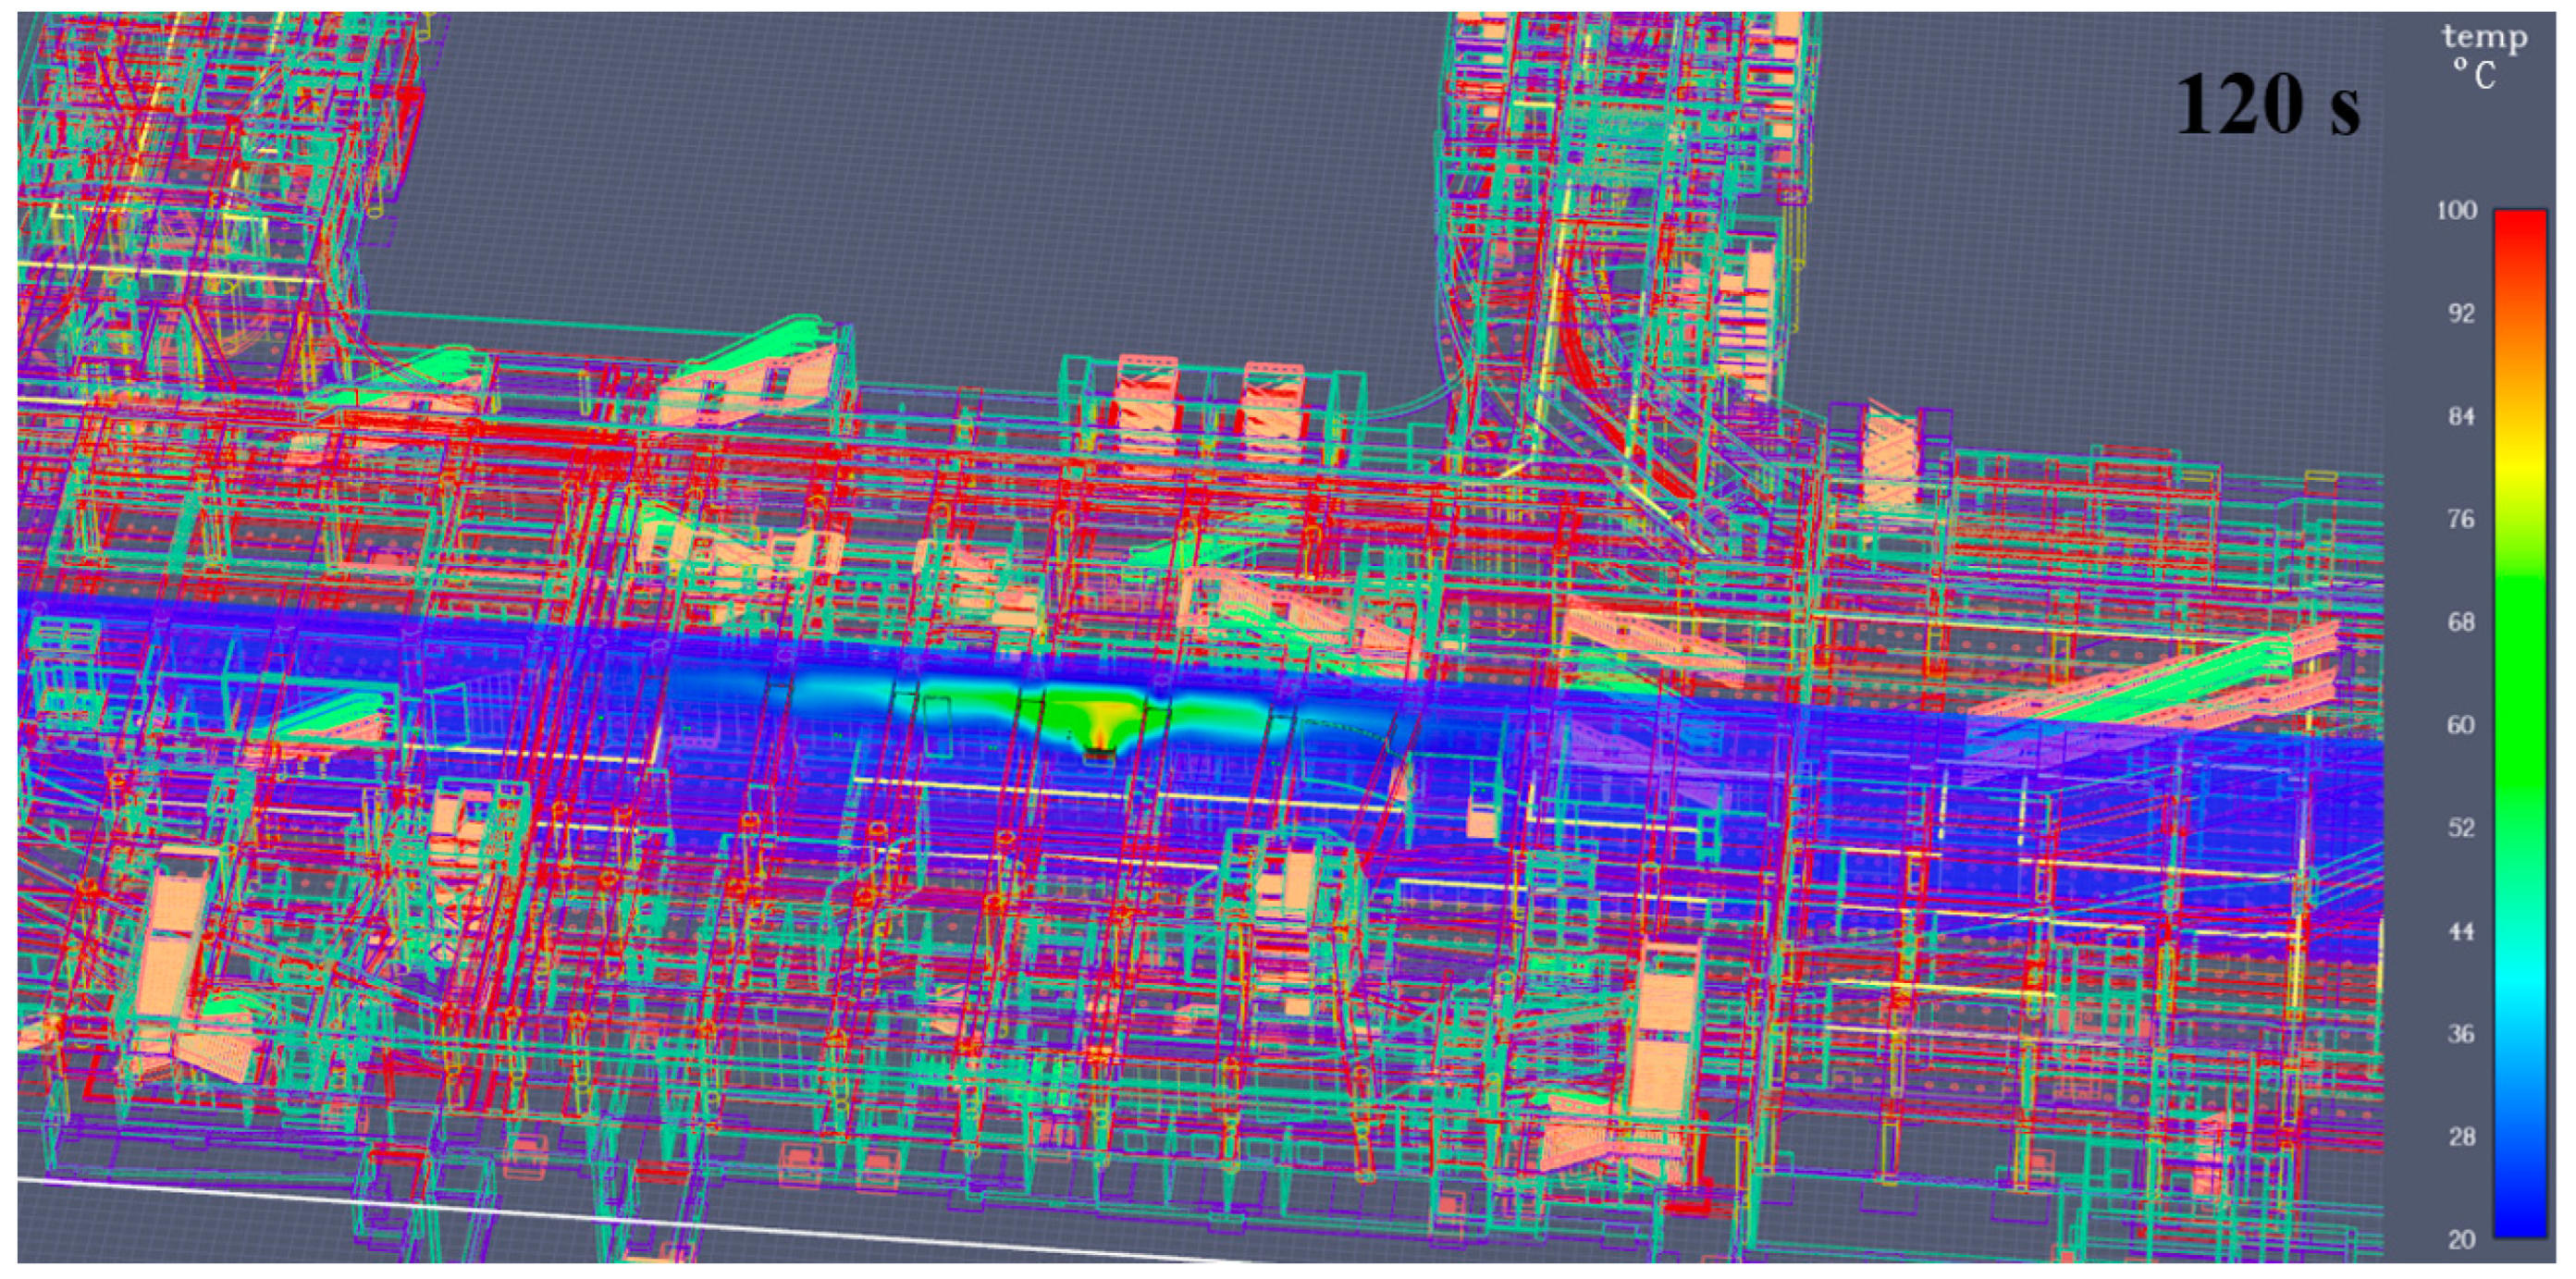
A 2D slice was set at the fire source to obtain the temperature cloud map, as shown in
Figure 7. As shown in
Figure 7, at 120 s, the high-temperature smoke gathered in a small range above the fire source. At this time, they could be evacuated to the waiting room. At 240 s, the high-temperature smoke spread widely along the waiting room; however, the smoke was still at a high position. At this point, people could crawl along the waiting room to the exit. Smoke diffusion is not distinct between 480 s and 700 s; however, the decline in smoke and the rise in temperature is distinct, which is extremely dangerous.
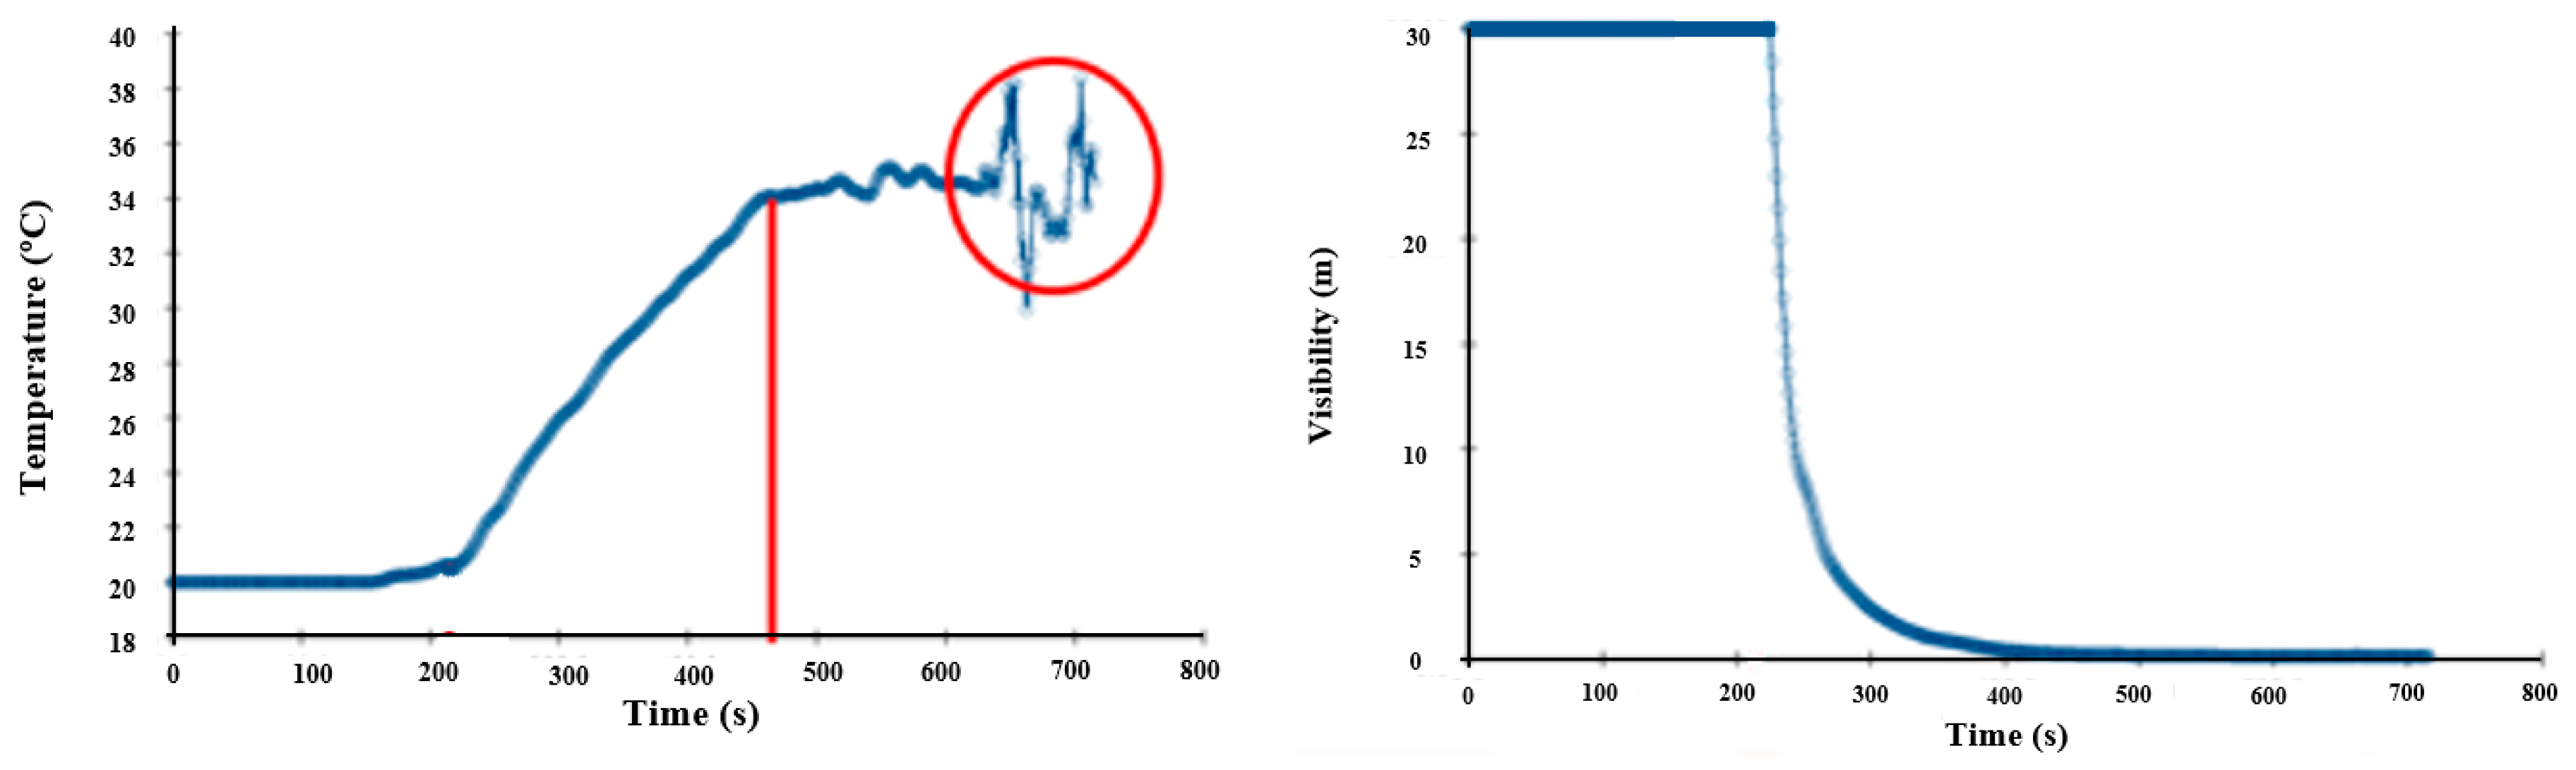
It can be seen from
Figure 8 that the temperature began to rise and visibility began to decline after 200 s, which indicates that the smoke had spread to the staircase. However, the temperature tends to stabilize for approximately 500 s because the smoke emerged from the staircase into the external environment, and heat exchange was realized. Finally, at the end of the simulation, the temperature fluctuates, as shown by the red circle in
Figure 8, which indicates that the numerical simulation was unstable at that time, and there might have been an abrupt local pressure change. Therefore, it is necessary to check the model structure and airtightness.
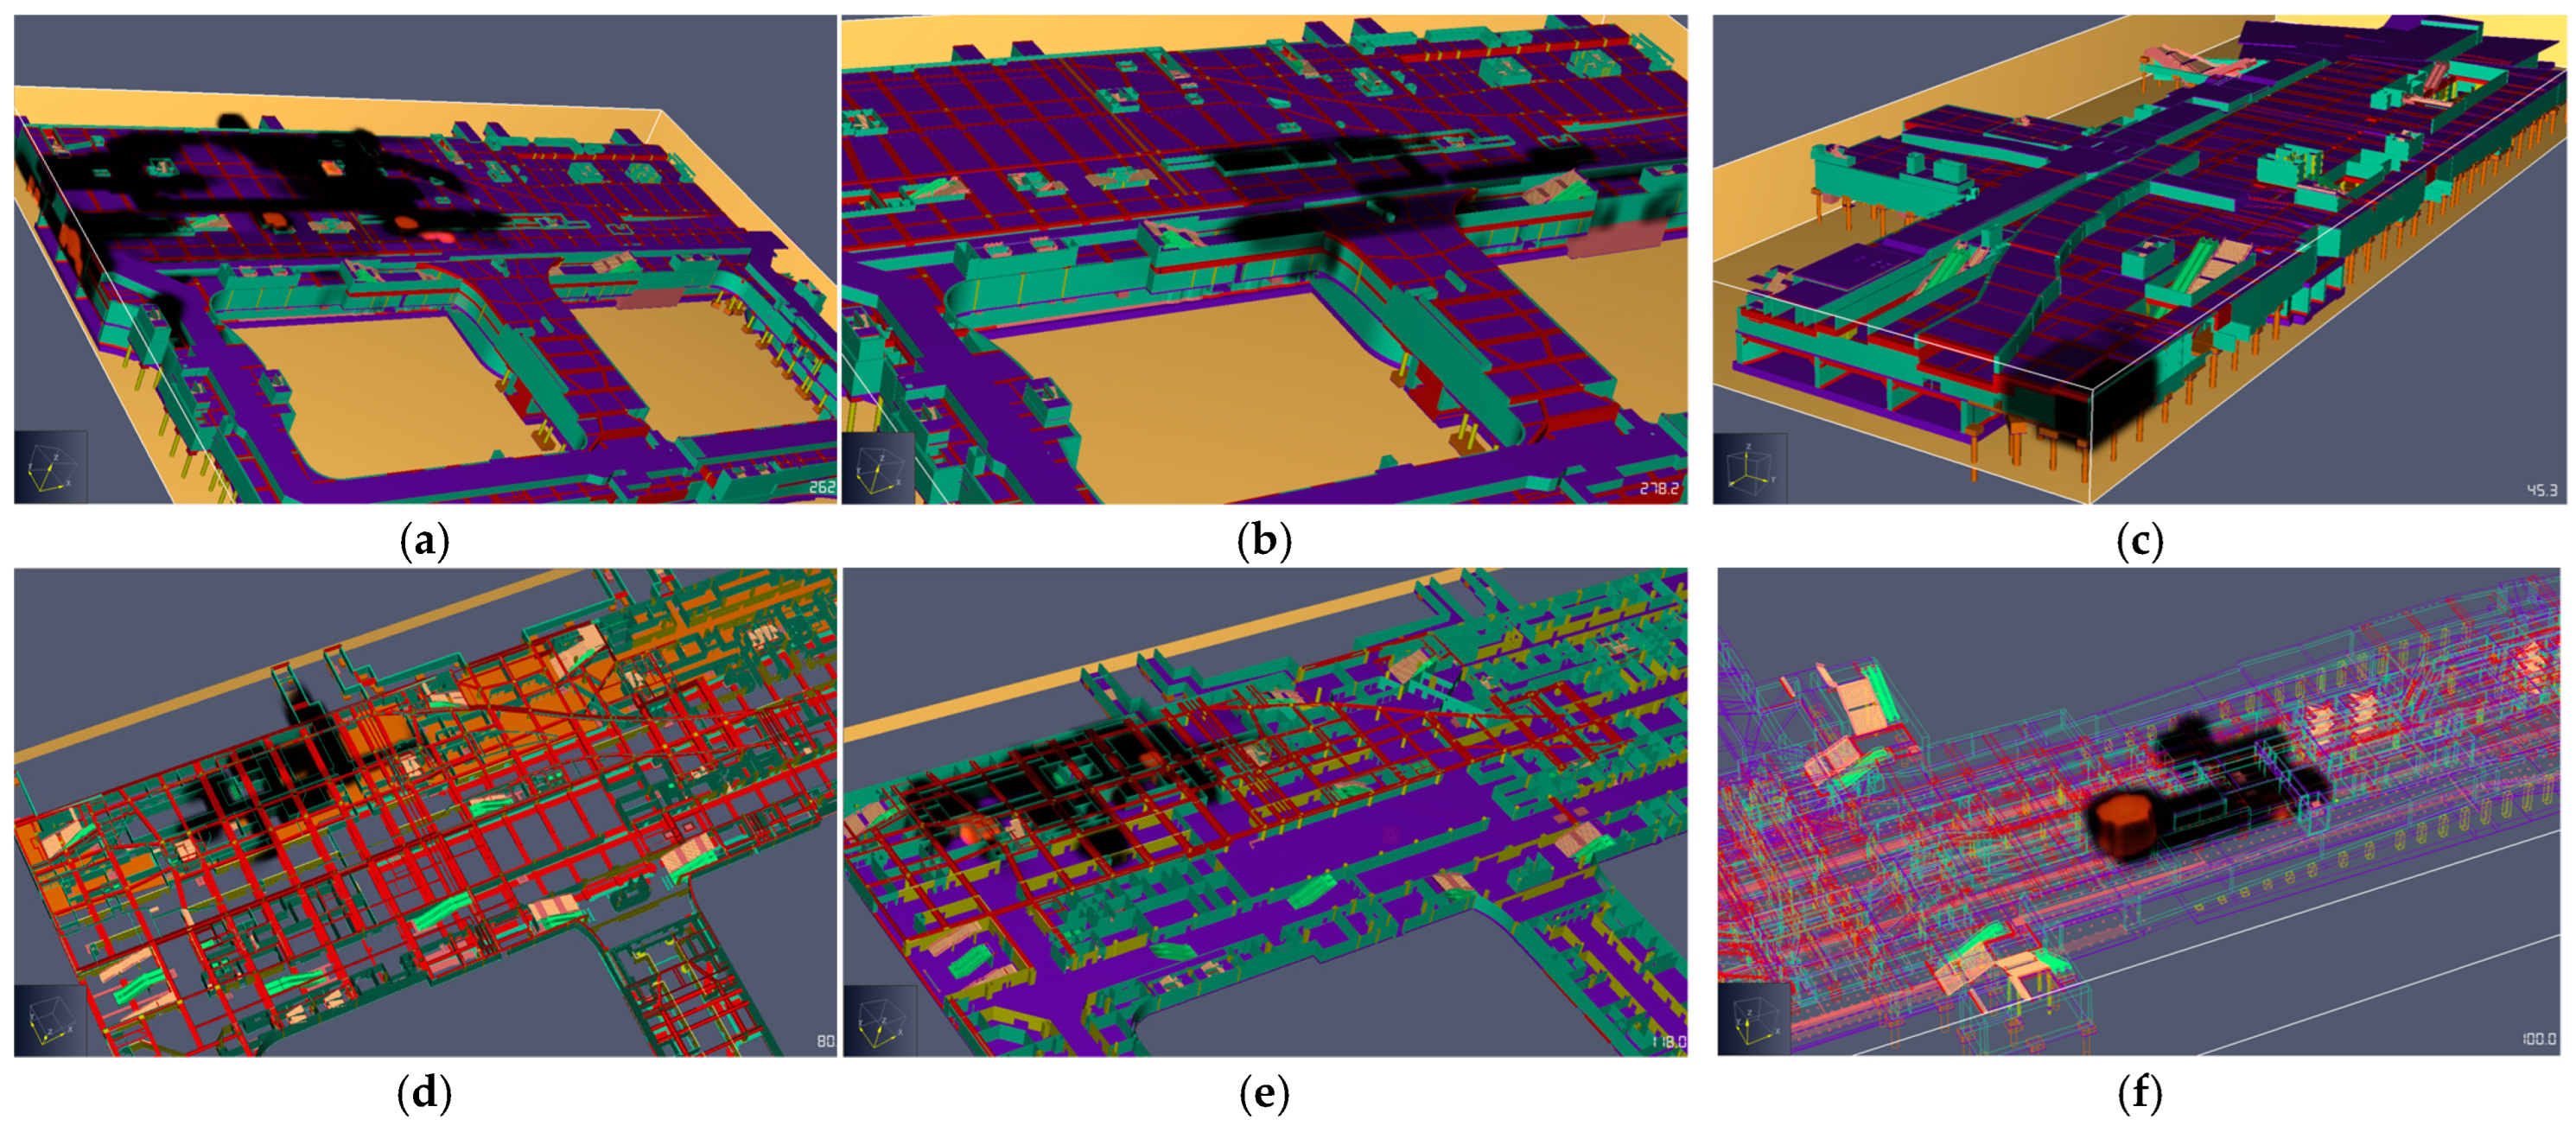
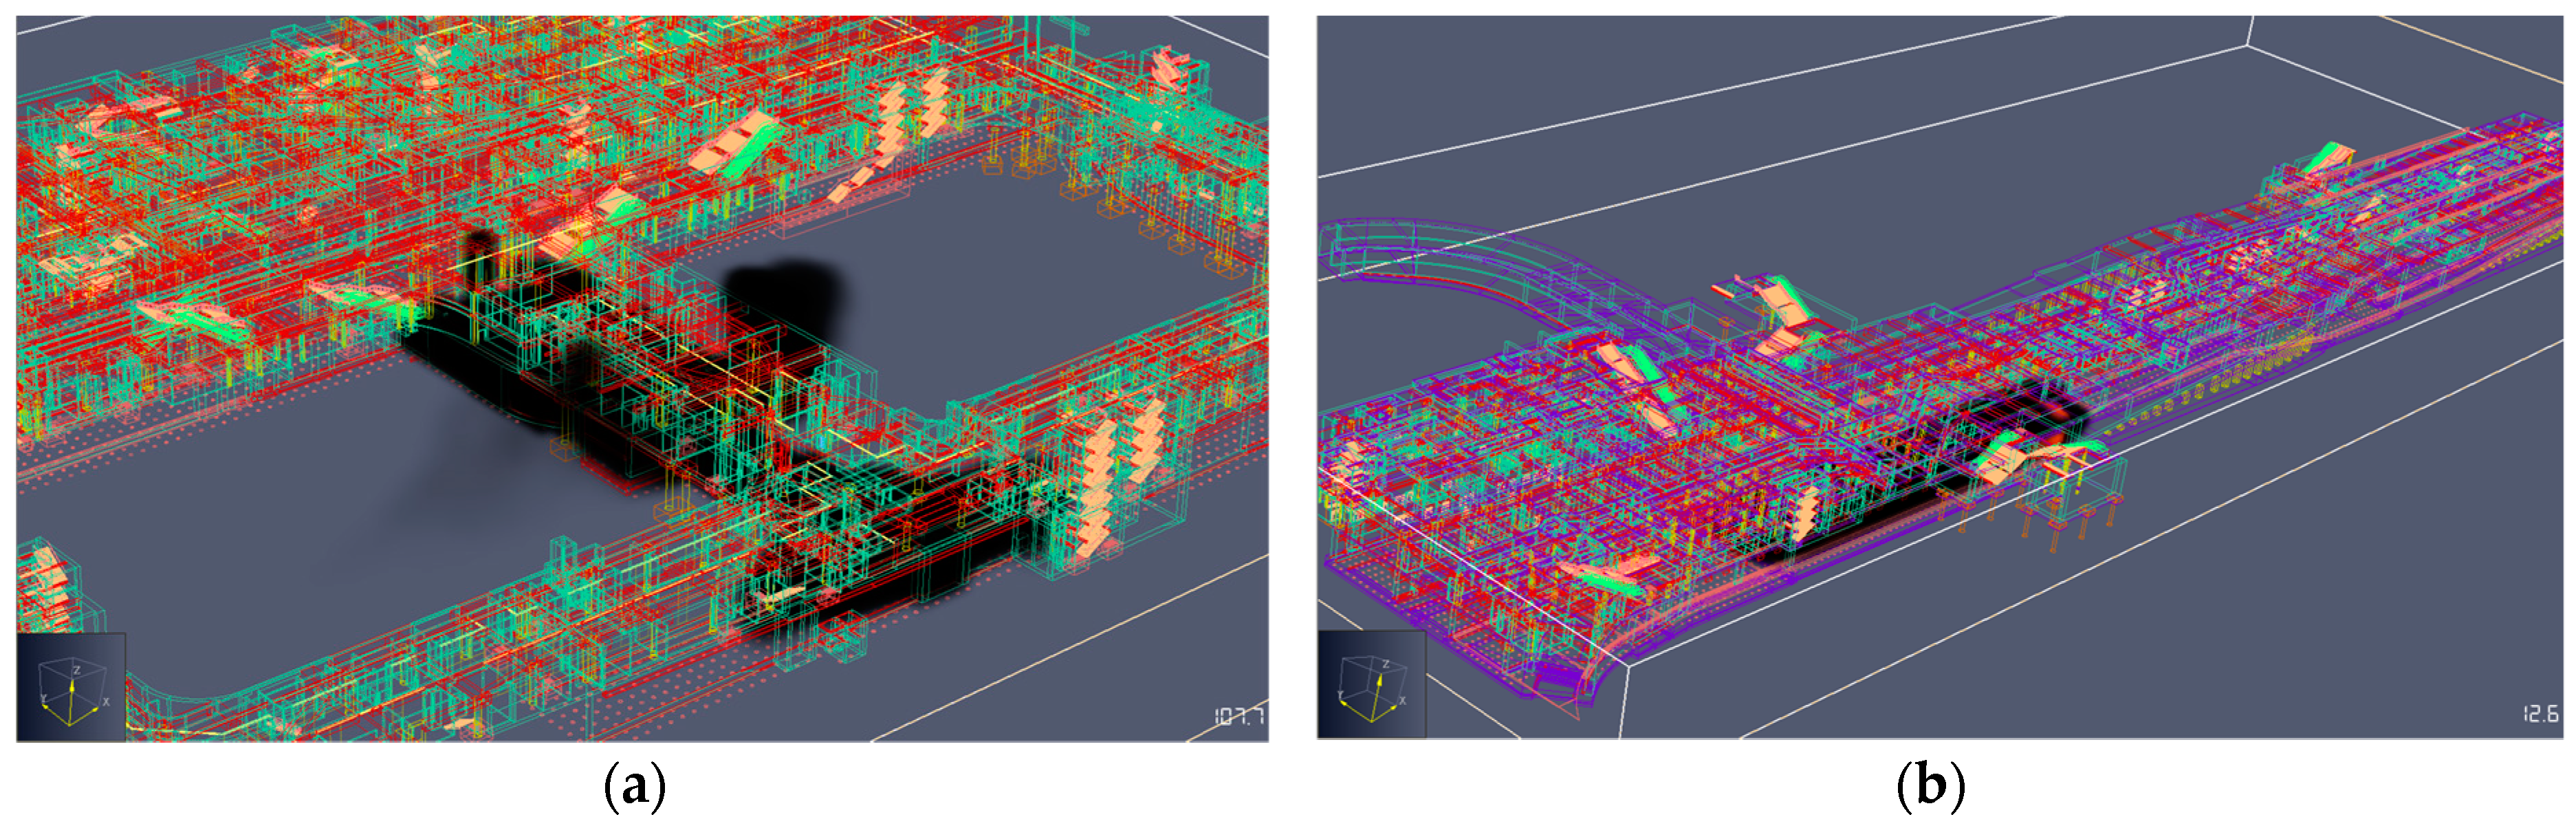
The smoke visualization animation in Zone I was exported, as shown in
Figure 9. At 20 s, owing to the insufficient combustion, a small amount of smoke appeared, which quickly increased from the burning surface to the ceiling. At 85 s, the ceiling of the waiting room was covered with smoke of length 20 m (the center was the position of the fire source); the smoke height was generally as low as 1.2 m within 10 m, and 1.5 m within 20 m. At 157 s, the waiting room was almost entirely covered with smoke. The smoke height within 20 m was generally lower than 1.2 m, and the minimum height of the smoke at the left exit of the waiting room was close to 1.8 m. In 267 s, the smoke height in the waiting room was generally lower than 1 m. The smoke height at the left exit of the waiting room was lower than 1.2 m, and that at the right exit was 1.5 m. At 440 s, the smoke height at both the left and right exits of the waiting room was lower than 1 m, and the smoke overflowed into the parking lot. The smoke height at the exit on the right side of the parking lot was close to 1.5 m. At 530 s, the smoke height in the waiting room and parking lot was generally lower than 1 m, and the smoke height at the remaining exit on the left side of the parking lot was lower than 1.2 m.
According to the fire department statistics, the most immediate causes of death and injury in building fires are not burns but suffocation. Therefore, smoke was generally used as the main factor affecting the time available for building evacuation in this study. Generally, when smoke spreads to a height of 1.5 m in a building, evacuees can only lower their heads to avoid being affected by the smoke, and the pedestrian speed is reduced by 10%. When the smoke spreads to a height of 1.2 m in the building, the evacuees can only bend over to avoid being affected by the smoke, and the pedestrian speed decreases significantly by 40%. When the height of the smoke is less than 1 m, pedestrians cannot move normally, which is regarded as the limit of the human body. Therefore, individuals must evacuate before the height of the smoke is less than 1 m. According to the simulation results, at 440 s, both the left and right exits of the waiting room can no longer be used; at 530 s, the exit on the left side of the parking lot is the only remaining exit, but the smoke height is also lower than 1.2 m. Therefore, it can be preliminarily determined that the available evacuation time ASET = 530 s under this condition.
2.4. Fire Simulation Results of Zone II
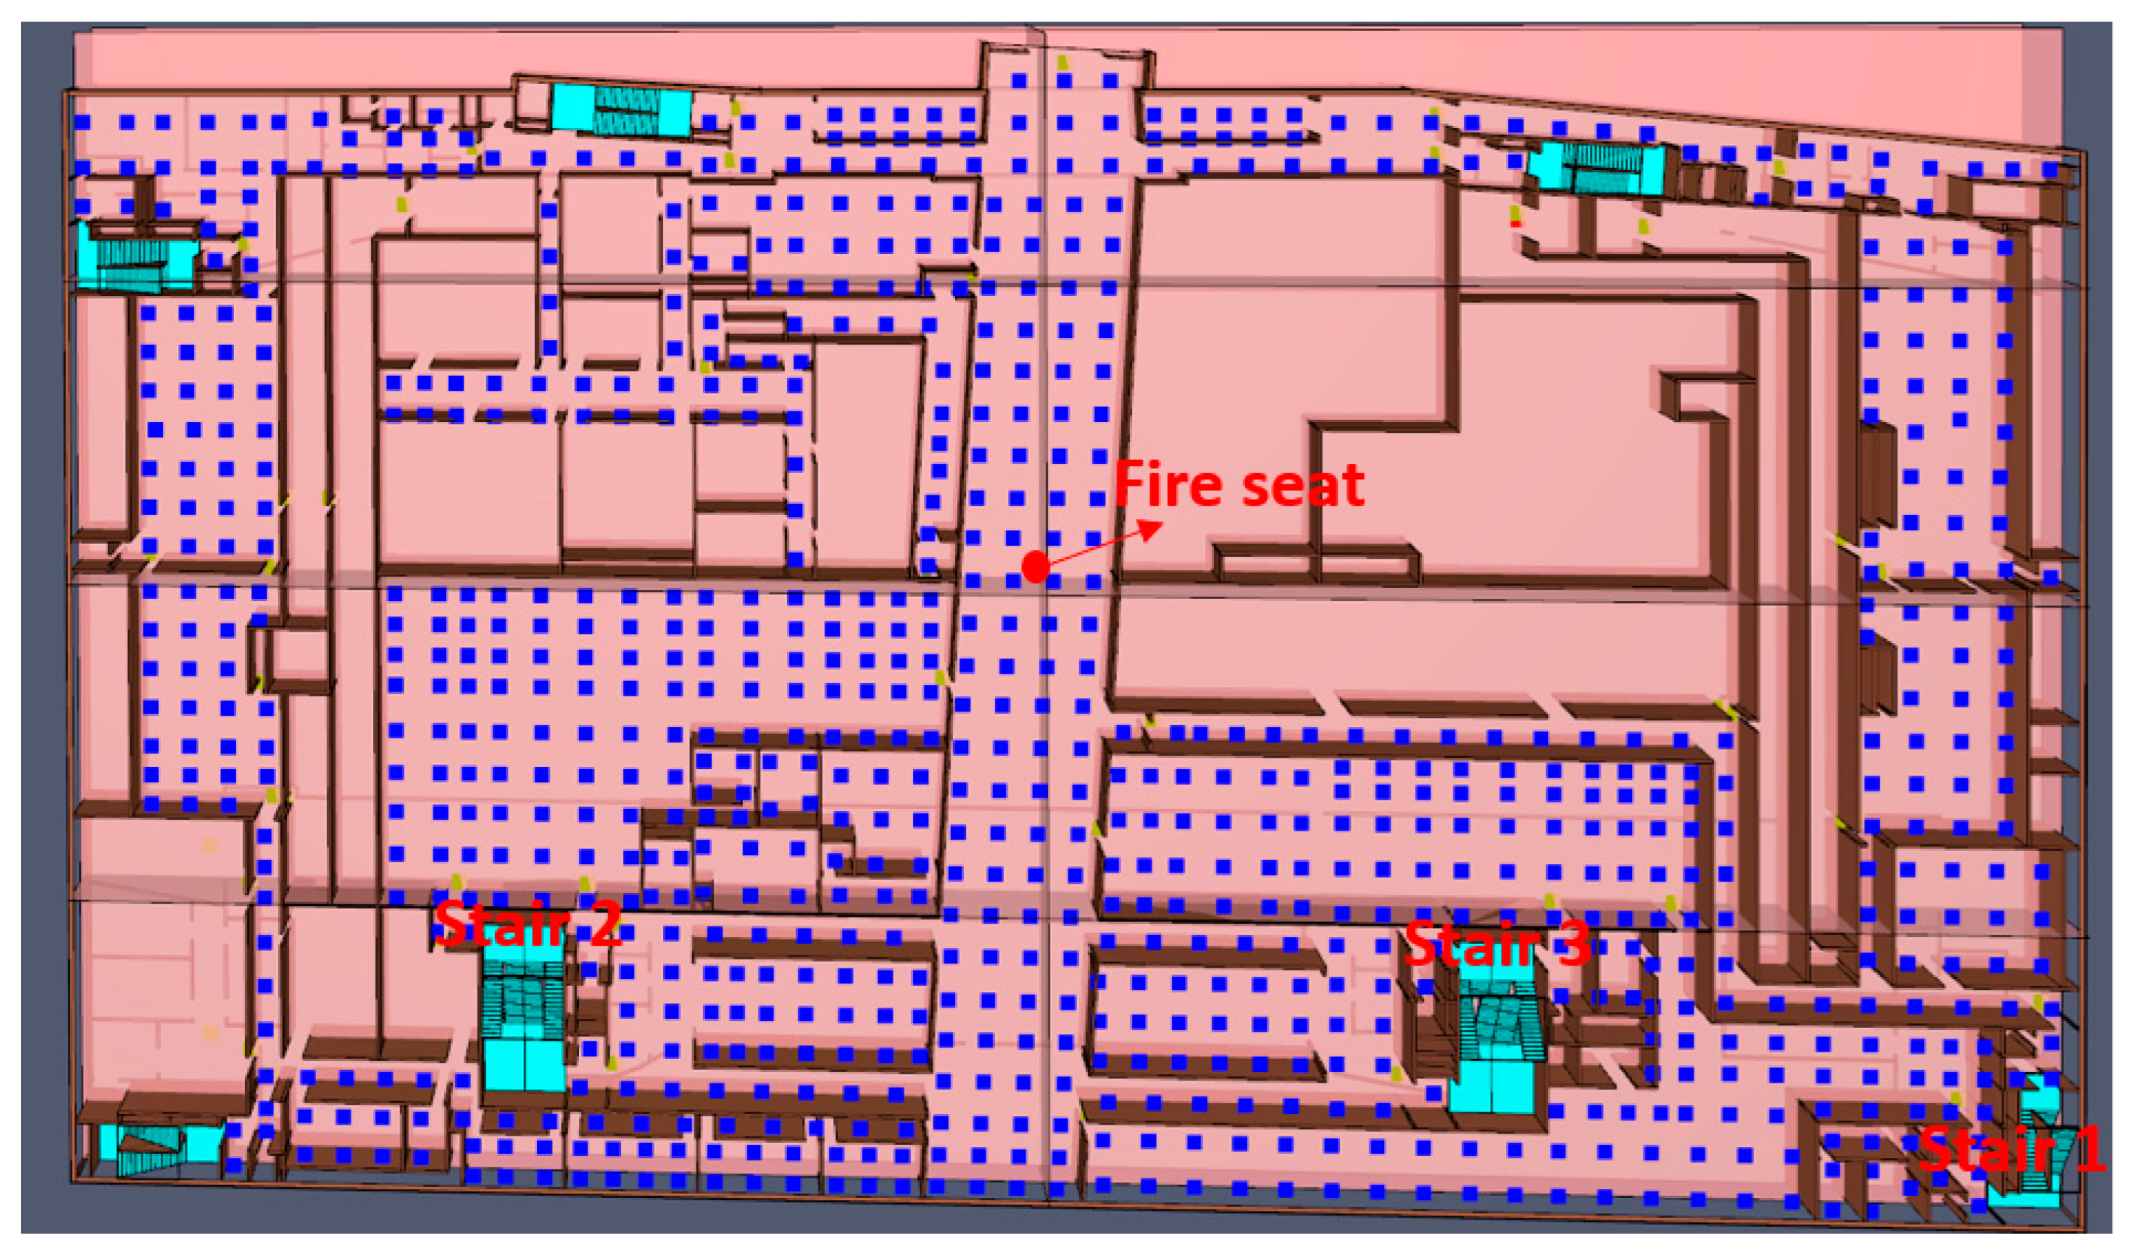
In this simulation, the fire source was set in the middle of the commercial passage because the fire load was large and people were dense, as shown in
Figure 10. According to the spray plan of the underground interlayer and the building plan, 880 sprinklers were set in the model, as indicated by the small blue squares in
Figure 10.
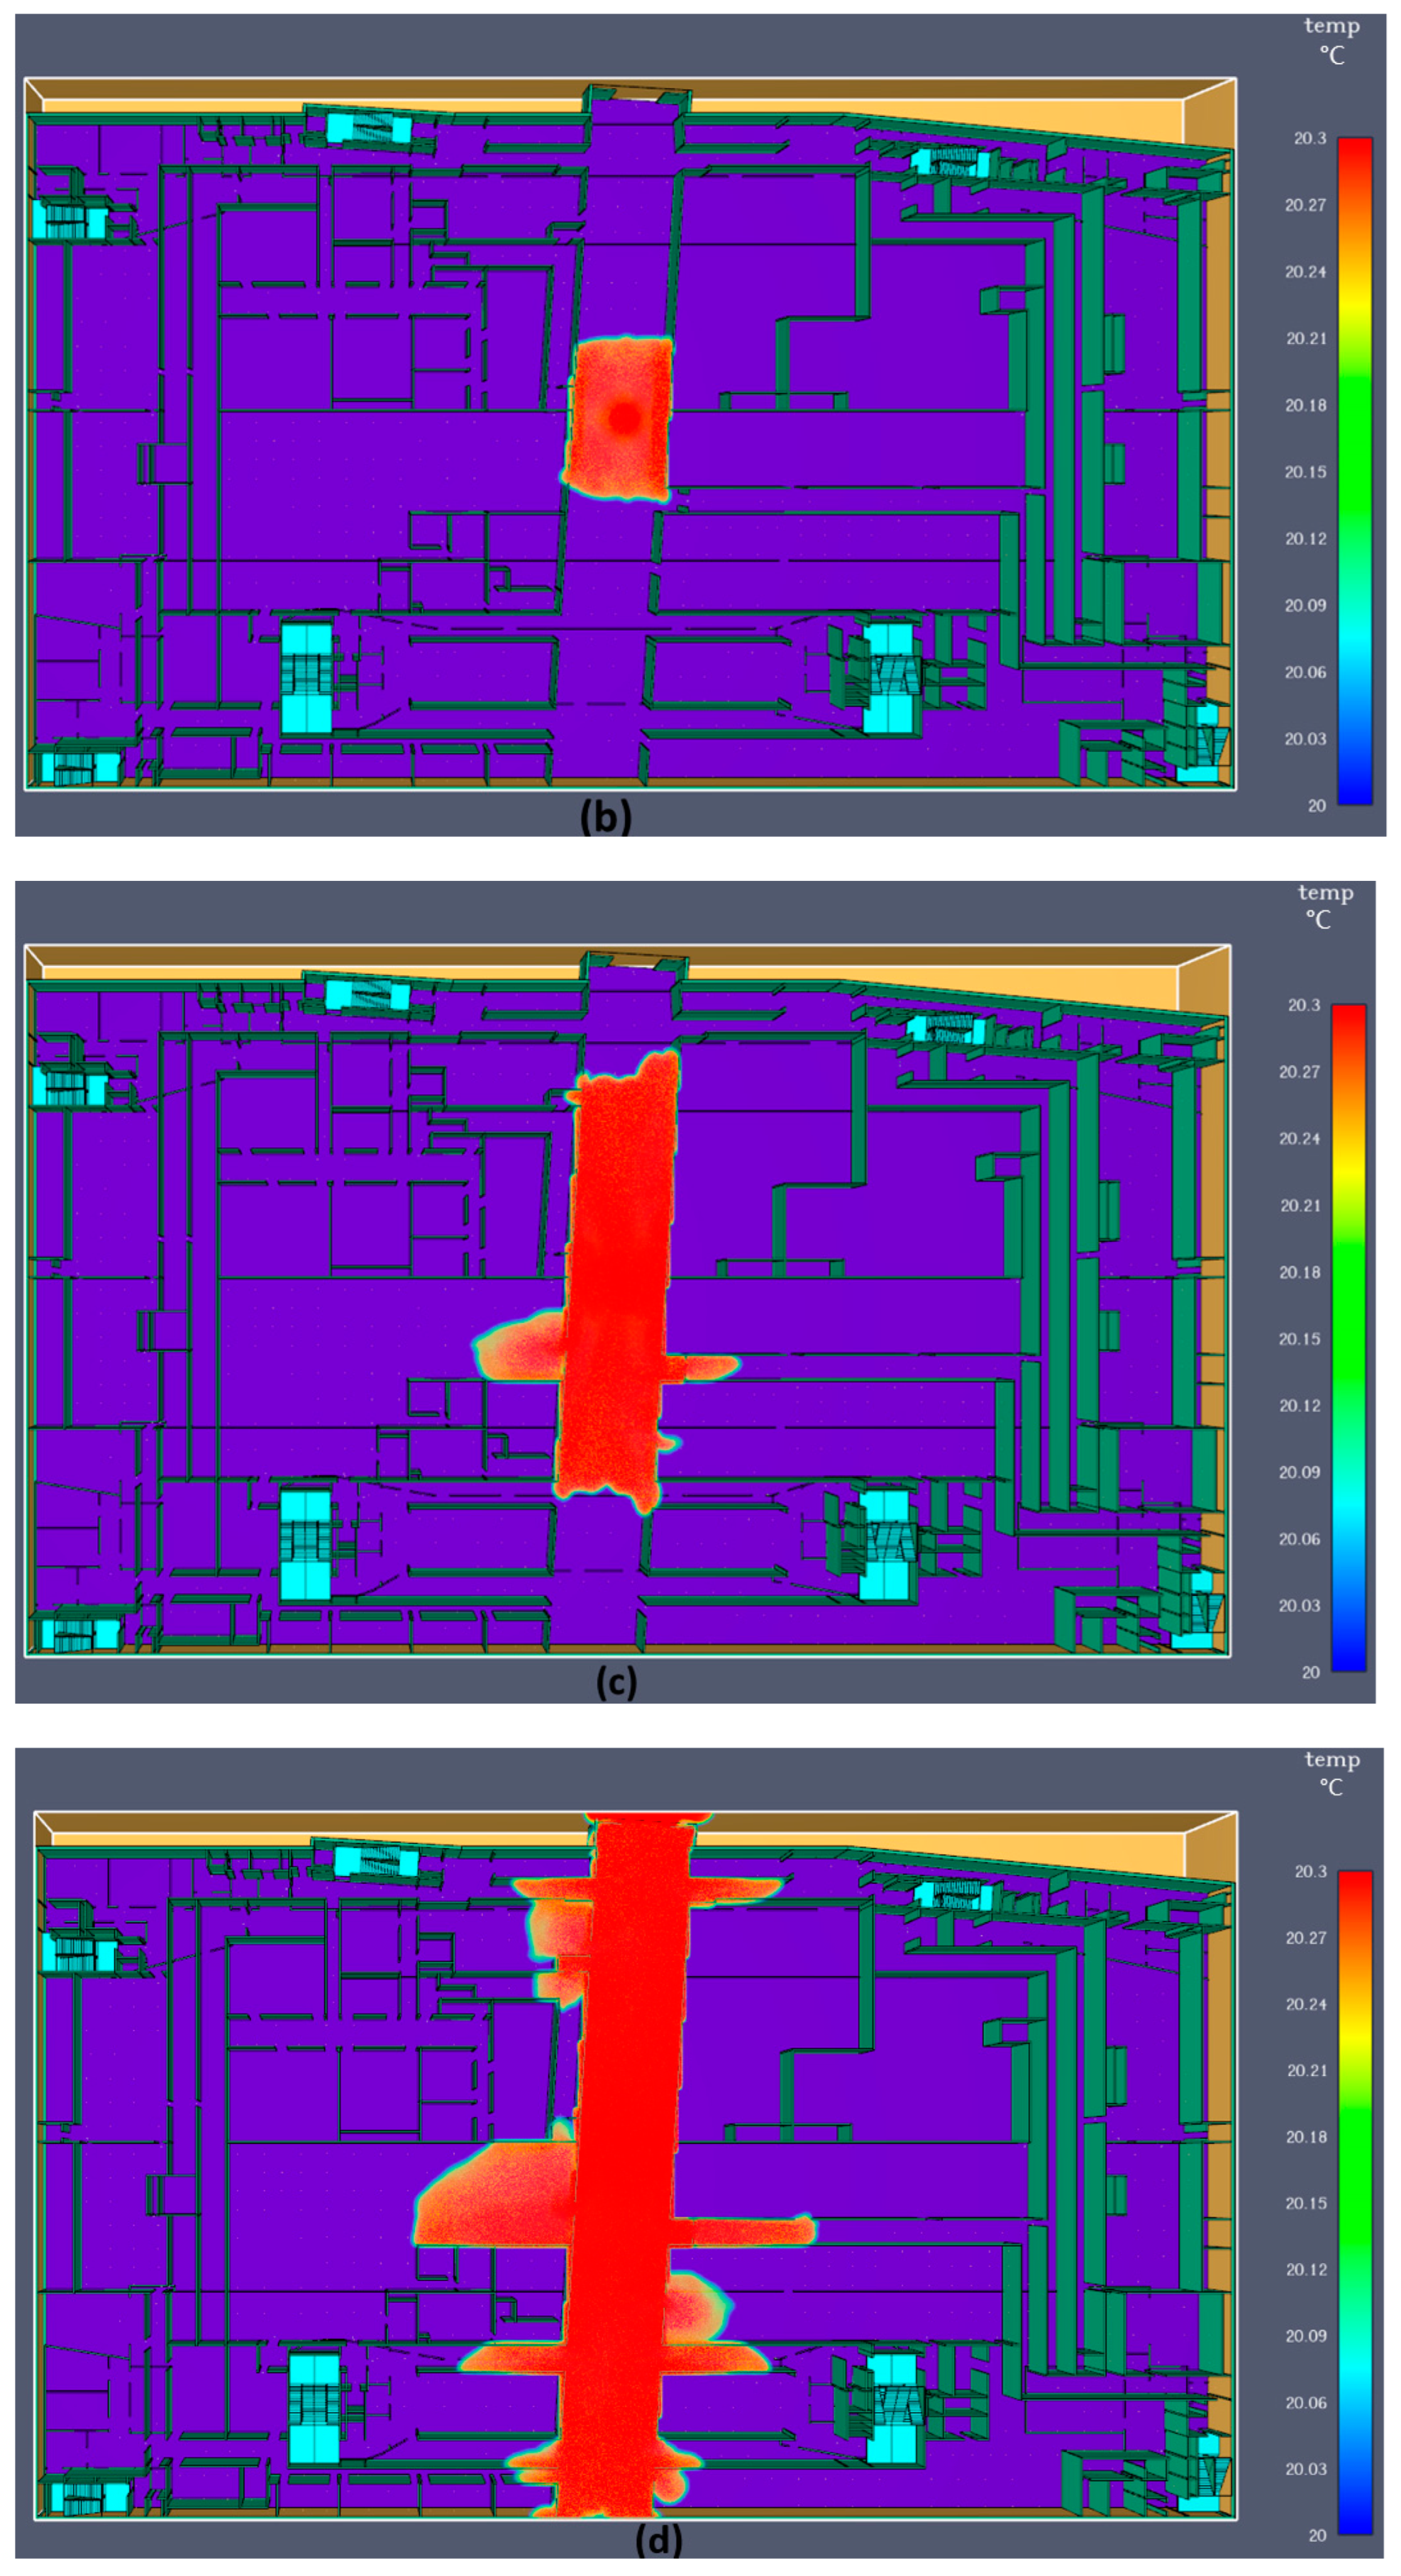
Figure 11 shows a 3D view of the temperature diffusion in Zone II, which shows that the temperature at both ends of the main passage increases faster. Therefore, the time required for safe evacuation at both ends of the main passage is short, and the crowd should be guided to the exits on both sides.
As shown in
Figure 12 and
Figure 13, Sensors 6, 11, and 27 at the exits near the fire source show that the temperature and smoke concentration increase significantly, while the sensor at the exit of the upper end of the main passage shows that the temperature and smoke concentration values peak at 198 s, which indicates that the smoke drops the fastest here, and people should be evacuated to other exits immediately. However, because of the connection between the exit and external environment, the temperature and smoke concentration are affected by the wind, and the temperature and smoke concentration decrease again and remain at a low level, indicating that the sensor should be installed in a sheltered place.
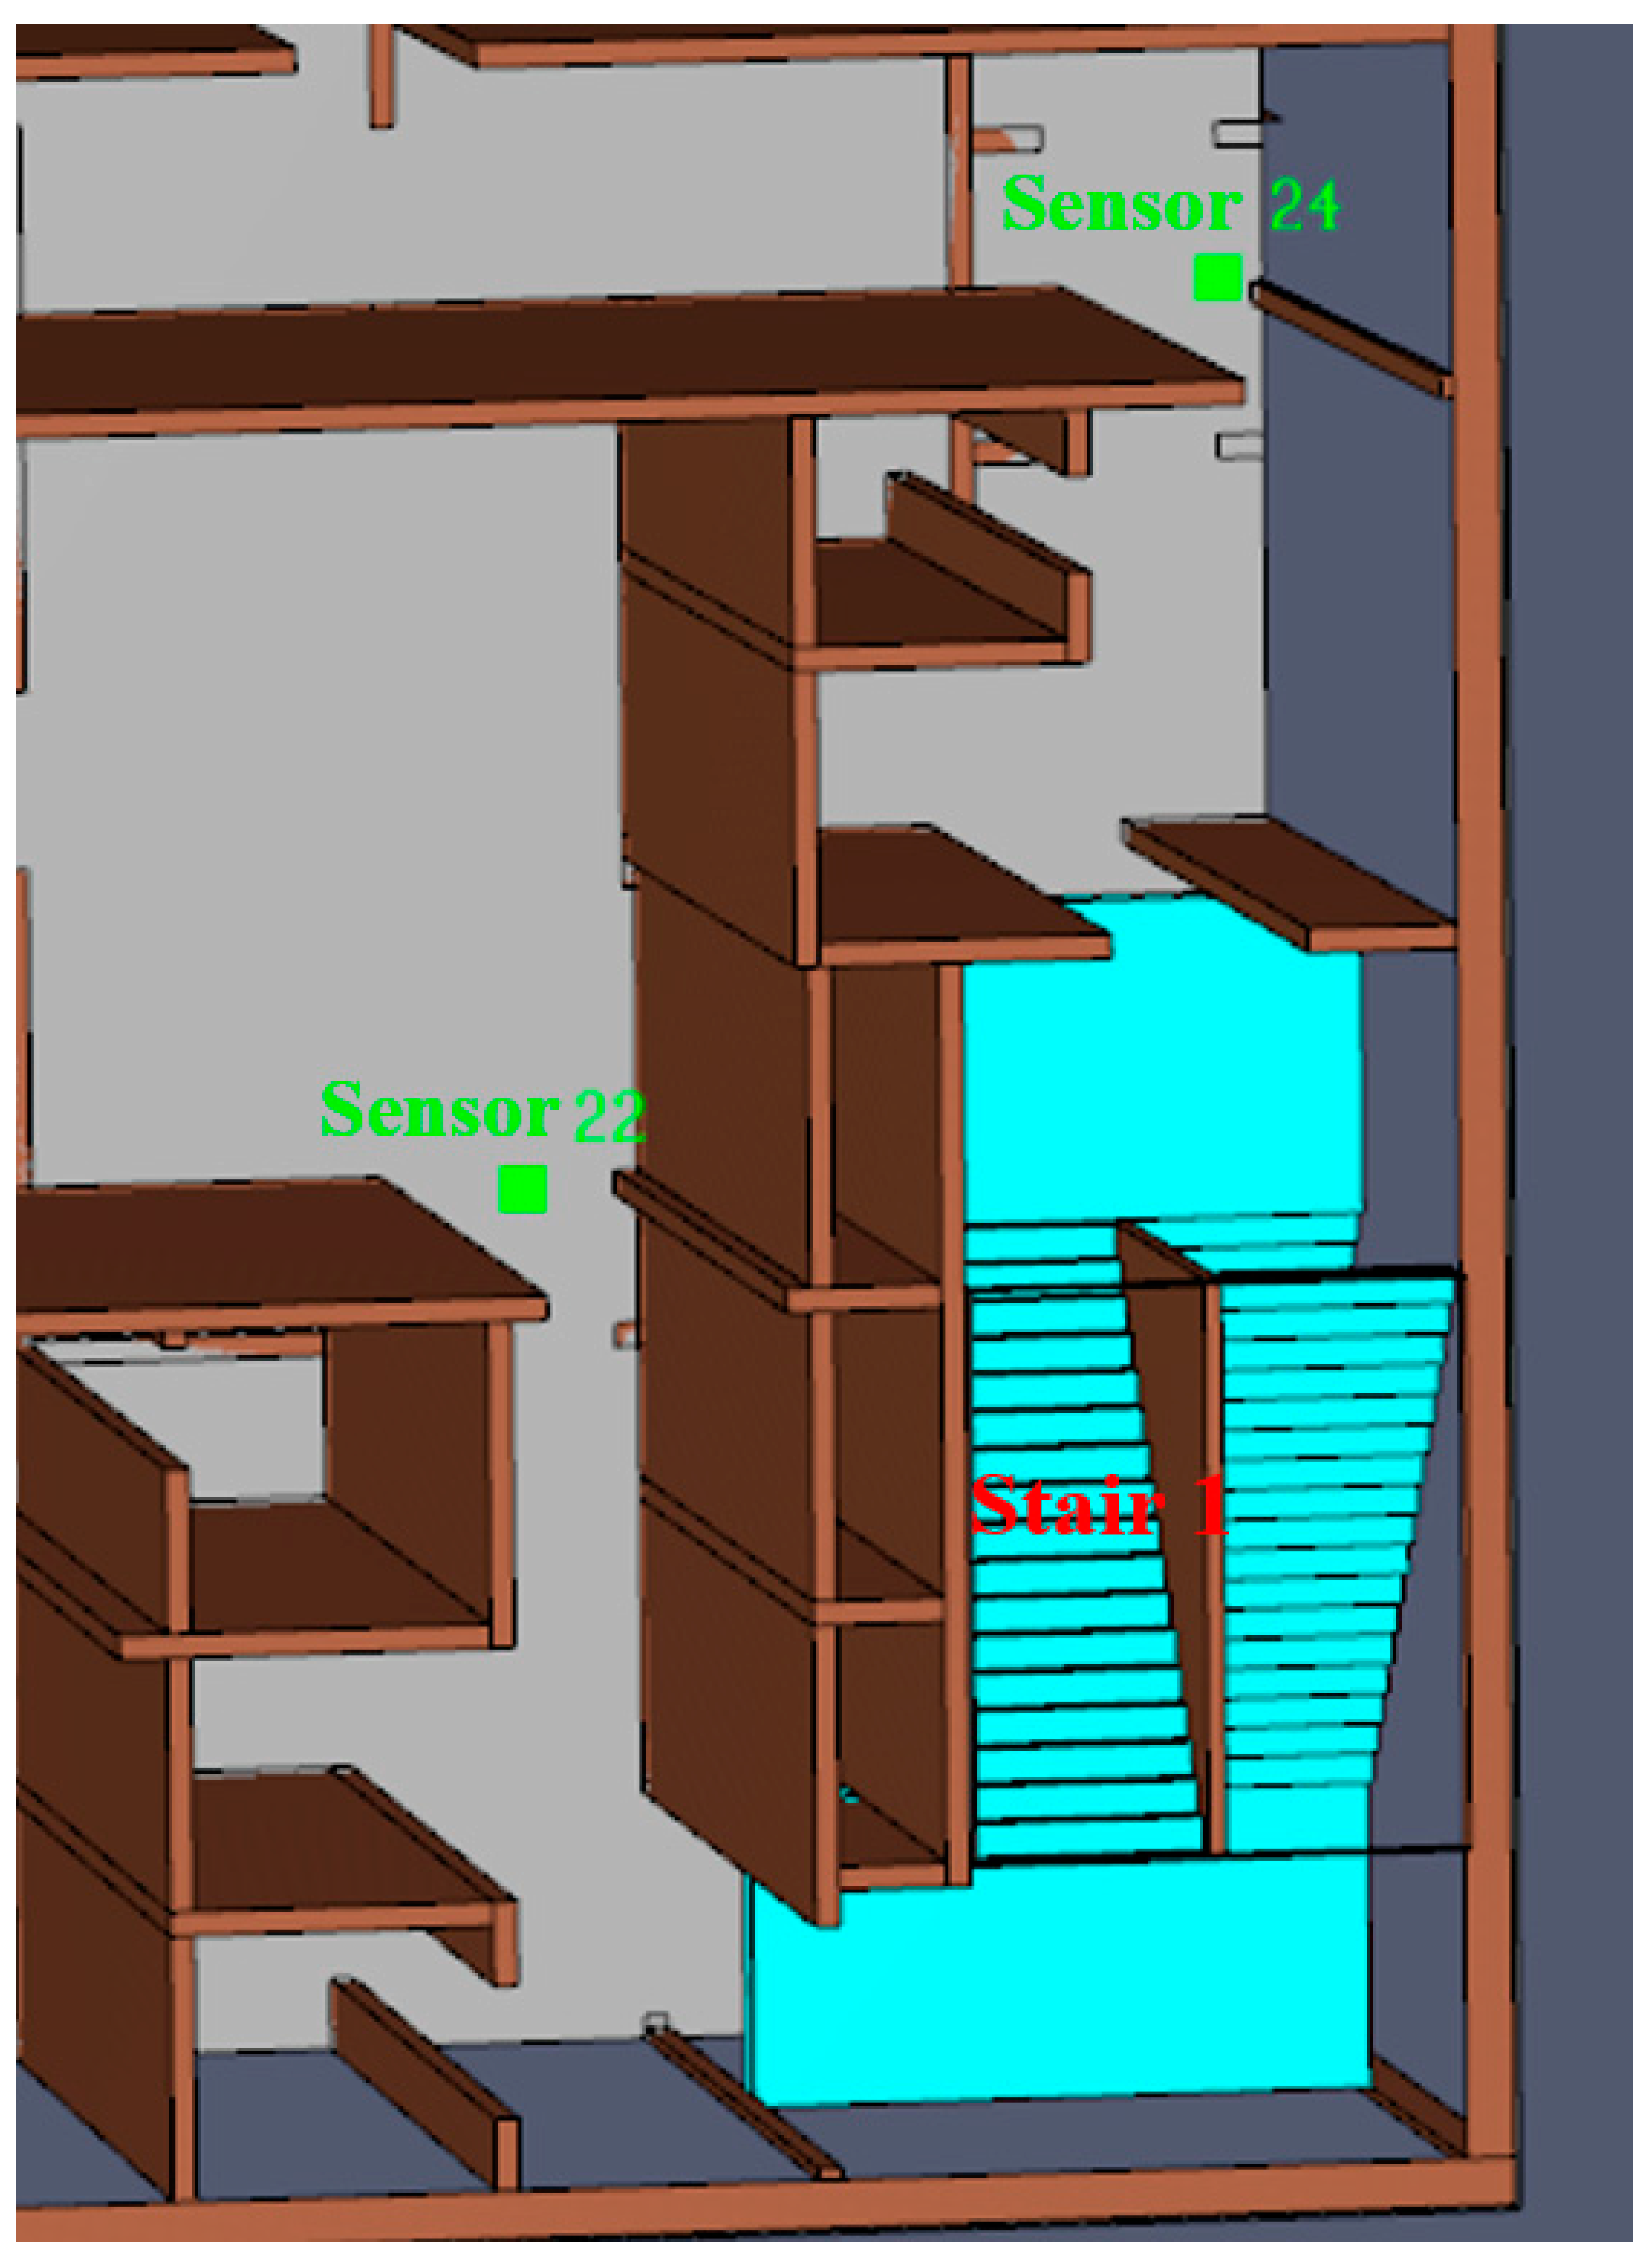
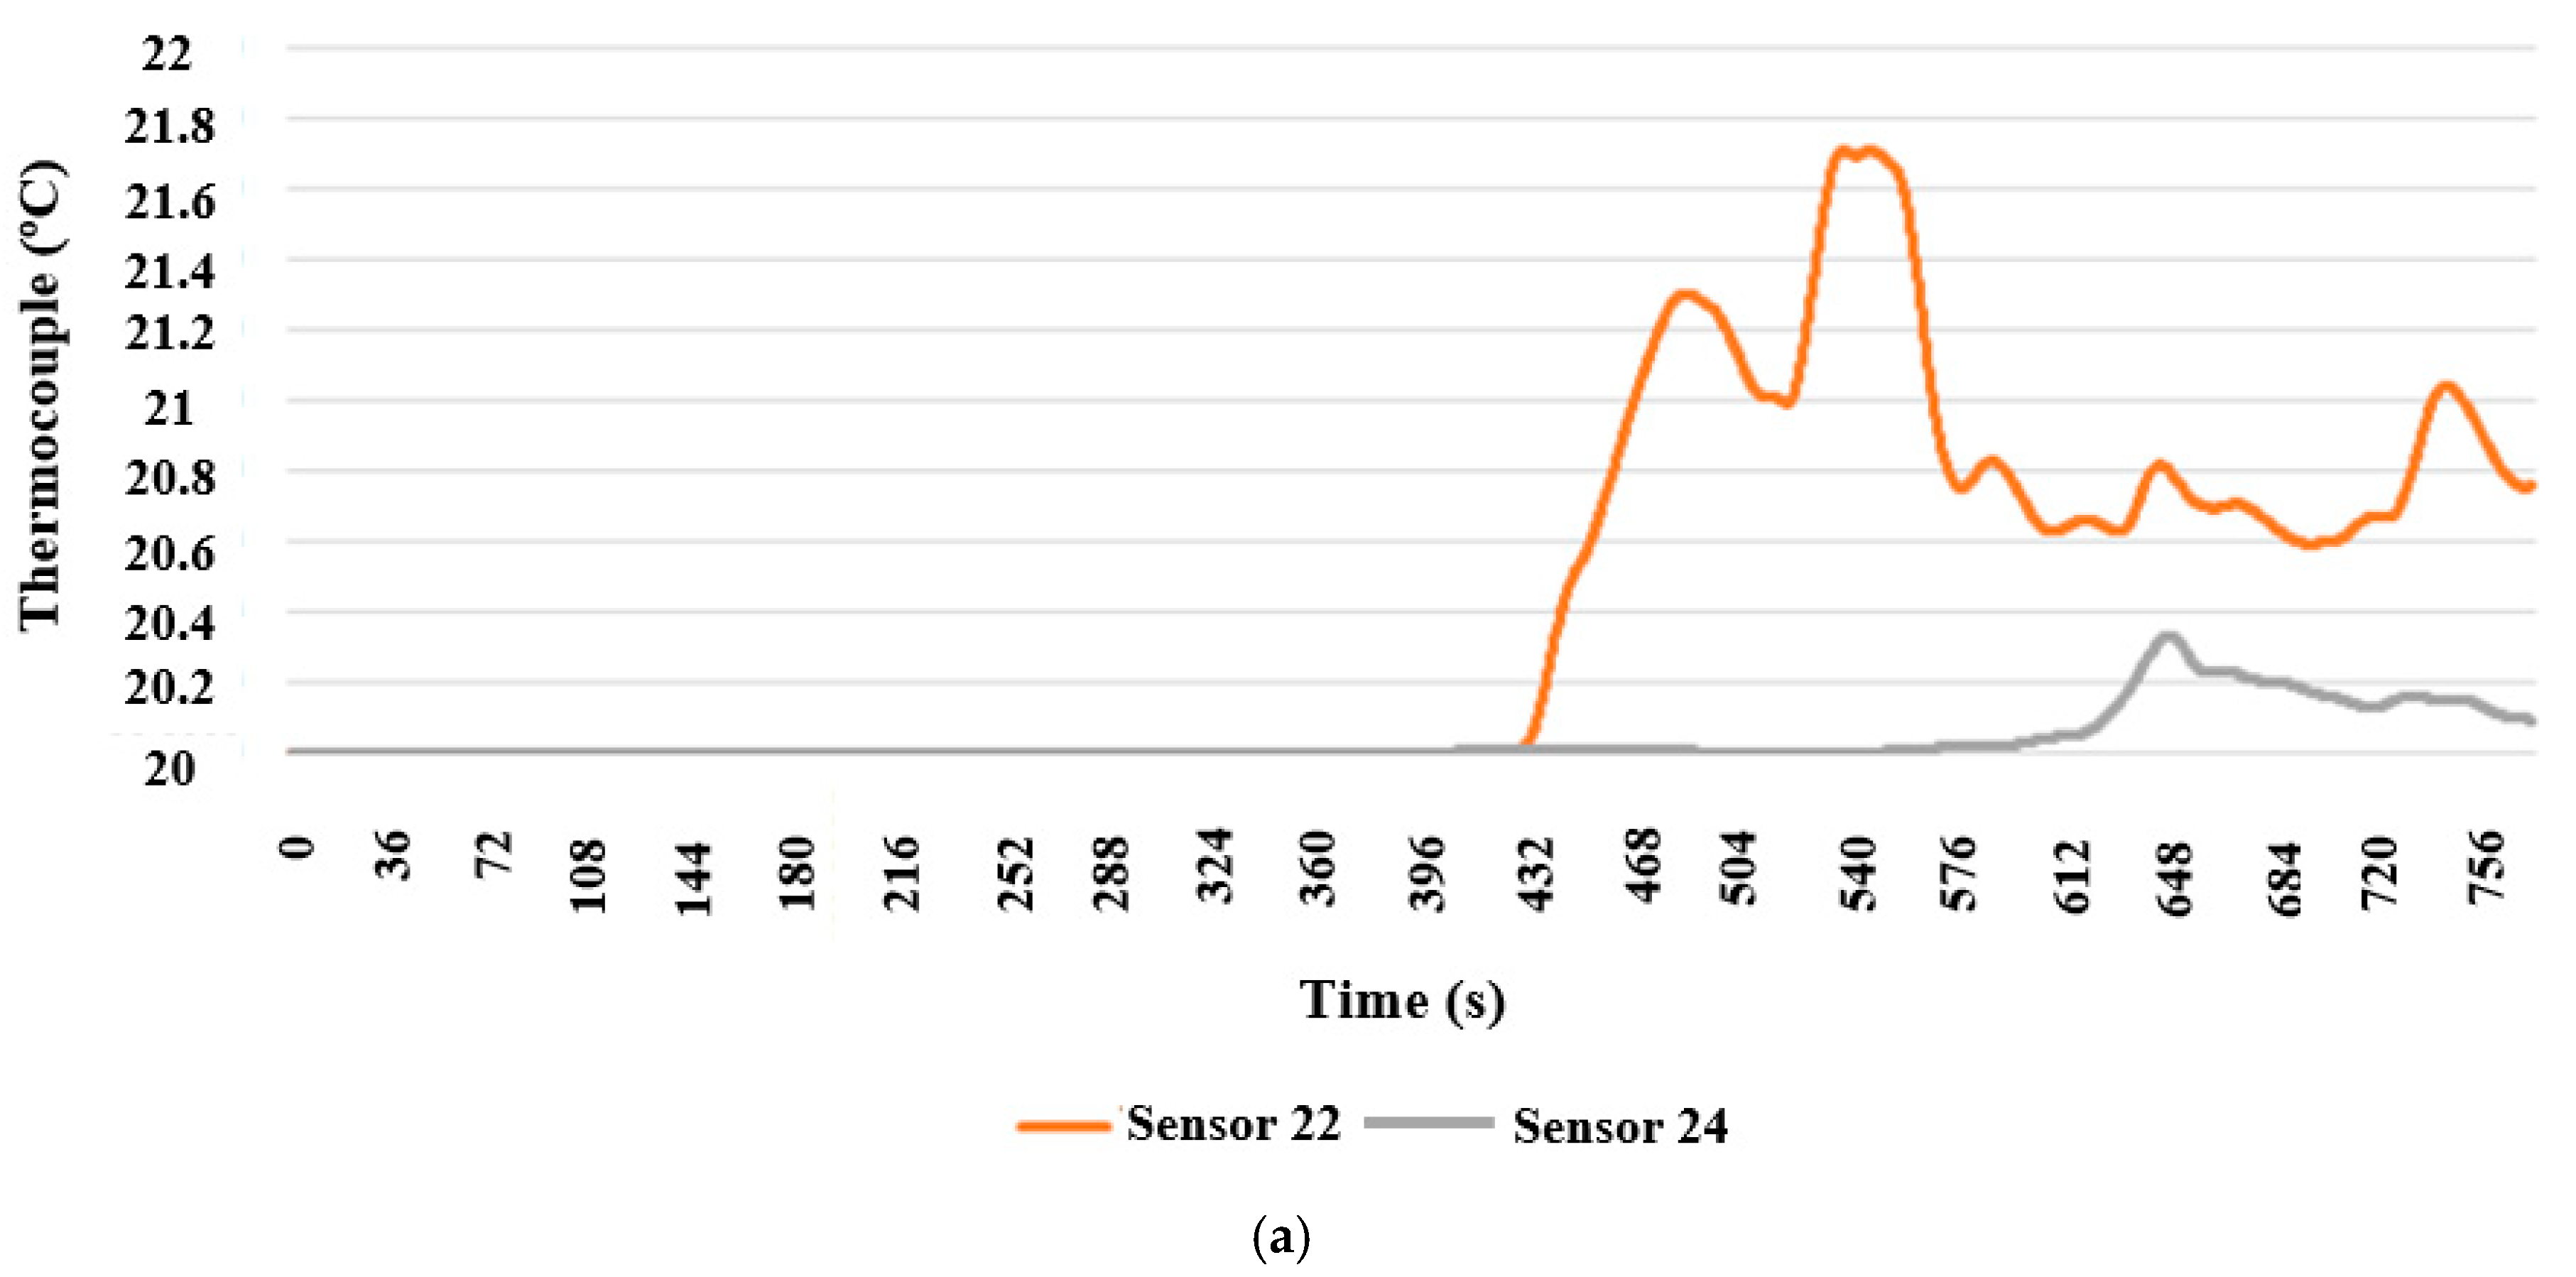
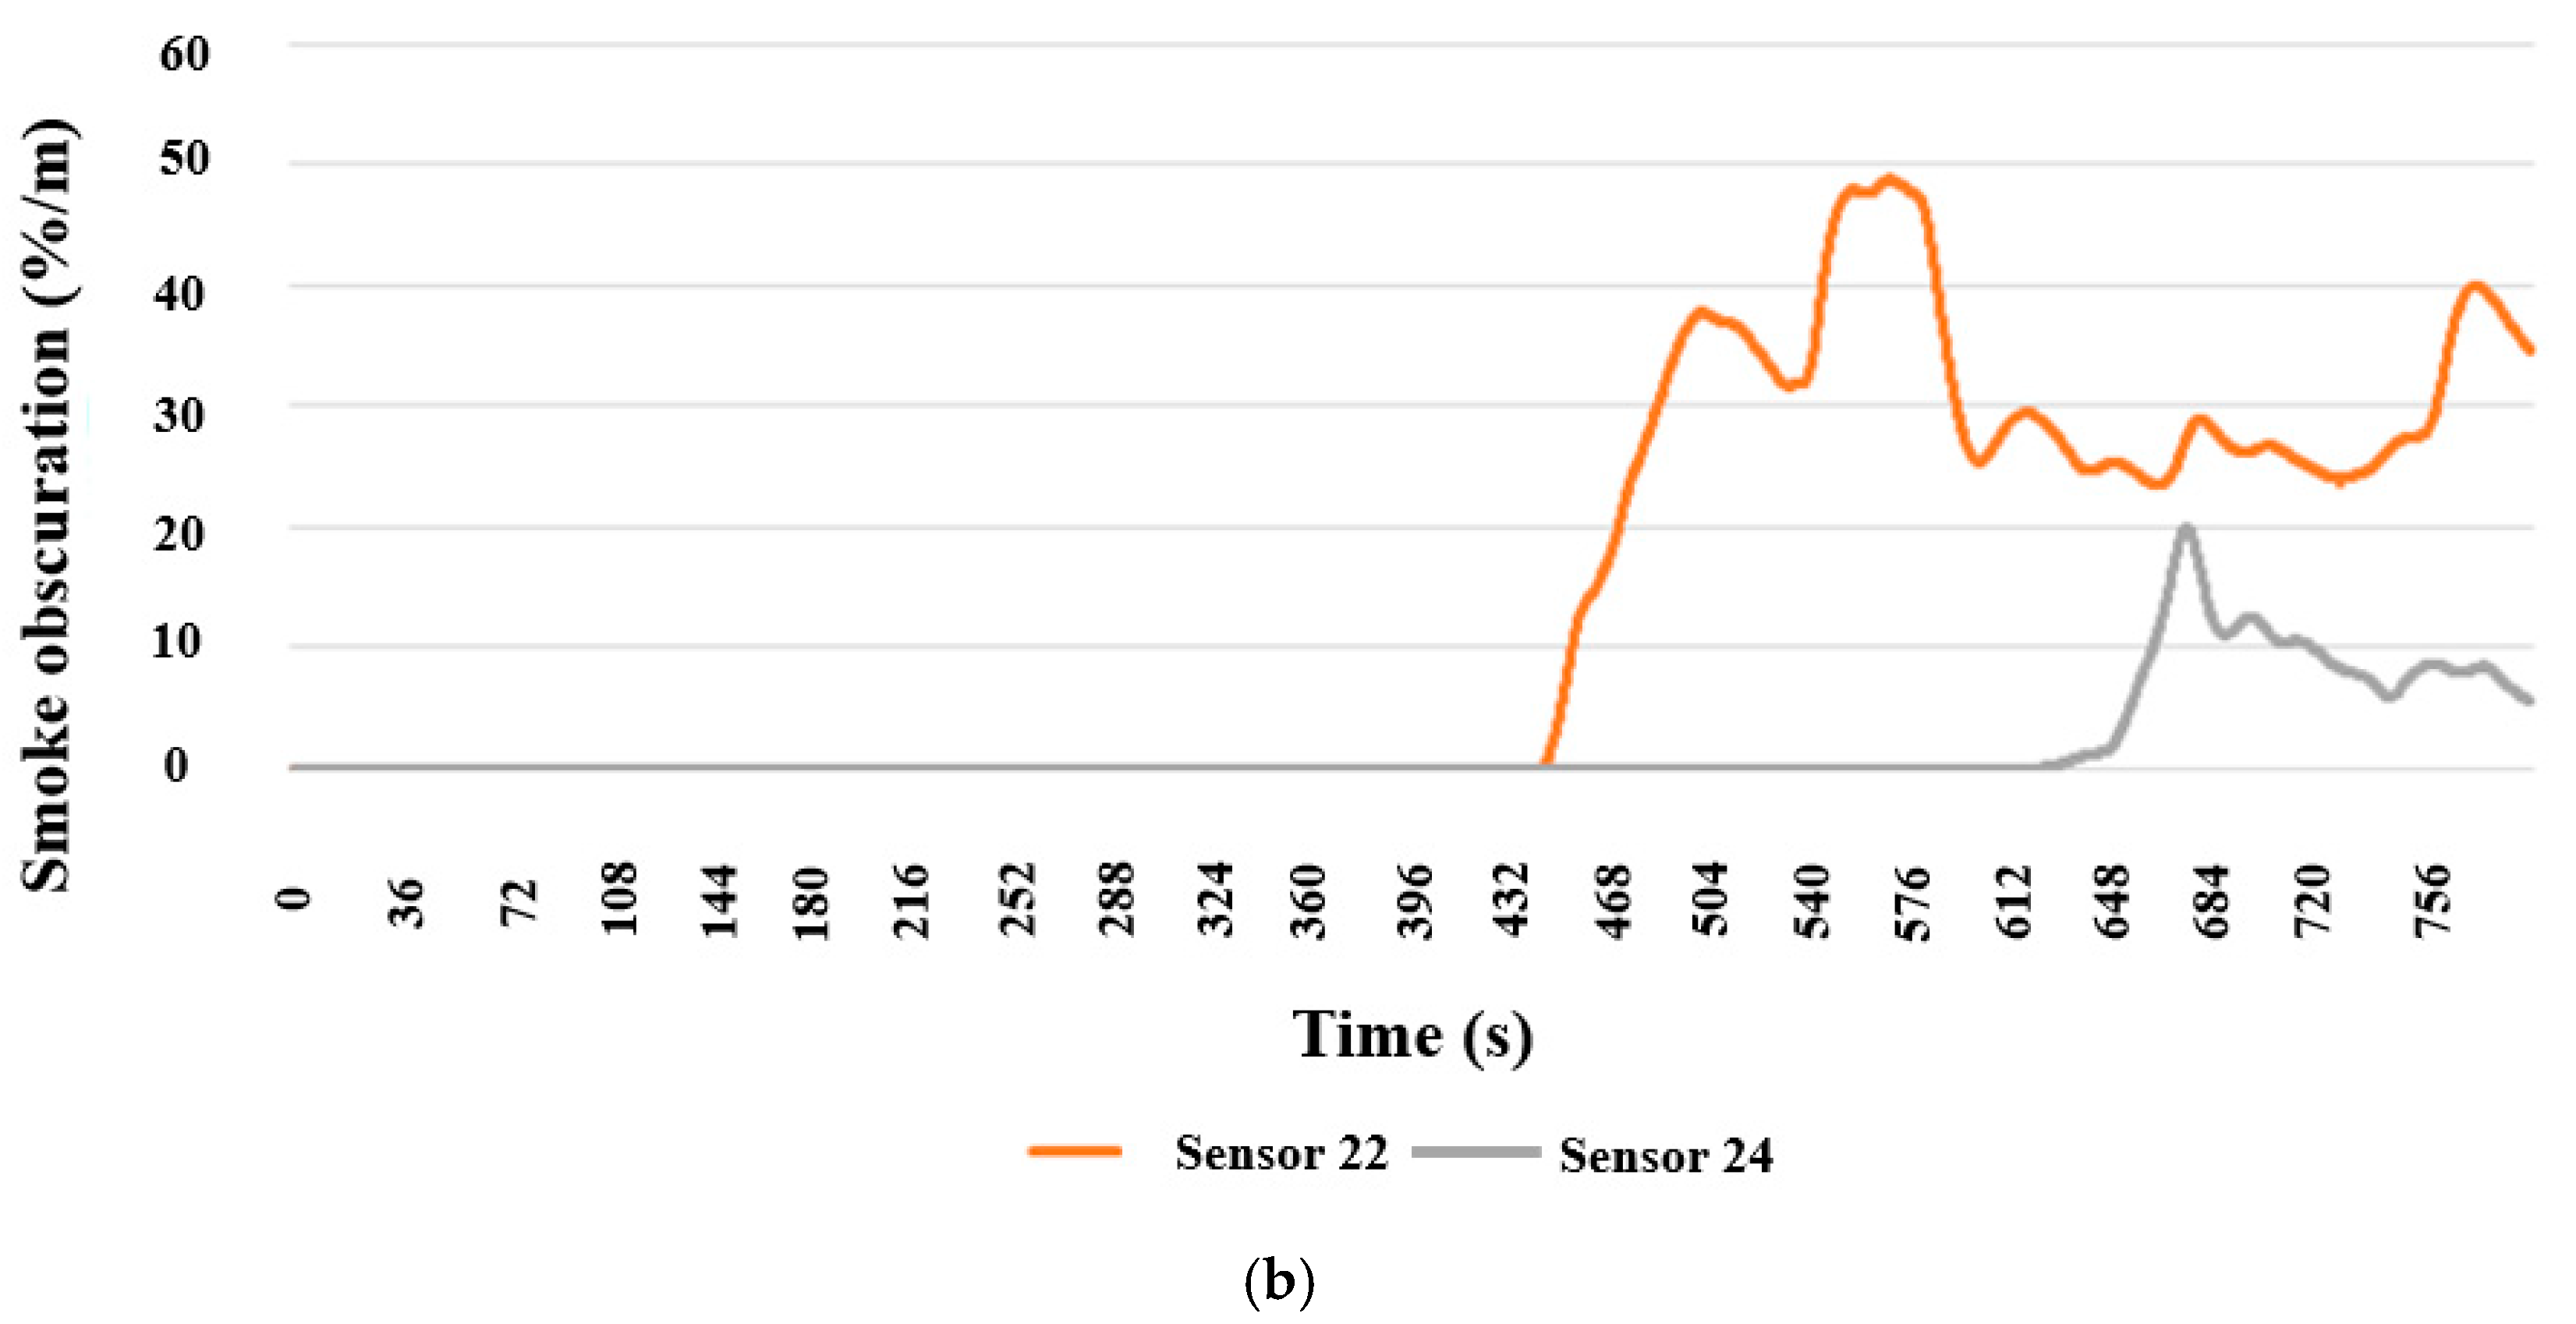
Sensors 22 and 24 at the two exits near Stair 1, shown in
Figure 14, indicate that the temperature and smoke concentration start to increase at approximately 414 s, and the exit can be evacuated for a long time, as shown in
Figure 14 and
Figure 15, respectively. The change in temperature and smoke concentration at Sensor 24 was lower than those at Sensor 22.
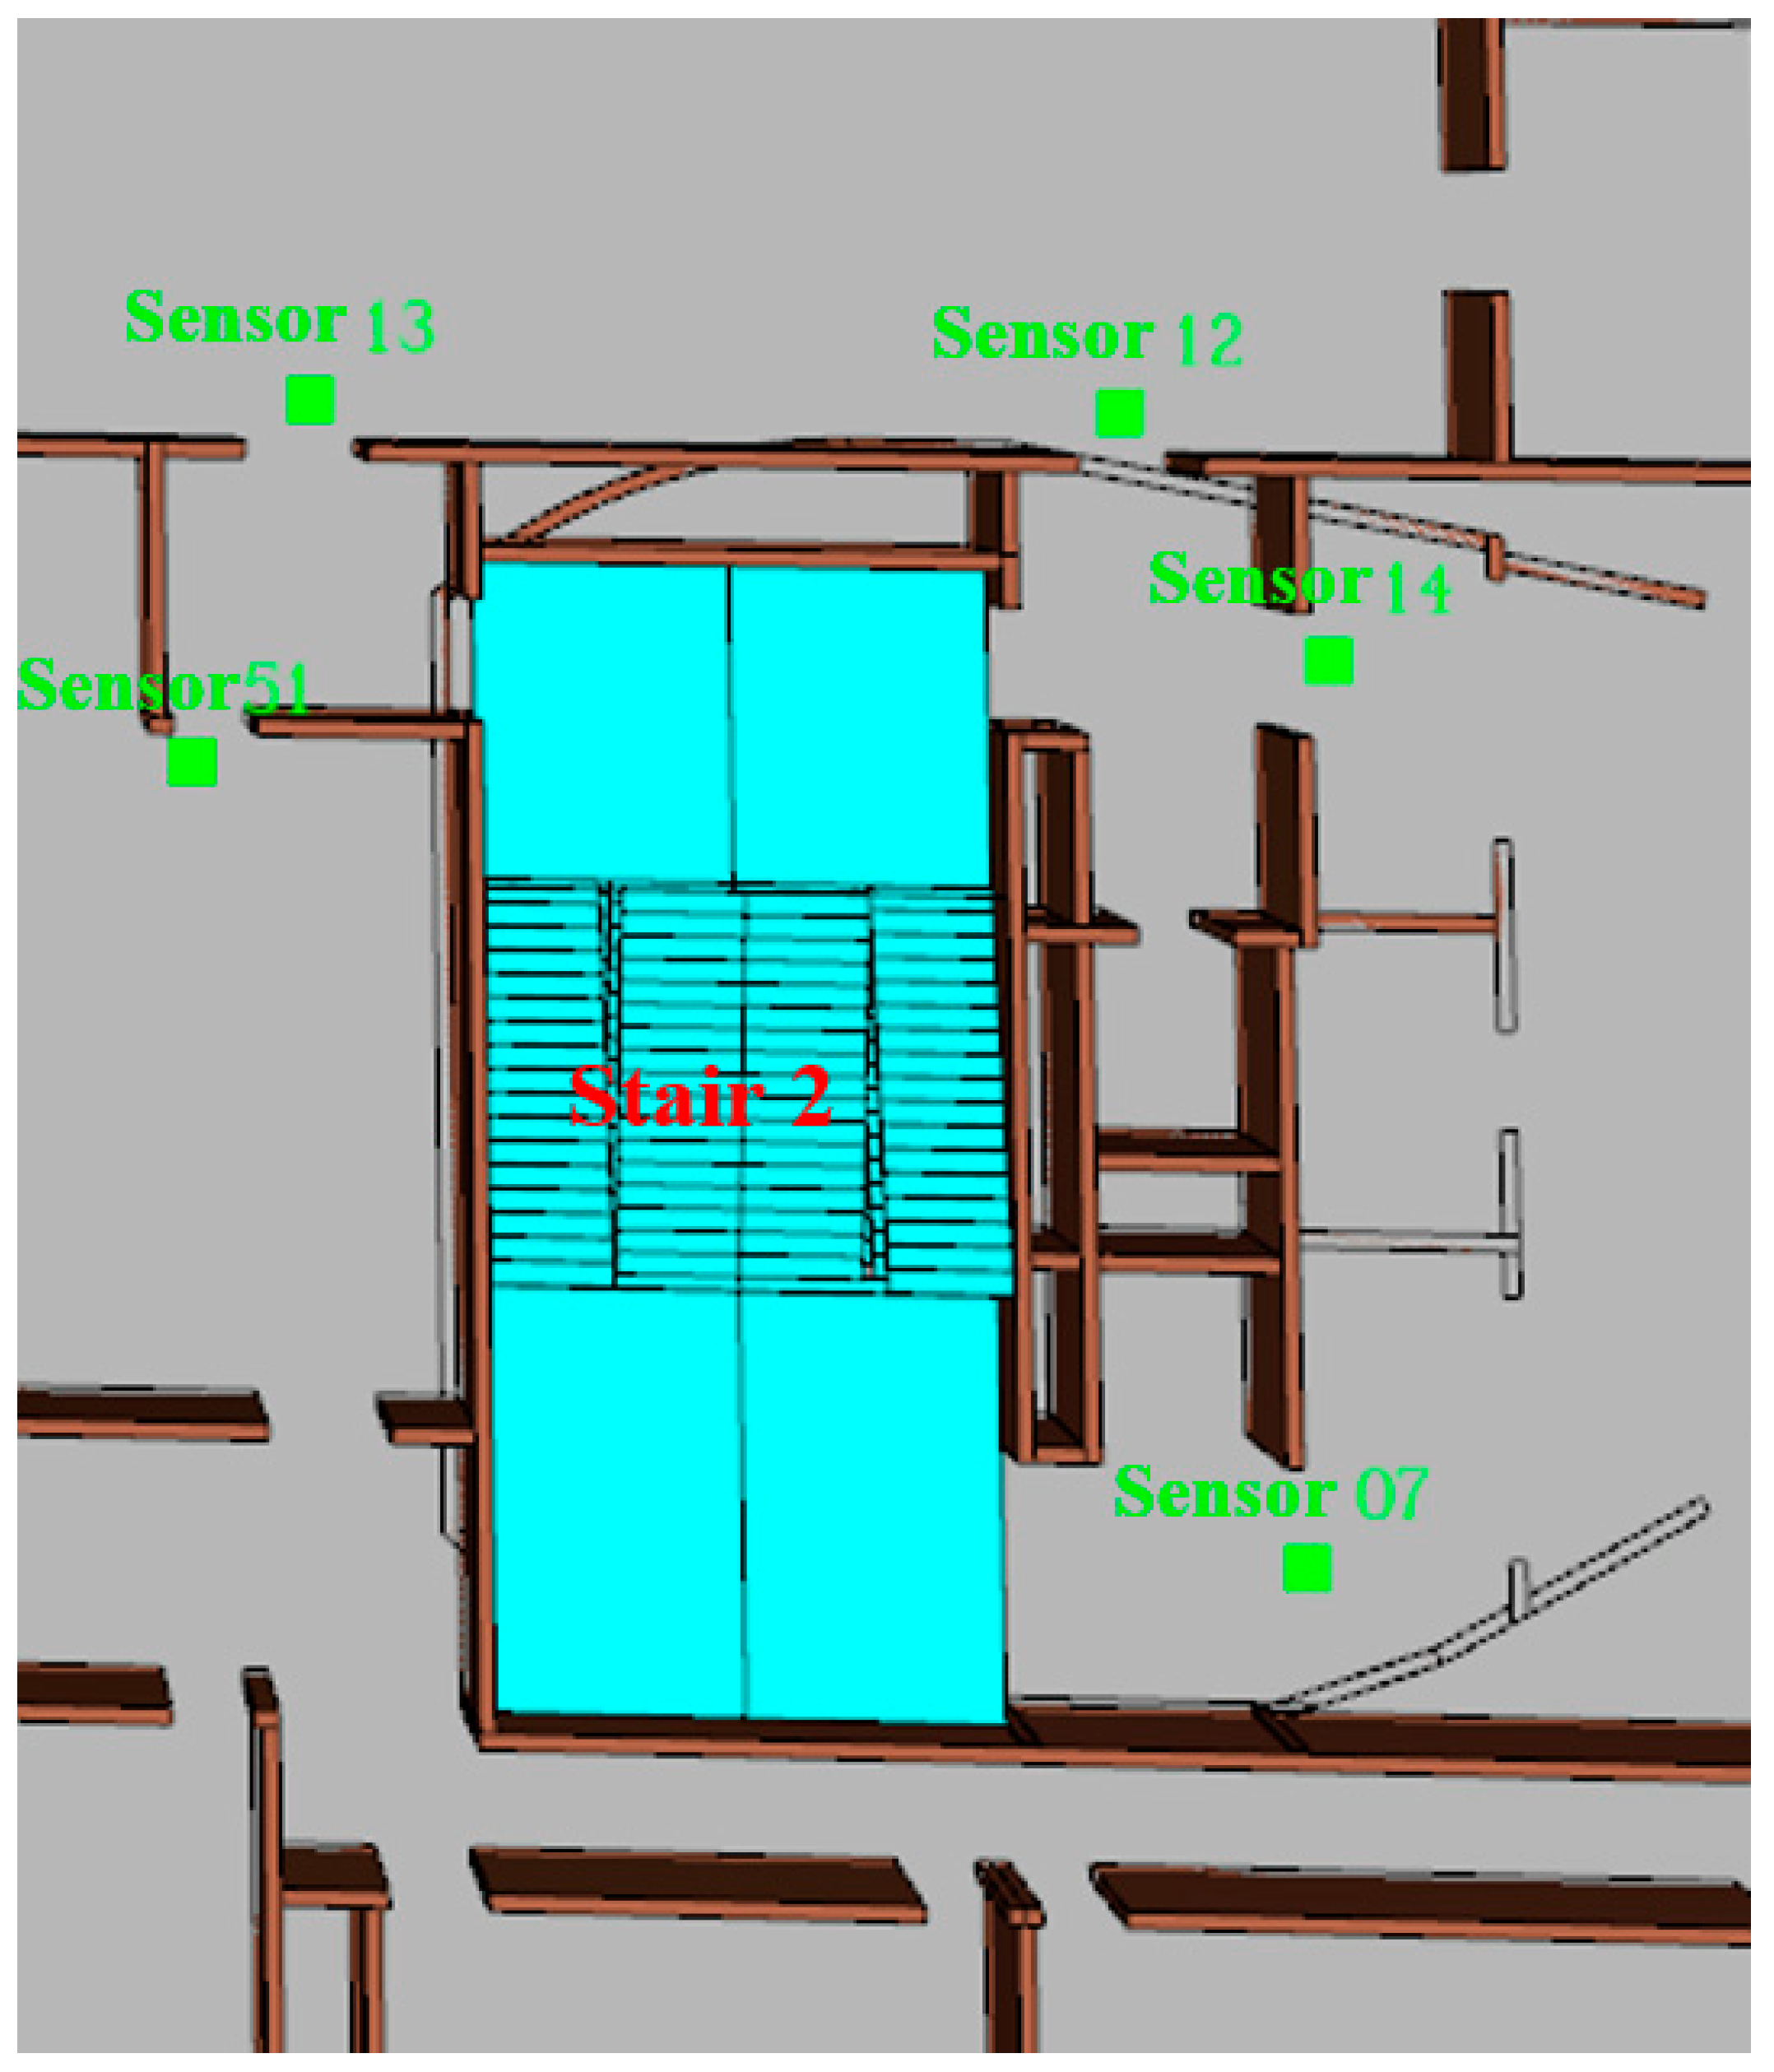
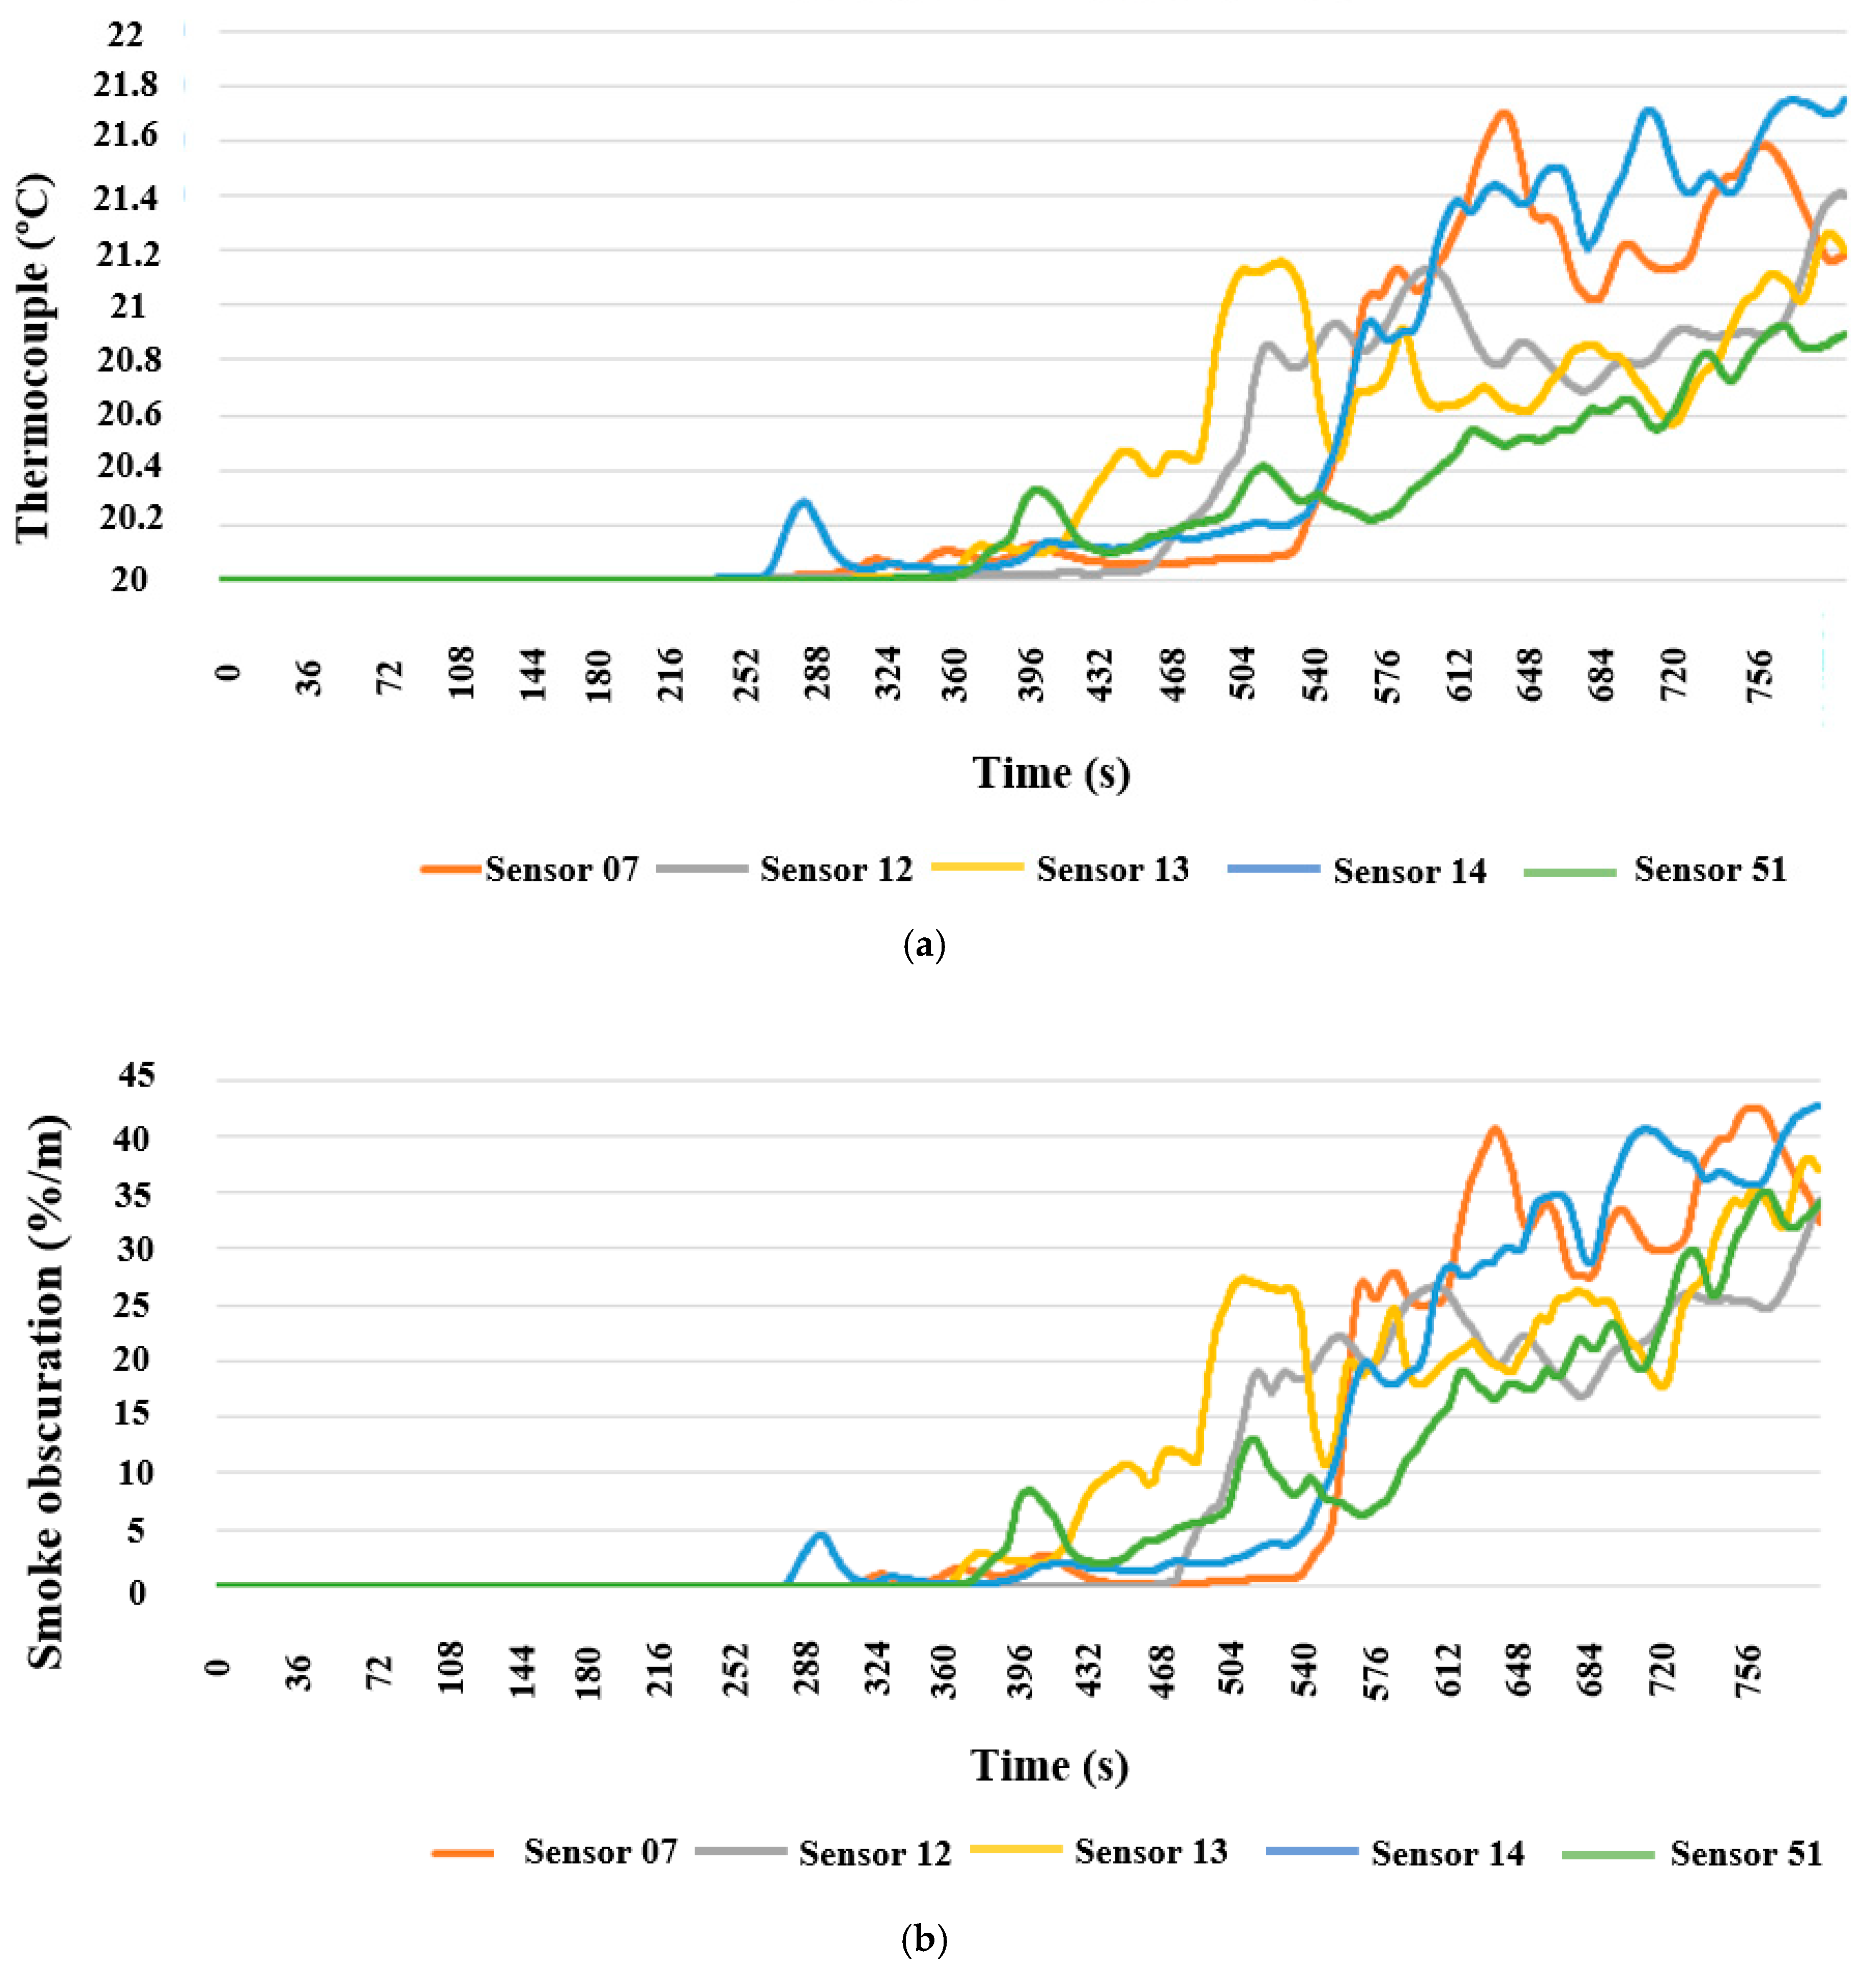
Sensors 7, 12, 13, 14, and 51 at the exit near Stair 2 show that the temperature and smoke concentration started to rise at approximately 234 s, as shown in
Figure 16 and
Figure 17. Sensor 14 first showed a significant increase in temperature and smoke concentration, and its subsequent growth trend was relatively large. Sensor 51 shows a smaller increasing trend compared with that of the other sensors; therefore, people should try to avoid entering Stair 2 from the door corresponding to Sensor 14.
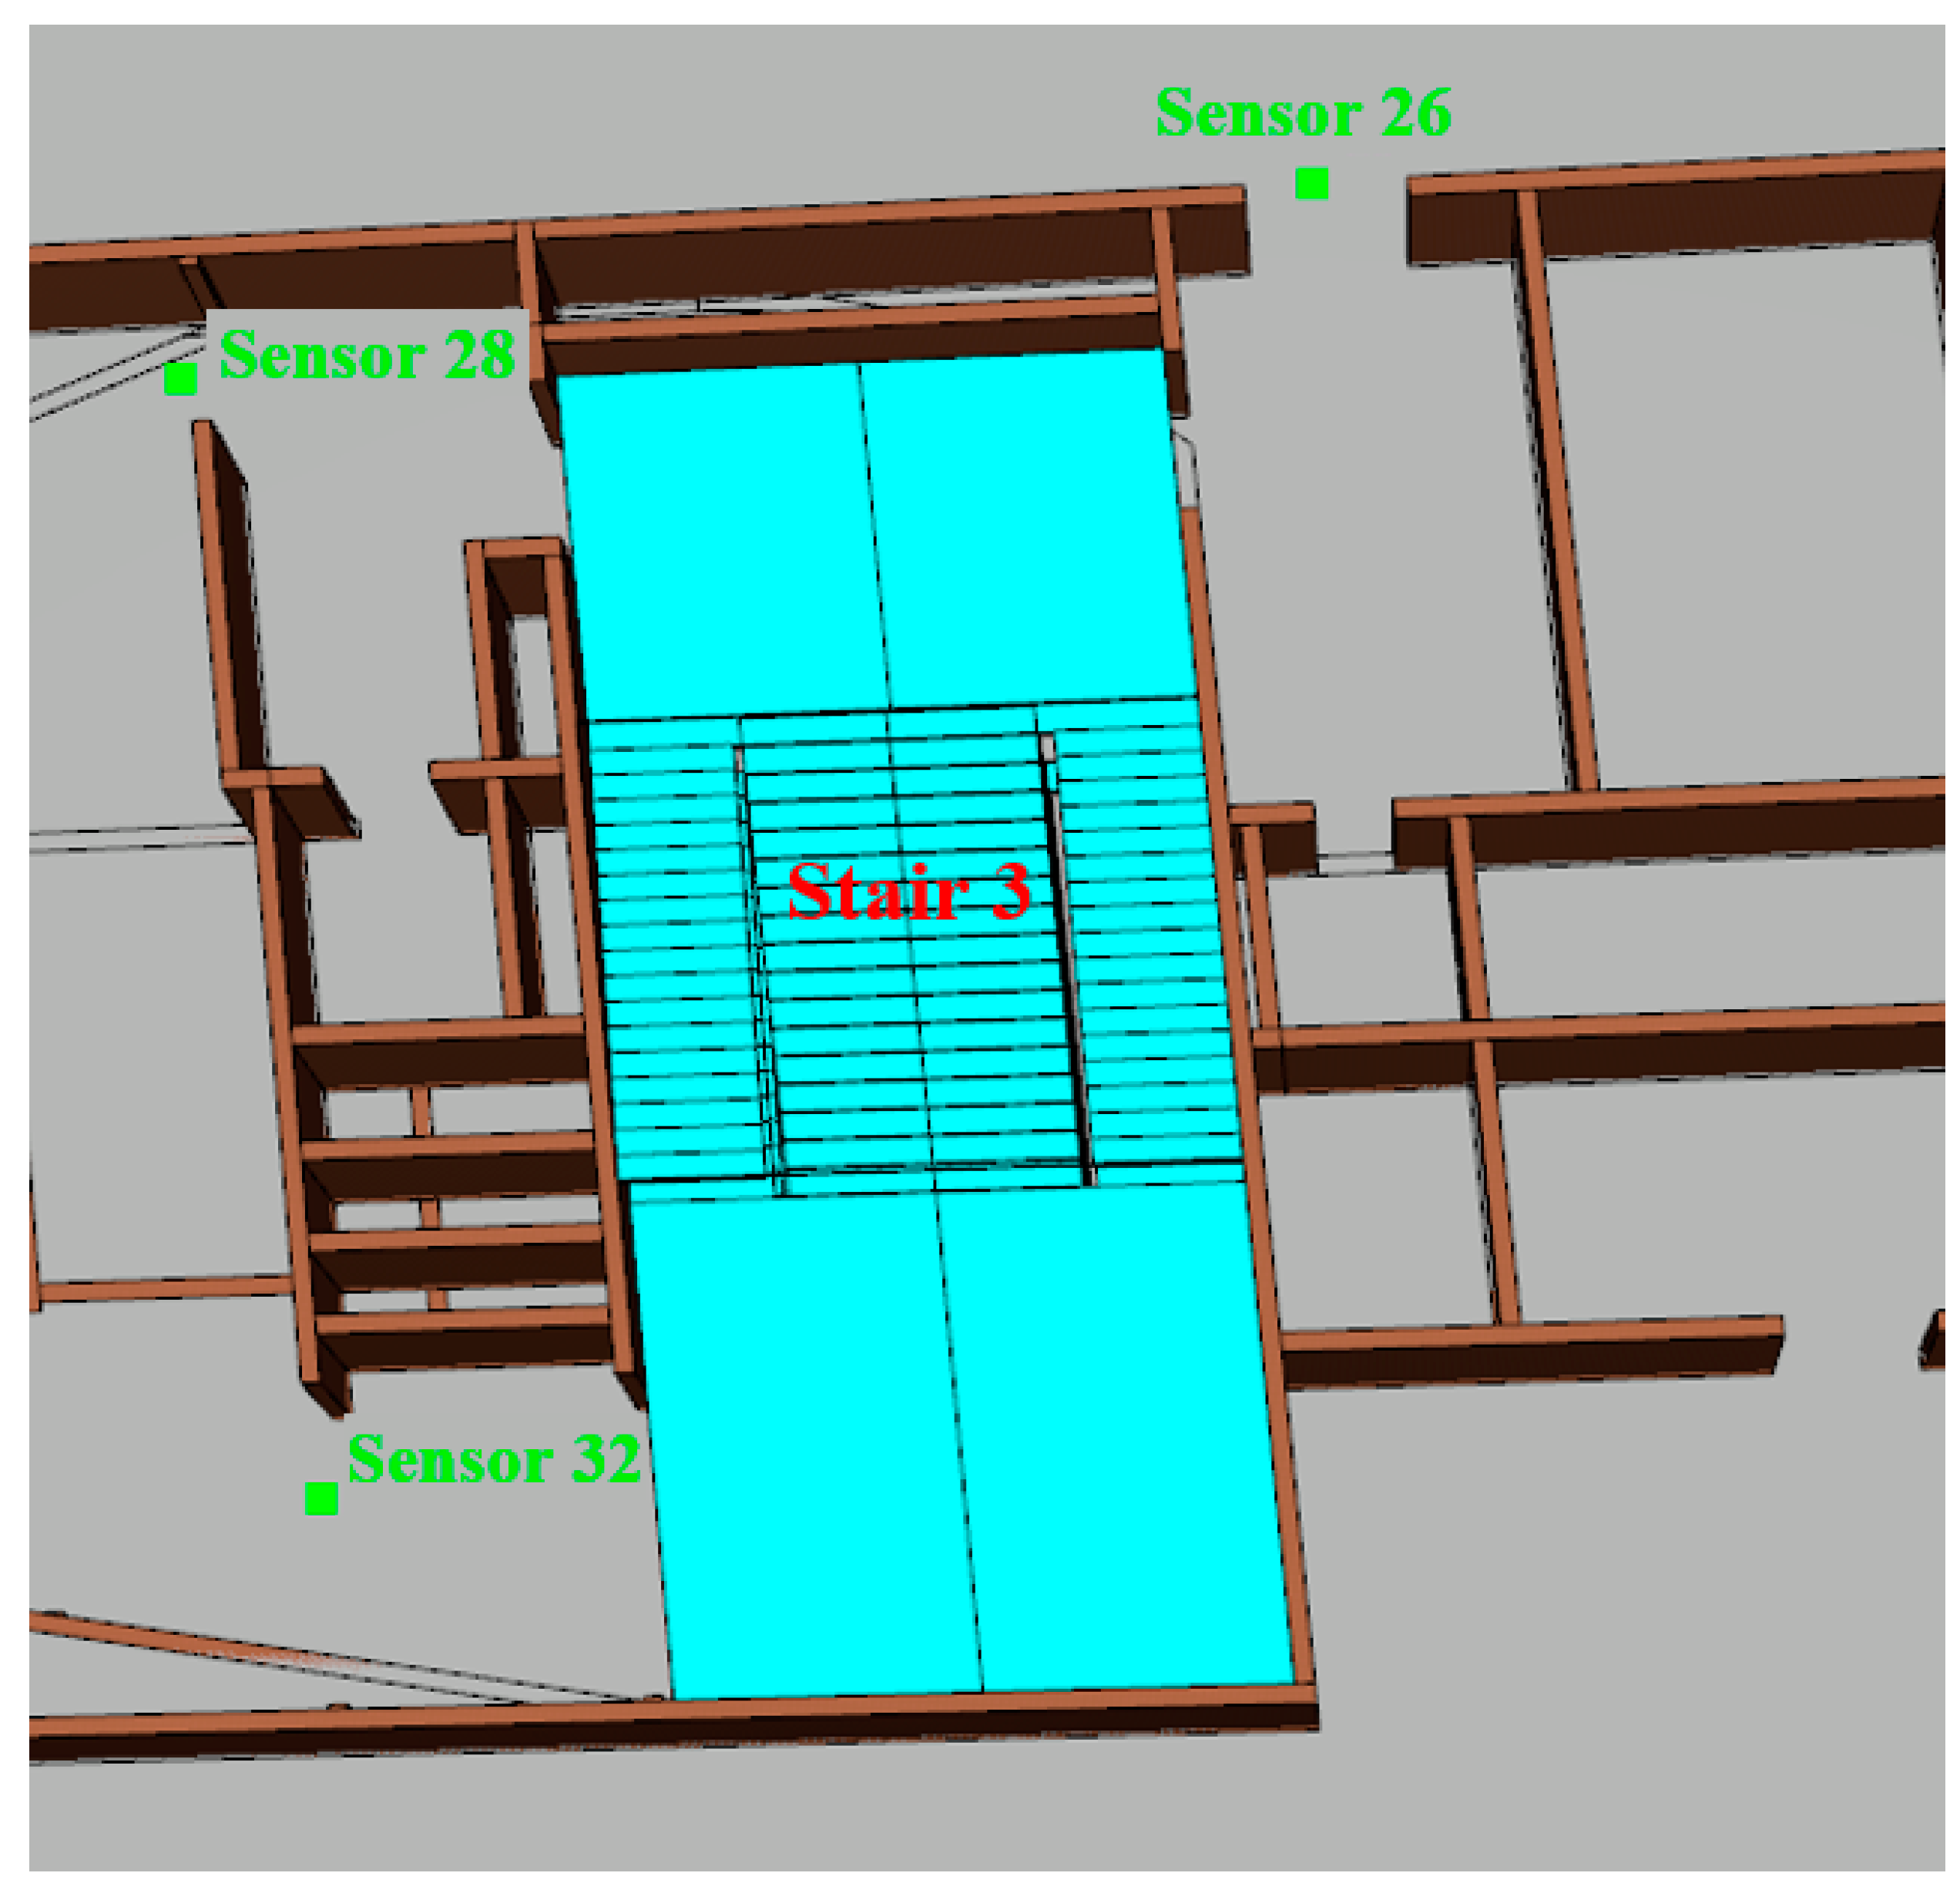
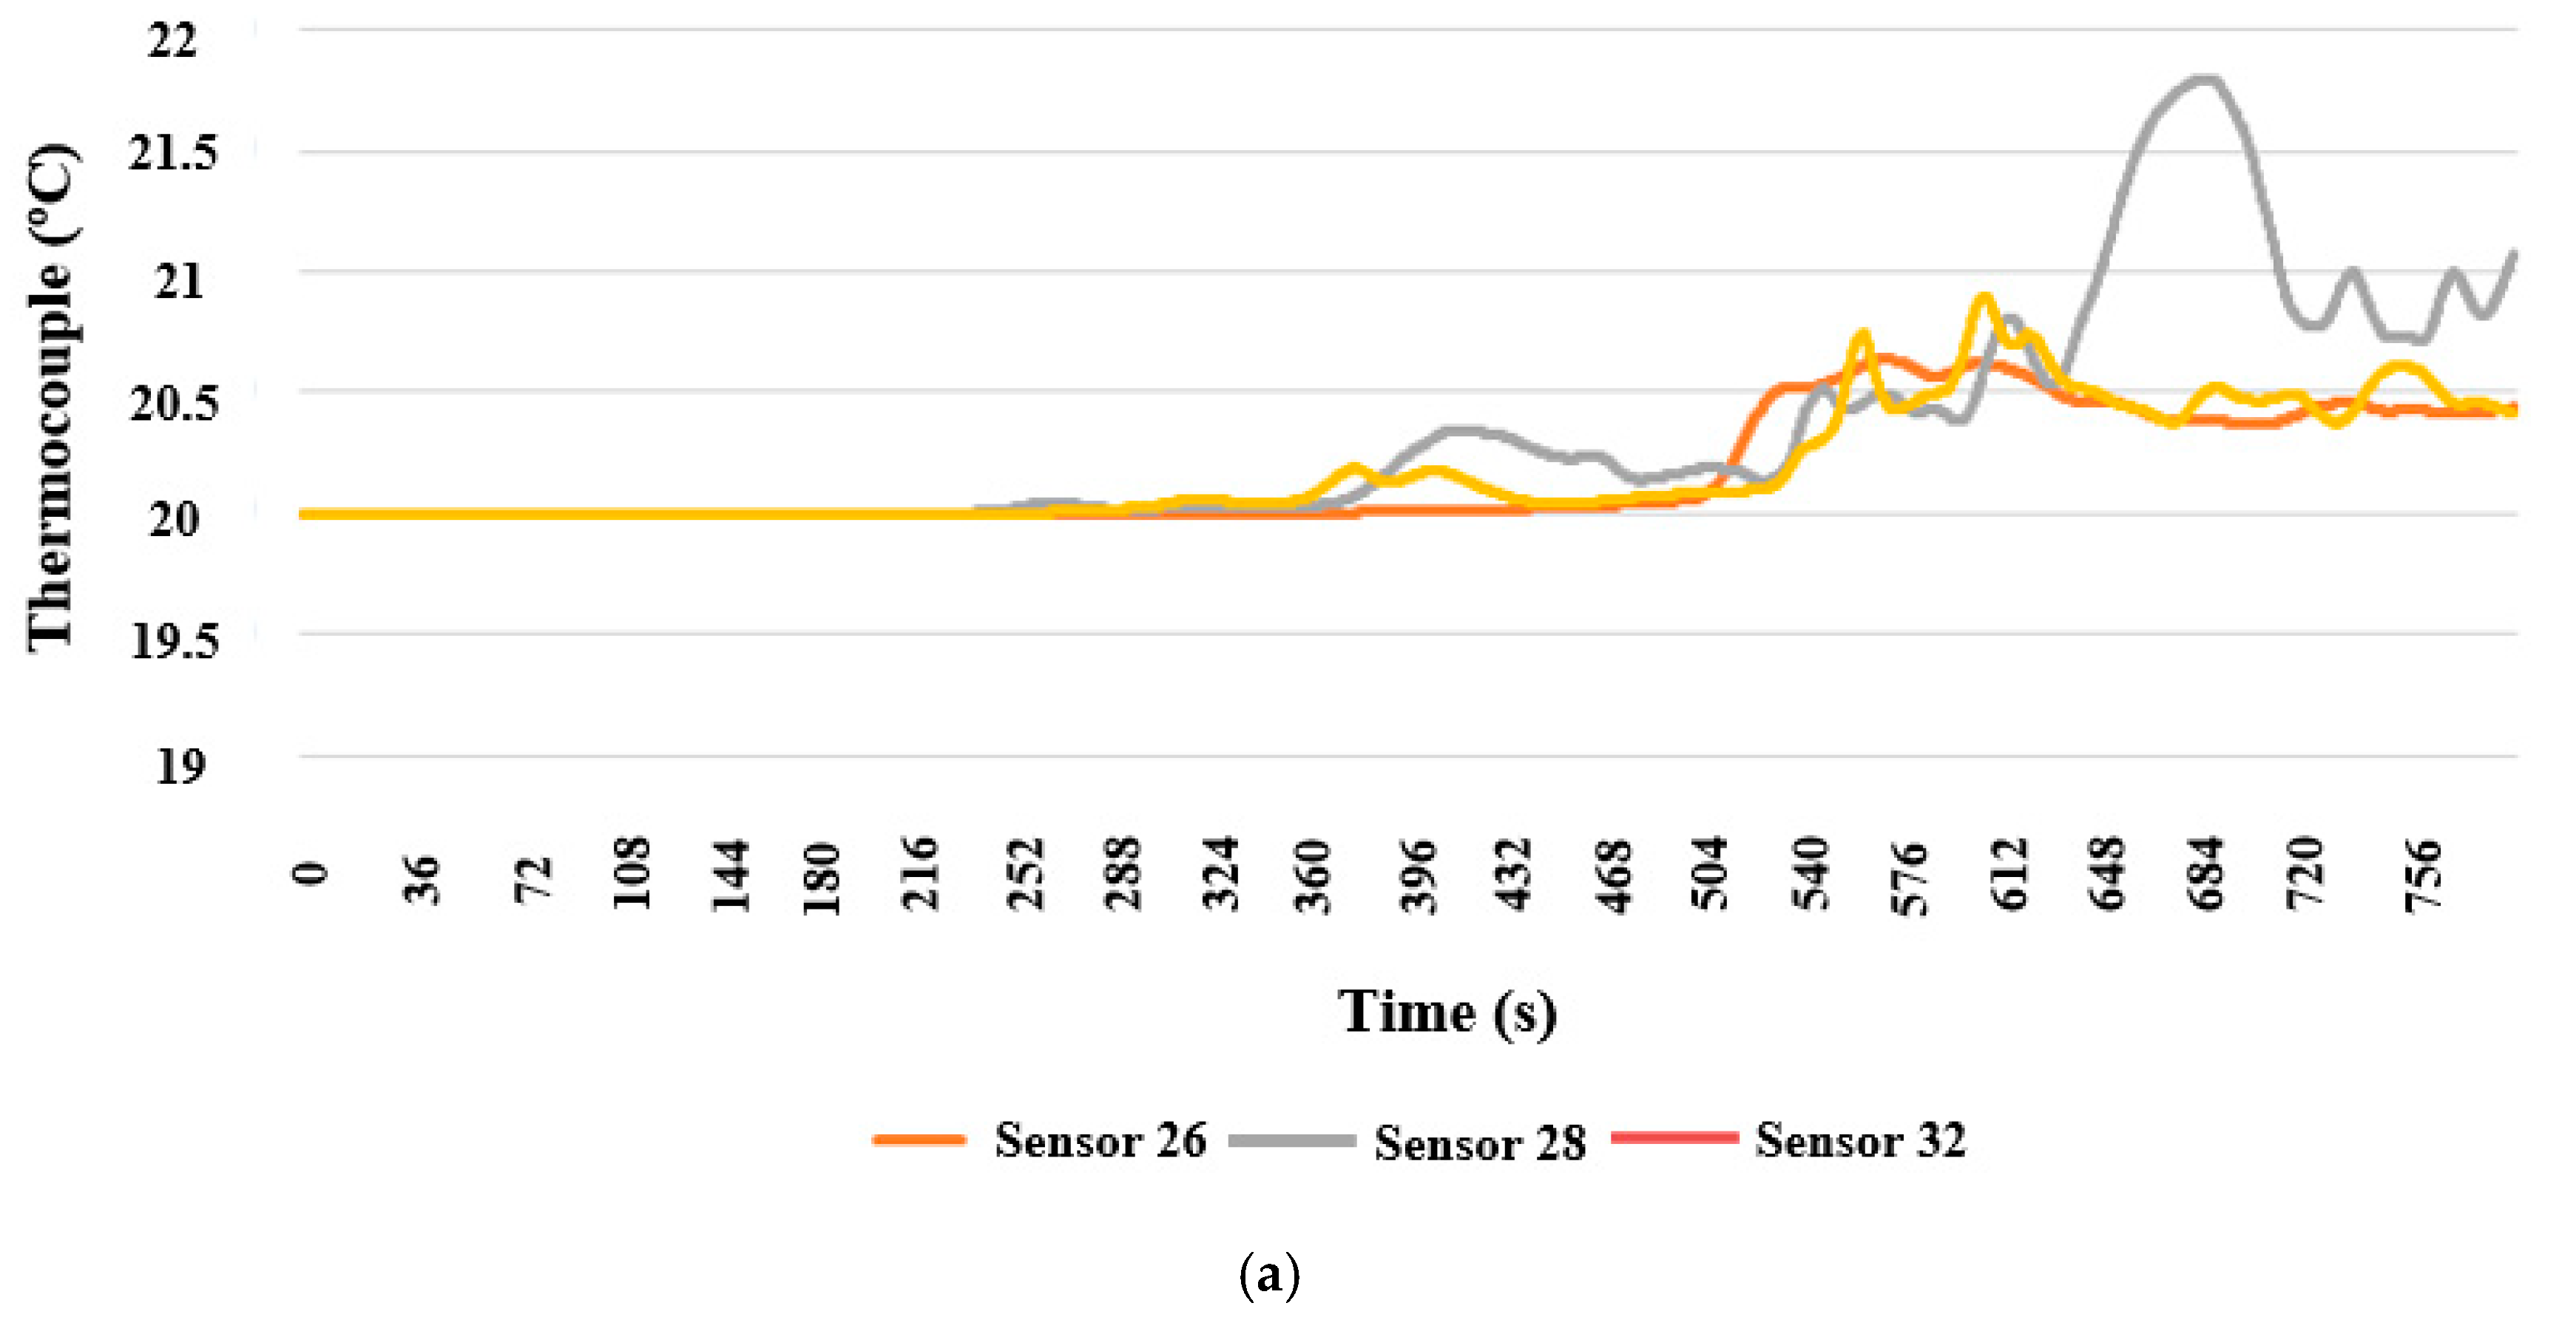
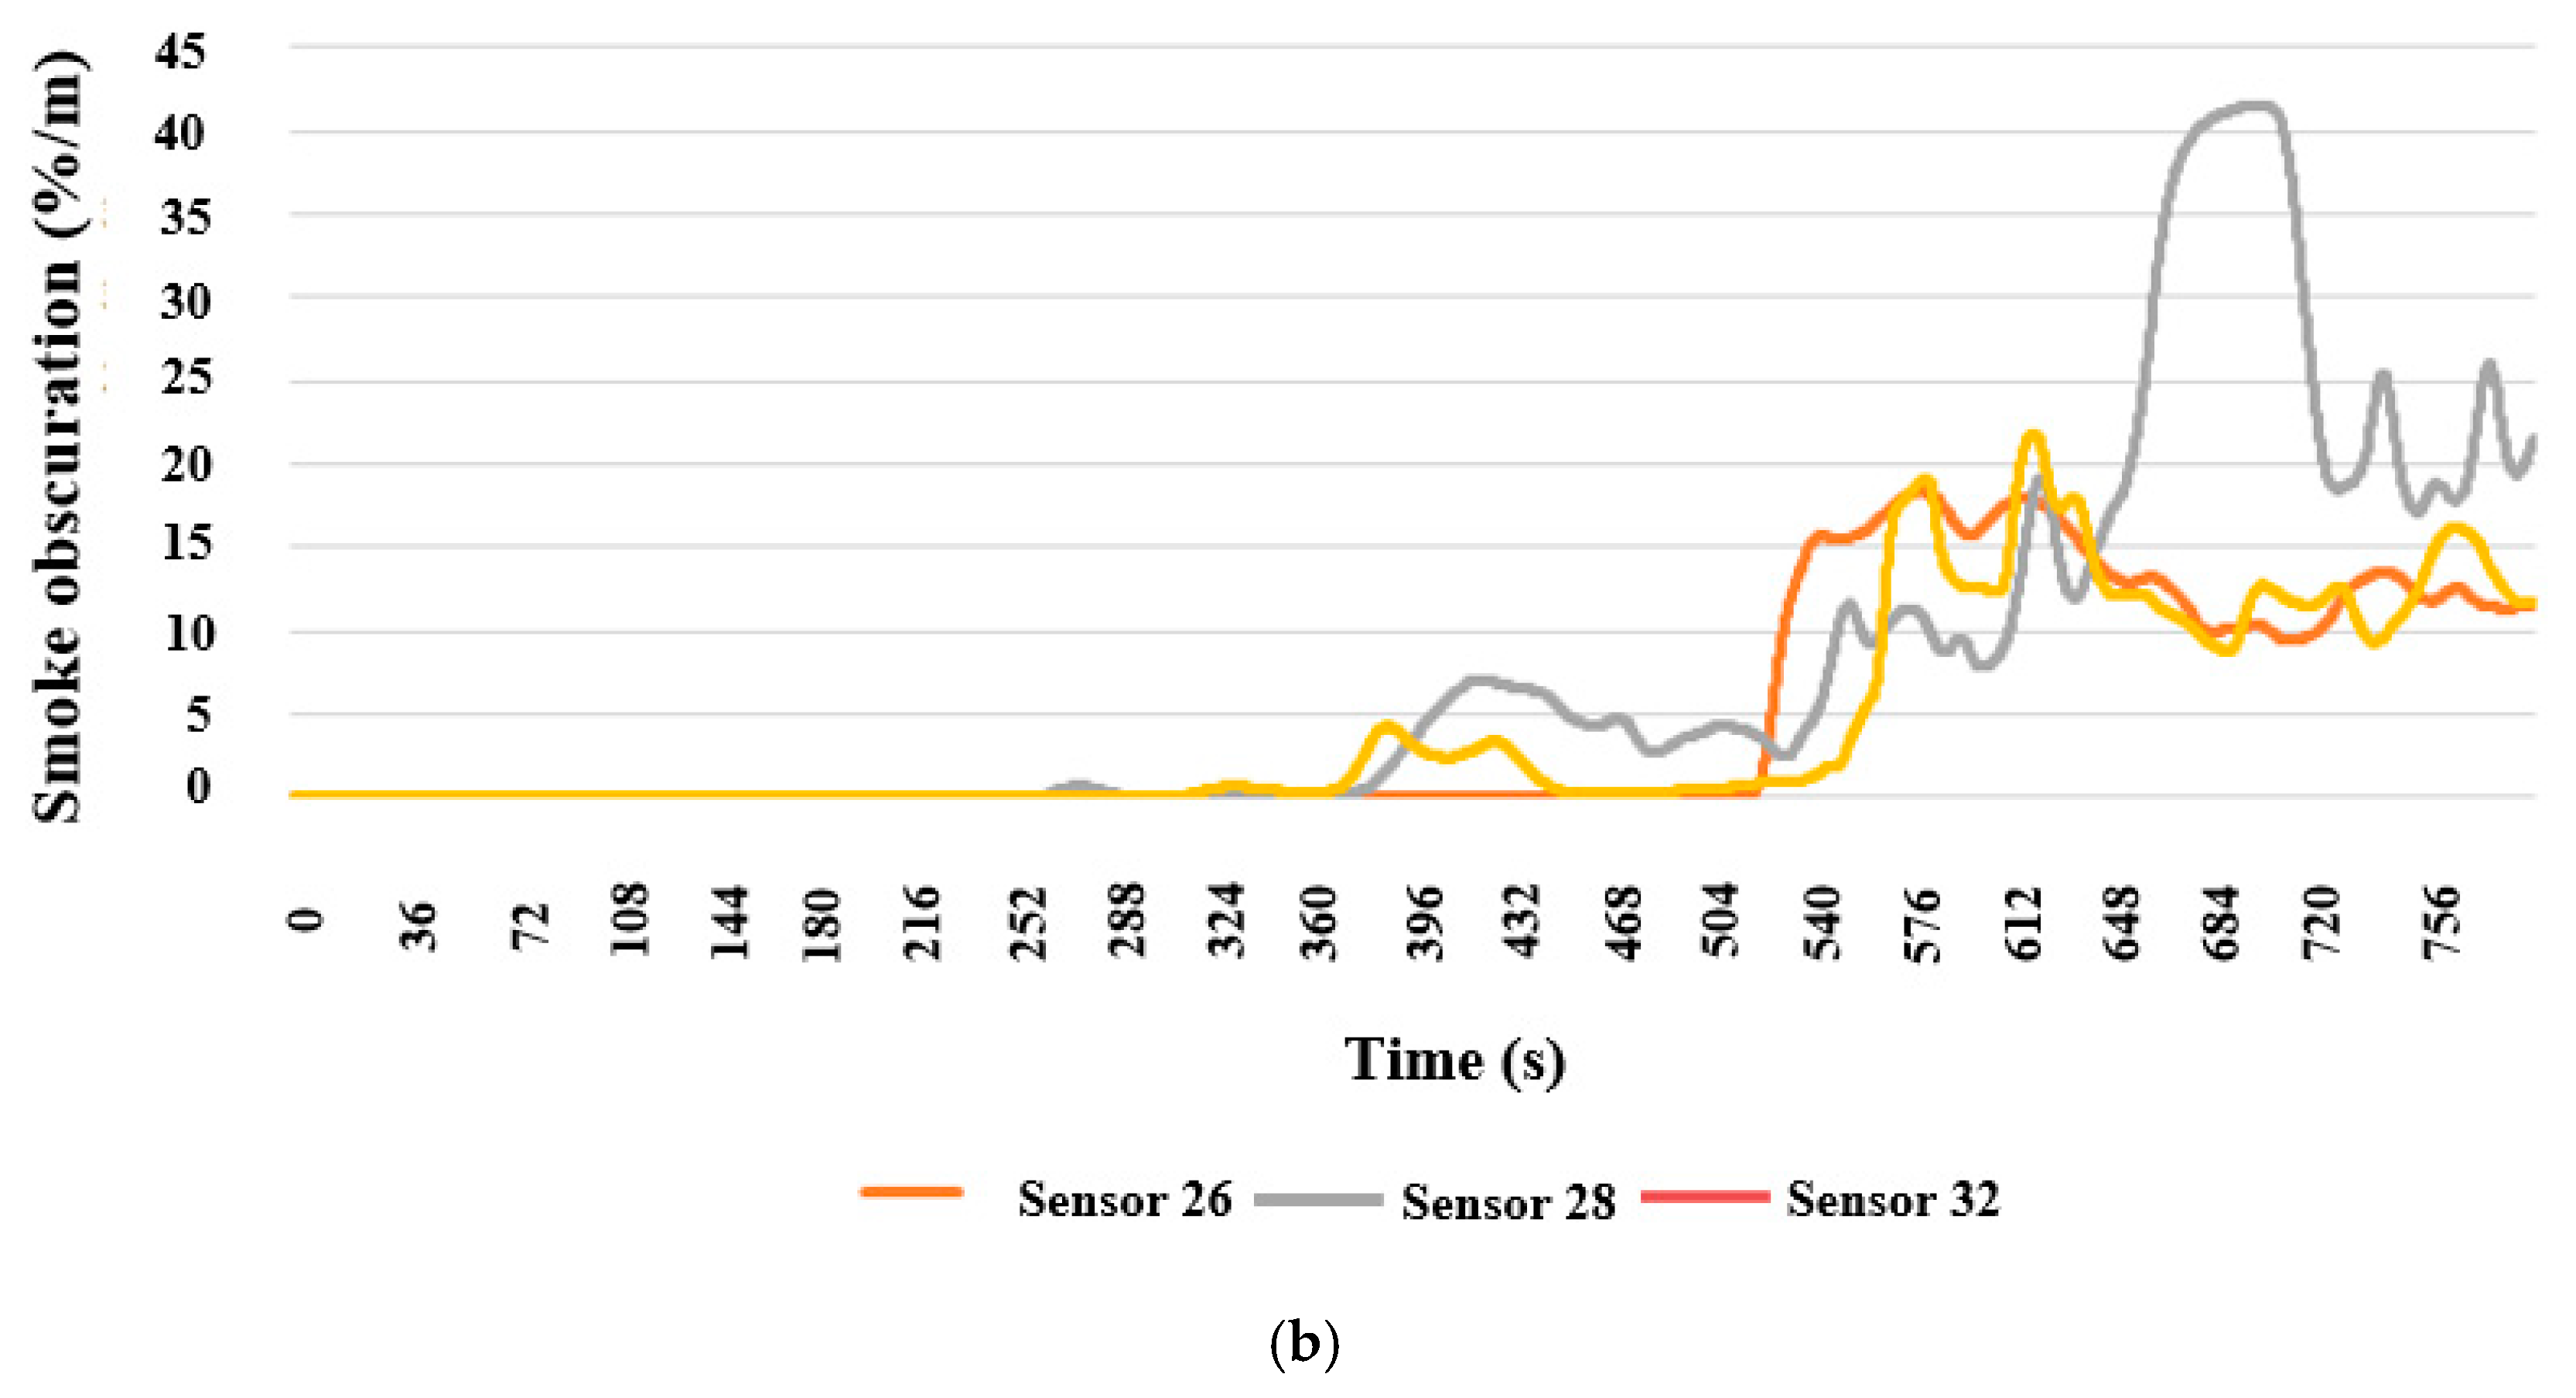
As shown in
Figure 18 and
Figure 19, Sensors 26, 28, and 32 at the exit near Stair 3 show that the temperature and smoke concentration increased significantly after 504 s; therefore, the exit was available for long-term evacuation. Sensor 28 had the highest temperature and smoke concentration; therefore, people should avoid entering Stair 3 through the door corresponding to Sensor 28. The temperature and smoke concentration of Sensors 26 and 32 had a small growth range. Therefore, the two exits near Sensors 26 and 32 should be chosen as the priority for evacuation.
2.5. Comparative Study on Fire in Different Spaces
Different spatial distributions have different effects on fire diffusion. Owing to the various functional areas and spatial structural forms of the Starting Area, the following three groups of controlled experiments were conducted:
First group: The underground layers were the same and space was relatively private. The commercial, catering, and equipment areas in Zones III, IV, and V in the first underground layer of the Huacheng Avenue were selected as the locations for the fire source, as shown in
Figure 20 and
Figure 21.
From the analysis of the fire diffusion trends, it was found that commercial, catering, and equipment areas with complex spatial structures have the characteristics of many walls, a relatively closed environment, and a large fire load. Once a fire occurs, black smoke produced by inadequate combustion first rises to the ceiling and then accumulates in the room. Then, the smoke drops to a certain height and spreads to the corridor or other rooms through the door; thus, the diffusion rate of the smoke as a whole is relatively slow; however, the indoor temperature rises rapidly because the smoke and heat generated by the fire cannot be discharged in time. Thus, under the action of high temperature, “flashover” phenomenon is caused; that is, other combustible substances in the spreading path of smoke are ignited.
Second group: The underground layers are different; however, all are large public spaces.
Figure 22 shows the fire simulation result of the bus station in the underground mezzanine and subway station in the first underground layer in Zone IV. Owing to the simple functional zoning and relatively little space separation in open public underground spaces, such as buses and subway stations, smoke and fire can quickly spread when a fire breaks out. Although the coverage was high, the smoke layer decreased slowly.
Third group: It comprised long, thin, deep, and narrow underground spaces.
Figure 23 presents the fire simulation results for the loops of the second underground layer in Zones IV and V. It was observed that when the fire occurs, the smoke preferentially diffuses in the horizontal plane, and then spreads slowly upward after meeting the roof opening, i.e., the “chimney” effect. The air outlet set on the ground surface is the main method for smoke to be discharged from the interior of a building, which is crucial for safe evacuation in later stages.
4. Conclusions
In this study, a fire simulation model was established based on the PyroSim, and temperature and smoke concentration data were output by setting sensors in the model, which provided a basis for subsequent access to real-time environmental data in an evacuation simulation platform. Then, the Smokeview module was used to output the smoke diffusion visualization animation. The ultimate safety evacuation time of each exit was analyzed, which provided a reference for the evacuation time obtained in the evacuation simulation. Finally, a personnel evacuation simulation model based on simple logic was established by Pathfinder, which provided basic data for subsequent evacuation path optimization and optimization ideas for fire safety management. The conclusions obtained from the simulation are as follows:
(1) When all the firefighting facilities fail and fire breaks out in Zone I, the exits on both the left and right sides of the waiting room cannot be used after 440 s, and personnel should choose escape exits in other directions. At 530 s, the exit on the left side of the parking lot was the only remaining exit, but the height of the smoke layer was approaching a height that endangered human health. Therefore, it was determined that the available safe evacuation time for people under this condition was 530 s. The crowd must be evacuated before 530 s when the fire breaks out; otherwise, there will be casualties.
(2) In commercial, catering, equipment rooms, and other types of small spaces, the fire smoke layer drops quickly, and the impact on personnel evacuation is relatively great owing to the large fire load and cramped space; however, the difficulty of overall underground space evacuation is not significant. In bus stations, subway stations, and other large public spaces, the overall speed of fire spread is fast, which requires the use of a fire control system to control the spread of fire; however, the evacuation time is relatively sufficient. A deep tunnel with a lower underground layer is less connected to the external space, and people can only be evacuated to the ground through stairs. Smoke spreads quickly and easily accumulates in space, resulting in a high fire risk.
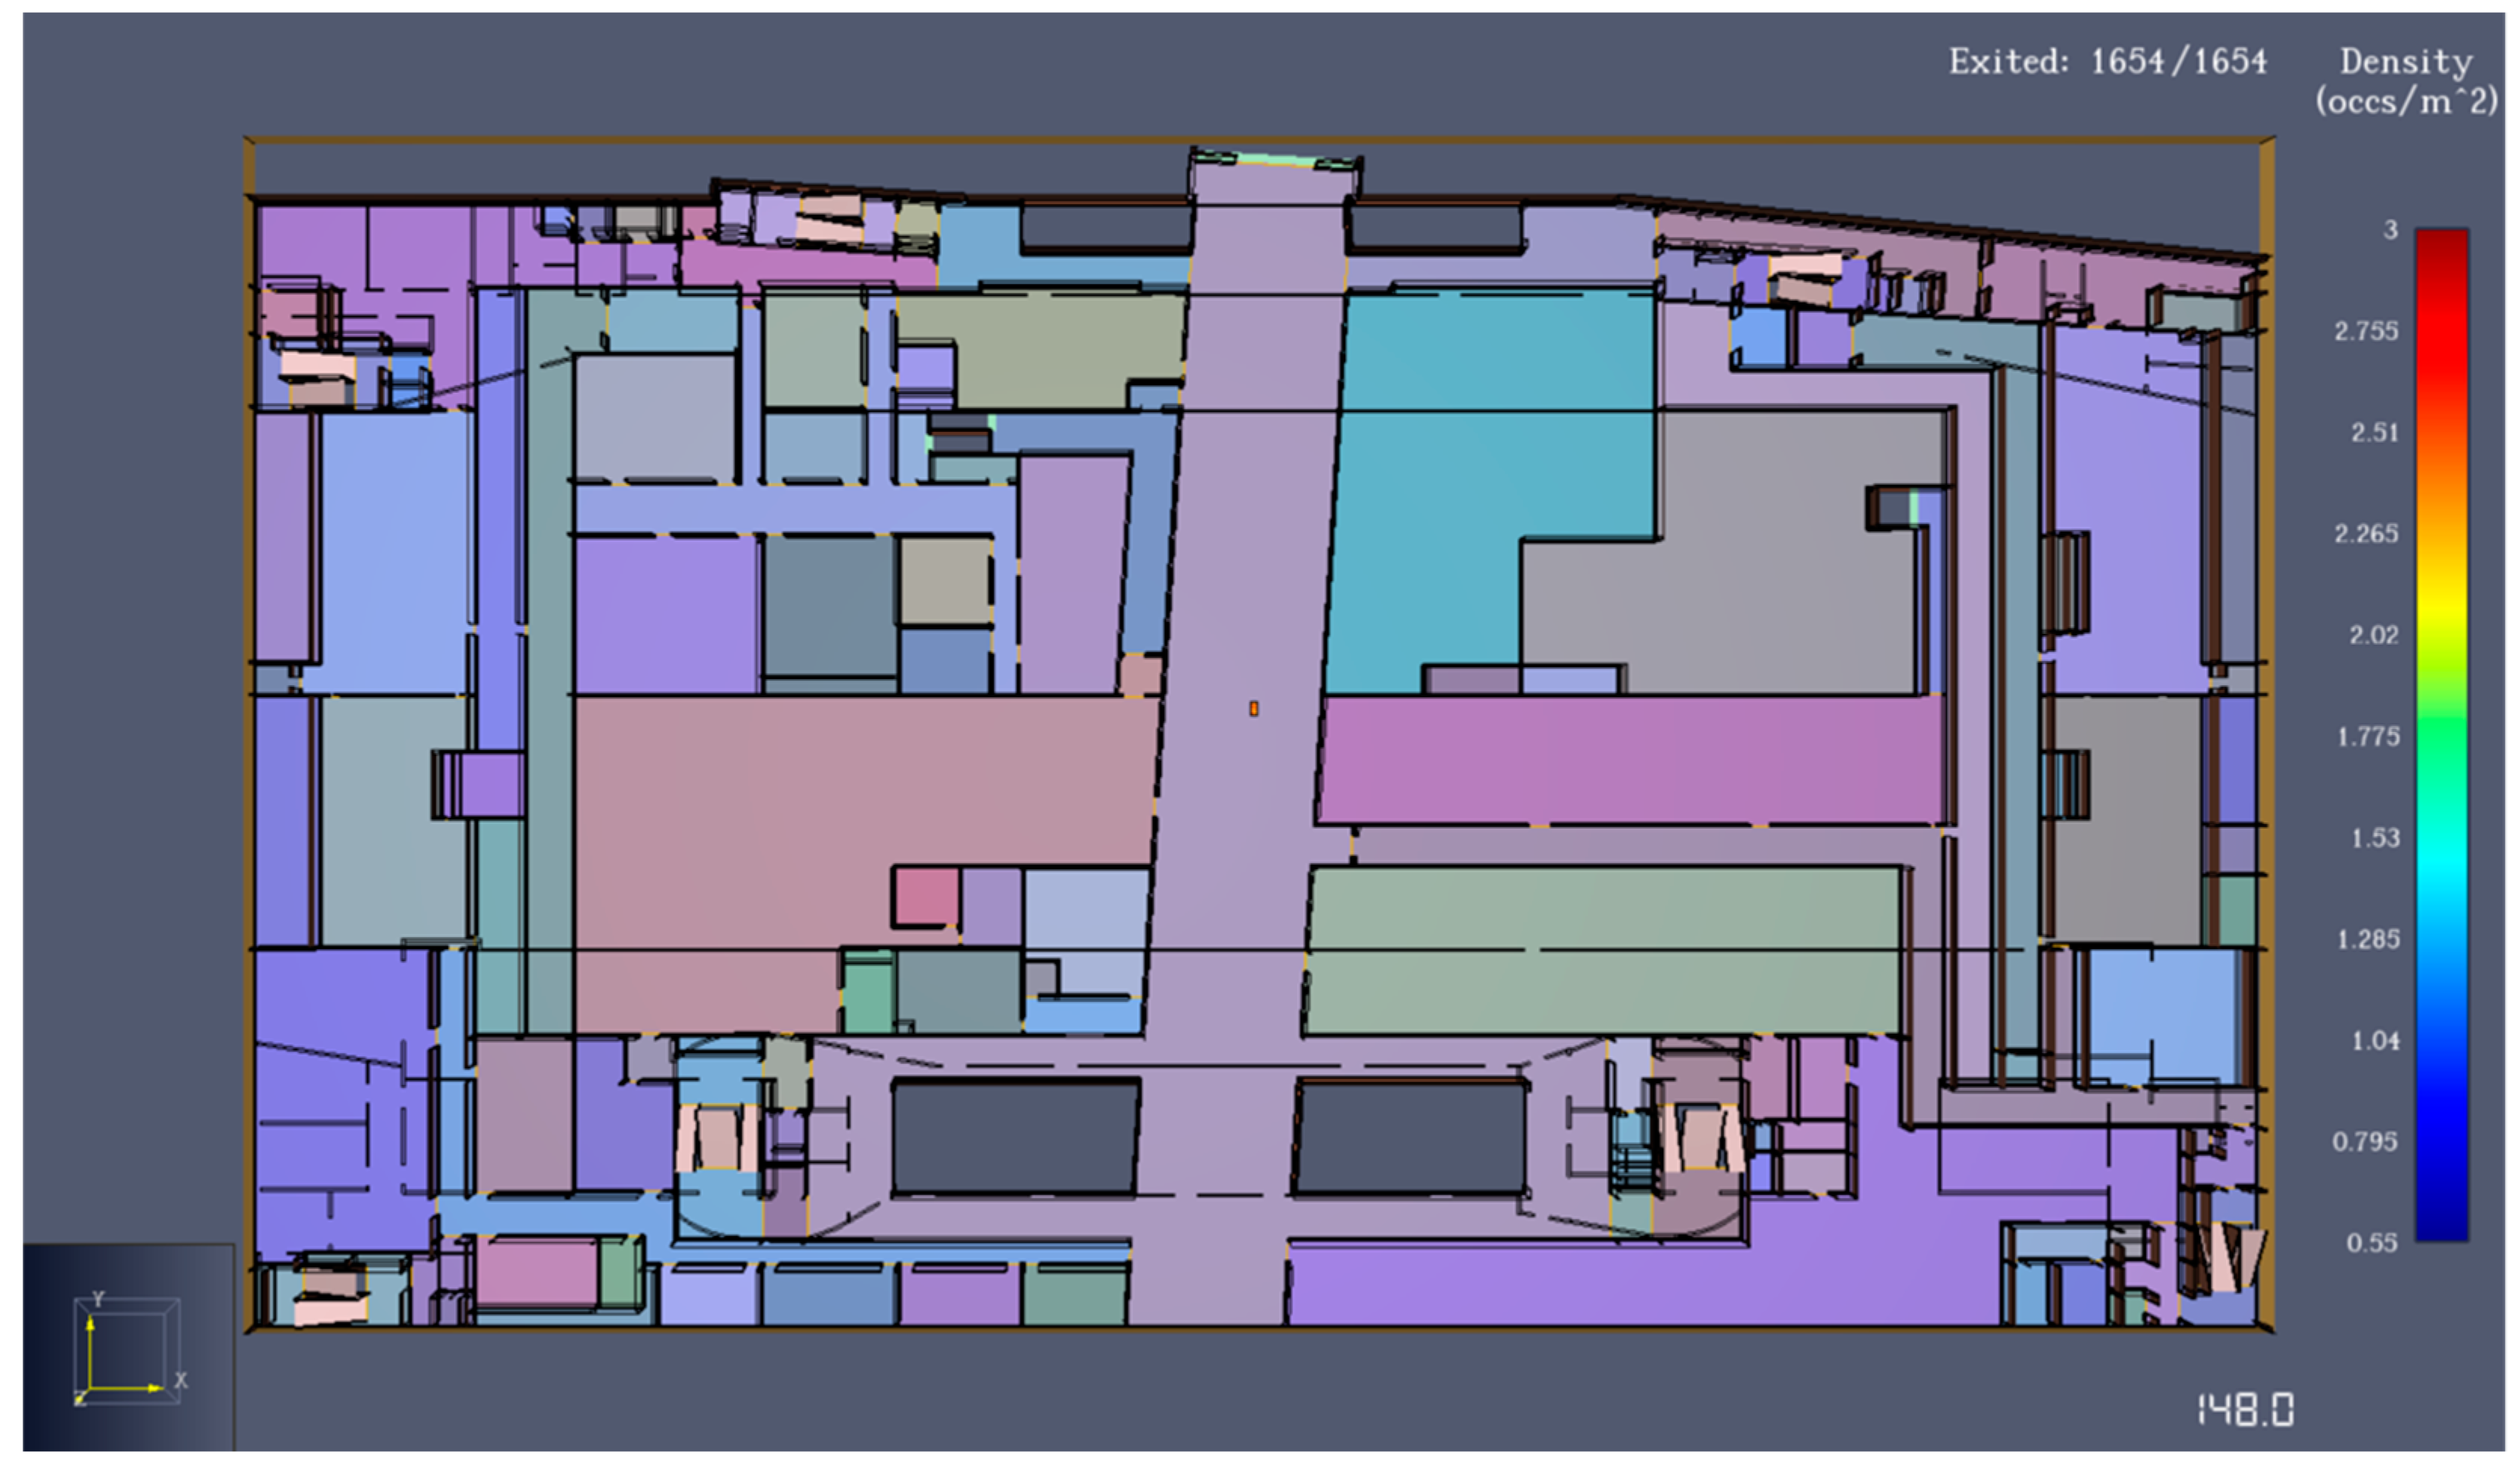
(3) It only takes 143 s to evacuate personnel safely in Zone II, which is more than the time required for the fire to spread completely. Therefore, the design of the bus station evacuation passage and exit can be considered reasonable and effective in an ideal evacuation situation.
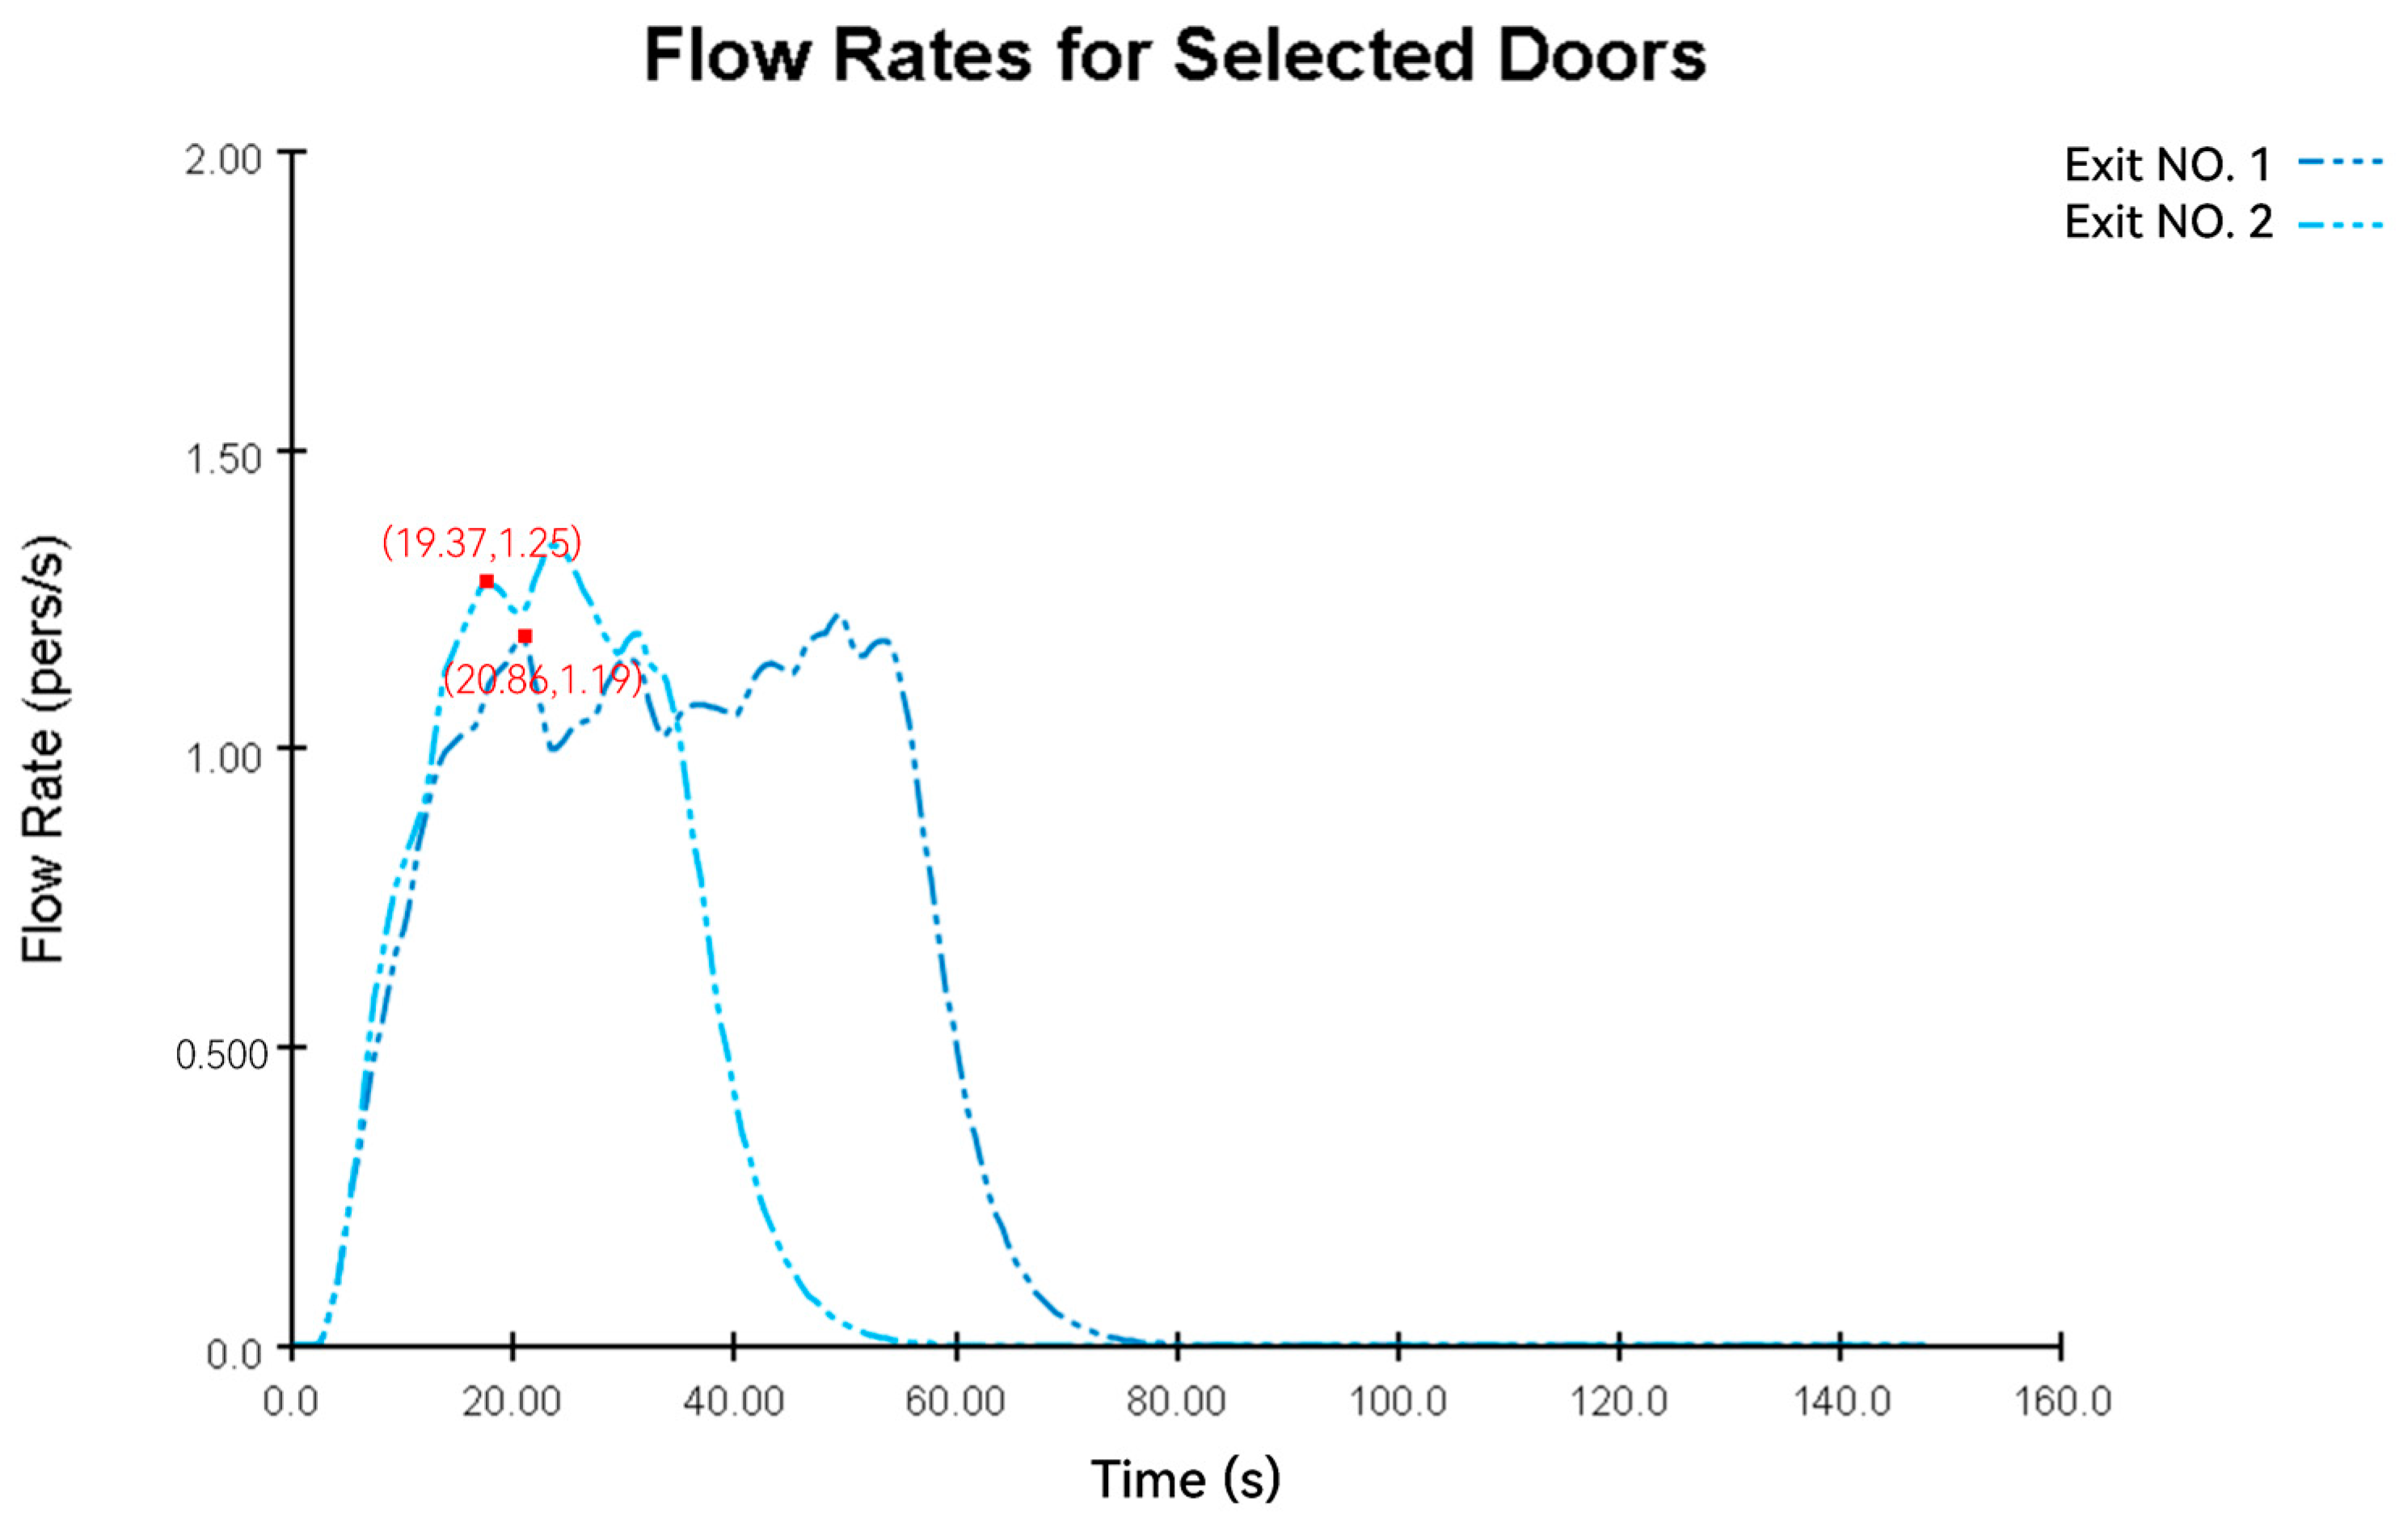
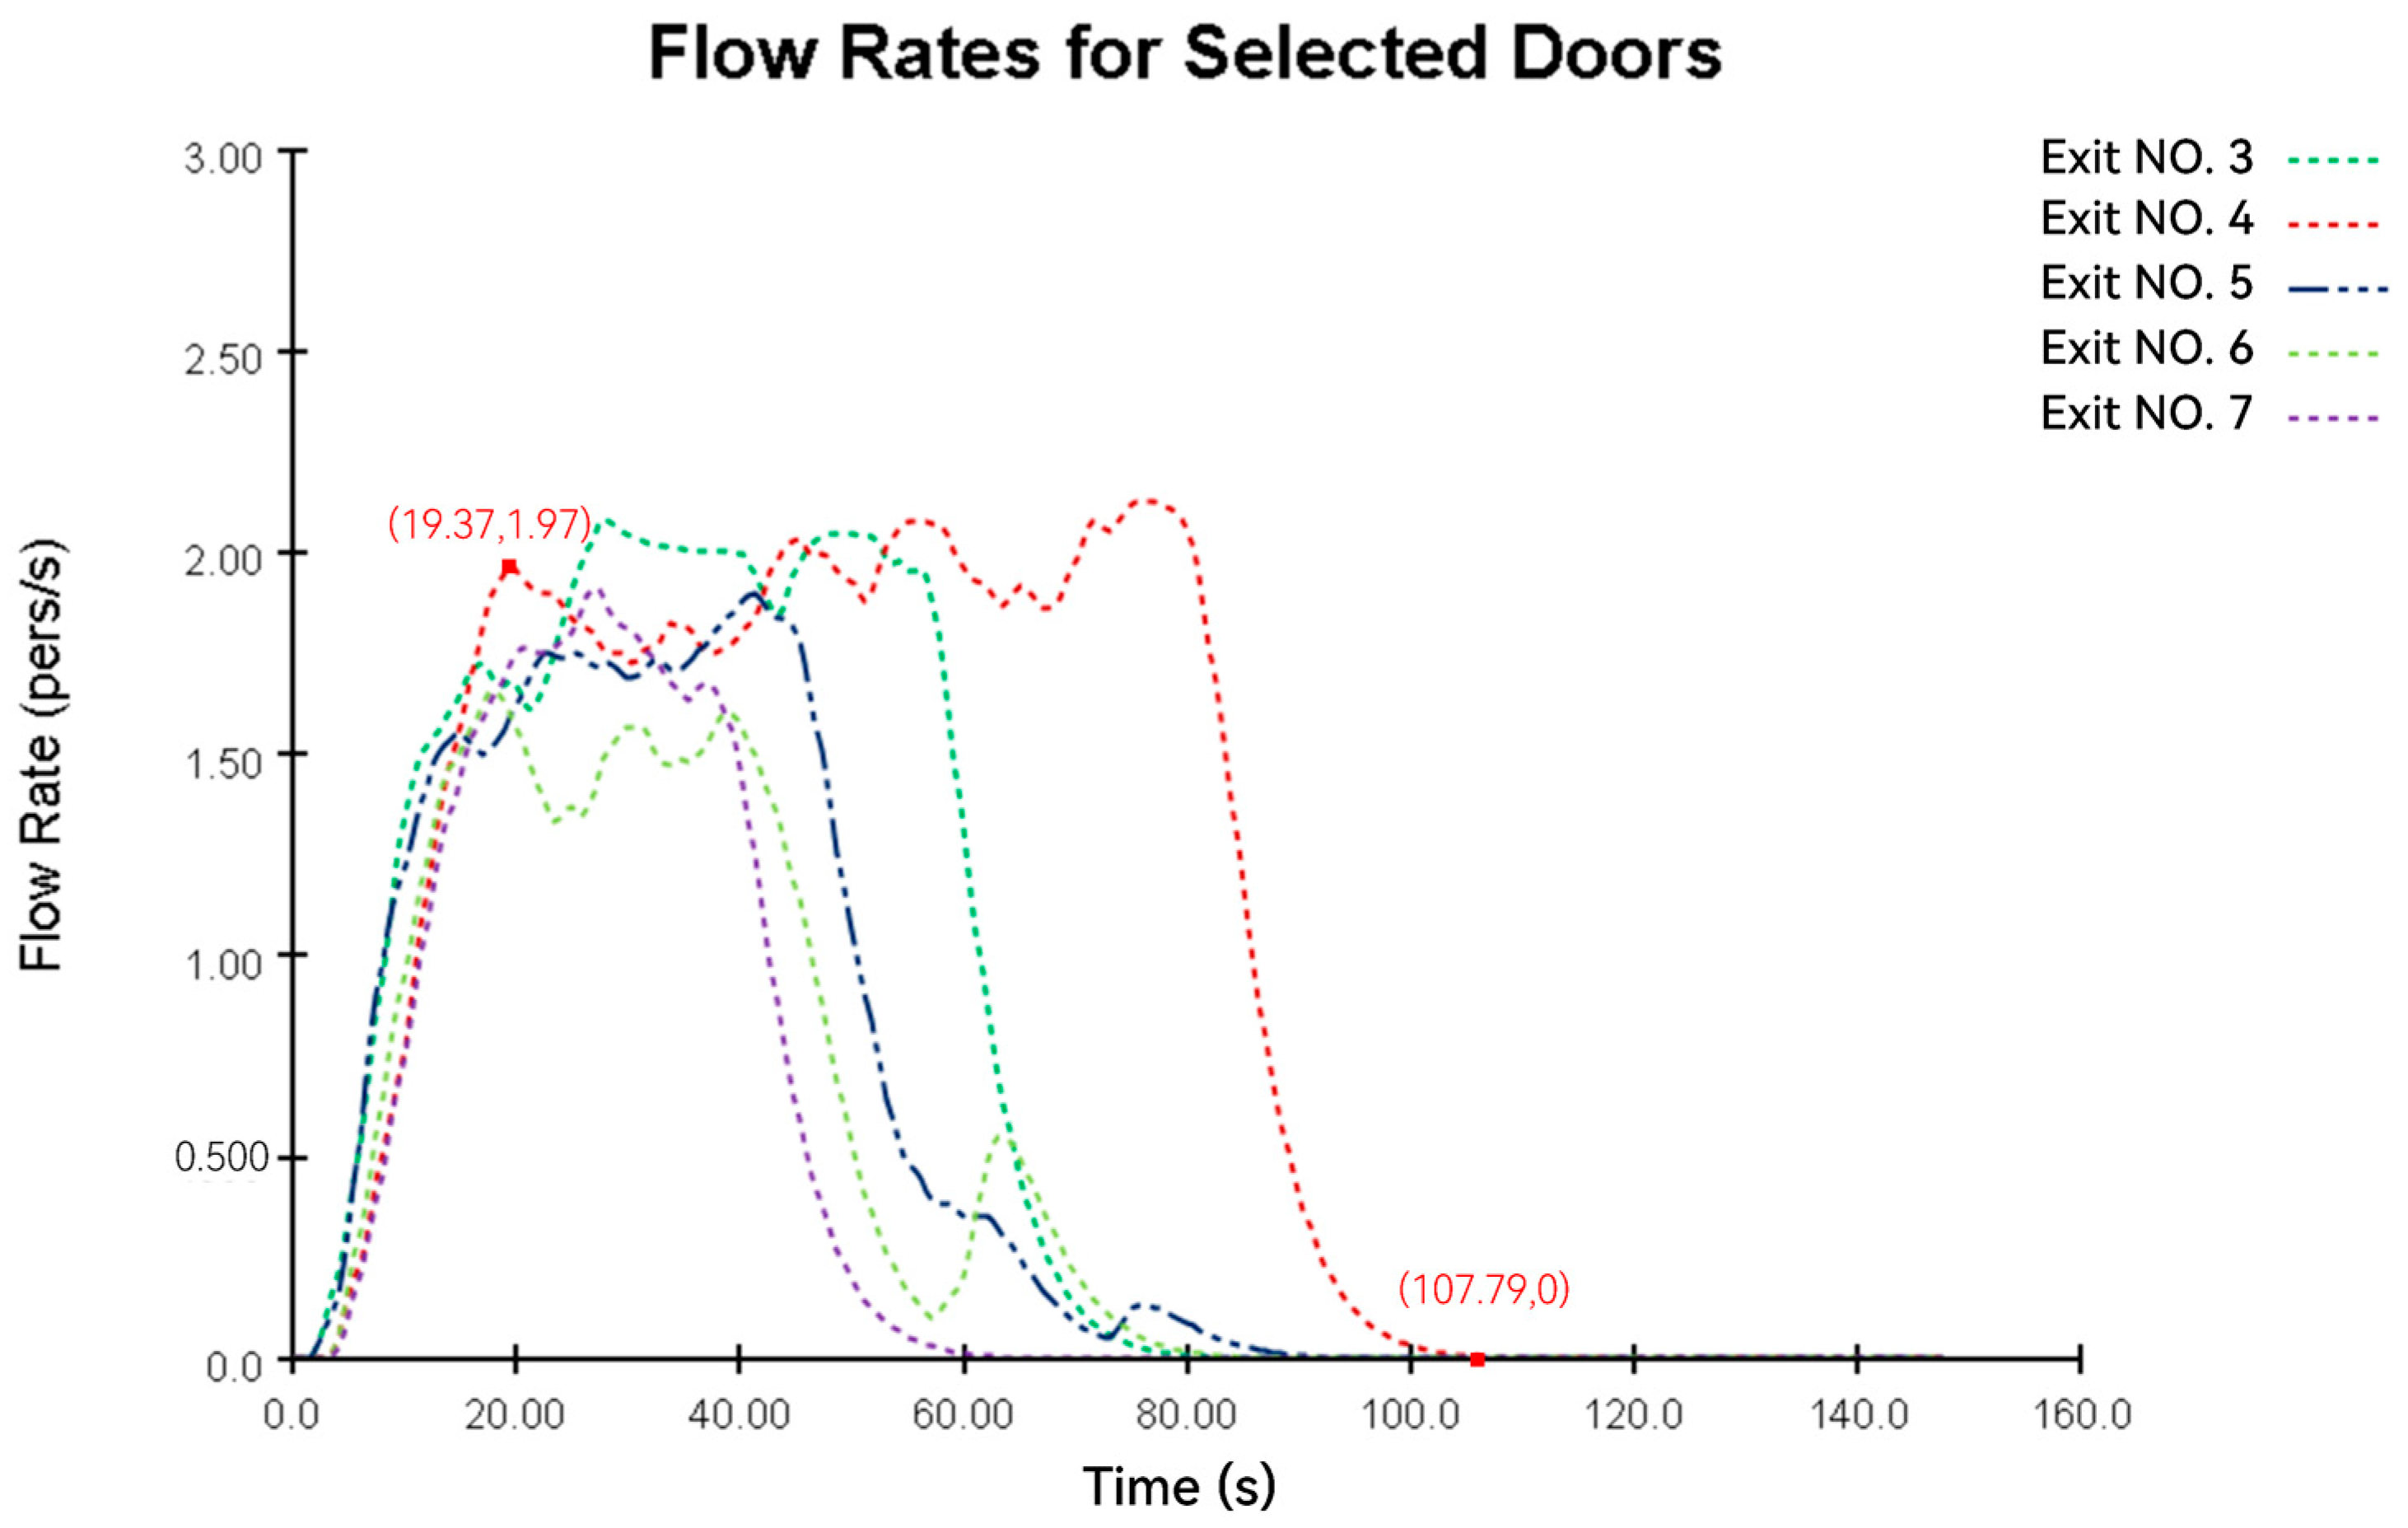
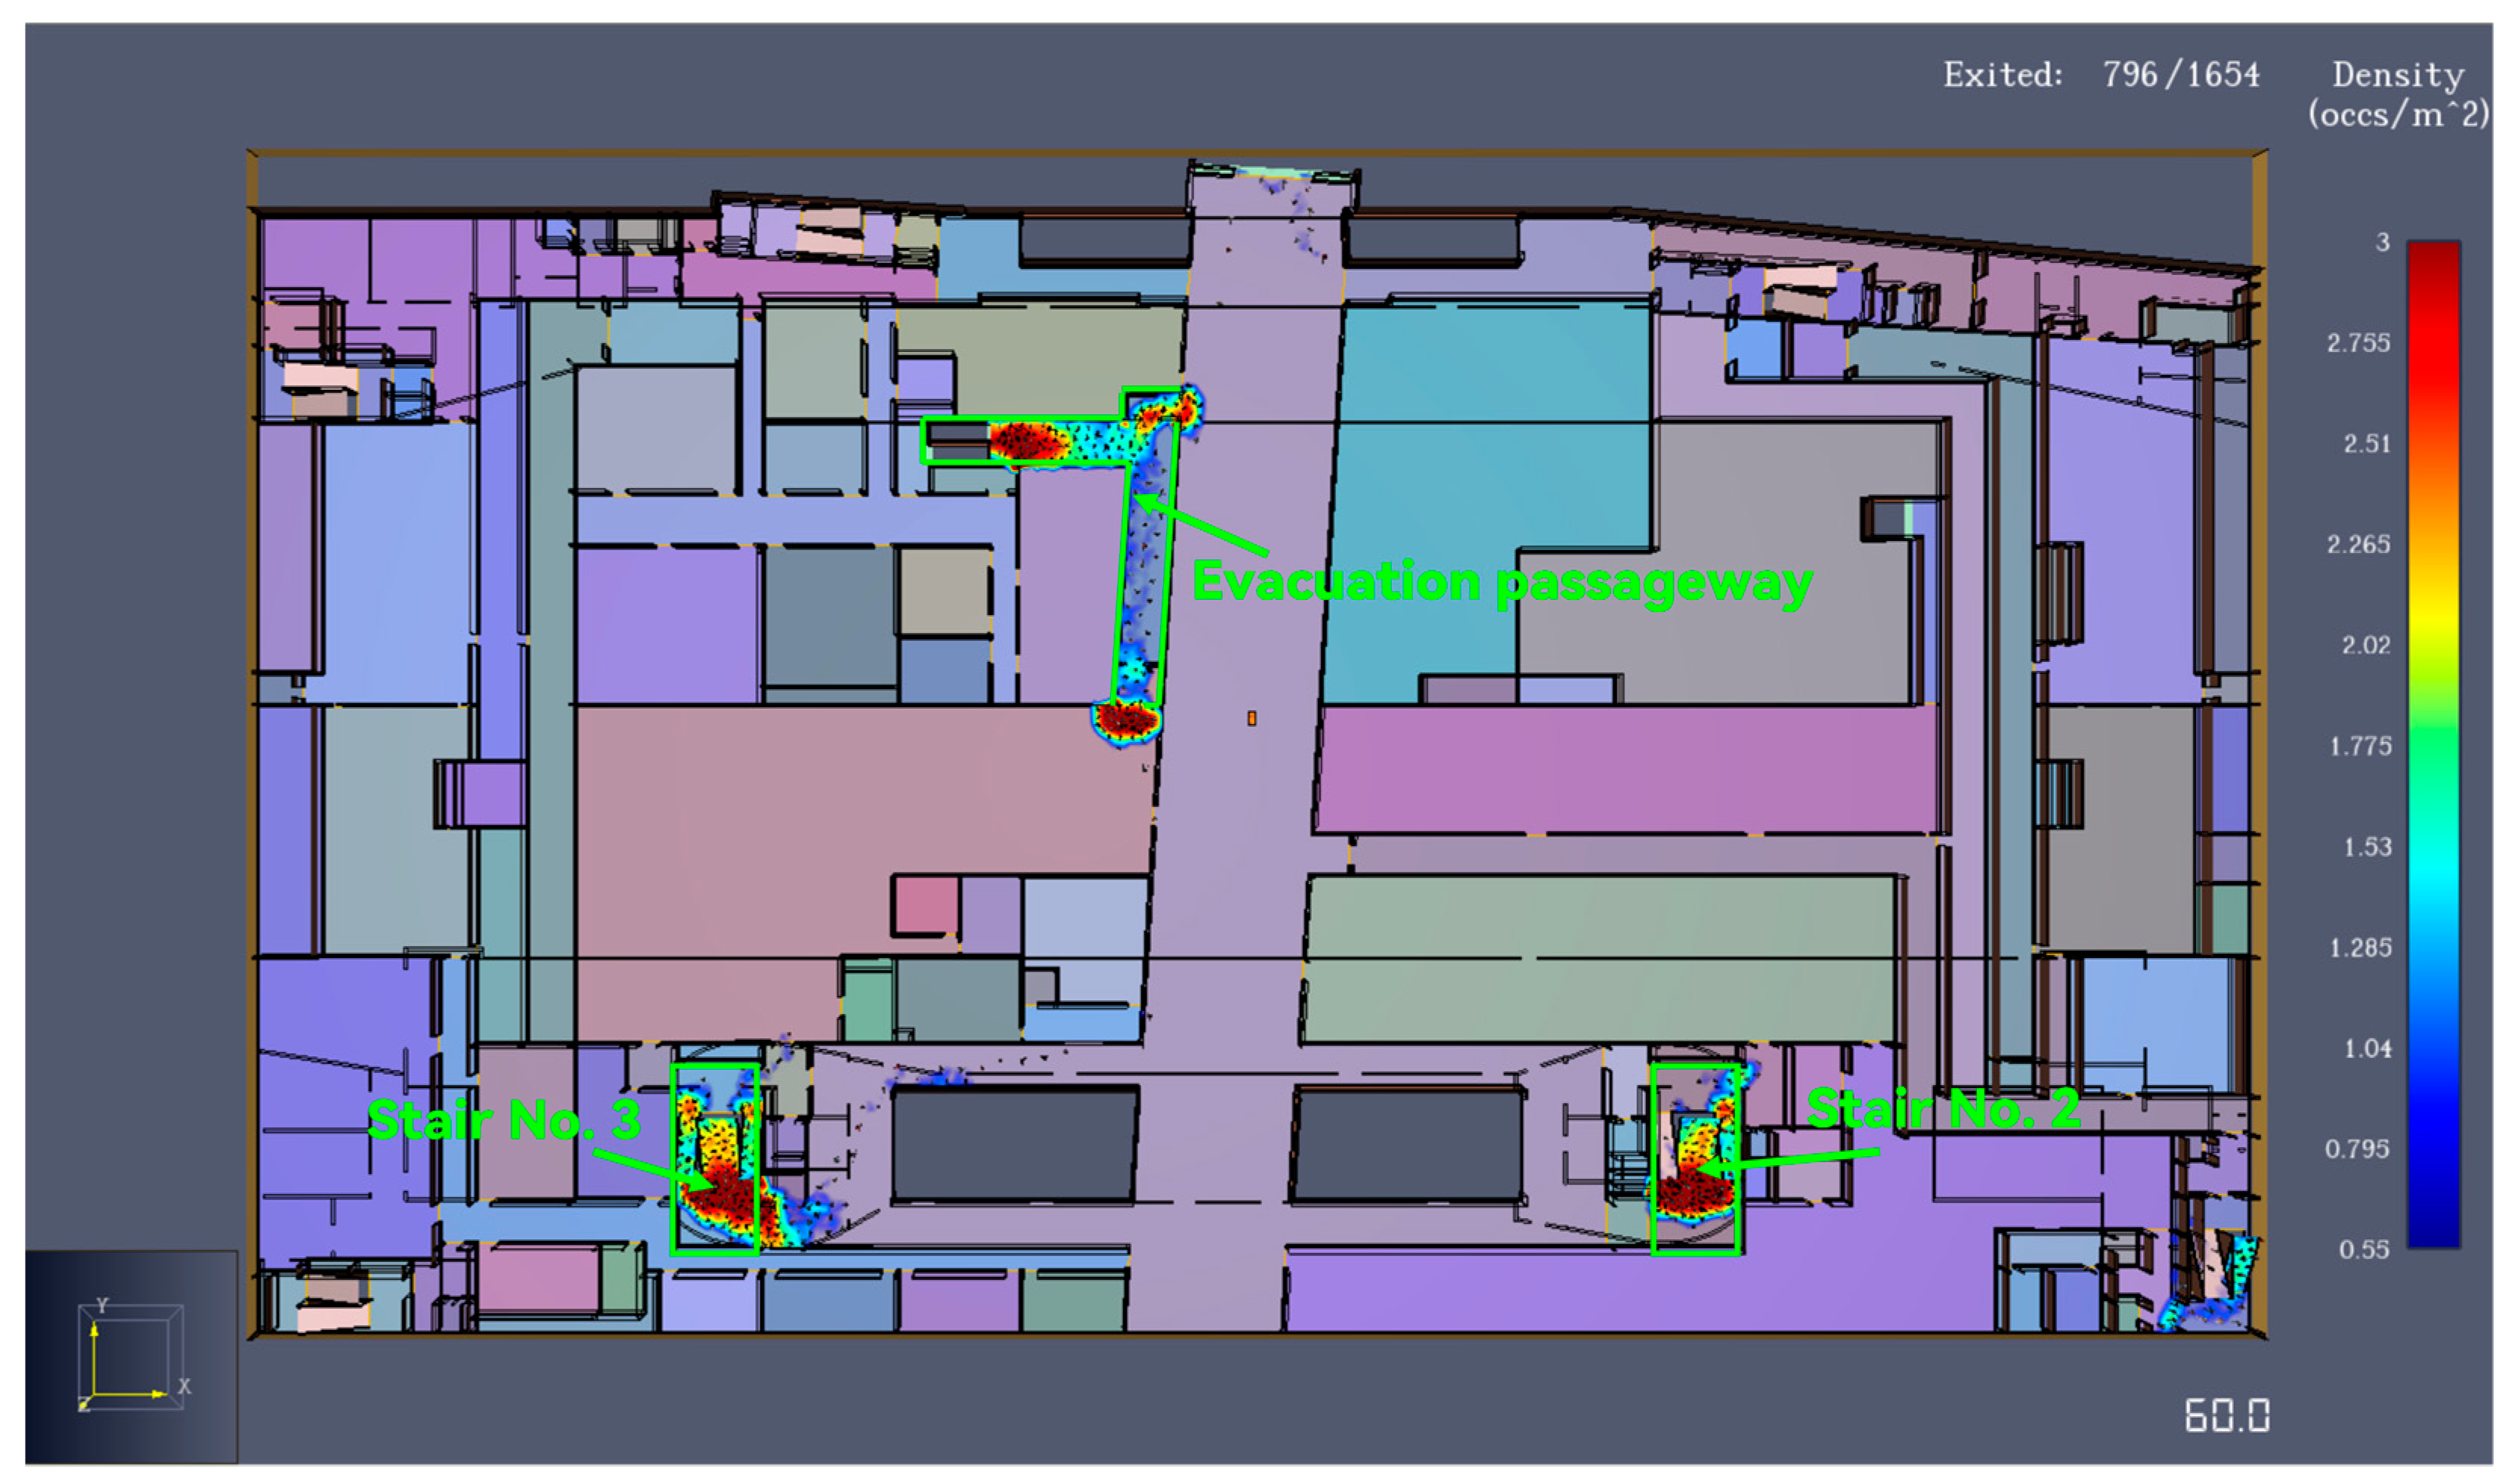
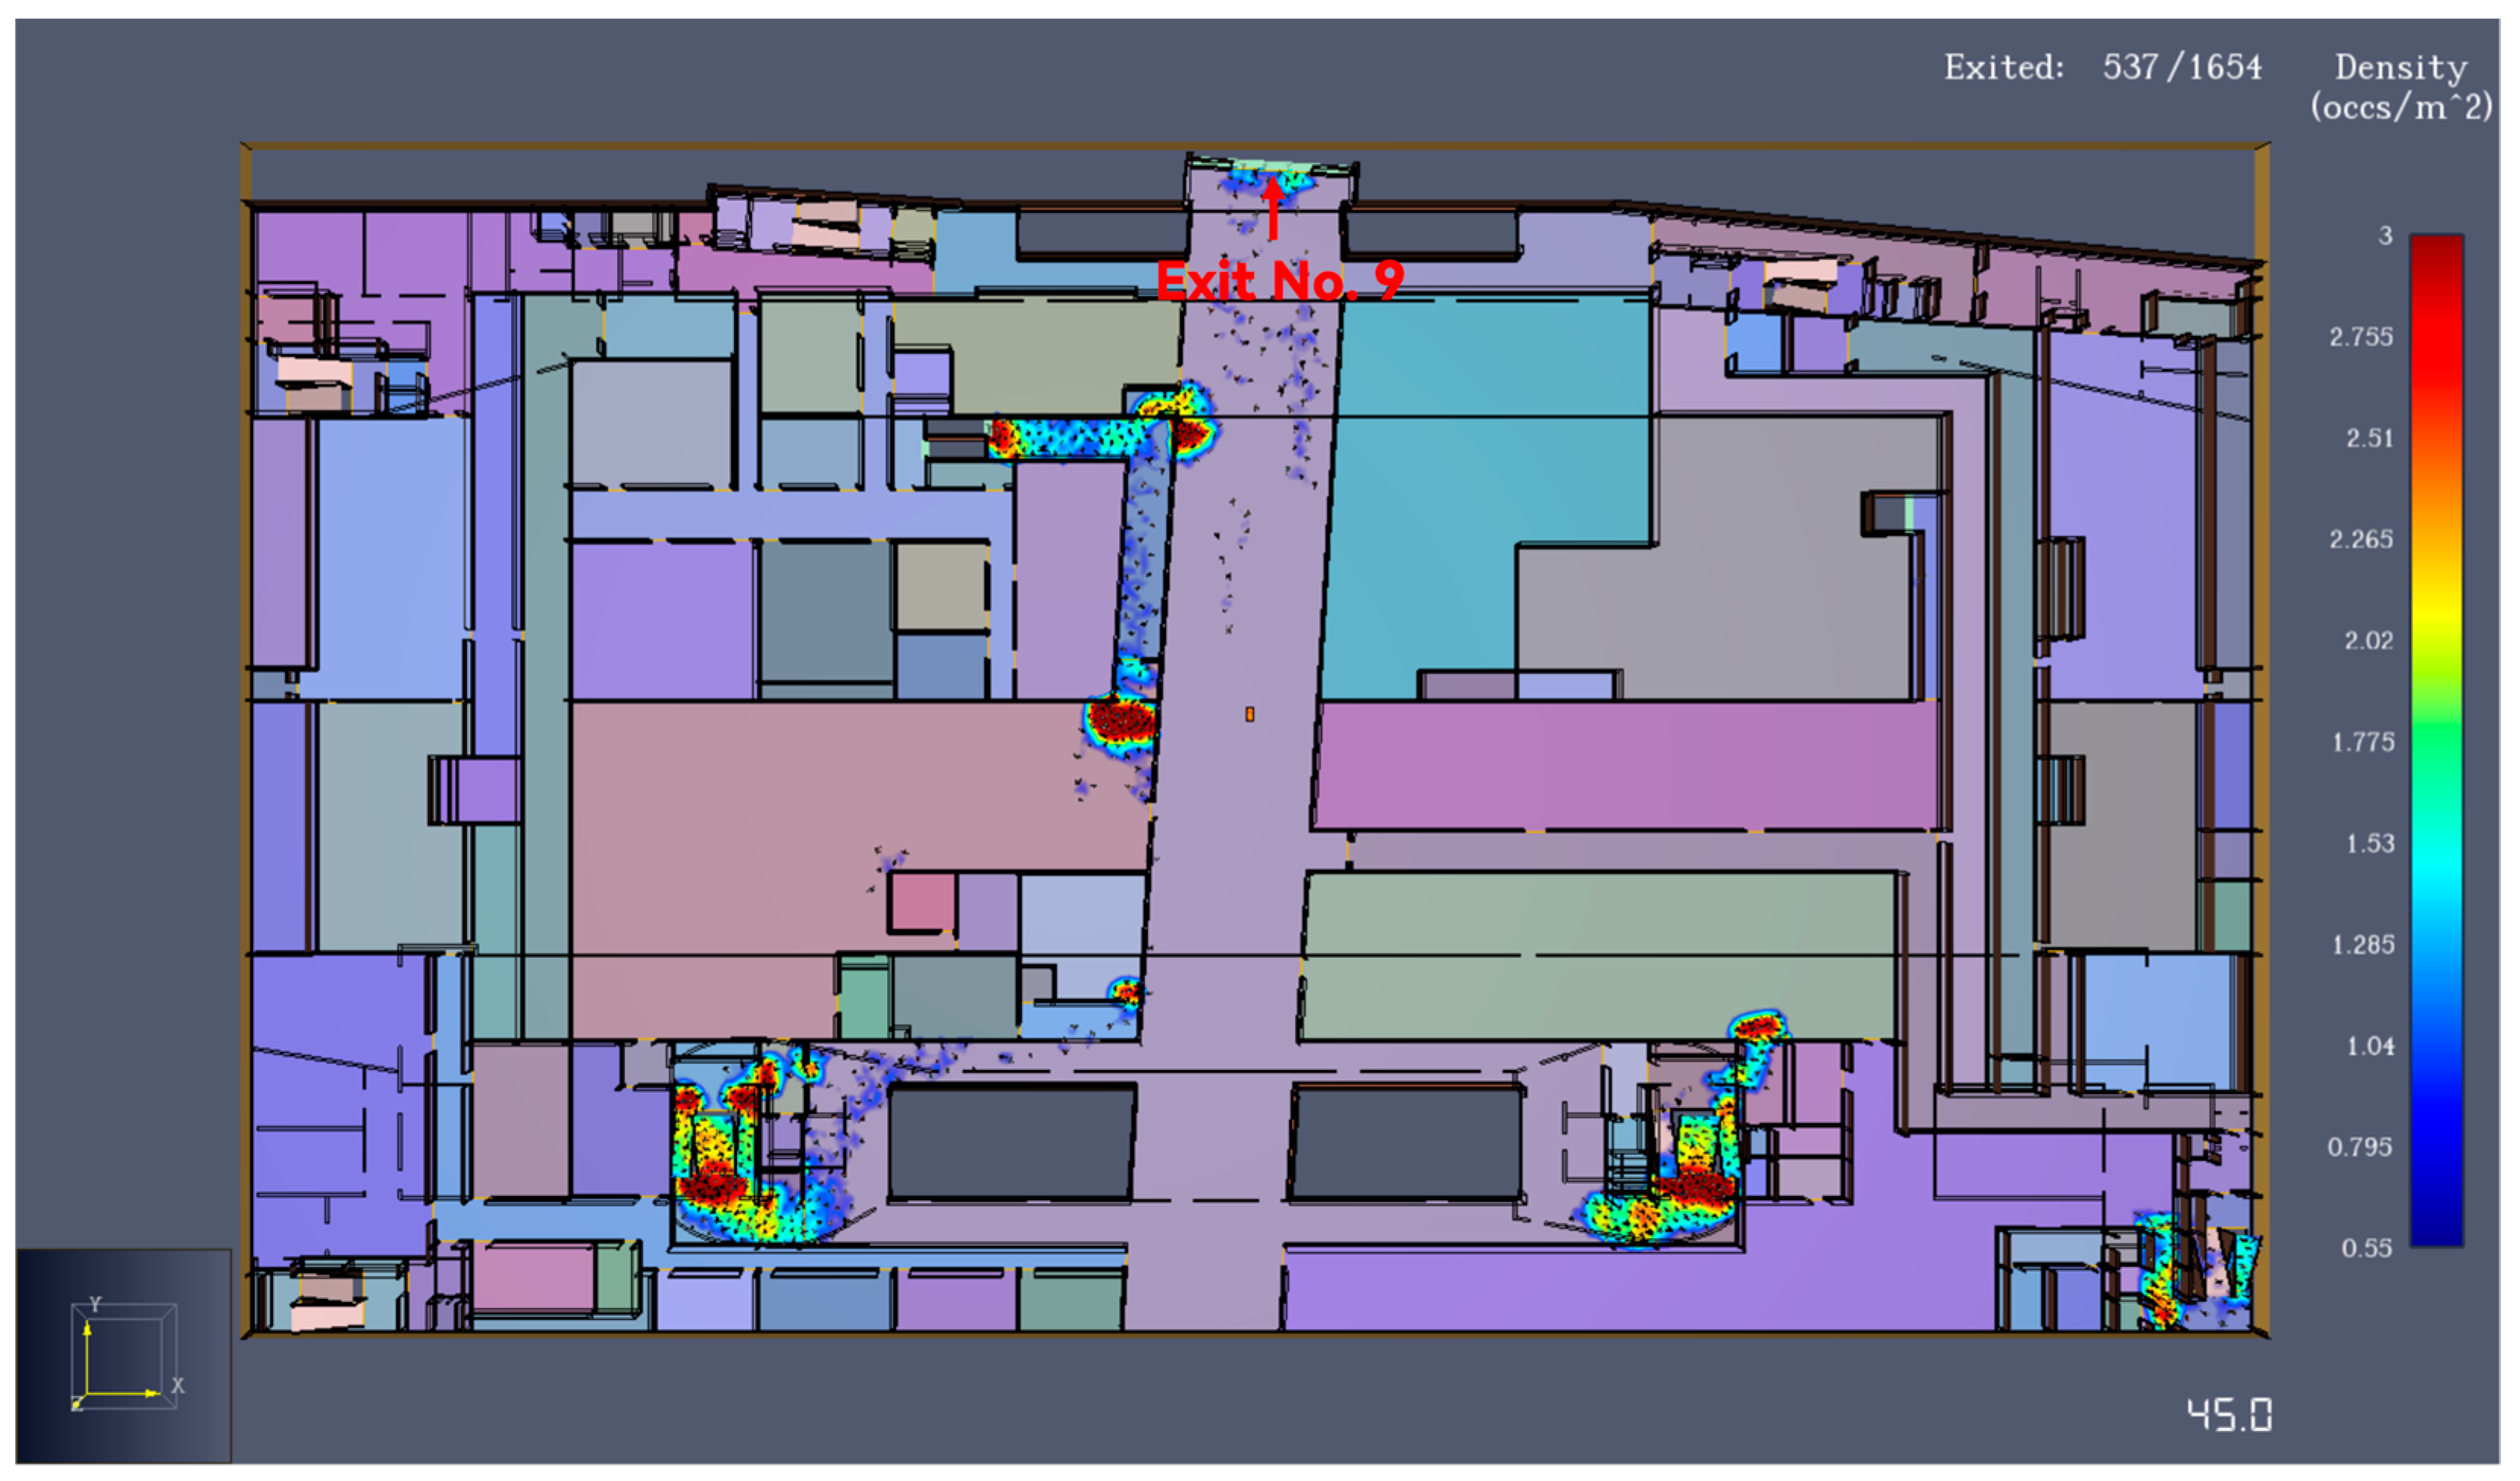
(4) In Zone II, owing to the small size of Exits 1 and 2 and the convergence of people in the traffic design, congestion appeared at the beginning of the evacuation. Because it had the shortest evacuation distance, Exit 3 next to Stair 2, Exit 3 next to the evacuation passageway, and Exits 4, 5, and 8 next to Stair 3 were the preferred exits for evacuation and were extremely prone to congestion. Stairs 4–6 have a low evacuation efficiency because the fire protection zone around them is mainly set as an equipment room, and the number of active people is low.
Based on the above conclusions, the following suggestions are proposed for the fire safety management of the Starting Area:
(1) Once a fire occurs in Zone I, fire management personnel should immediately evacuate the people to the safety exit of other adjacent areas with open spaces, rather than being limited to the exit with the shortest straight-line distance but narrow space. It is necessary to strengthen fire safety drills during peacetime, to familiarize oneself with safe exit locations, and to ensure that there is no debris accumulation on the evacuation route.
(2) For commercial, catering, equipment rooms, and other types of small spaces, in the case of a fire, the number of people to be evacuated should be limited. If the fire is small or controllable, the evacuation of other areas should be postponed or even disorganized. Linkage fire alarm systems should be installed at bus stations, subway stations, and other large public spaces. Once a fire is detected, all the alarms and personnel should be quickly organized for evacuation to the nearest safety exit. Simultaneously, the fire door or fire shutter should be immediately closed, and an automatic fire extinguishing device should be turned on to prevent the spread of the fire. For deep underground spaces, such as tunnels, the maintenance of purging systems and emergency lighting systems should be strengthened in peacetime and opened in time when a fire occurs to ensure that the space is not quickly filled with smoke and the line-of-sight of people is not blocked.
(3) It is suggested to add a door next to Exits 1 and 2 in Zone II or to change the traffic design so that the two human streams do not block the same exit. When escaping, most people tend to choose a straight path to the safety exit, but the smoke tends to spread faster in such spaces. Therefore, evacuation signs or on-site guidance should be used to guide people to choose the safety exit at the corner of the evacuation path to escape.


 ,
, 


