Article

Experimental and Numerical Behavior of Encased Pultruded GFRP Beams under Elevated and Ambient Temperatures

1
Department of Civil Engineering, University of Baghdad, Baghdad 17001, Iraq
2
Department of Engineering and Technology, Texas A&M University-Commerce, Commerce, TX 75429, USA
*
Author to whom correspondence should be addressed.
Fire 2023, 6(5), 212; https://doi.org/10.3390/fire6050212
Submission received: 24 April 2023 / Revised: 16 May 2023 / Accepted: 19 May 2023 / Published: 21 May 2023

Abstract

:
In this research, experimental and numerical studies were carried out to investigate the performance of encased glass-fiber-reinforced polymer (GFRP) beams under fire. The test specimens were divided into two peer groups to be tested under the effect of ambient and elevated temperatures. The first group was statically tested to investigate the monotonic behavior of the specimens. The second group was exposed to fire loading first and then statically tested to explore the residual behavior of the burned specimens. Adding shear connectors and web stiffeners to the GFRP beam was the main parameter in this investigation. Moreover, service loads were applied to the tested beams during the fire. Utilizing shear connectors, web stiffeners, and both enhanced the load-carrying capacities of the encased beams by 100.6%, 97.3%, and 130.8%, respectively. Comparisons between the burned and unburned peer beams were presented with losses in the load-carrying capacity of the burned beams. These losses were the highest in the cases of shear connectors and web stiffeners due to the obtained severe damage, which led to more reductions in the residual behavior of the burned beams. Numerical analyses were performed using the general-purpose finite element (FE) ABAQUS package to conduct a parametric study. The investigated parameters included the effect of the exposure duration and the temperature level. The results of the FE analysis showed good agreement with the experimental results. Additional reductions in the residual capacities of the fire-damaged beams were observed due to exposure to longer fire durations. The improvements in the beam capacities due to using shear connectors and web stiffeners relative to the reference beams under the same exposure time decreased as the exposure duration increased. Furthermore, increasing the temperature to 700 °C, 800 °C, 900 °C, and 950 °C caused reductions in the residual capacities by about 25%, 45%, 70%, and 80%, respectively, for the encased beams in comparison to their peers at ambient temperature.

1. Introduction

Structural members are designed to satisfy the serviceability requirements and limit safety states for different environmental conditions. Fire is one of the most severe conditions; hence, essential safety requirements in building design provide adequate fire safety measures for structural members. The geometry, construction material, load intensity, and fire exposure factors all influence the fire resistance of members [1,2]. Pultruded FRP members are desirable due to the low labor cost, minimum material waste, and high production rate [3,4]. The encased pultruded GFRP I-beam with reinforced concrete (RC) is a type of composite structure that has an inner pultruded GFRP I-profile and RC as the outer component [5,6,7], as shown in Figure 1. The major issue is the behavior of these members in fire. Fire behavior refers to performance under fire exposure and post-fire at ambient temperature. Encased beams are expected to have higher fire resistance than those without fire protection because the outer RC component insulates the encased beam. The purpose of post-fire testing is that the encased GFRP can survive during fire due to the insulation of the outer RC and subsequently can maintain residual behavior after burning [8].
A literature review found that several earlier studies had looked into the impact of fire on structural components. Morgado et al. [9] experimentally investigated the fire resistance of simply supported GFRP profiles with tubular shapes that were exposed to fire loading by ISO 834. A static load of 12.2% of the ambient temperature capacity represented the service load during the fire. The number of sides that were exposed to fire, the level of service load that was being applied, and various fire prevention systems were the main factors. In comparison to one-sided exposure, the three-sided exposure significantly decreased the fire resistance for both protected and unprotected profiles. Moreover, more reductions in fire resistance were brought on by raising the applied service load level. Parthasarathi et al. [10] investigated RC elements under different temperature conditions. Flexural collapse was the mode of failure of the tested element after the yielding of steel reinforcement. The deflection was two times higher when compared to the beam under ambient temperature. Moreover, significant reductions in load-carrying capacities were observed at a temperature of 500 °C. As the temperature increased, the ultimate strength and initial stiffness decreased and the ductility increased [11]. After removing the applied fire and service loading, the fire-exposed beams had residual deformation that prevented them from returning to their pre-fire configuration [12]. The temperature-related damage and residual plastic strain in the concrete and steel reinforcing were the main reasons for these residual deformations. In addition, the fire-induced bond degradation played a vital role in exploring the response of FPR-strengthened RC beams from the pre-fire stage to failure under fire exposure and must be considered numerically to achieve precise predictions of the failure mode and deflection responses [13,14]. Without accounting for this bond degradation, the developed numerical models were stiffer and showed less deflection [13]. Moreover, the assumed perfect bond between the FRP bars and concrete at elevated temperature yielded less accurate prediction of the mid-span deflections [14]. Therefore, the concrete damaged plasticity (CDP) model as well as the constitutive laws of FRP reinforcement were utilized to represent these degradations at elevated temperatures [14]. The cover thickness of the concrete, longitudinal steel reinforcement ratio, duration of fire exposure, and sides of fire exposure were significant parameters that influenced the fire resistance of RC beams [15,16]. Stiffness deterioration was obtained from the variations in curvature and bending moment functions [16].
Many previous experimental and numerical studies investigated the encased FRP profiles under fire loading. Currently, research on encased GFRP beams with high-strength concrete is very limited. There is still a need to explore the effect of different parameters that affect the bond between the FRP profiles and concrete, such as shear connectors and web stiffeners. Moreover, additional parameters in terms of the effect of the exposure duration and temperature level that affect the behavior of these elements under fire should be investigated. Therefore, experimental and numerical studies were carried out in this research to investigate the performance of encased glass-fiber-reinforced polymer (GFRP) beams under fire. Two peer groups were tested under the effect of ambient and elevated temperatures. The first group was statically tested to investigate the monotonic behavior of the specimens. The second group was exposed to fire loading first and then statically tested to explore the residual behavior of the burned specimens. Adding shear connectors and web stiffeners to the GFRP beam was the main parameter in this investigation. Moreover, service loads were applied to the tested beams during the fire. Numerical analyses were performed using the general-purpose finite element (FE) ABAQUS package to conduct a parametric study. The investigated parameters included the effect of the exposure duration and the temperature level.

2. Experimental Program

Two peer groups were tested under the effect of ambient and elevated temperatures. The first group was statically tested to investigate the monotonic behavior of the specimens. The second group was exposed to fire loading first and then statically tested to explore the residual behavior of the burned specimens. Each group consisted of five simply supported encased pultruded GFRP I-beams.

2.1. Details of the Tested Beams

The total and effective lengths were 3000 mm and 2750 mm, respectively. The encased RC cross-sections were 200 mm in width and 300 mm in height. These sections were reinforced according to ACI 318–19 [17] using 2Ø16 mm as the tension reinforcement and 2Ø10 mm as the compression reinforcement. Stirrups of 10 mm diameter at an equal longitudinal spacing of 125 mm were used as the transverse reinforcement. Table 1 and Figure 2 present the parametric details of tested beams in terms of temperatures, shear connection, and web stiffeners. As depicted in Figure 2, pultruded GFRP I-beams with a total height of 150 mm were placed in the middle of each tested beam’s RC cross-section. To increase the composite action between the concrete and pultruded GFRP I-beam, steel shear connectors with a height of 60 mm and a diameter of 12 mm were used at the top and bottom flanges of the pultruded beams. These connectors were fabricated using hexagonal nuts with a diameter of 18 mm and were arranged in two rows, as illustrated in Figure 3a. The longitudinal spacing between these connectors was 375 mm. Web stiffeners of GFRP rectangular prisms with dimensions of 110 mm × 25 mm × 10 mm were used at a spacing of 160 mm to strengthen the GFRP web against longitudinal shear failure, as shown in Figure 3b. The formwork and steel reinforcement are shown in Figure 3c.

2.2. Material Properties

The used concrete mix proportion is listed in Table 2. Type I ordinary Portland cement was employed to prepare concrete. Crushed coarse aggregate with a size range of 5–12 mm, an absorption percentage of 0.3%, and specific gravity of 2.56 was used. A dried fine aggregate with rounded particles and a modulus of fineness of 2.9 was utilized. Tap water was used for the concrete mix and curing. To evaluate the compressive strength of concrete and the modulus of elasticity, three concrete cylinders with 150 mm diameter and 300 mm height were cast and cured in the same conditions as the encased beams. The compressive strength and elastic modulus, as determined by ASTM C39-39M [18] and ASTM C469-469M [19], were 53.8 MPa and 31,000 MPa, respectively.
According to ASTM A615/A615M-20, tensile tests were performed on steel rebar with diameters of 16 and 10 mm (three specimens for each diameter) [20]. The properties of the reinforcement bars are listed in Table 3.
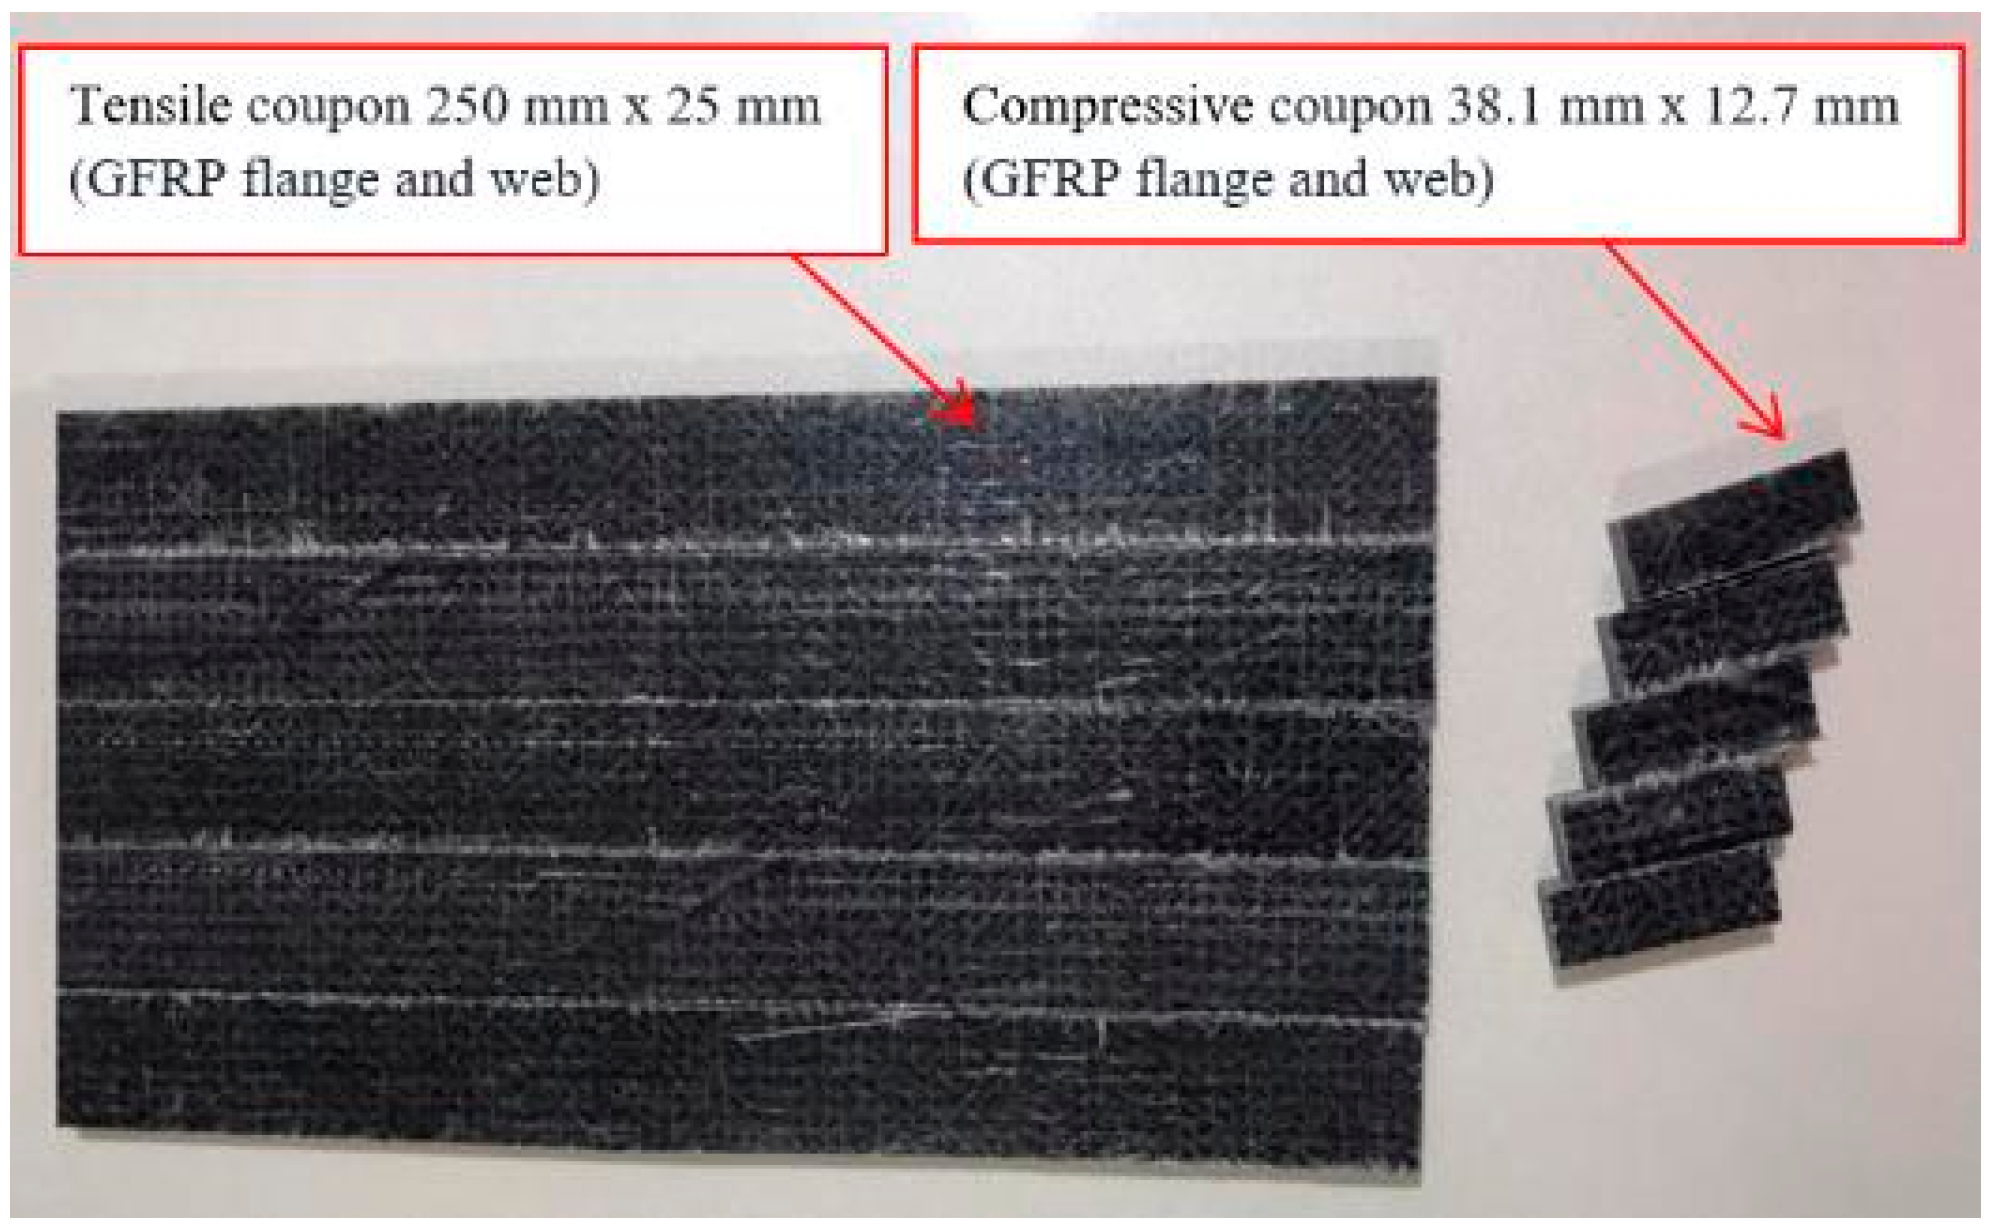
The GFRP I-beams were fabricated using isophthalic polyester resin reinforced with E-glass fibers (Dura Composites, Clacton-on-Sea, UK). The properties of these beams changed in each direction since they were orthotropic materials. They were stronger in the longitudinal direction as compared to the transverse direction because the fibers were mostly placed in the longitudinal direction. Five coupons were cut from the web and flange of the pultruded GFRP beams to be tested in compression and tension in both longitudinal and transverse directions, as illustrated in Figure 4, according to ASTM Designation D695-15 [21] and ISO 527-4: 1997 [22], respectively. The results of these tests are listed in Table 4. The manufacturer supplied the physical properties of these materials.

2.3. Static Tests

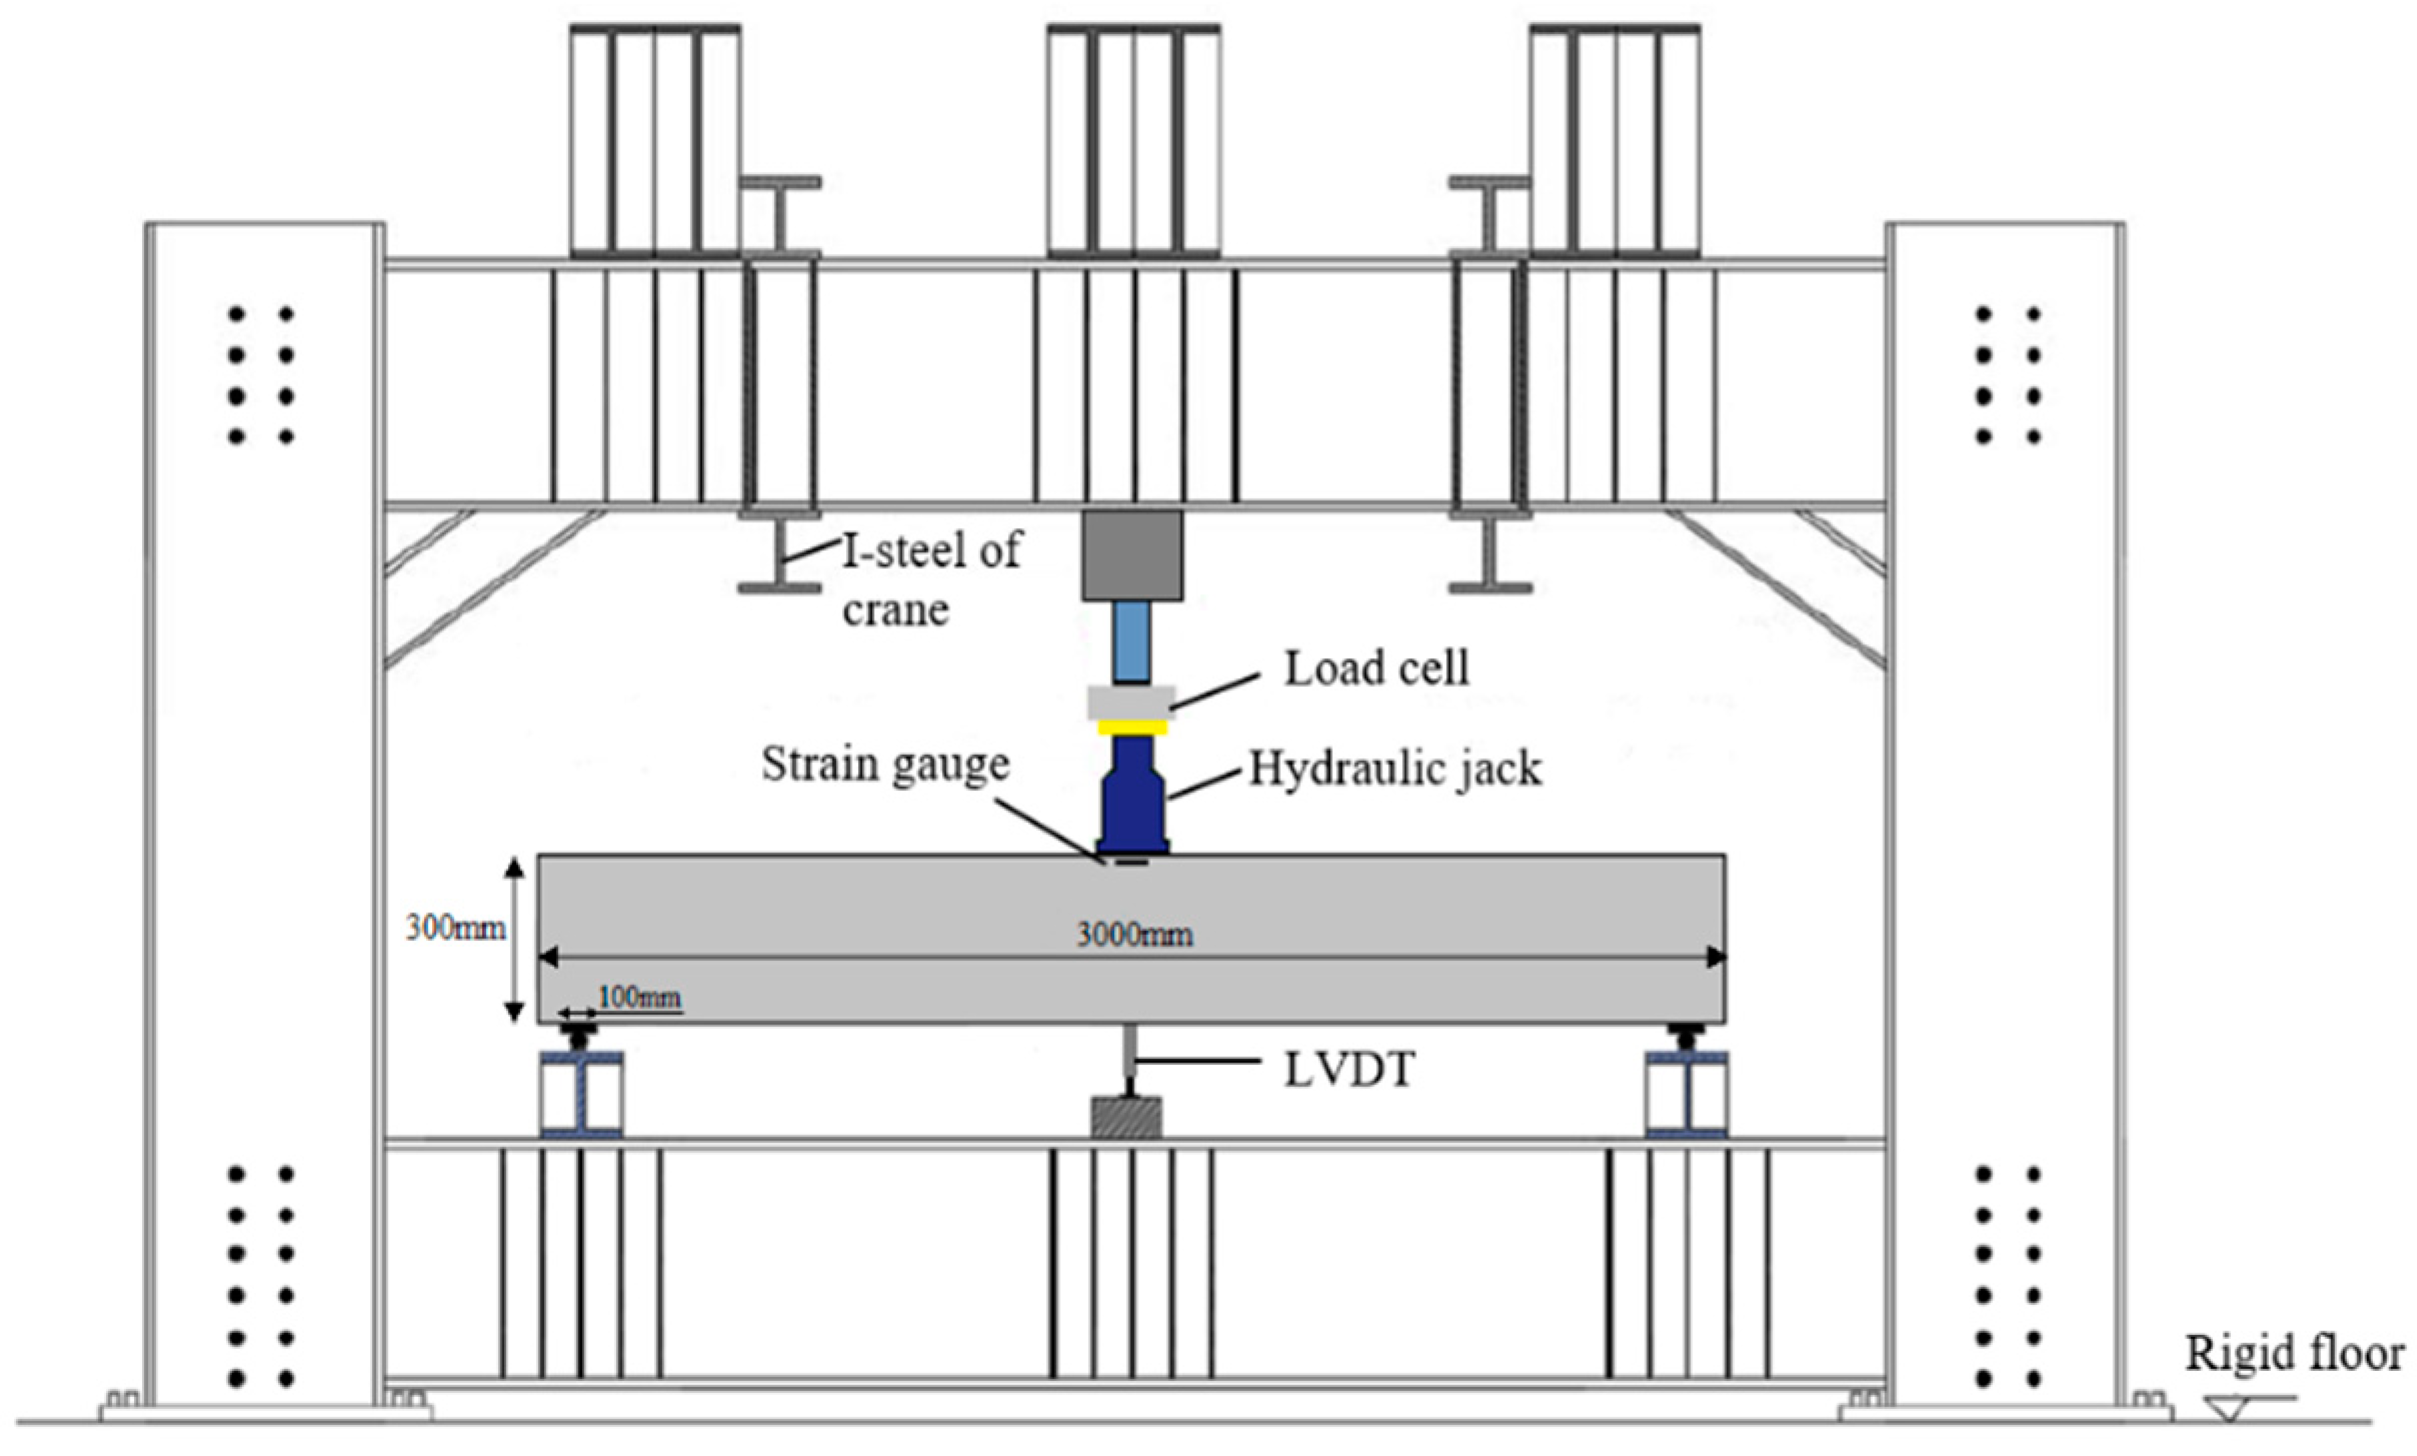
Static tests were carried out on the beams of the first group, as shown in Figure 5, to explore the monotonic behaviors and static capacities of these beams. The beams were simply supported and were tested under three-point loading utilizing a hydraulic jack, with 500 KN capacity. These tests were conducted under force control with a loading rate of 5.0 kN/min. Linear variable differential transforms (LVDTs) were used to obtain mid-span deflections. The supporting structure for the examined specimens permitted the beams to move both horizontally and angularly at one end, but just angularly at the other, simulating roller and hinge supports, respectively.

2.4. Fire Test Setup and Procedures

Five simply supported beams were exposed to fire under service load. A gas furnace with dimensions of 12.0 m × 4.0 m × 3.0 m, as shown in Figure 6a, was employed to apply fire loading. Thirty burners were distributed inside the furnace to uniformly distribute the temperature. Six thermocouples were placed throughout the chamber to monitor the furnace temperature to maintain a constant temperature along the beam span during the fire test. Moreover, infrared thermometers were used to measure and read the temperature of the concrete surfaces inside the furnace. The burned beams were left to cool to room temperature. The fire loading was divided into three stages as follows (see Figure 6b):
  • The rising temperature stage: the furnace was heated up to 700 °C following the standard fire curve according to ASTM E119-20 [23].
  • The constant temperature stage: this stage occurred after the furnace reached the predetermined temperature (700 °C), and the specimen was exposed to this temperature for one hour.
  • Cooling stage: the furnace stopped working, and the specimens were left to cool to the ambient temperature.
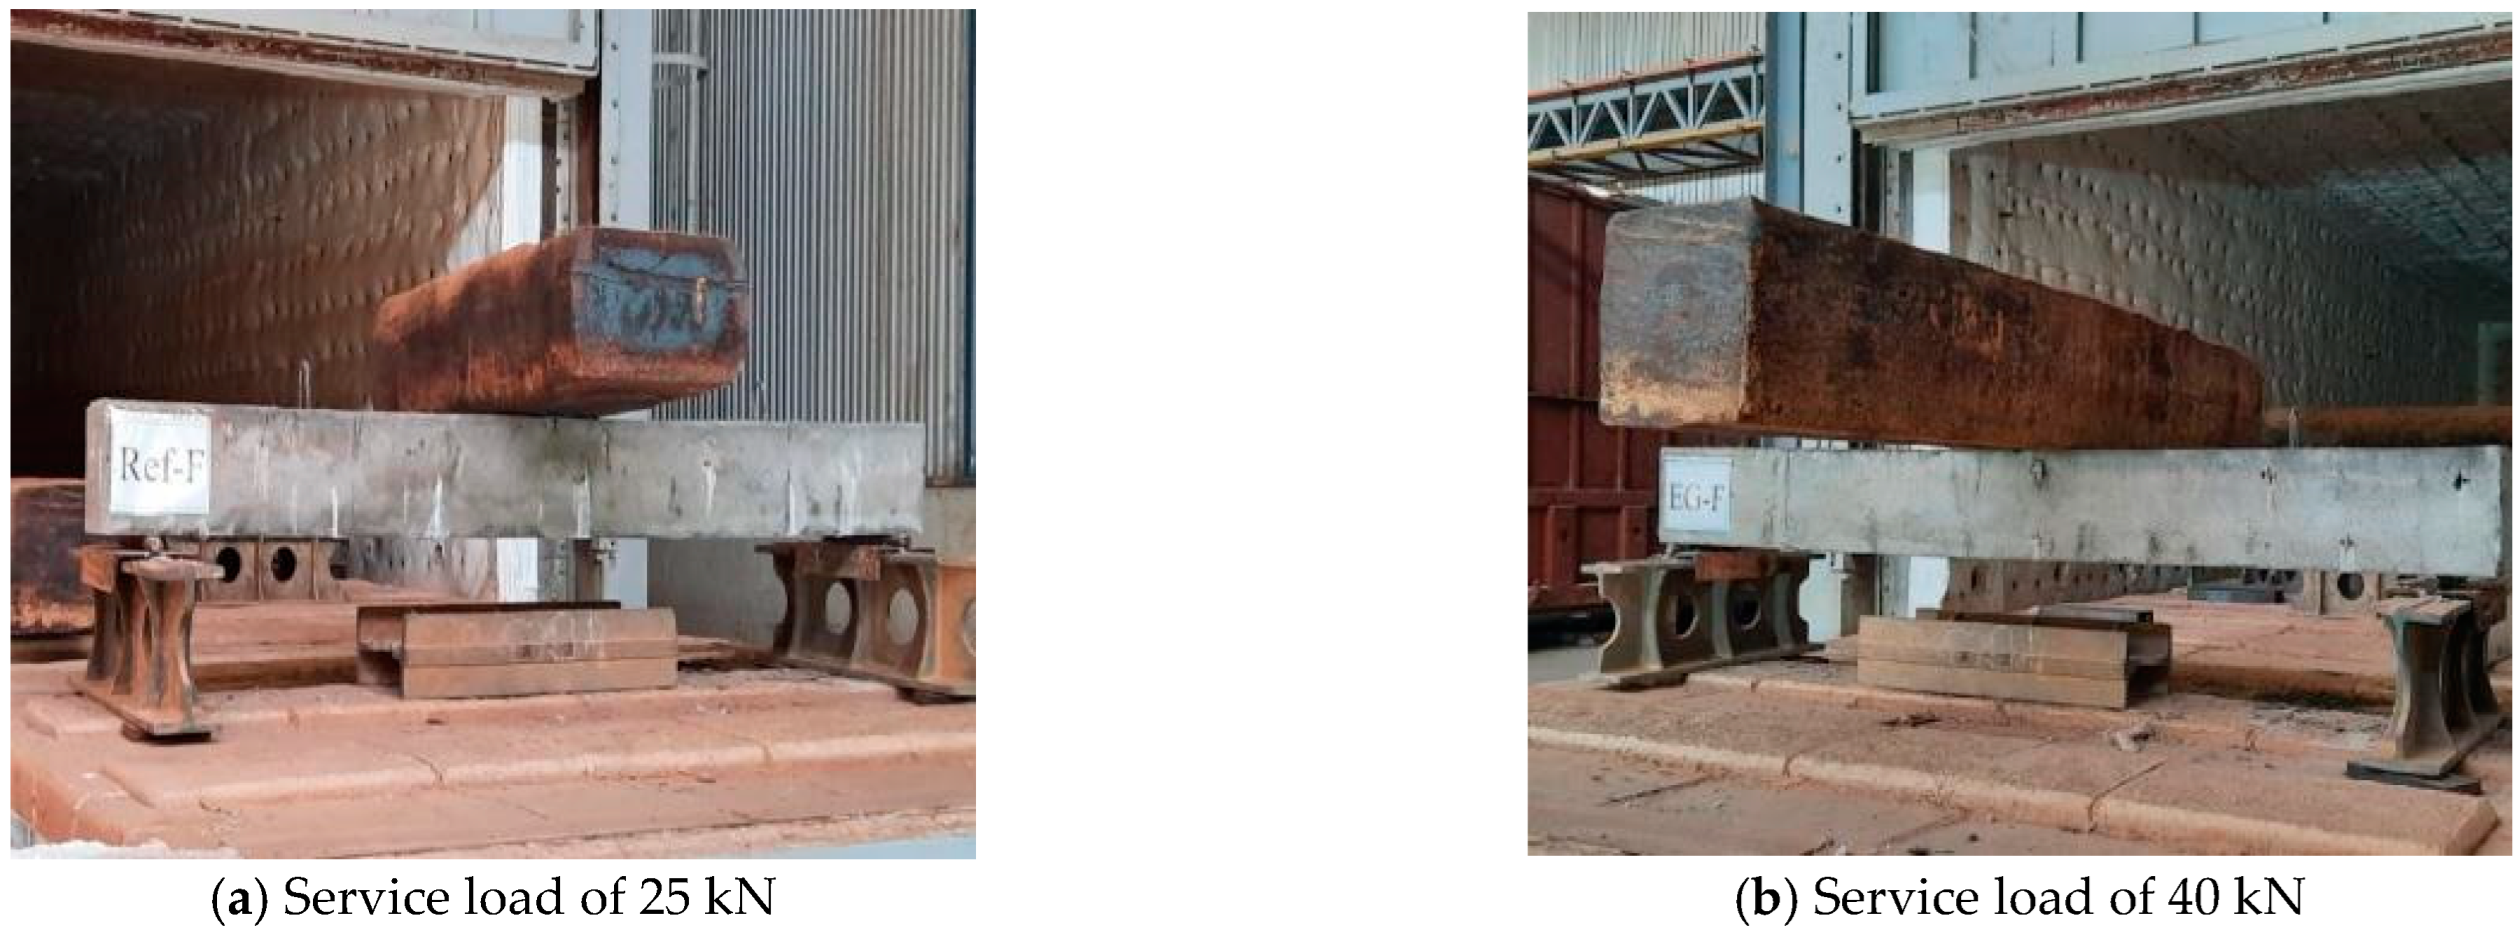
During fire loading, a service load of 25% of the ultimate static capacity of each specimen was applied [24,25]. Each beam had this service load applied at the midpoint of its span, and it remained there until the cooling phase, as shown in Figure 7. During fire loading, the mid-span deflection was recorded by using the Total Station device, which was directed to the mid-side of each specimen through a glass window in the furnace. Residual static tests were carried out on the burned beams of the second group (see Figure 5) to explore the residual behaviors and capacities of these beams. In these residual tests, the compressive strains in the extreme fibers of concrete were measured by using electrical strain gauges at the mid-spans.

3. Experimental Results and Discussion

3.1. Static Test Results

The beams of group one were statically tested and loaded under incremental concentrated load at the top face and mid-span up to post-failure. Table 5 lists the experimental results of these tests in terms of the initial crack, yield, and peak loads. The modes of failure are also presented. Improvements in the peak loads of 100.6% and 97.3% were obtained when shear connectors and web stiffeners were used, respectively, relative to the reference beam of this group of beams. However, the encased beam, EGSW-A, with shear connectors and stiffeners, obtained the highest peak load (130.8% higher than the reference beam) after exhibiting the same mode of failure as the other beams. Moreover, specimens EGS-A and EGW-A showed improvements in the peak loads after the inclusion of shear connectors and stiffeners, respectively. Improving the shear connection between the pultruded GFRP beam and concrete played a vital role in enhancing the peak loads of these beams.

3.2. Fire Test Results

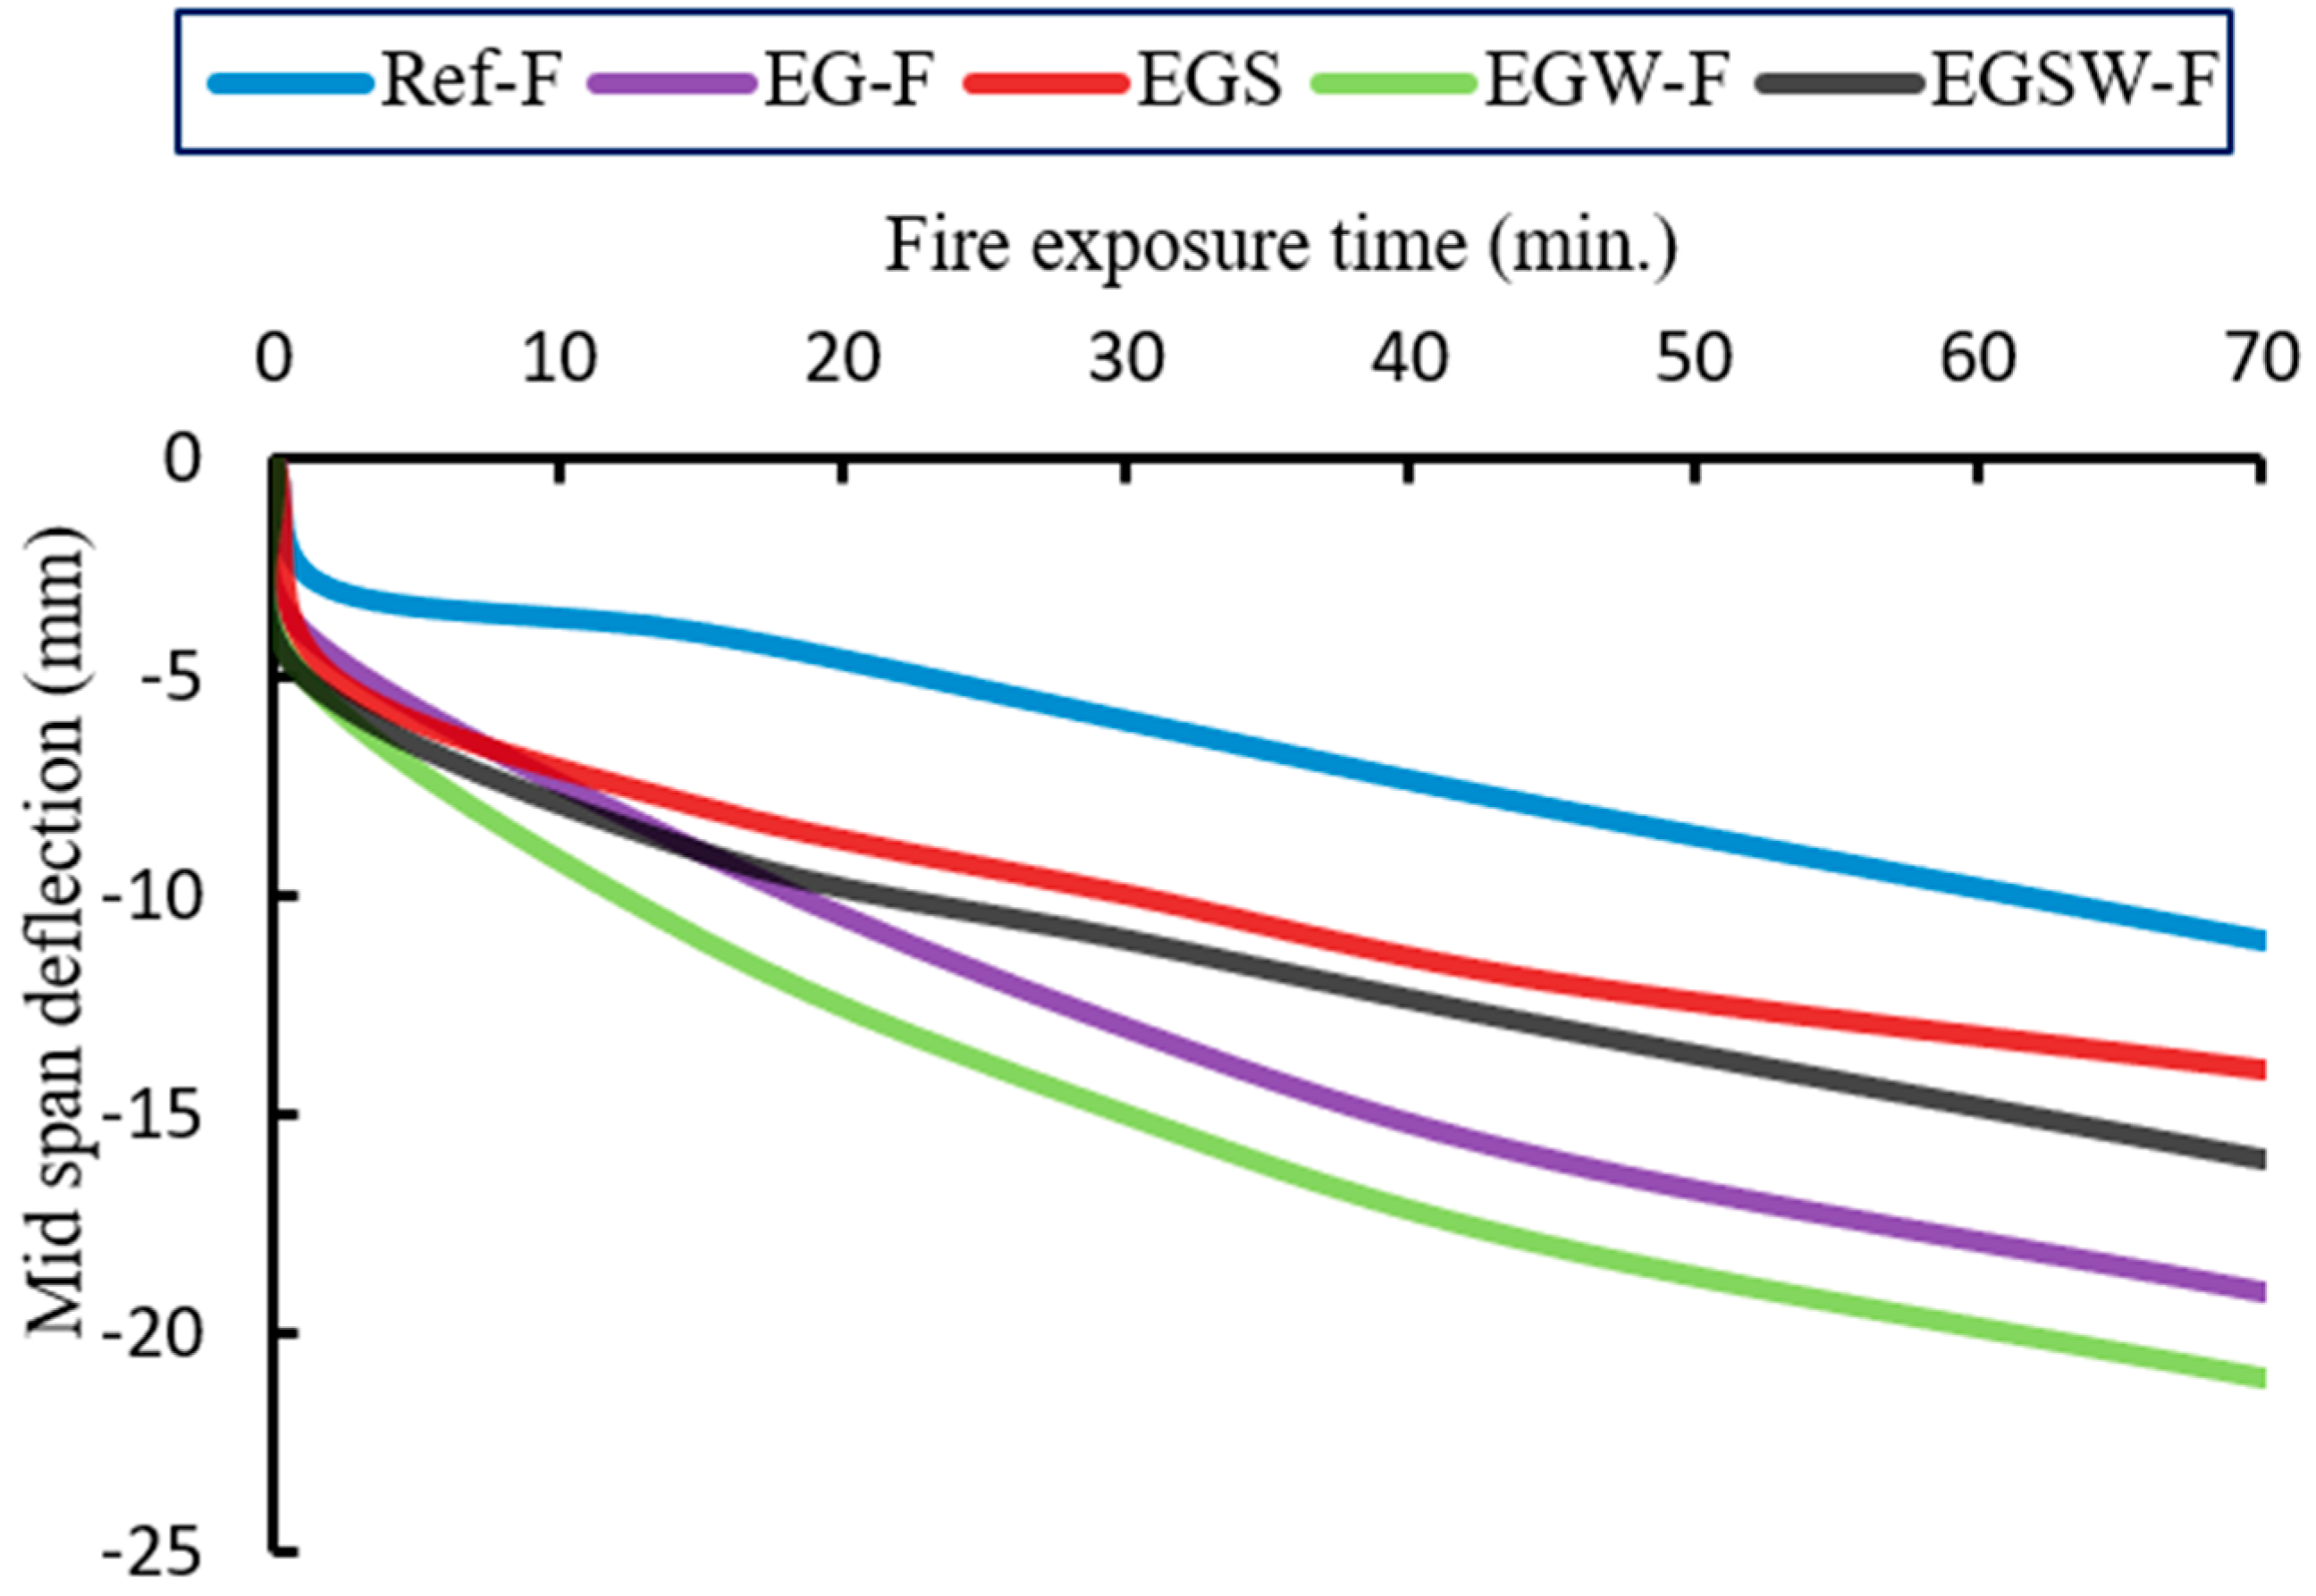
The initial mid-span displacements were recorded when the service loads were applied and before the fire loading, as listed in Table 6. These initial deflections were minimal and increased over time during the fire loading. The mid-span deflection versus the fire exposure time is plotted in Figure 8. During the early stages of the fire, the beams behaved consistently. Over the course of the exposure, both the mid-span deflections and specimen temperatures rose steadily. The tested beam stiffness was determined by dividing the applied load by the corresponding deflection during fire [2]. As the mechanical properties of the materials deteriorated over time, the effects of the fire loading and the different configurations of each beam caused variations in behavior. Therefore, the pultruded GFRP beams exhibited more deterioration relative to the reference beam, which caused more reductions in stiffness and increased the thermal deflections.
As soon as the fire temperature entered the cooling stage, the temperatures measured at the exposed surfaces of the burned beams began to drop. The temperature of the inner layers of concrete continued to increase even after turning off the furnace because of the high thermal inertia of the concrete. The fire loading entered the cooling stage after 70 min, and the burned beams did not fail during the fire. During the cooling phase, most mid-span deflections recovered. This is due to the strength and modulus properties of the steel and concrete reinforcement recovering after the fire loading was removed. However, the recovery rate of beam EGW-F was slower than that of the other beams. This difference was caused by the concrete’s configuration and the thermal strains that it experienced due to its relatively higher service load. The beams reached a steady state concerning any residual deformations once they returned to room temperature (see Table 6). The irreversible temperature-induced damage to steel, GFRP, and concrete as well as the lingering stresses and strains from plastic deformations in these beams even after they have cooled to room temperature are the causes of these residual deformations. The specimens’ surfaces did not show any significant deterioration or fragmentation. Thermal cracks did, however, develop during the fire loading.

3.3. Residual Static Capacity of the Burned Beams

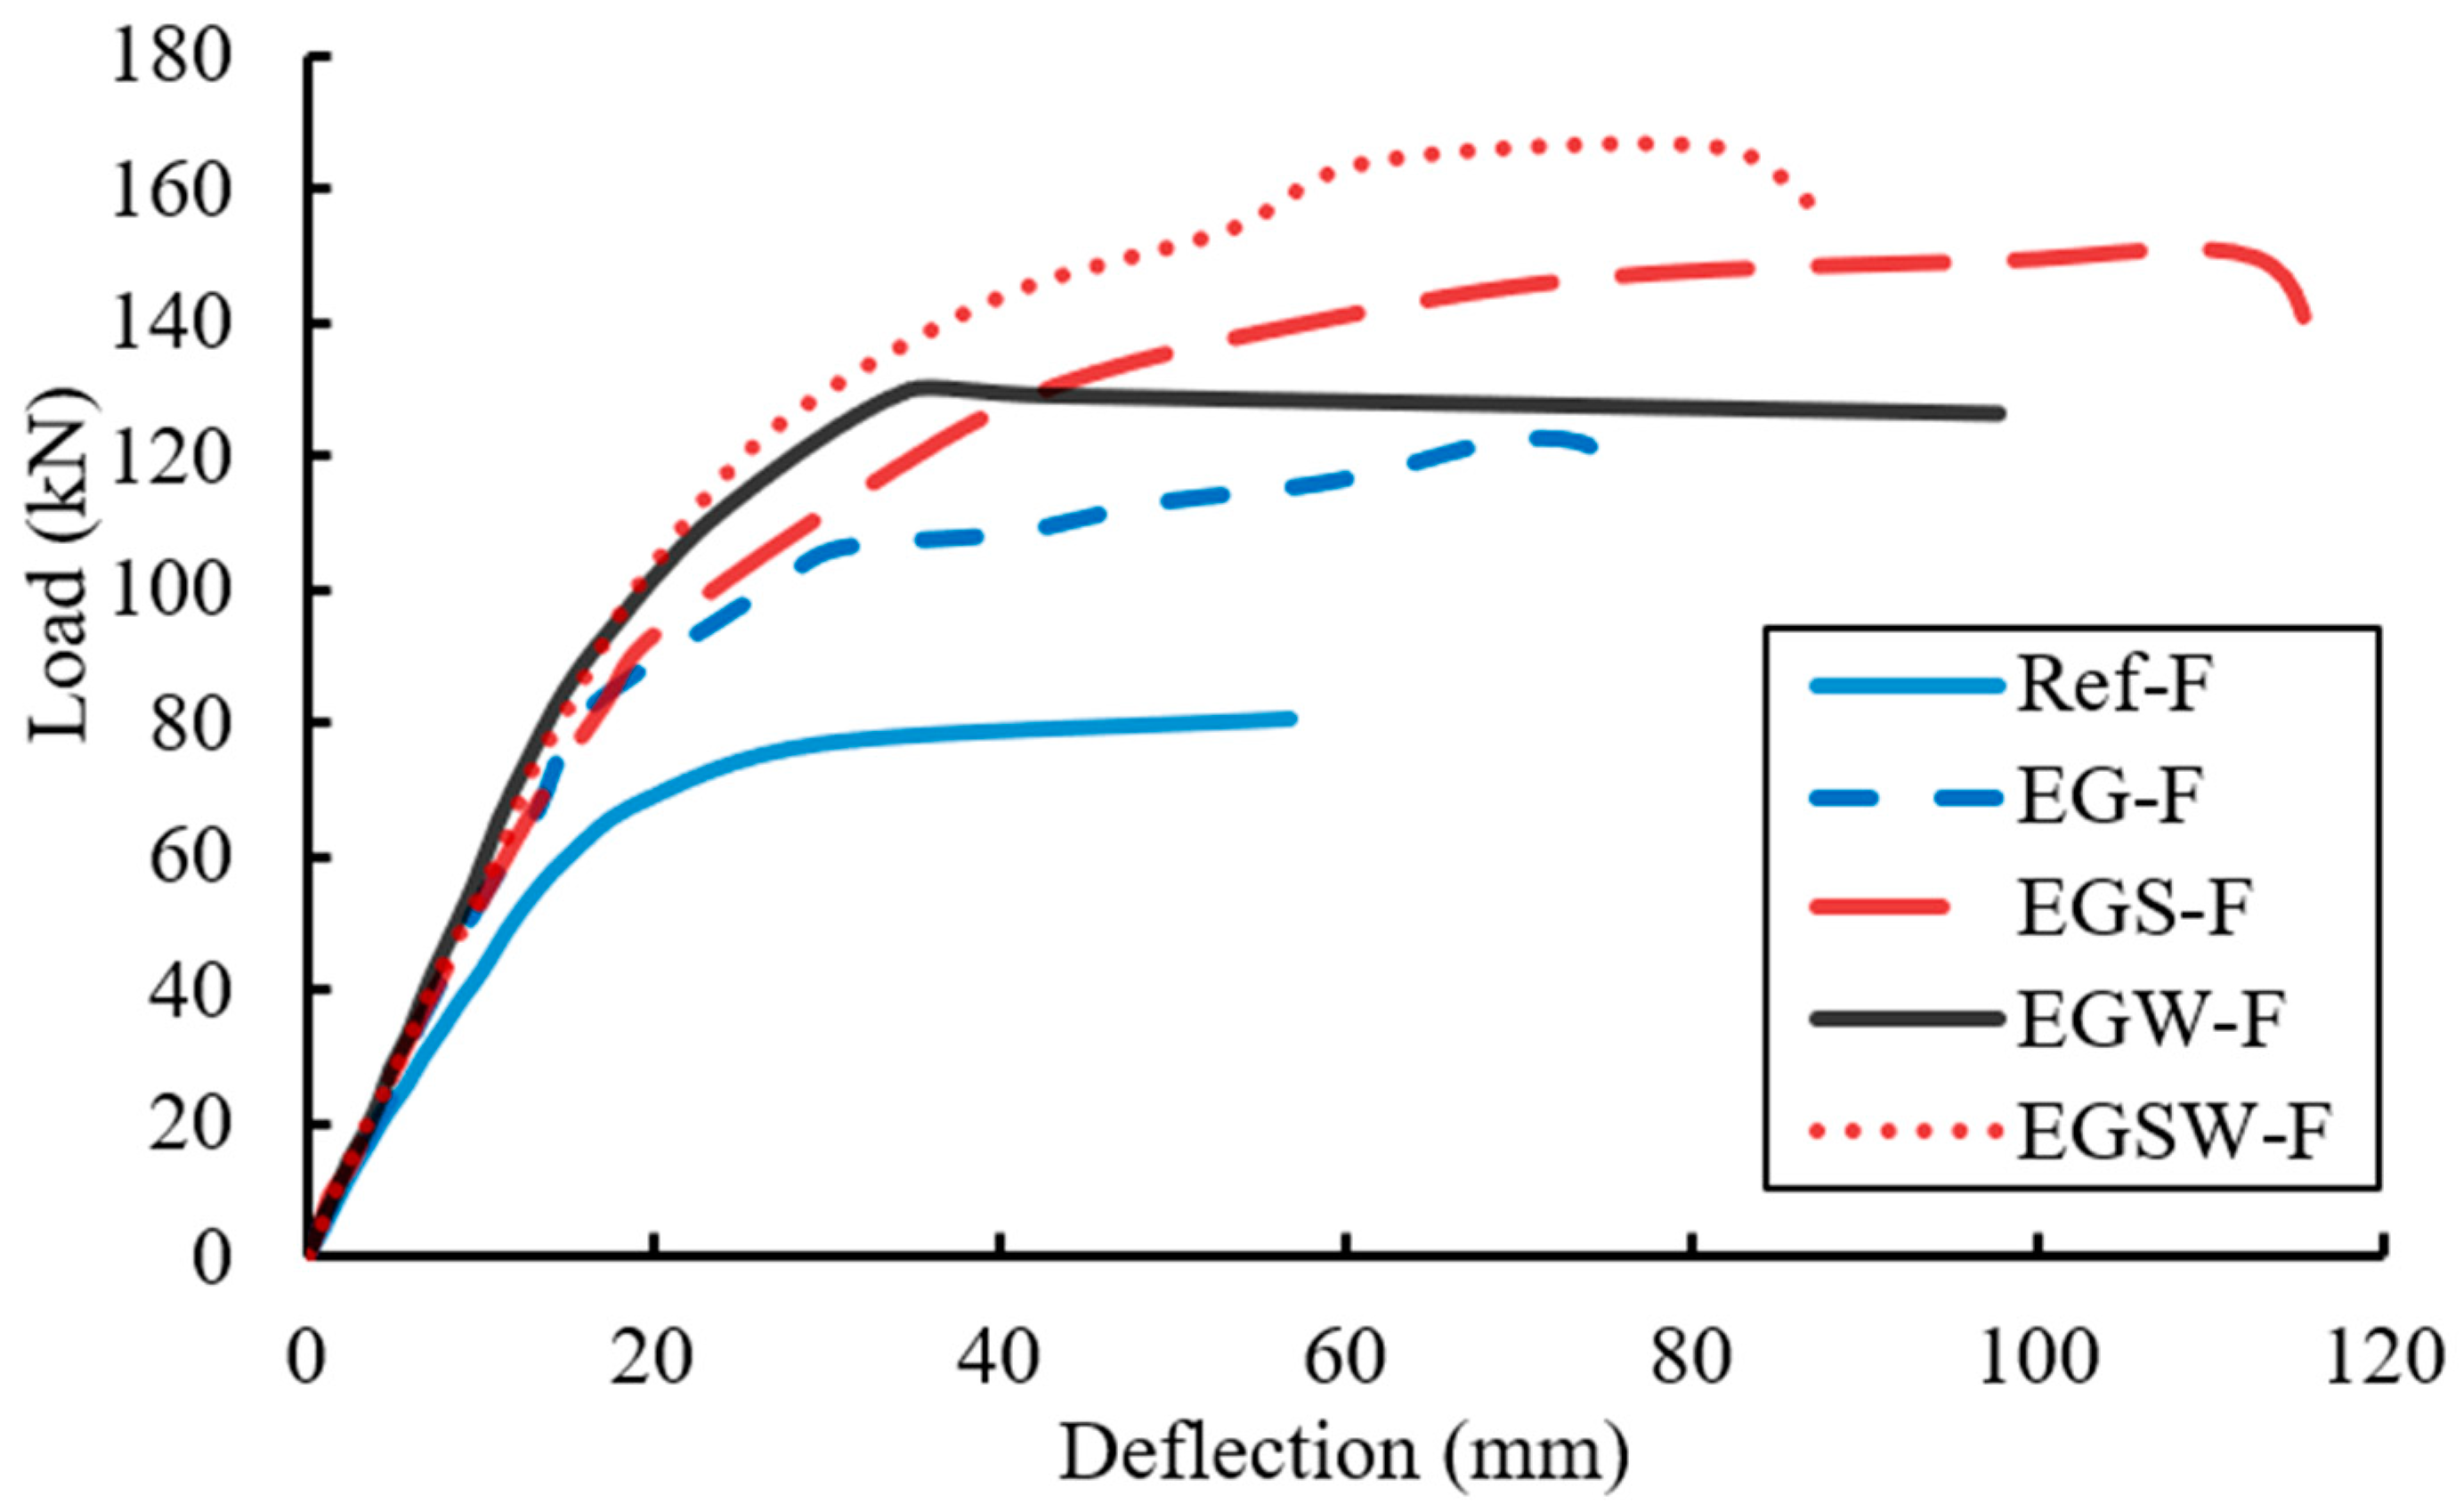
By applying gradual loads until failure, the residual capacities of the fire-damaged beams were statically determined. The load-bearing capacity of fire-damaged beams is shown in Figure 9. The final loads for beams EG-F, EGS-F, EGW-F, and EGSW-F were 122.1 kN, 149.6 kN, 130.1 kN, and 166.2 kN, respectively. Table 7 illustrates the burned beams’ flexural response. Significantly, there were higher yielding loads than the reference specimen of 40%, 55%, 58%, and 79% for the fire-damaged beams EG-F, EGS-F, EGW-F, and EGSW-F, respectively. Due to prior exposure to high temperatures, the fire-damaged beams degraded in the first phase.
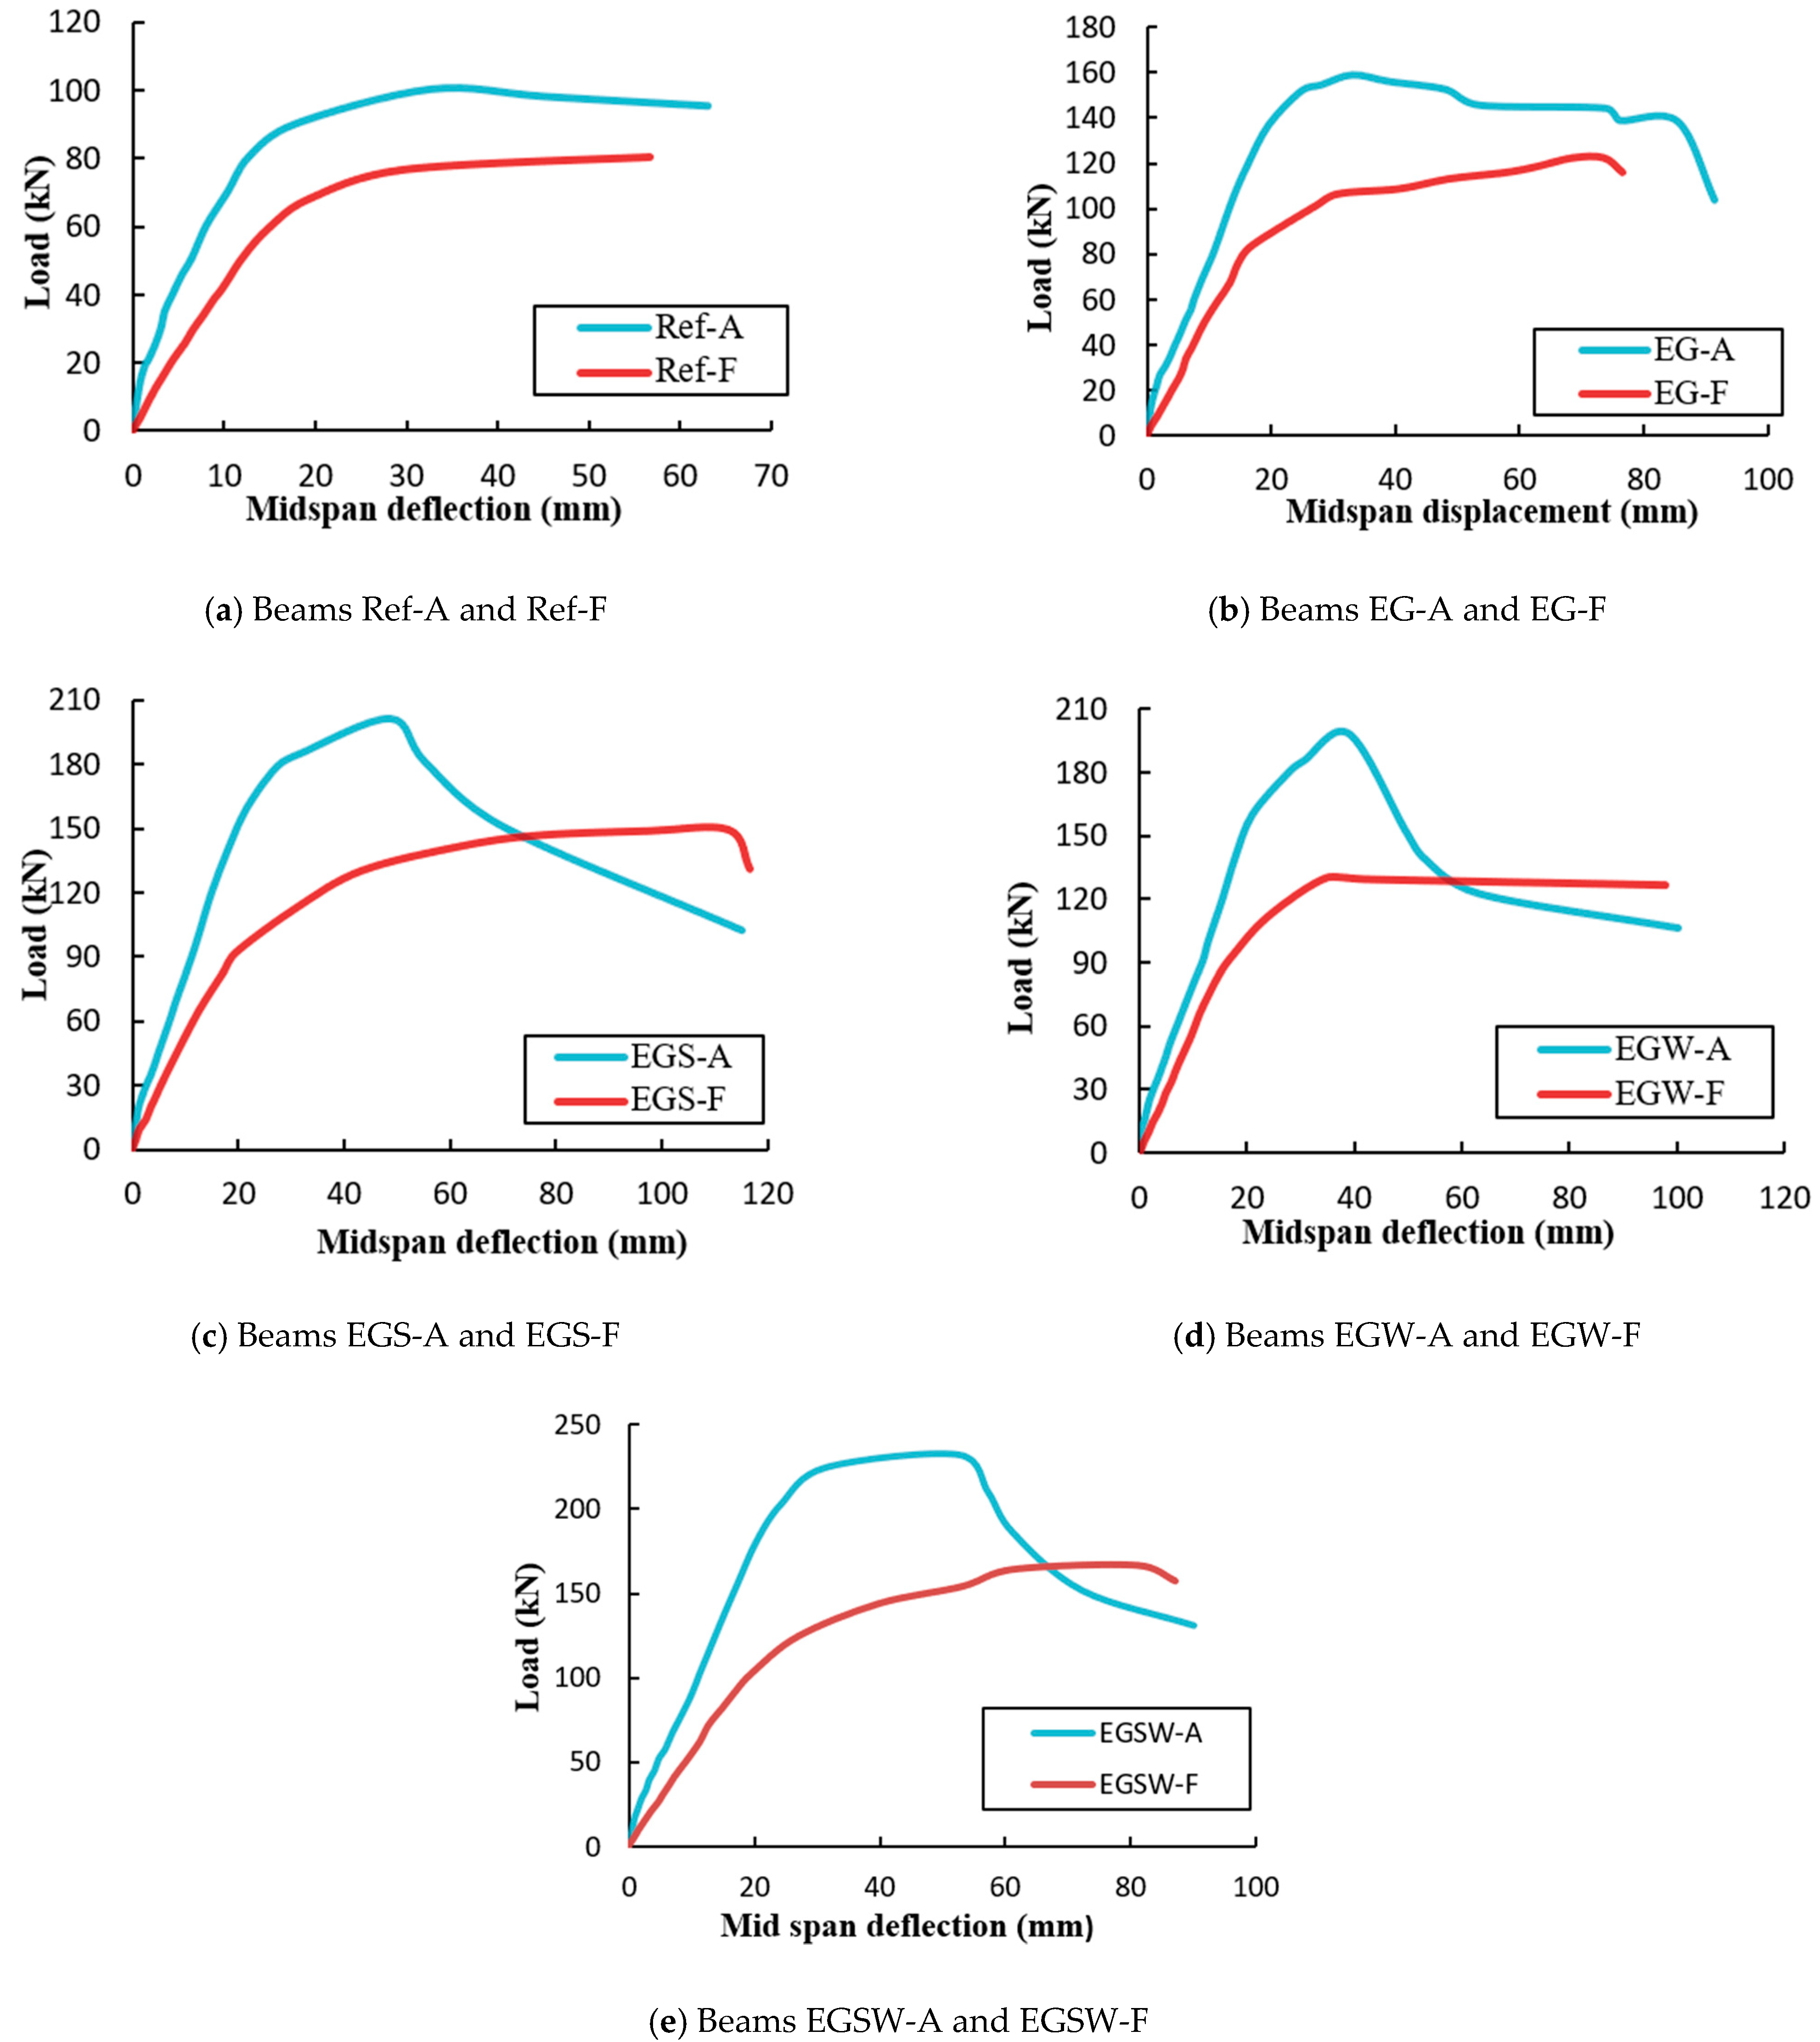
Comparisons between the fire-damaged beams and their unburned peers are shown in Figure 10 to emphasize the residual strength and deformation of these beams. Based on these comparisons, the encased fire-damaged GFRP beams exhibited more reductions in the residual behavior relative to the reference beam. Moreover, severe damage occurred when including the shear connectors and stiffeners, which led to more reductions in the residual behavior of the burned beams as listed in Table 8. The fire loading caused losses in the bond strength between the GFRP beams and concrete as well as between the shear connectors, stiffeners, and concrete, which led to the concrete cover splitting and more cracks appearing.

3.4. Crack Patterns and Failure Modes of the Burned Beams

In the bending zone, flexural cracks developed and spread. Limited flexural shear cracks formed throughout the two shear spans in the encased beams. The flexural zone had widening cracks as the applied load increased. The reference specimen Ref-F failure mode involved yielding in the steel reinforcement followed by a rupture in these rebars without concrete crushing, as shown in Figure 11. This sudden failure split the reference beam into two halves.
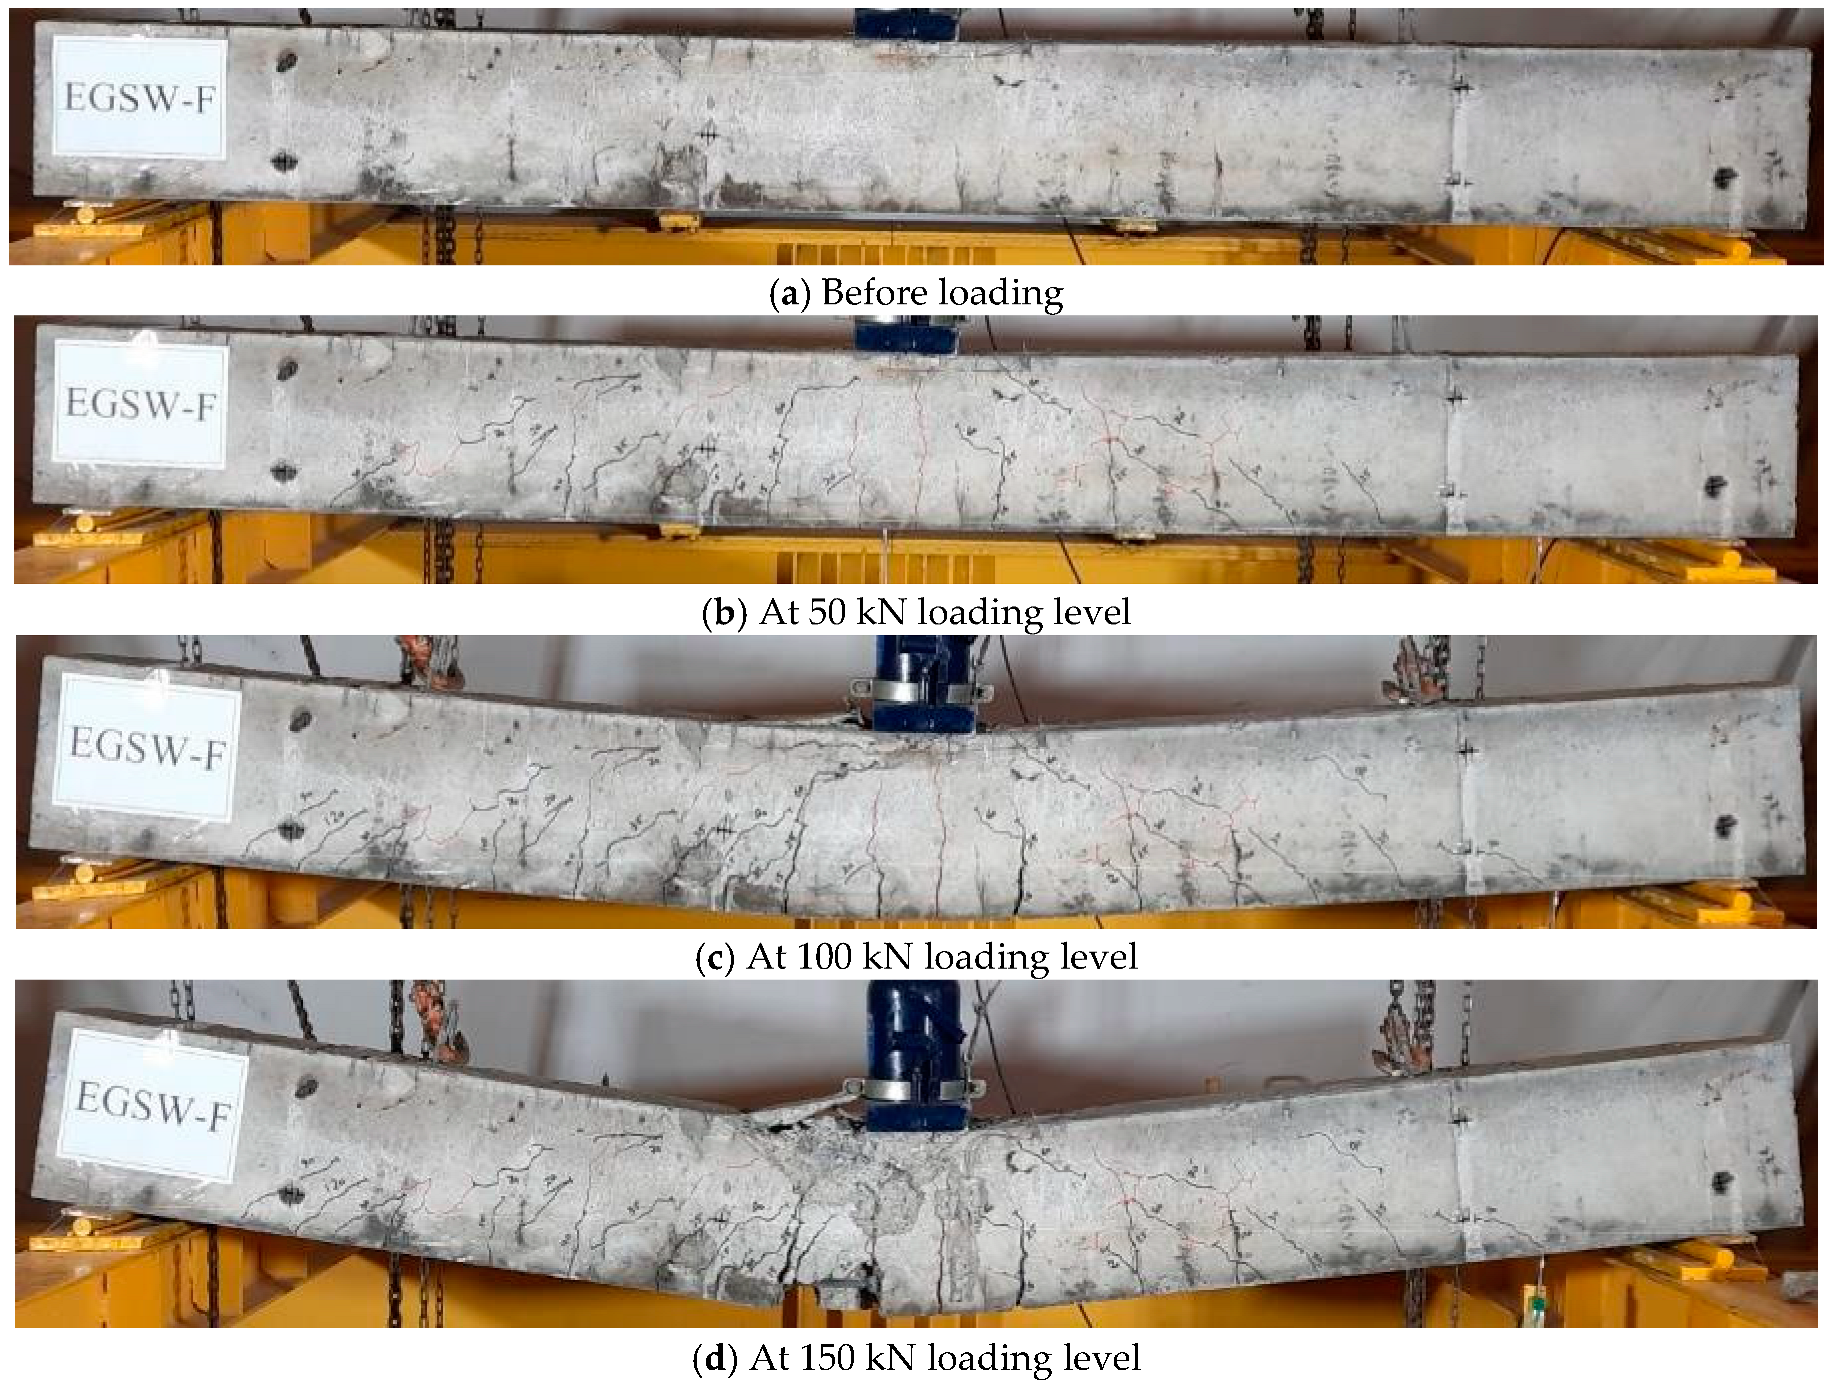
Thermal cracks appeared on the concrete surfaces during fire loading, as seen in Figure 12a. Therefore, unclear early cracks did not appear. At failure, the GFRP beams ruptured from the tension side with a loud noise after yielding in the steel reinforcement, and then the concrete in the compression zone was crushed. The embedded GFRP beams ruptured on the tension side and the compression side was functioning. Therefore, the encased specimens were not separated into two halves as observed in the reference beam. Figure 12 presents the fracture progression at various loading stages for specimen EGSW-F.

3.5. Ductility

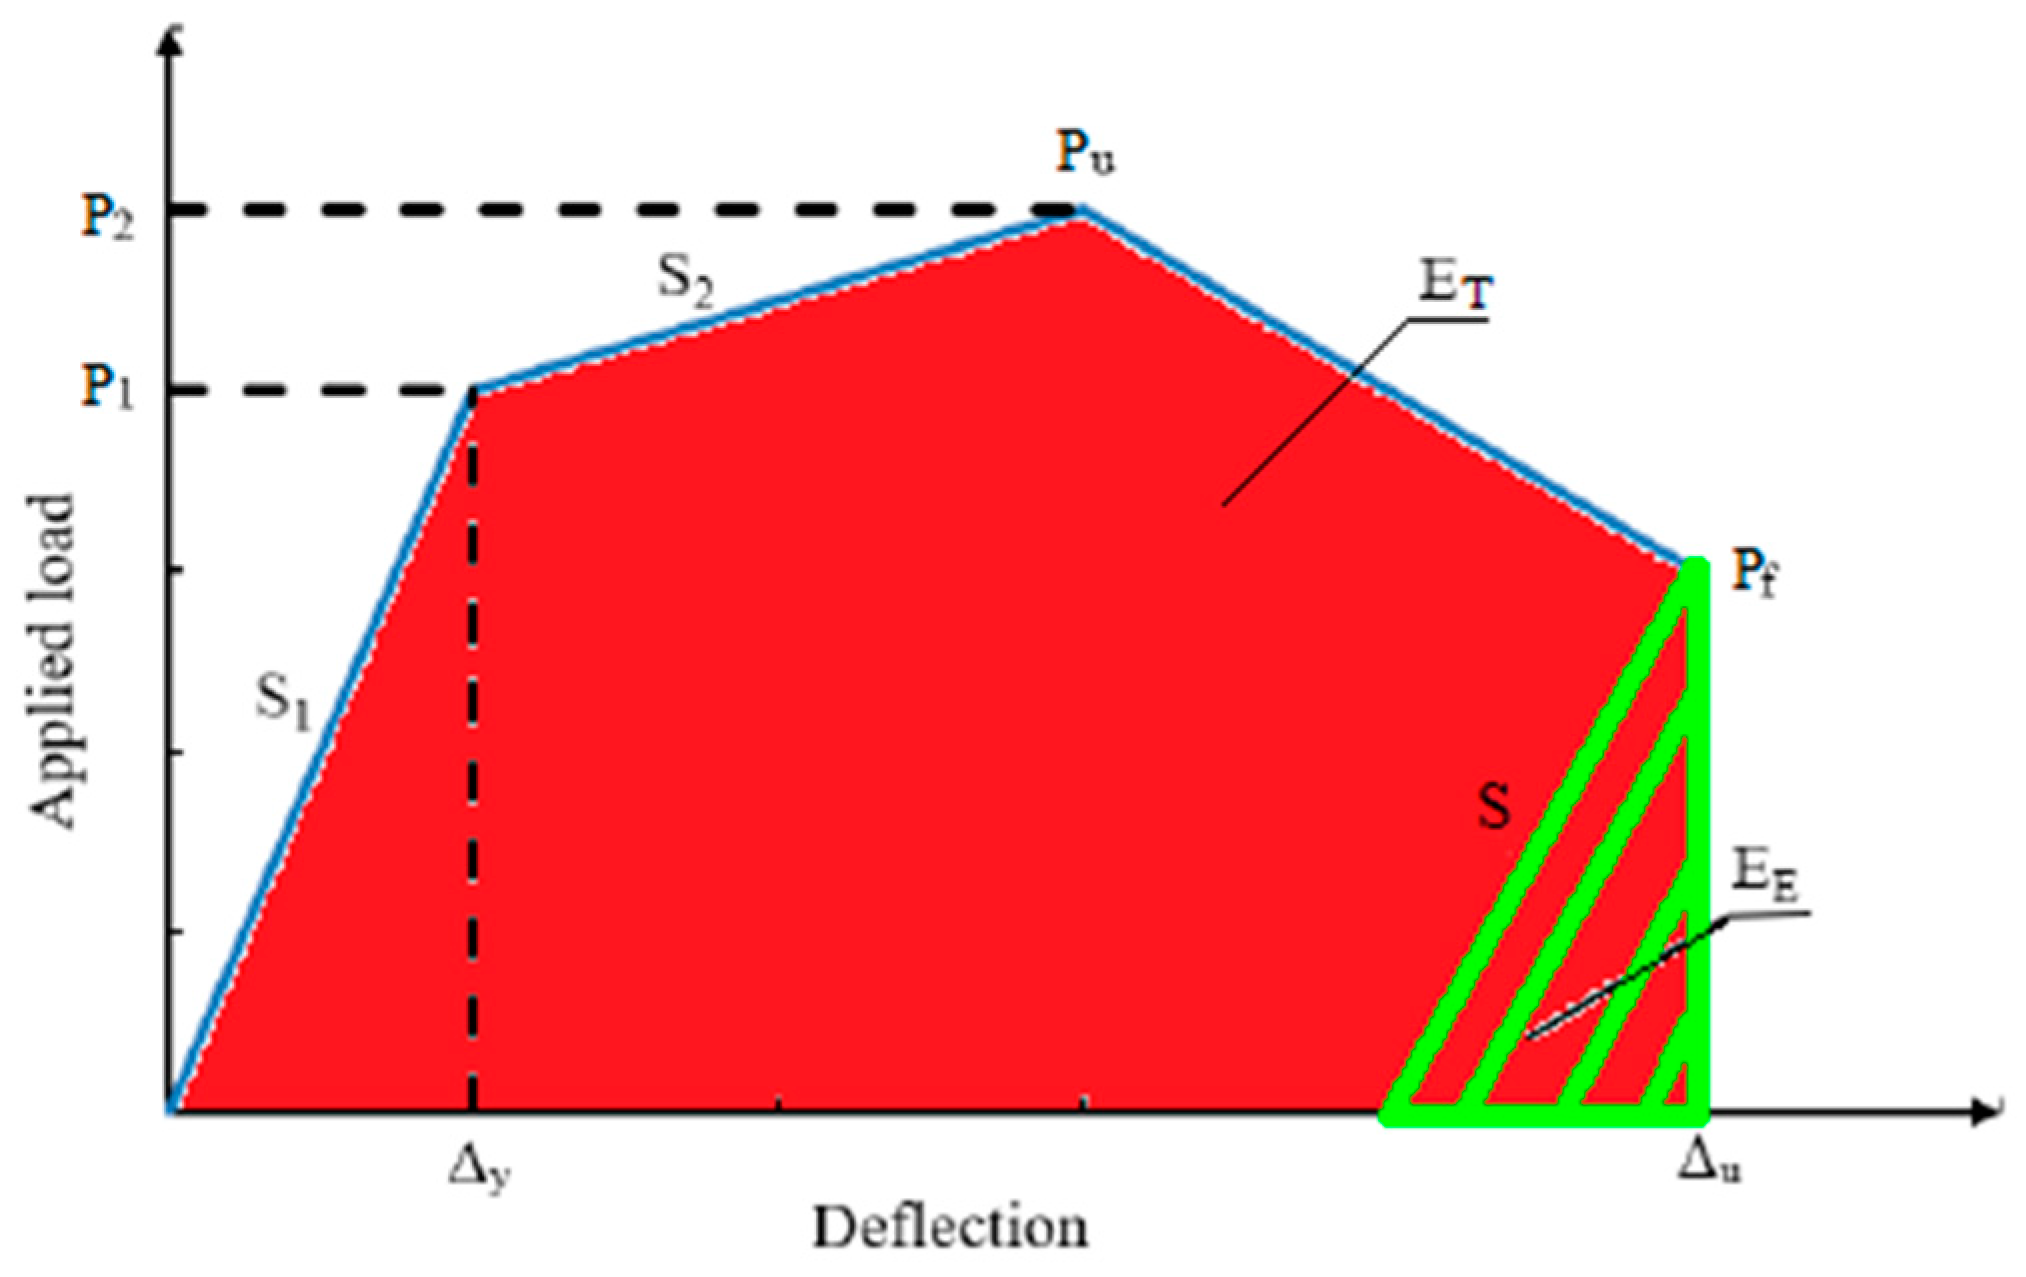
The FRP materials have a linear stress-strain relation up to failure and the energy released is linear. Therefore, energy theory was used to provide the foundation for ductility in this work [26]. To investigate the ductility behavior of the tested beams, the elastic behaviors of the specimens were investigated by creating two piecewise linear best fits to the load-deflection envelopes [26], as shown in Figure 13. In the first branch, the stiffness S1 was the slope of the startup curve, which occurred before the yielding of the steel reinforcement. The stiffness S2 was the slope of the curve, which occurred after the yielding of the steel reinforcement until the peak loads (see Figure 13). Using Equation (1) and the recorded load-deflection relationships, ductility (μE) was computed as follows:
μ E   = 1 2   ( E T E E + 1 )
where ET is the total energy determined from the area under the load-deflection relation, and EE is the stored elastic energy computed from the load-deflection curve as illustrated in Figure 13. The slope (S) was determined as:
S =   ( P 1   S 1 + ( P 2 P 1 ) S 2 P 2 )
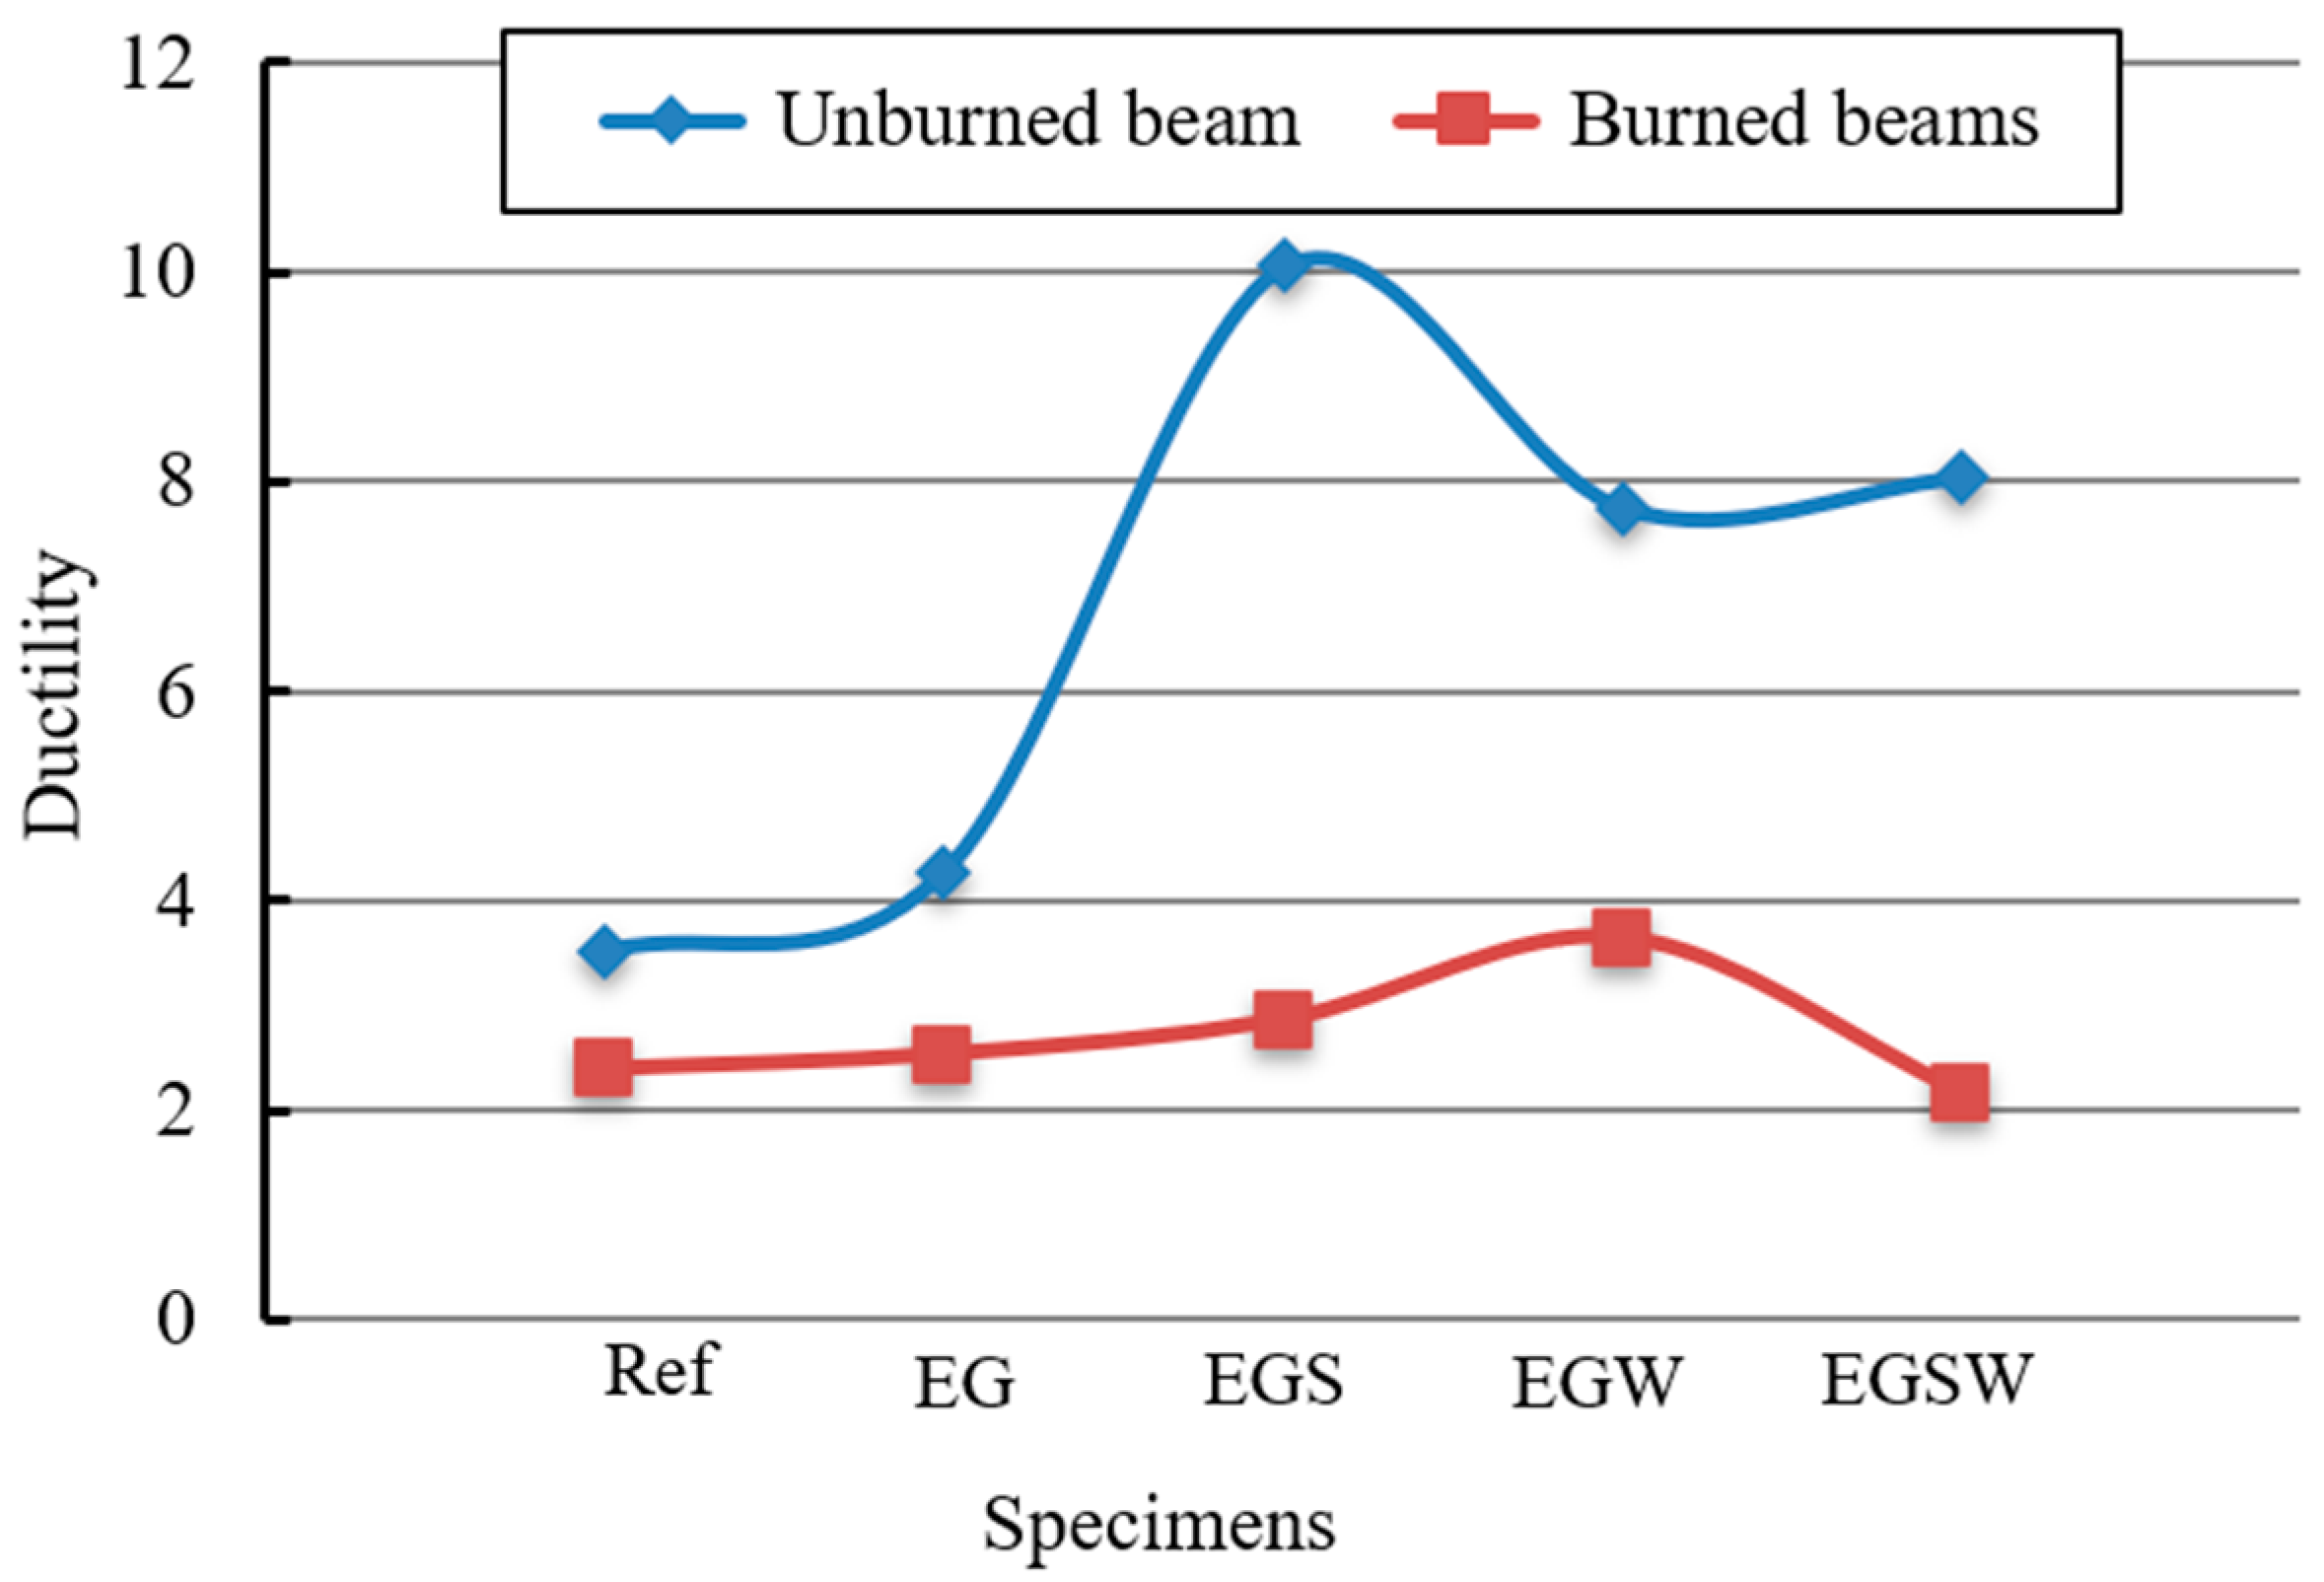
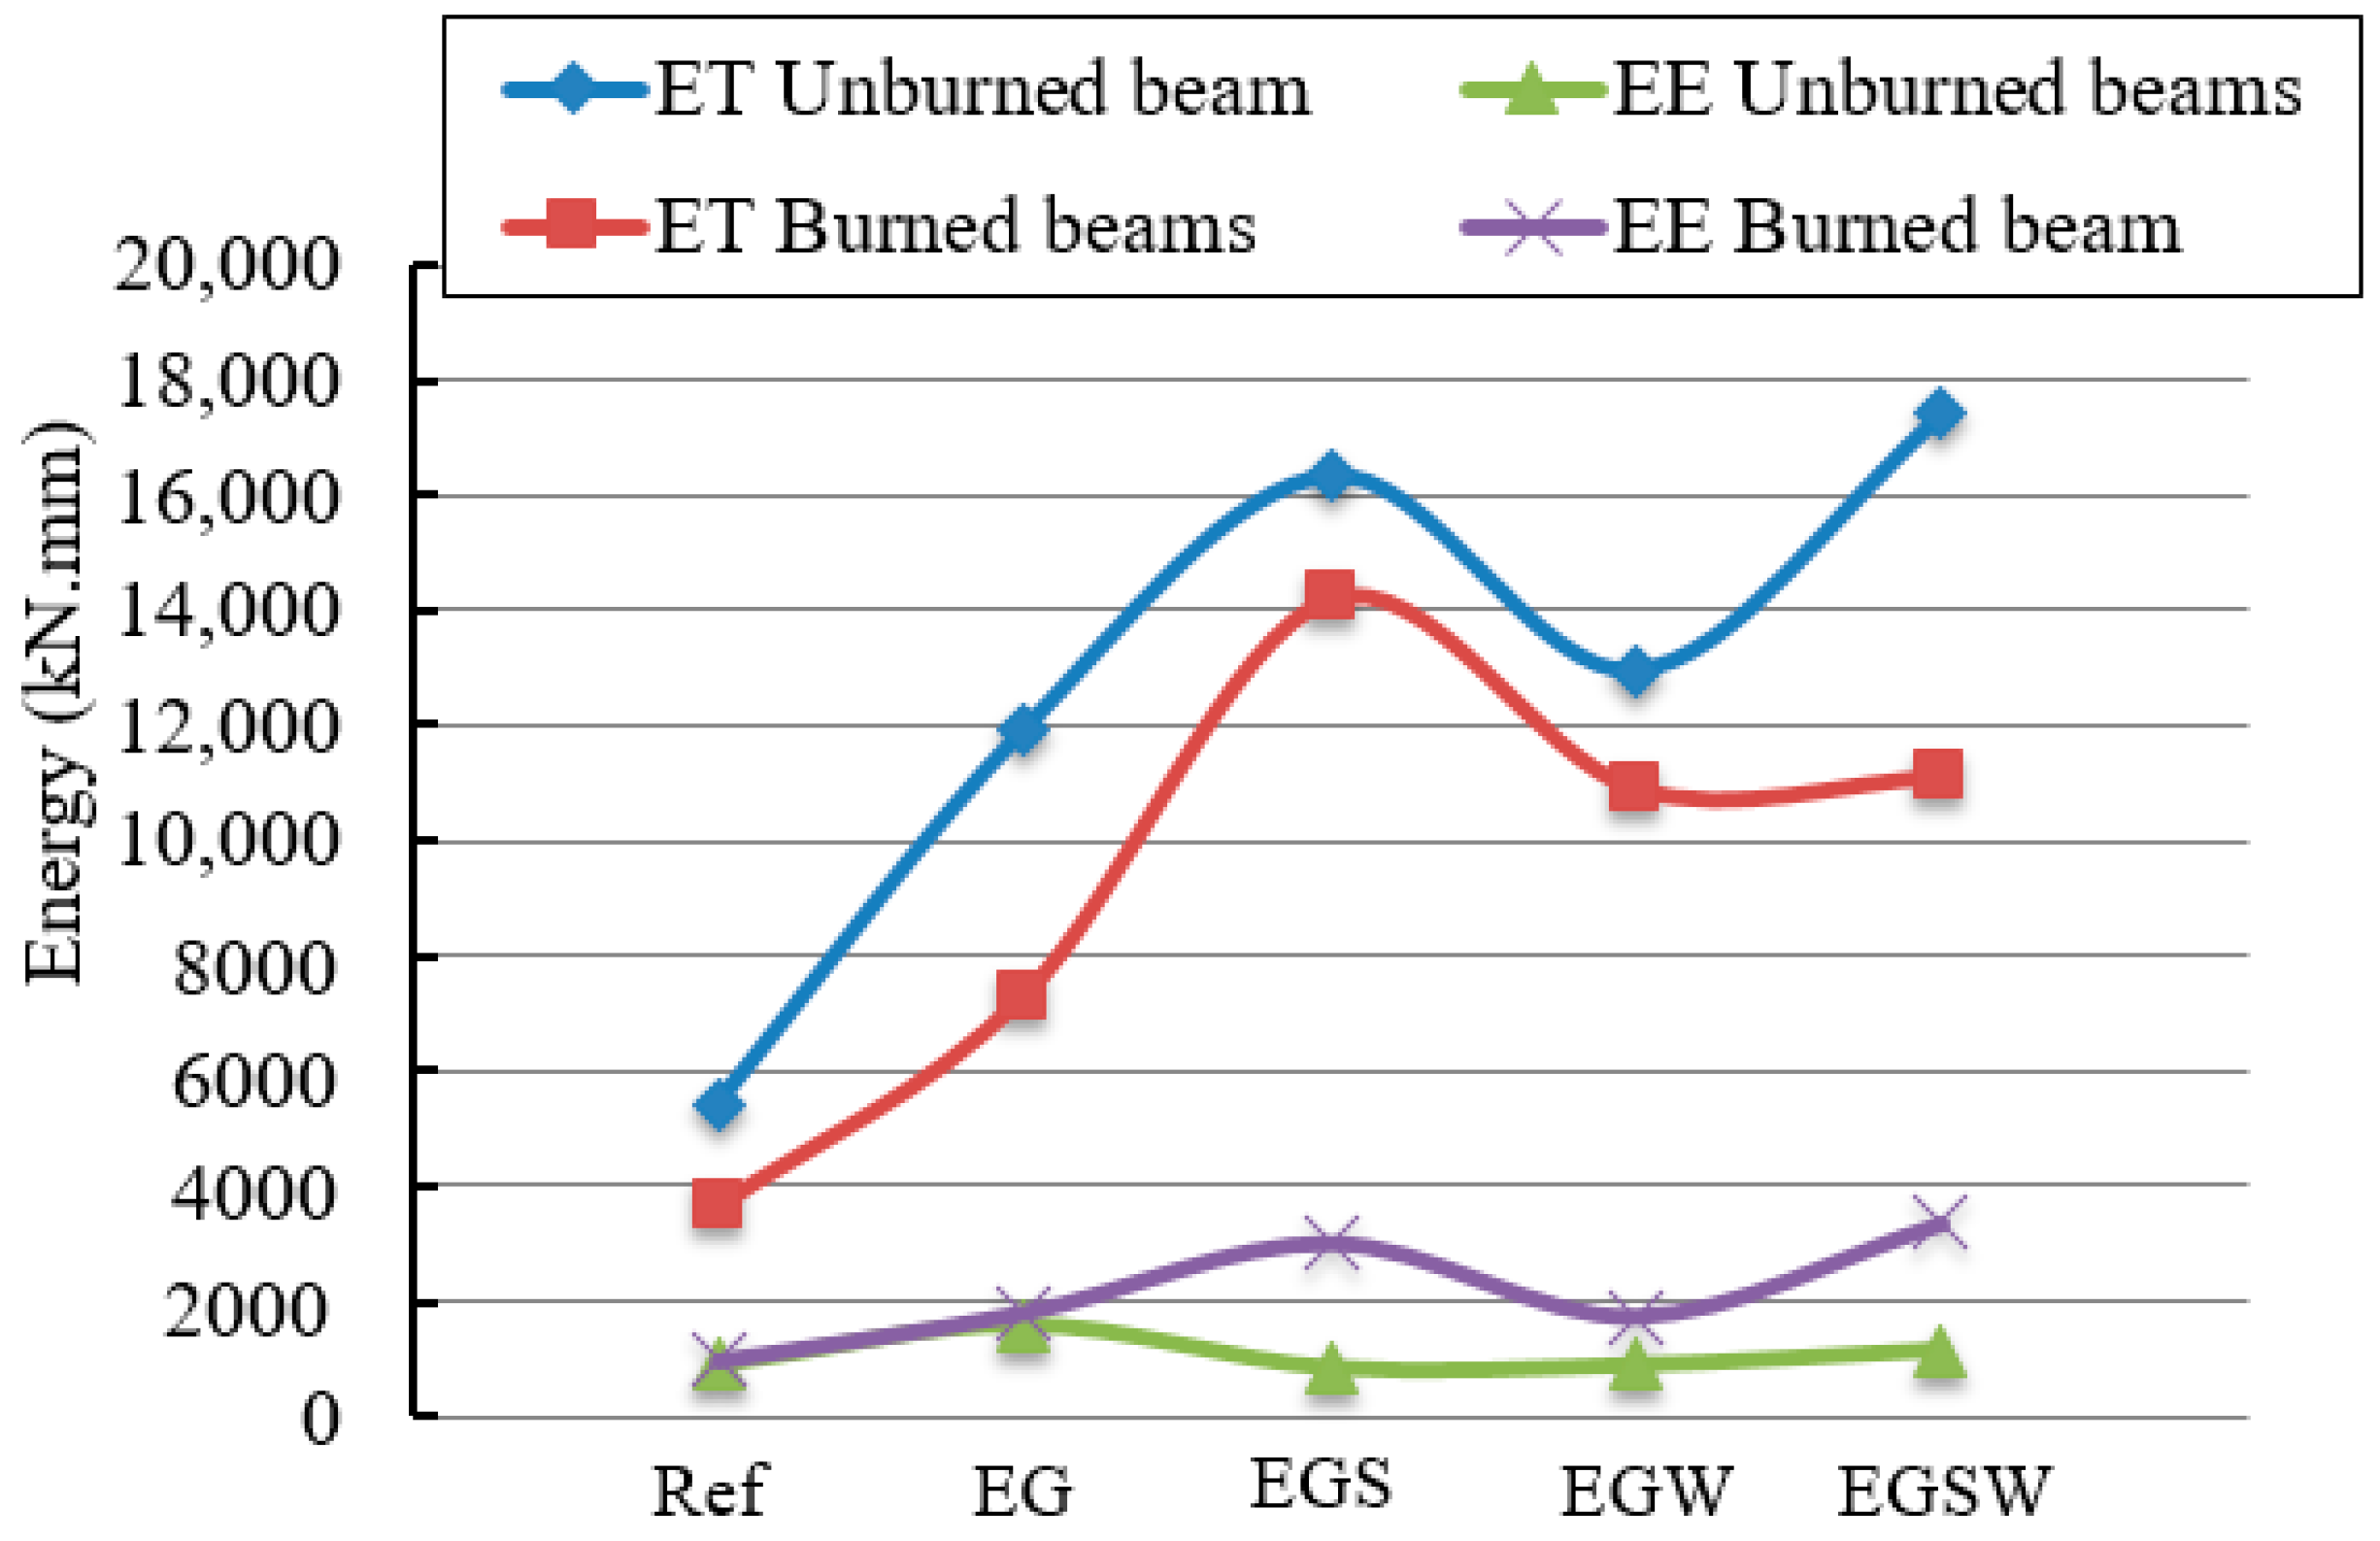
where   S 1   is the slope of the elastic stage, P 1   is the load at the end of the elastic stage,   S 2 is the slope of the second line, and   P 2   is the peak load at the end of the second line. The total energy, elastic energy, and ductility of the tested beams (unburned and burned beams) are listed in Table 9 and Table 10. The ductility of specimens Ref-A and Ref-F were 3.52 and 2.39, which were less than the corresponding encased beams. For unburned beams, the GFRP beams enhanced the ductility by 21.6% relative to beam Ref-A. Moreover, the shear connectors, web stiffeners, and both improved the ductility by 134.8%, 80.8%, and 87.9%, respectively, relative to the encased beam EG-A. The difference in ductility of the fire-damaged beams increased by 19.7% and 52.3% for beams EGS-F and EGW-F, and decreased by 9.6% when adding shear connectors with web stiffeners for beam EGSW-F. Providing shear connectors and web stiffeners at the same time caused more damage in the burned beam EGSW-F and subsequently a reduction in ductility.
Comparisons between the ductility of the fire-damaged beams and their unburned peers are listed in Table 10 and illustrated in Figure 14 and Figure 15. The encased beams EG-A and EG-F exhibited the least difference in ductility by 40.9% for the encased beams. However, this difference increased when using shear connectors and web stiffeners, especially when using both of them at the same time.

4. Finite Element Analysis

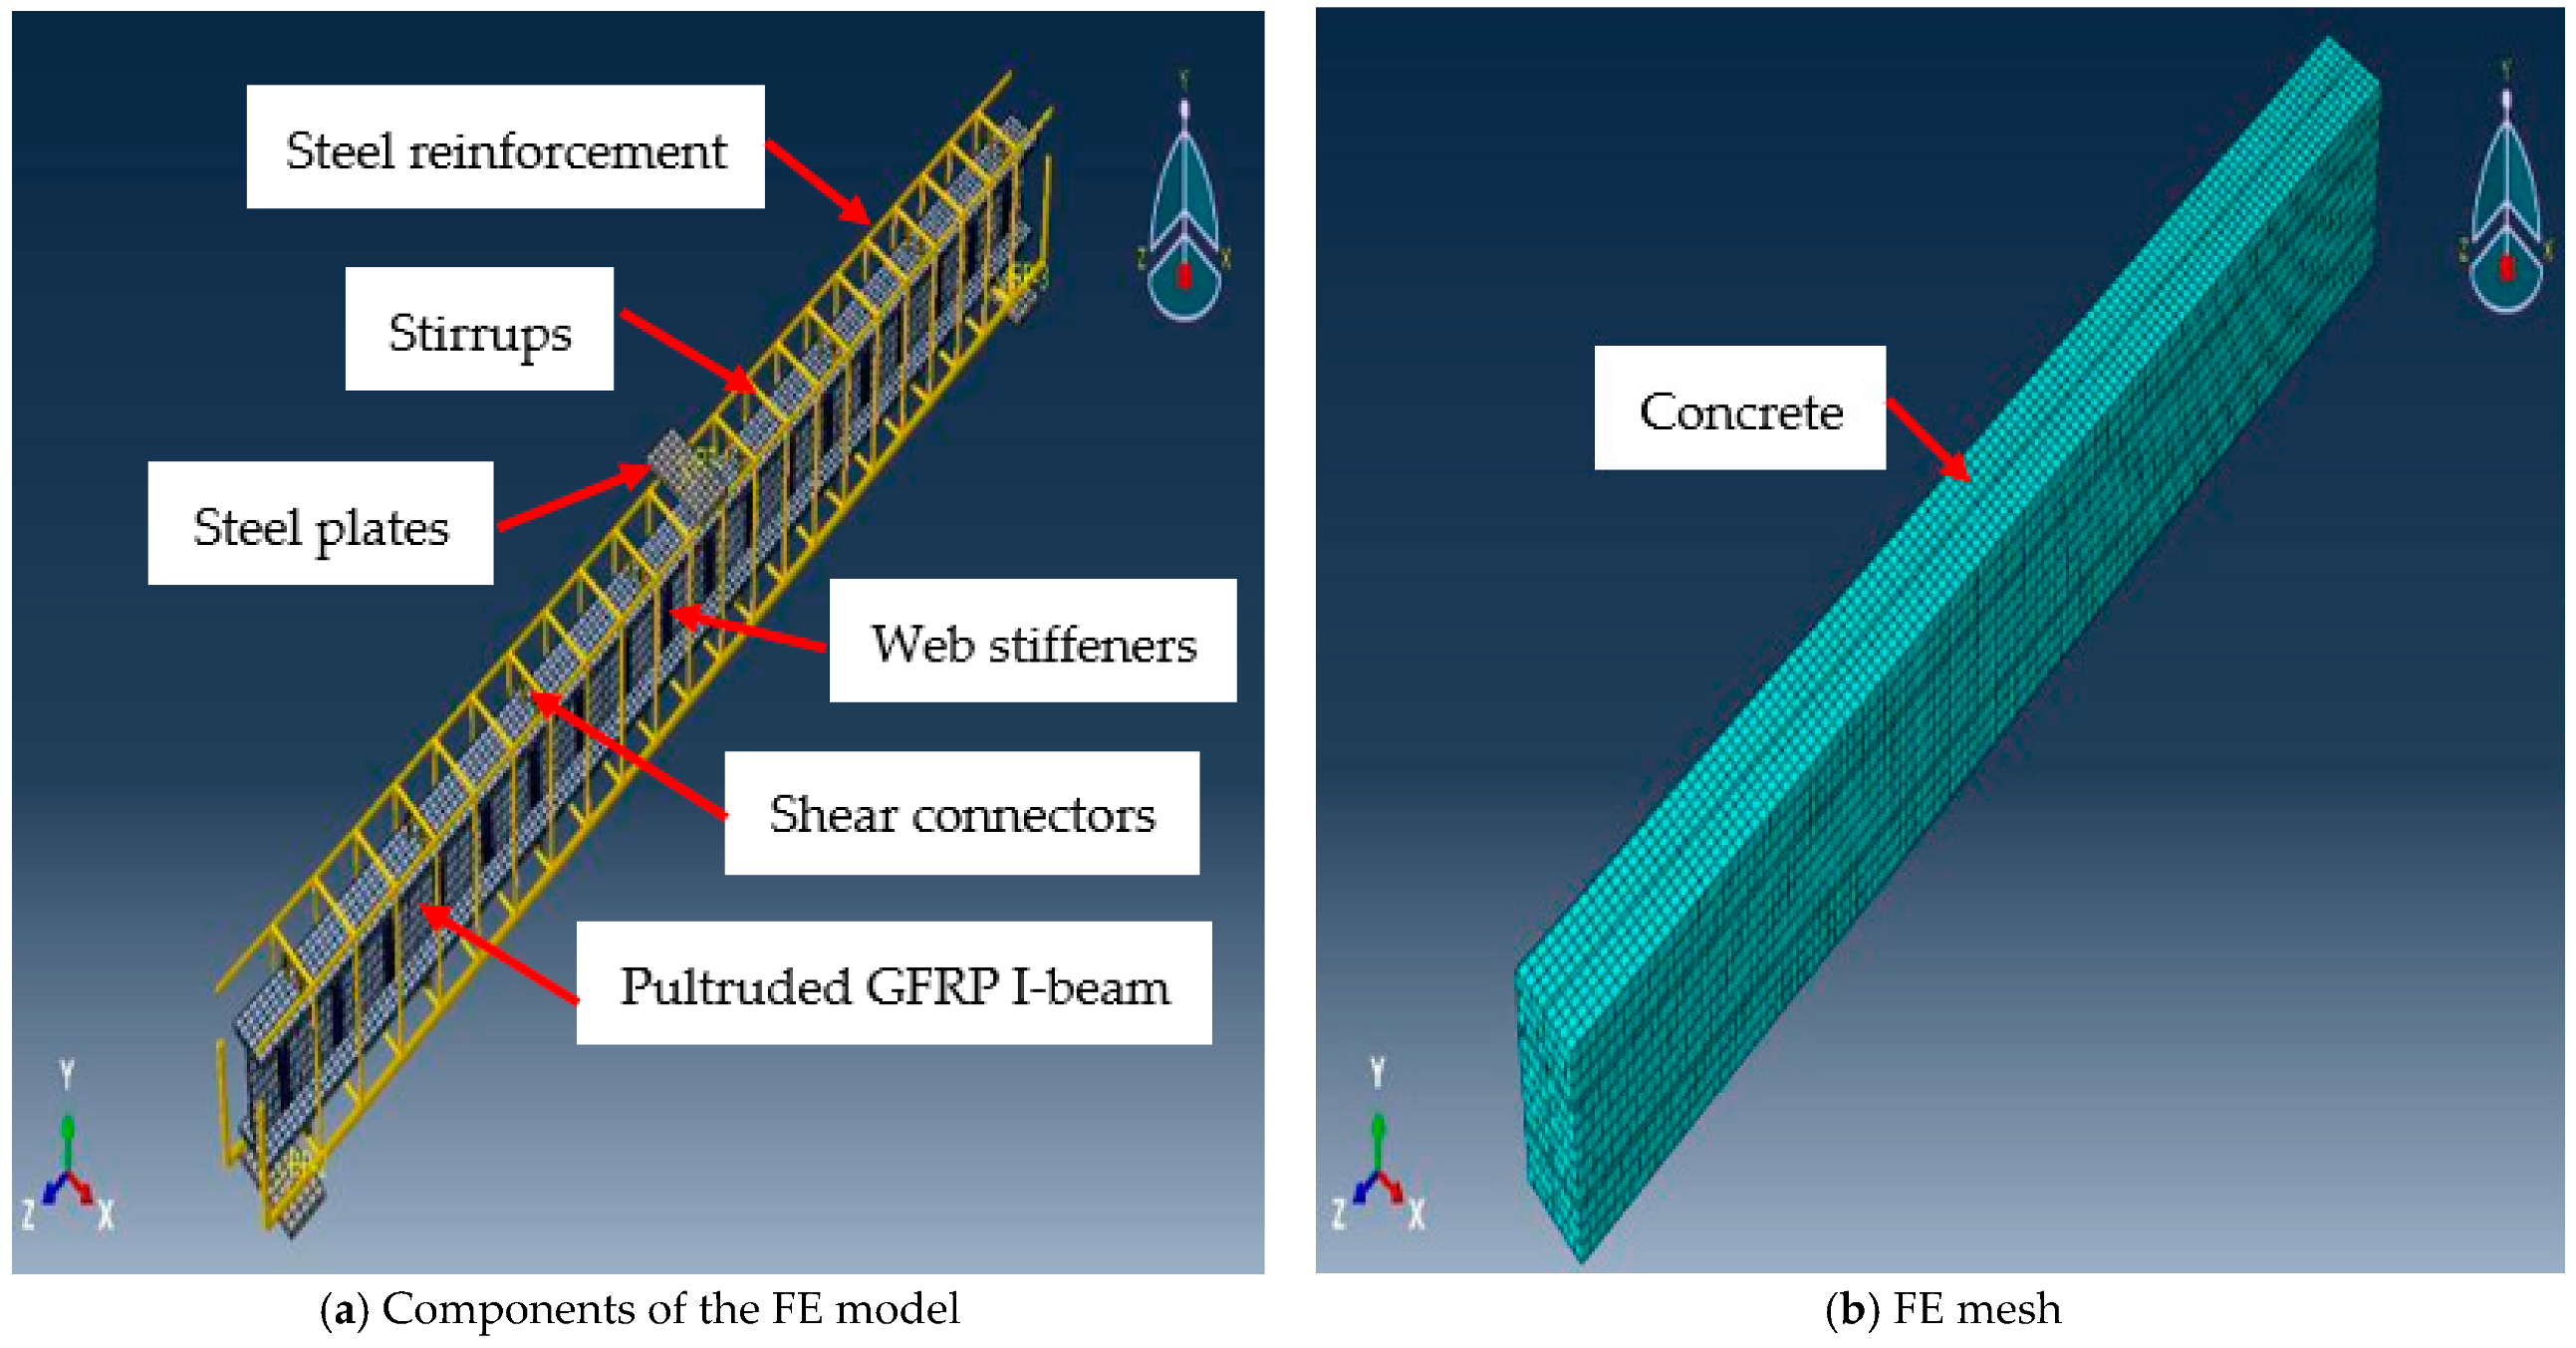
FE analyses were developed to simulate three-dimensional modeling of encased pultruded GFRP beams at ambient and elevated temperatures using ABAQUS [27]. Modeled and put together as a whole, the seven components (concrete, steel reinforcement, stirrups, pultruded GFRP I-beam, shear connectors, web stiffeners, and steel plates) are shown in Figure 16.

4.1. Element Selection

In this study, two independent analysis stages were used to take the fire loading and residual static tests into account. Static analyses and thermal-displacement coupled analyses were therefore employed. Consequently, this study used two distinct element types, one for each part. Concrete, steel plates, and shear connectors were modeled for the thermal-displacement coupled analysis using the eight-node thermally coupled brick trilinear displacement element, C3D8T. The steel reinforcement was modeled using the two-node three-dimensional coupled temperature-displacement truss element, T3D2T. The GFRP I-beams were modeled using the four-node general-purpose shell, finite membrane strains, and bilinear temperature in the shell surface element, S4T. The continuum eight-node solid elements reduced integration element, C3D8R, was used to simulate concrete. Steel plates and shear connectors were represented by the same element. The pultruded GFRP I-beams and web stiffeners were constructed using the embedded shell element, four-node, doubly curved with reduced integration element, or S4R. To model the longitudinal steel rebars and stirrups, the embedded two-node linear truss element T3D2 was used. An essential component of the FE analysis is the FE mesh. As a result, while solving the equation would take longer, adding more elements could increase the precision of the analysis. To choose the density of meshes, several nonlinear analyses were run with various element sizes.

4.2. Material Properties and Boundary Conditions

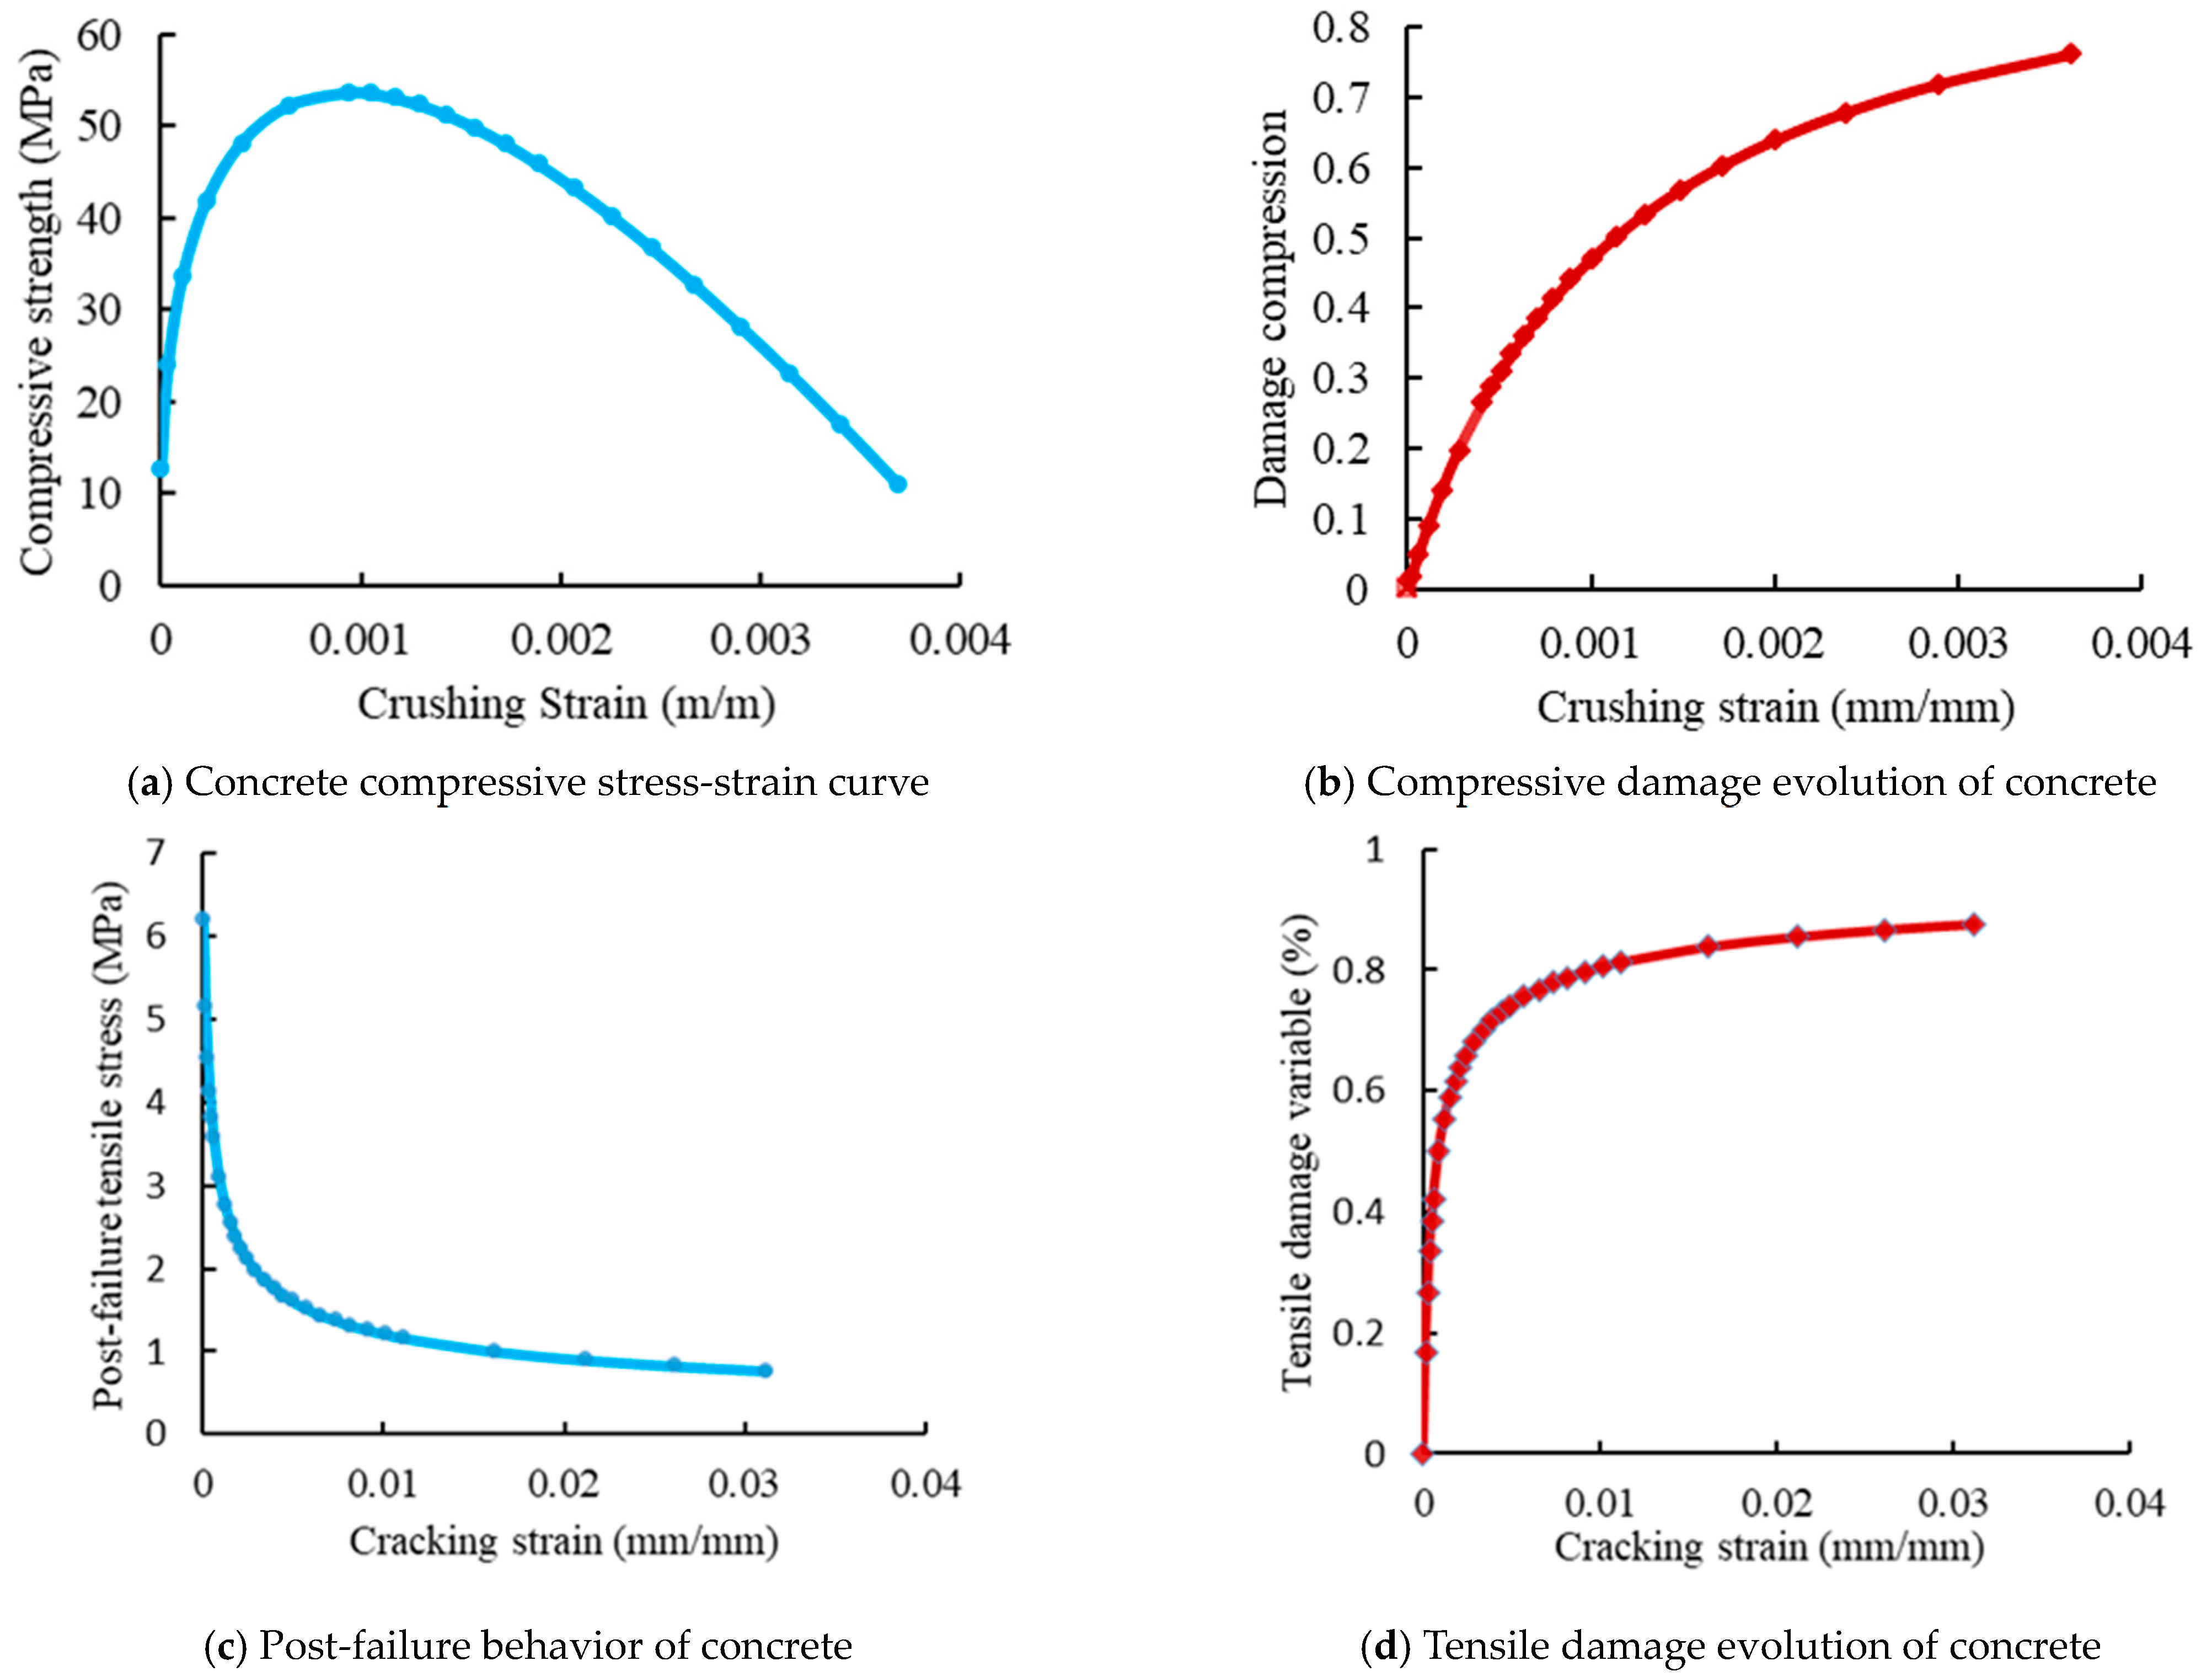
To simulate the complexity and nonlinearity of concrete, the concrete damaged plasticity (CDP) model was assumed to describe the compressive behavior of concrete. The dilation angle was assumed to be 36°, the plastic flow potential eccentricity (e) was 0.1, the ratio of the initial equibiaxial compressive yield stress to initial uniaxial compressive yield stress (σboco) was 1.16, the coefficient (Kc) was 2/3, and the viscosity parameter was considered 0.001.
The used uniaxial compressive stress-strain and damage compression–crushing strain relationships of concrete at ambient temperature are shown in Figure 17a,b, respectively. The concrete behavior under uniaxial tension was represented by the tension-softening mechanism and tension stiffening due to the tensile resistance of concrete surrounding the tensile reinforcement, which was forced by bond stresses to extend simultaneously with reinforcement [28,29], as shown in Figure 17c,d.
On the other hand, the equation below was used to model the compressive behavior of concrete under elevated temperatures [30]:
f c , T = 3 ε f c , 20 ε c 1 T ( 2 + ( ε ε c 1 T ) 3               ε   ε c 1 T  
where f c , T and f c , 20 are the compressive strength of concrete at temperatures T and 20 °C, respectively, ε is the corresponding strain, and ε c 1 T   is the concrete strain corresponding to the ultimate compressive strength f′c at temperature T.
At elevated temperatures, the tensile strength of concrete changed according to EN 1992 1.2 [30], which was modified by Dwaikat and Kodur [31] to prevent the state wherein the tensile strength of concrete becomes zero at relative temperatures (600 °C). The varying tensile strength of concrete with temperature was defined by the following expressions [31]:
f t , T = f t , 20                     f o r   T 100  
f t , T = f t , 20 × ( 600 T ) 500       f o r   100   T 550    
f t , T = f t , 20 × ( 1200 T ) 6500       f o r   550   T 1200    
where   f t , T   and   f t , 20 are the tensile strength of concrete at temperatures T and 20 °C, respectively.
The degradation in the GFRP I-beam at ambient temperature was modeled according to Hashin’s criteria [32]. The mechanical properties of the GFRP material and progressive damage parameters are listed in Table 11 [4].
The temperature-dependent thermal and mechanical property relationship of the GFRP beams is described by the following equations [33]:
σ c = ε E f , T                                           f o r   0 ε   ε f u , T        
ε f u , T = f f , T E f , T
f f . T = f 20   ° C ( 1 a σ 2   tanh ( b σ ( T c σ ) + 1 + a σ 2 )           f o r   20   T 400  
f f , T = f 20   ° C ( 0.25 + 0.25 600   ( T 400 ) )                 f o r   400   T 1000  
E f , T = E 20   ° C ( 1 a E 2   tanh ( b E ( T c E ) + 1 + a E 2 )
where   a σ = 0.1 , b σ = 0.0081 ,   c σ = 289.14 ,     a E = 0.0.05 , b E = 0.00791 ,   c E = 320.35 .
Pultruded GFRP material is anisotropic and has coefficients of thermal expansion in the longitudinal and transverse directions, which are dependent on the resin volume fraction. The coefficient of thermal expansion of GFRP was 13 × 10–6/°C (Dura Composites, UK).
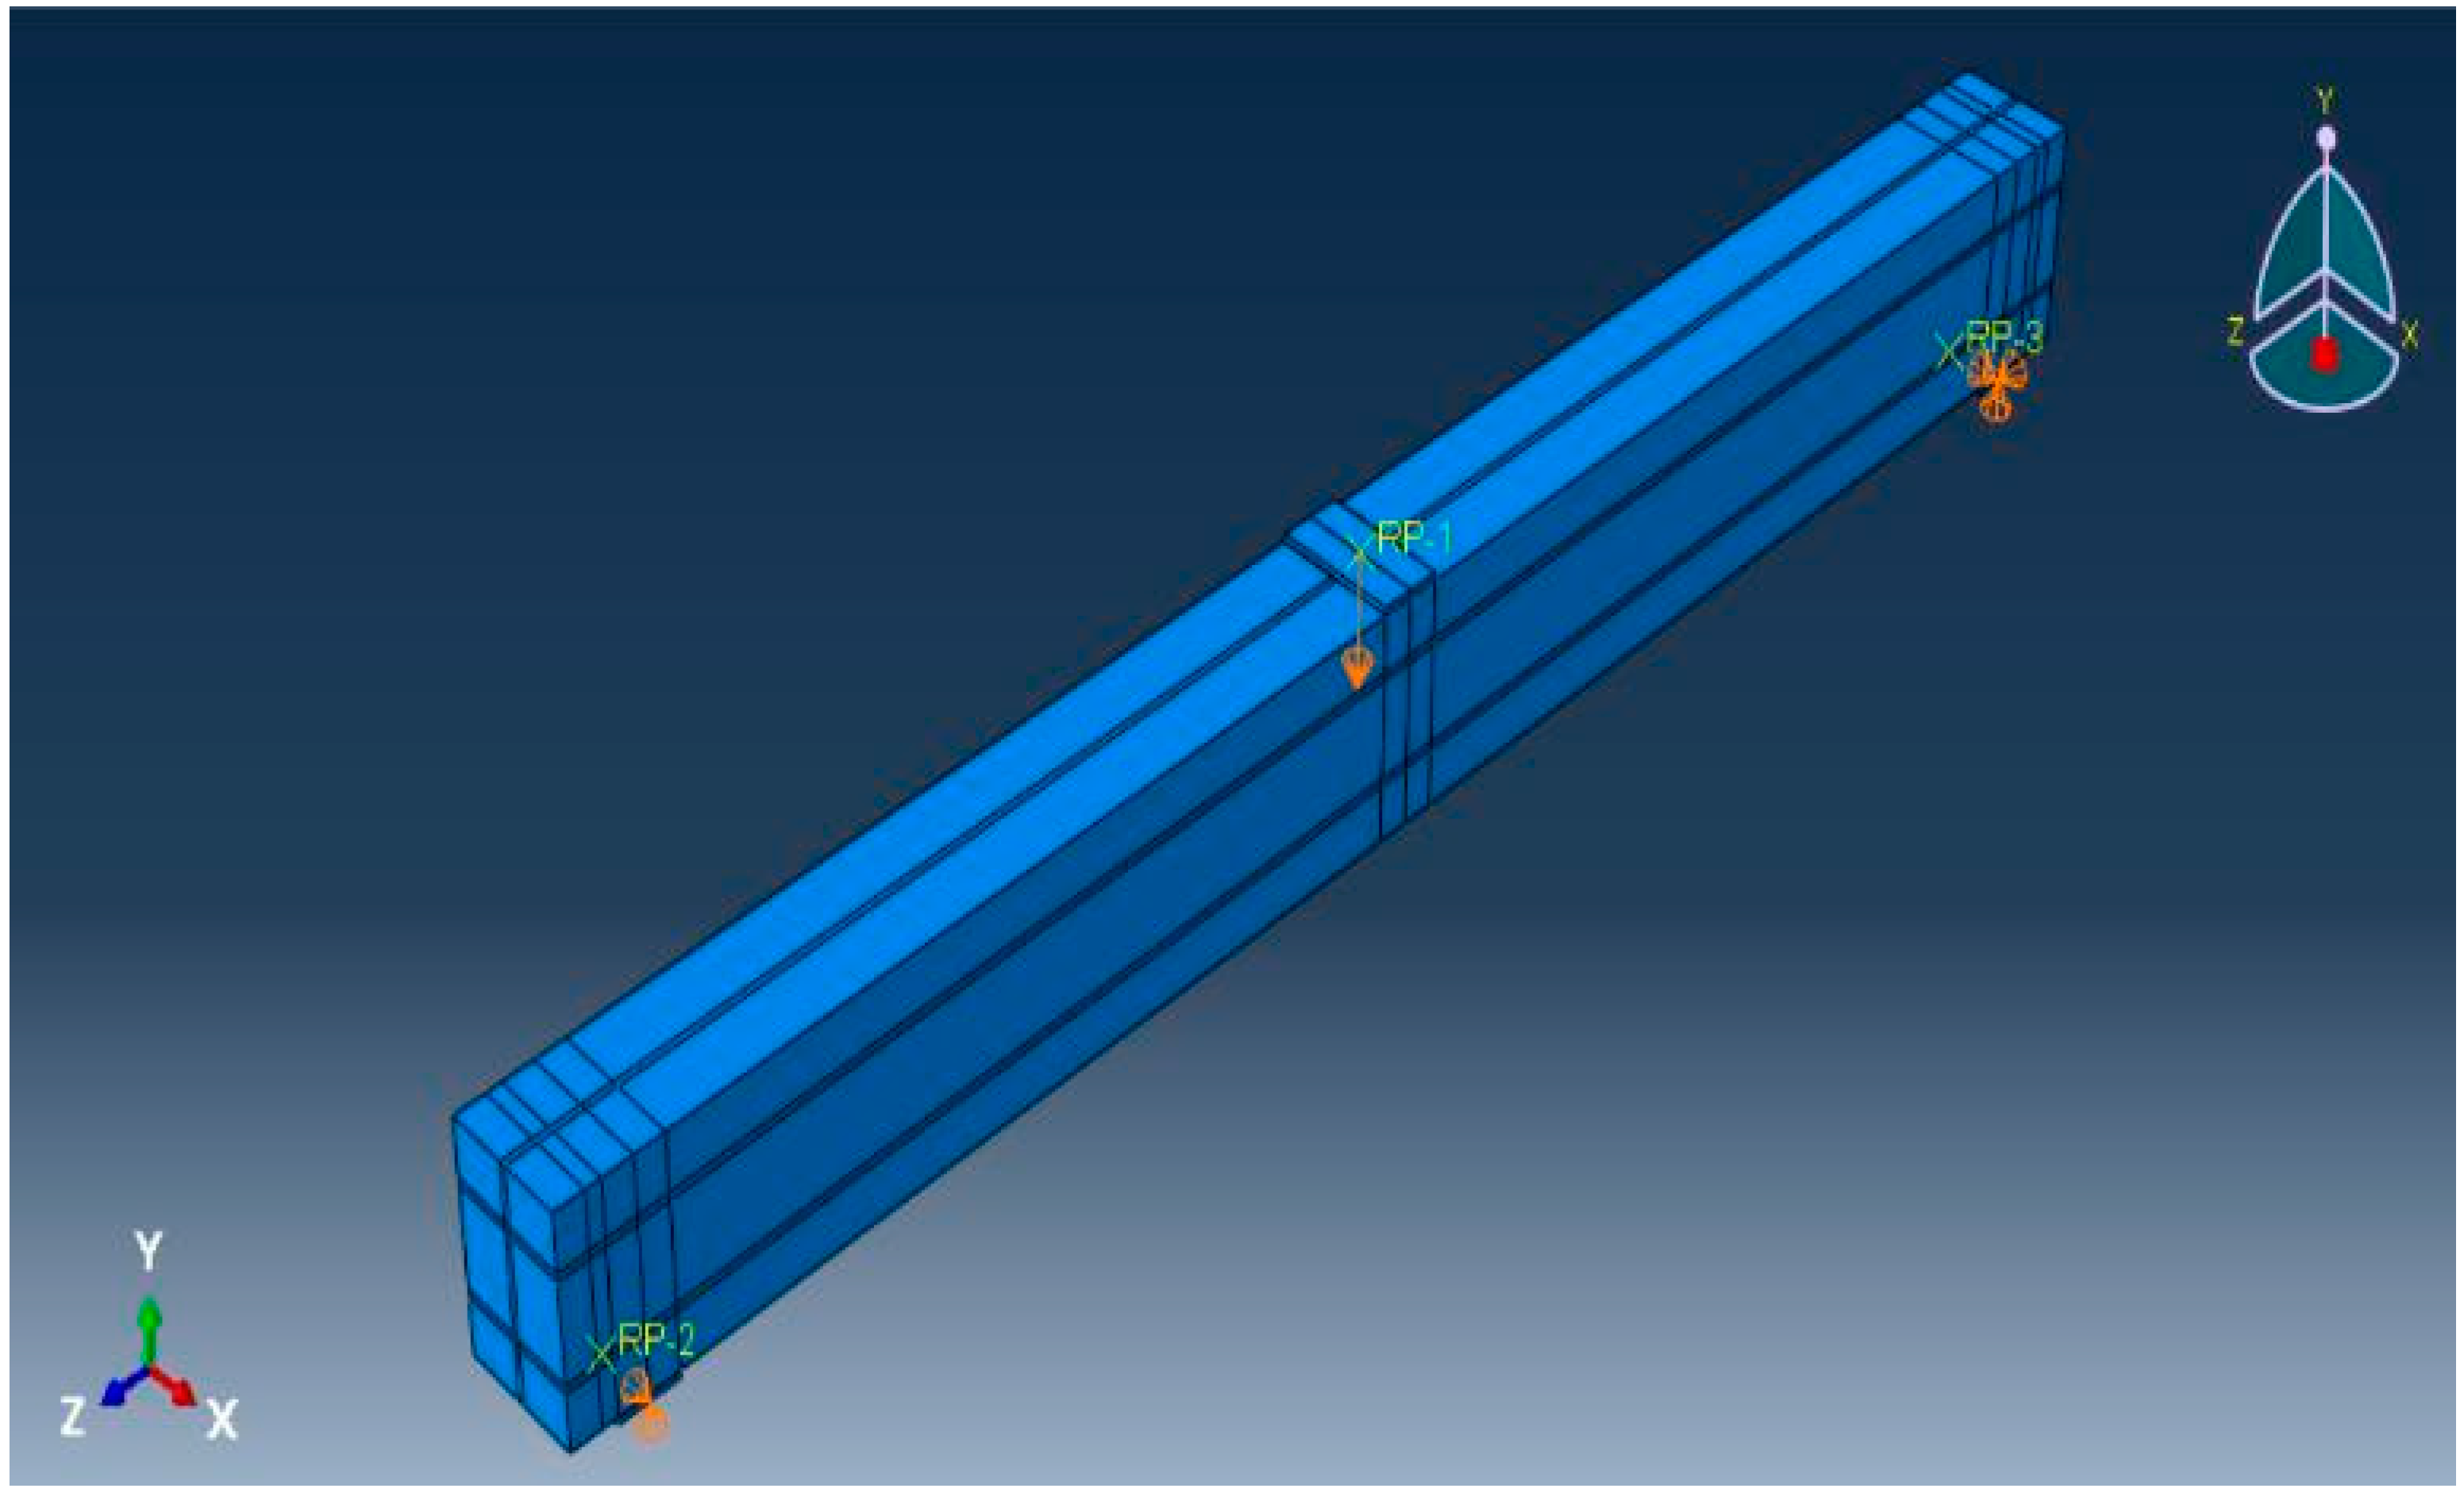
The boundary conditions in the FE analysis were simply supported beams, as shown in Figure 16c. The displacements were constrained to represent a hinge support at one end and a roller support at the other end. The whole model was constrained in the X-direction. The full bond technique was used to represent the connection between the steel rebars and concrete, whereas the bond between the surface of encased GFRP beam and the surrounded concrete was simulated using surface-to-surface contact pairs. The contact property was represented by tangential behavior with a penalty friction formulation. The tangential shear stress was adopted from the push-out test as 0.422 MPa [4], and the friction coefficient was used equally at 0.55 according to the test of Hadi and Yuan [34]. However, a full bond between the shear studs and concrete was assumed.

4.3. Verification of the FE Results

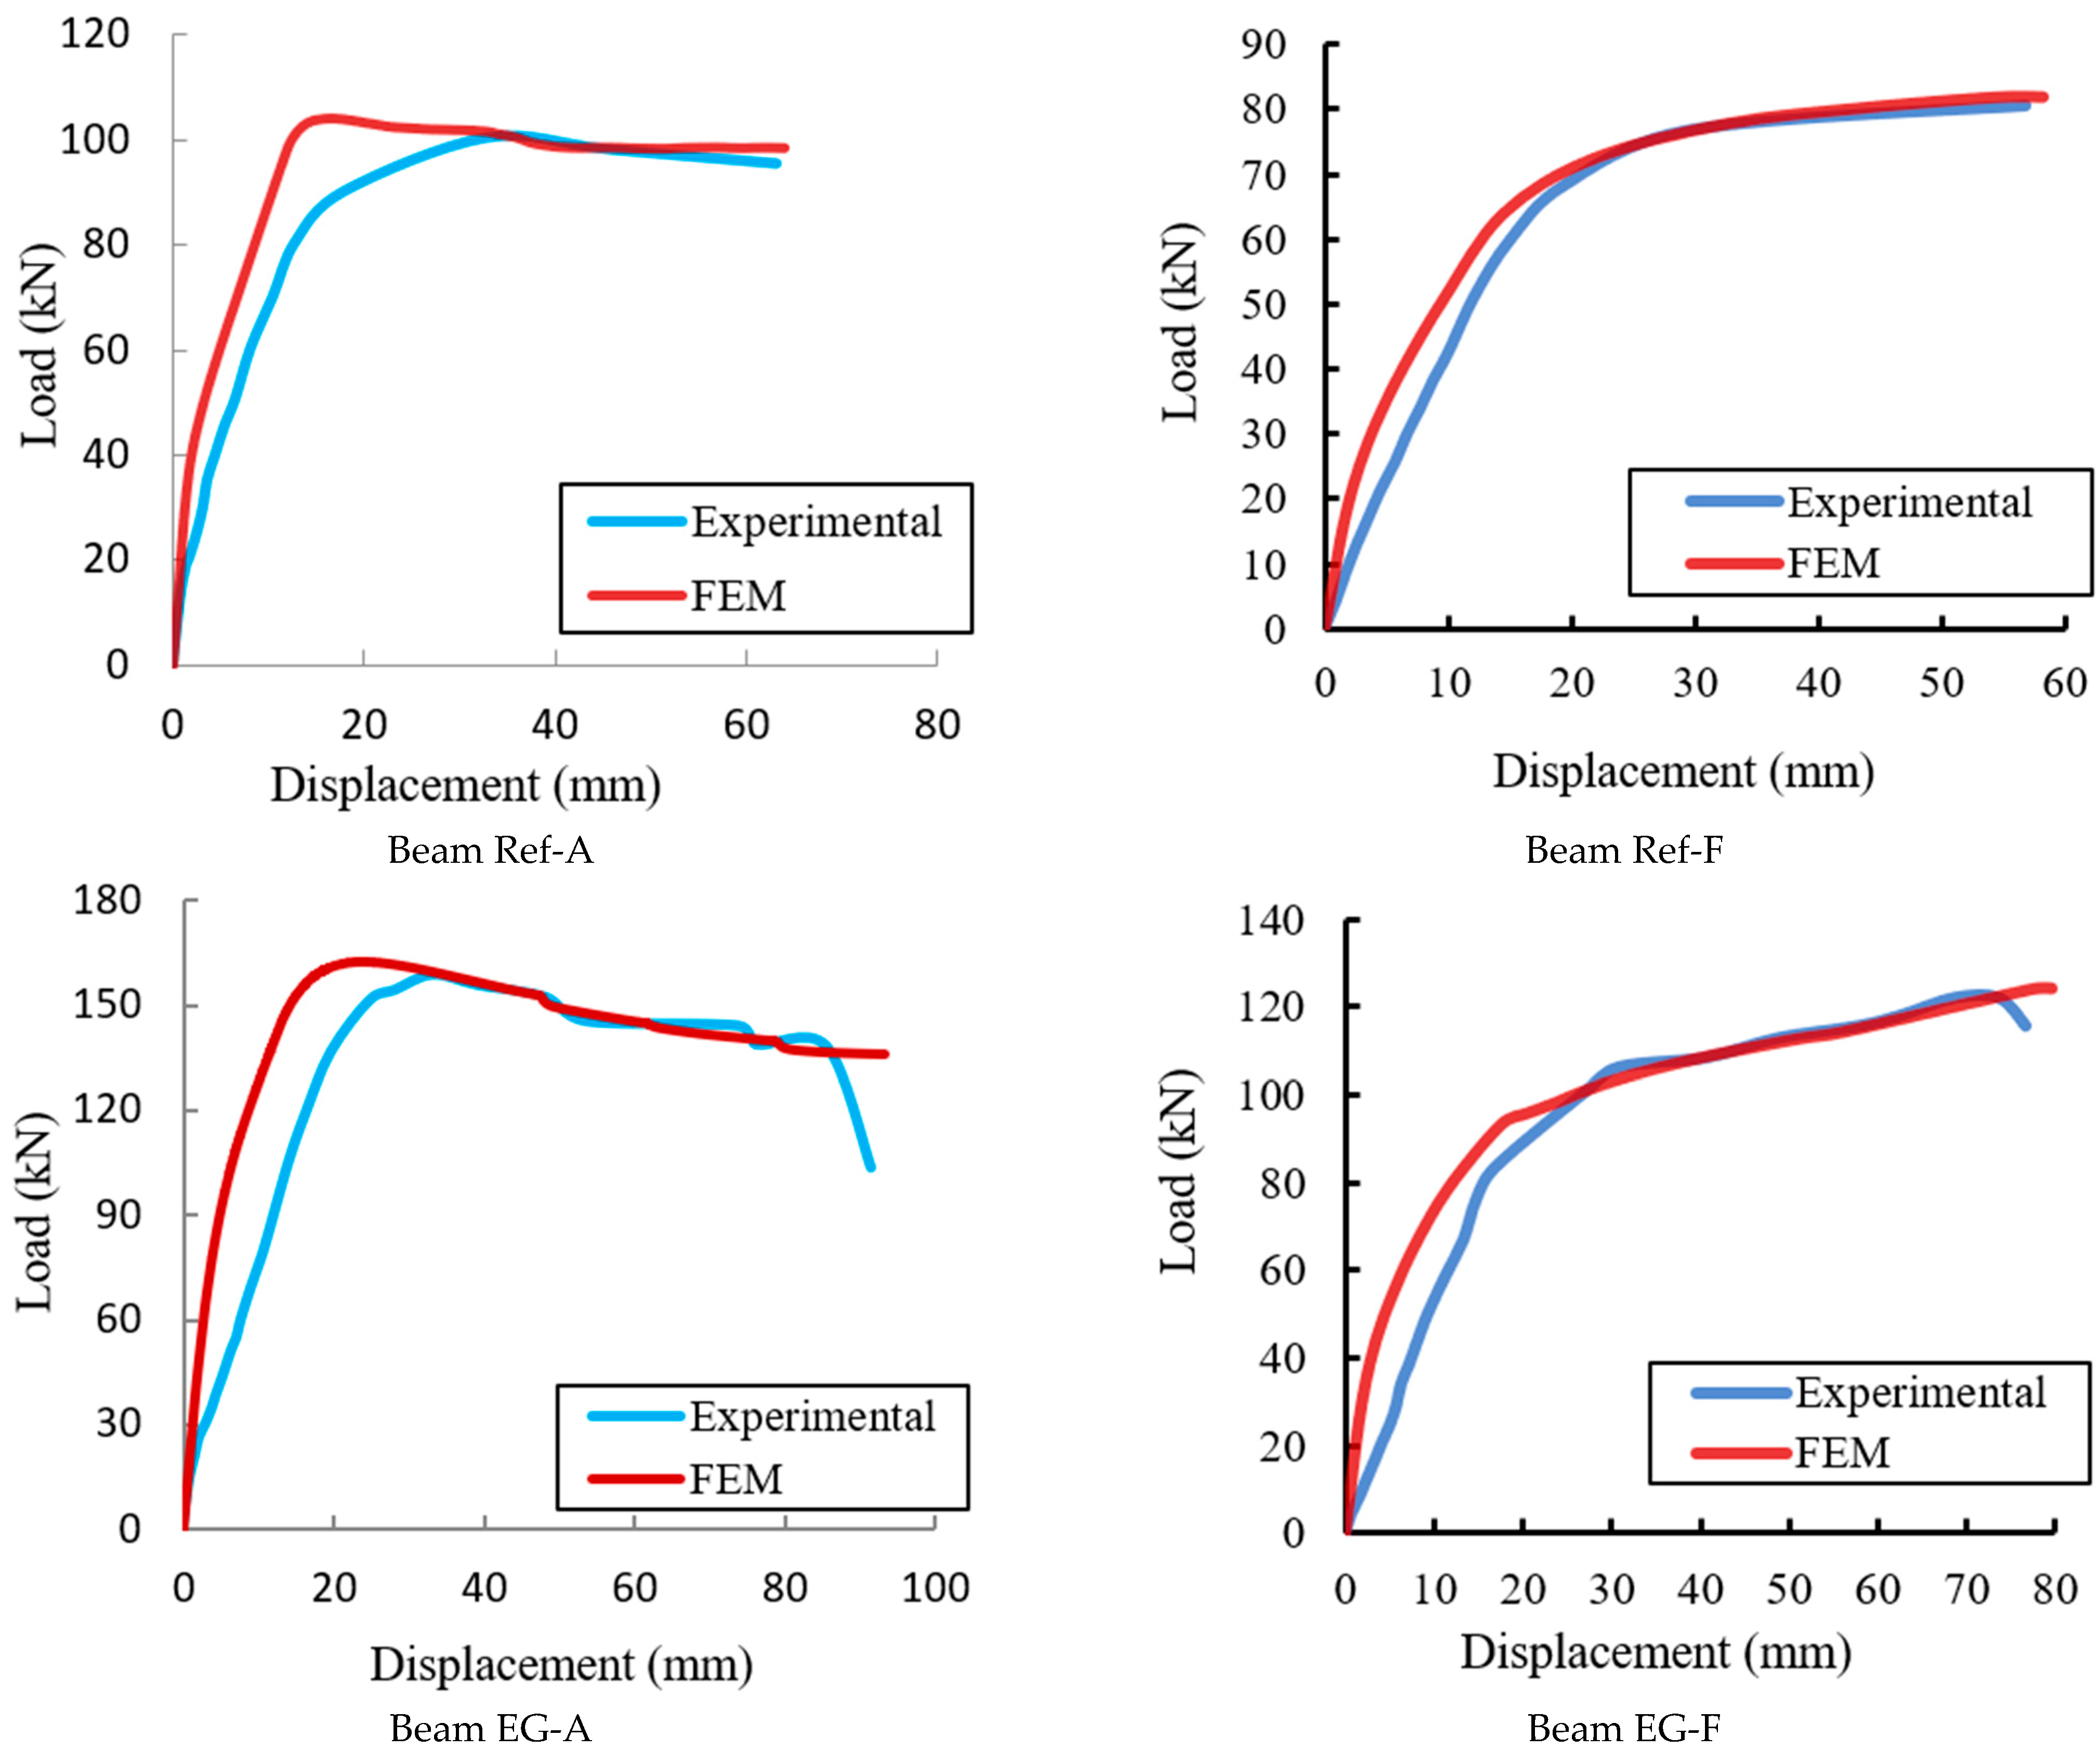
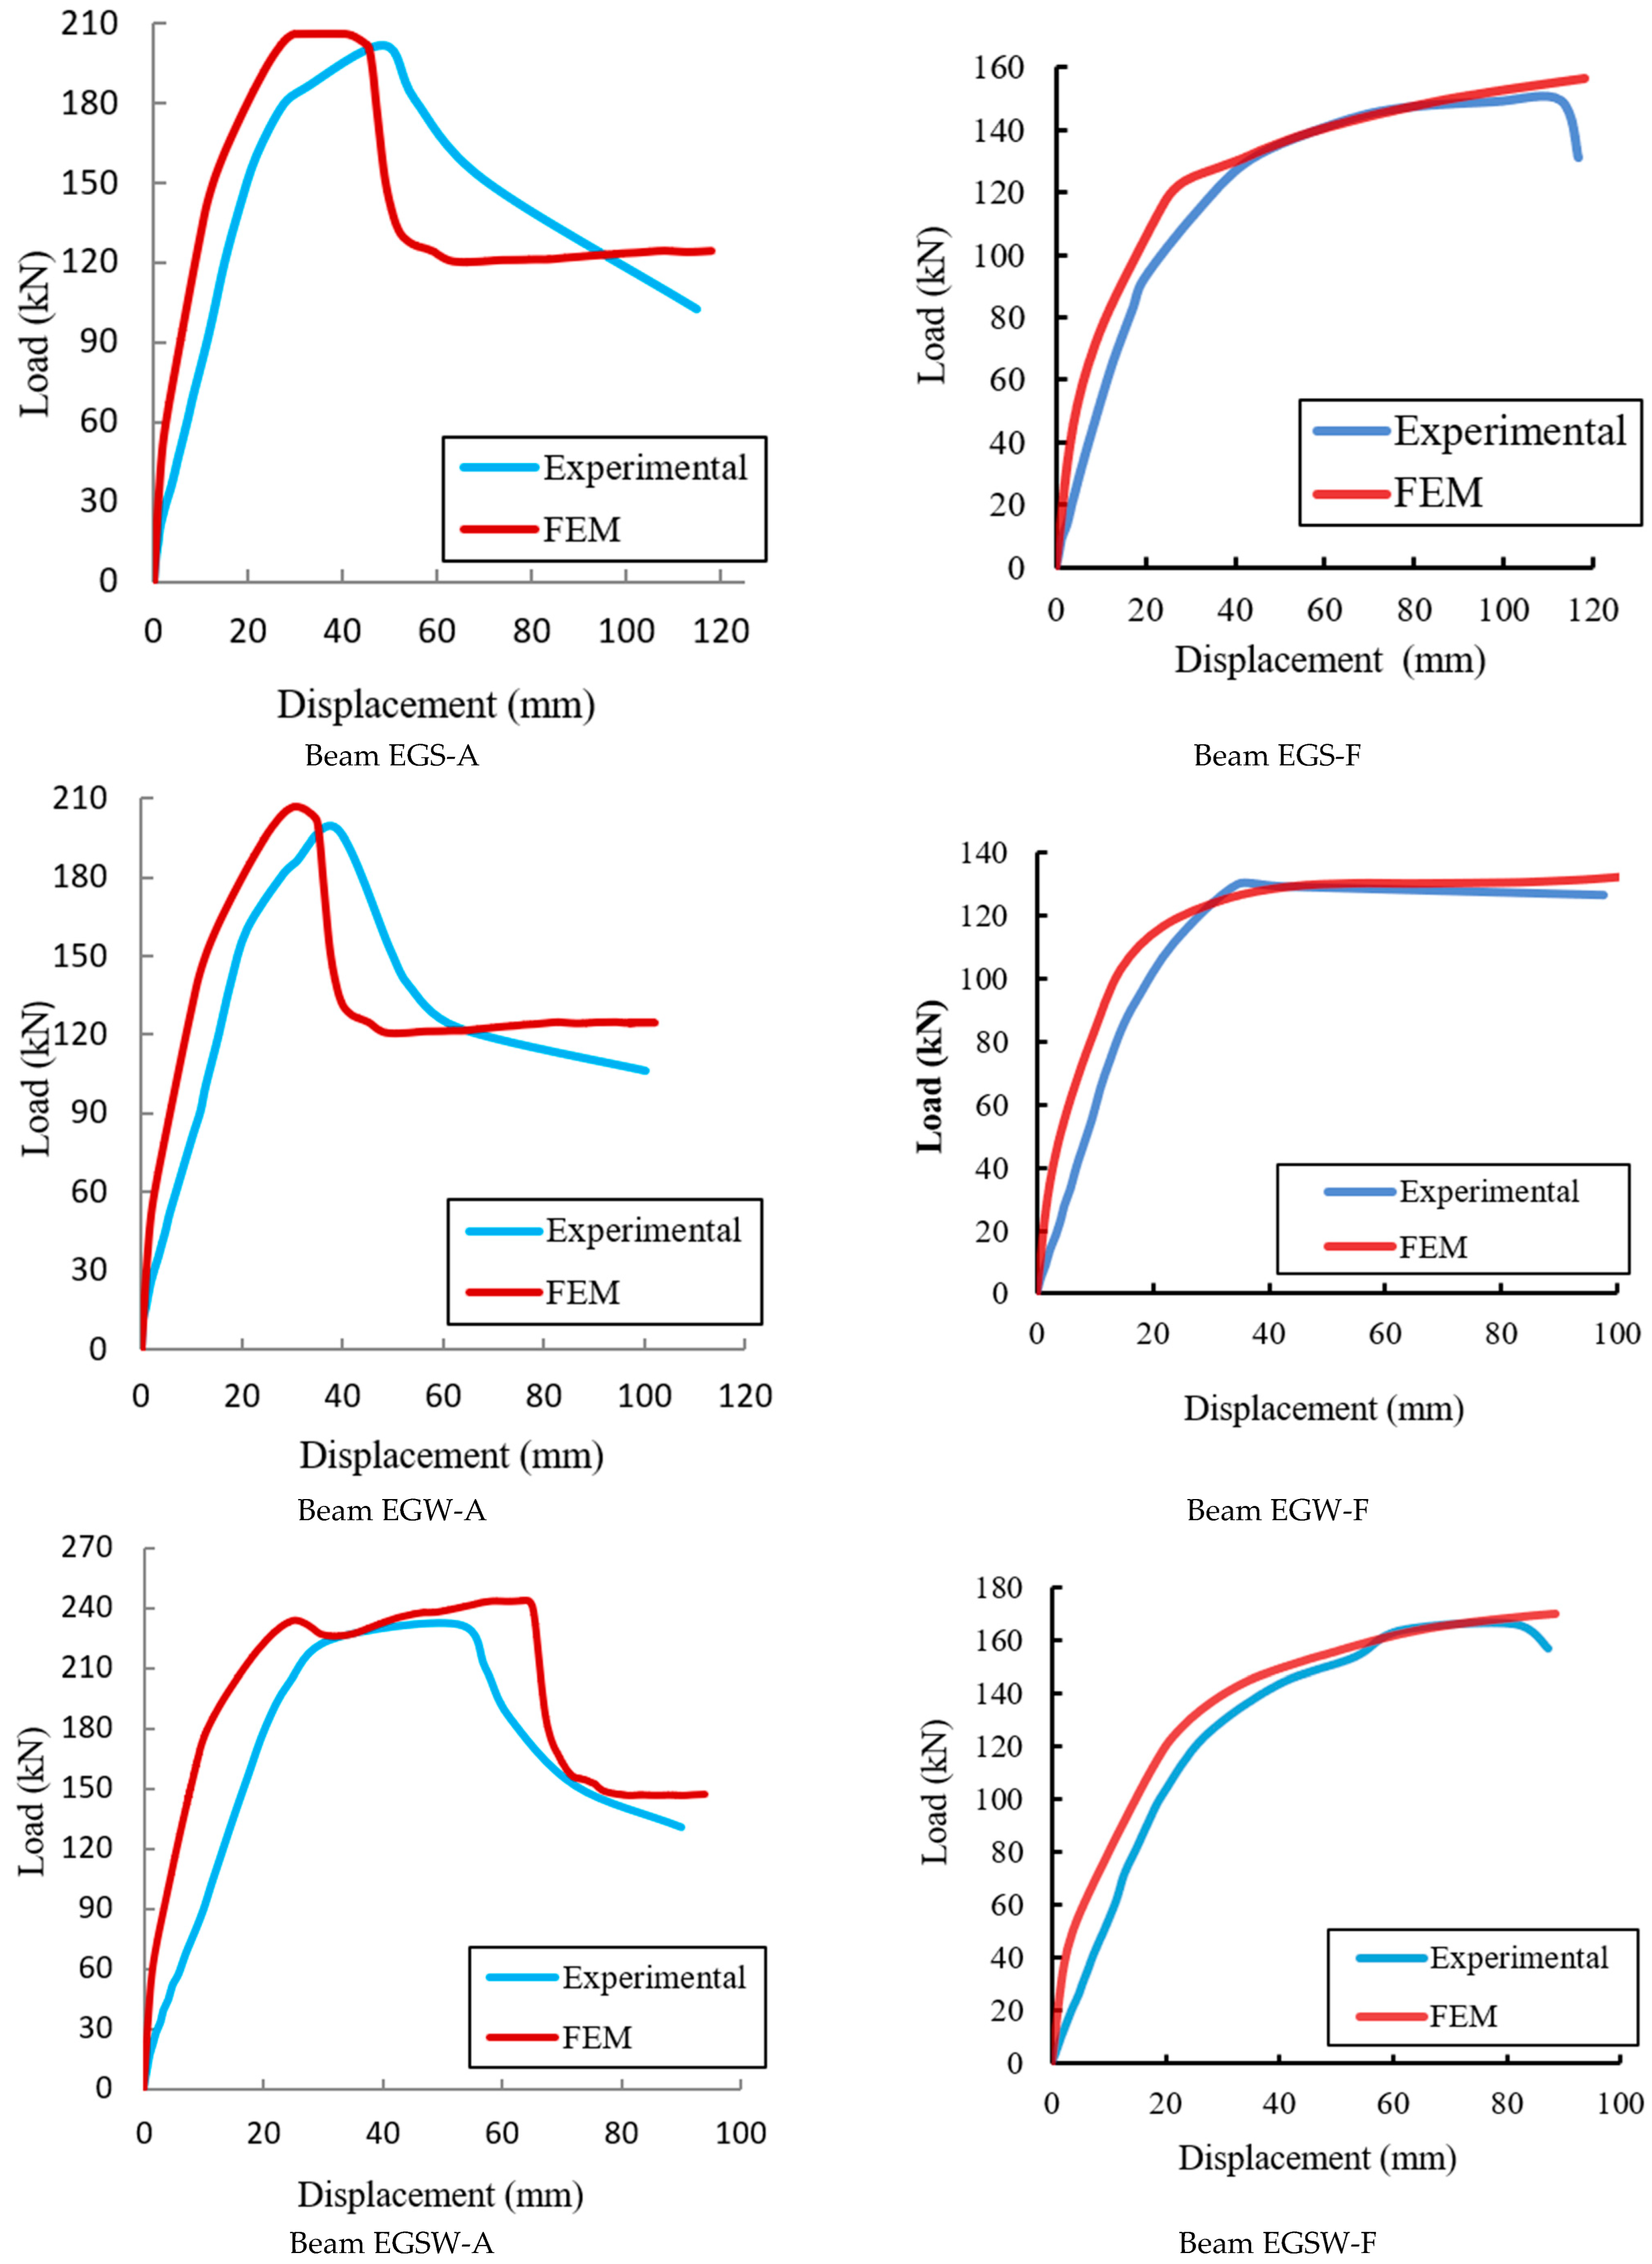
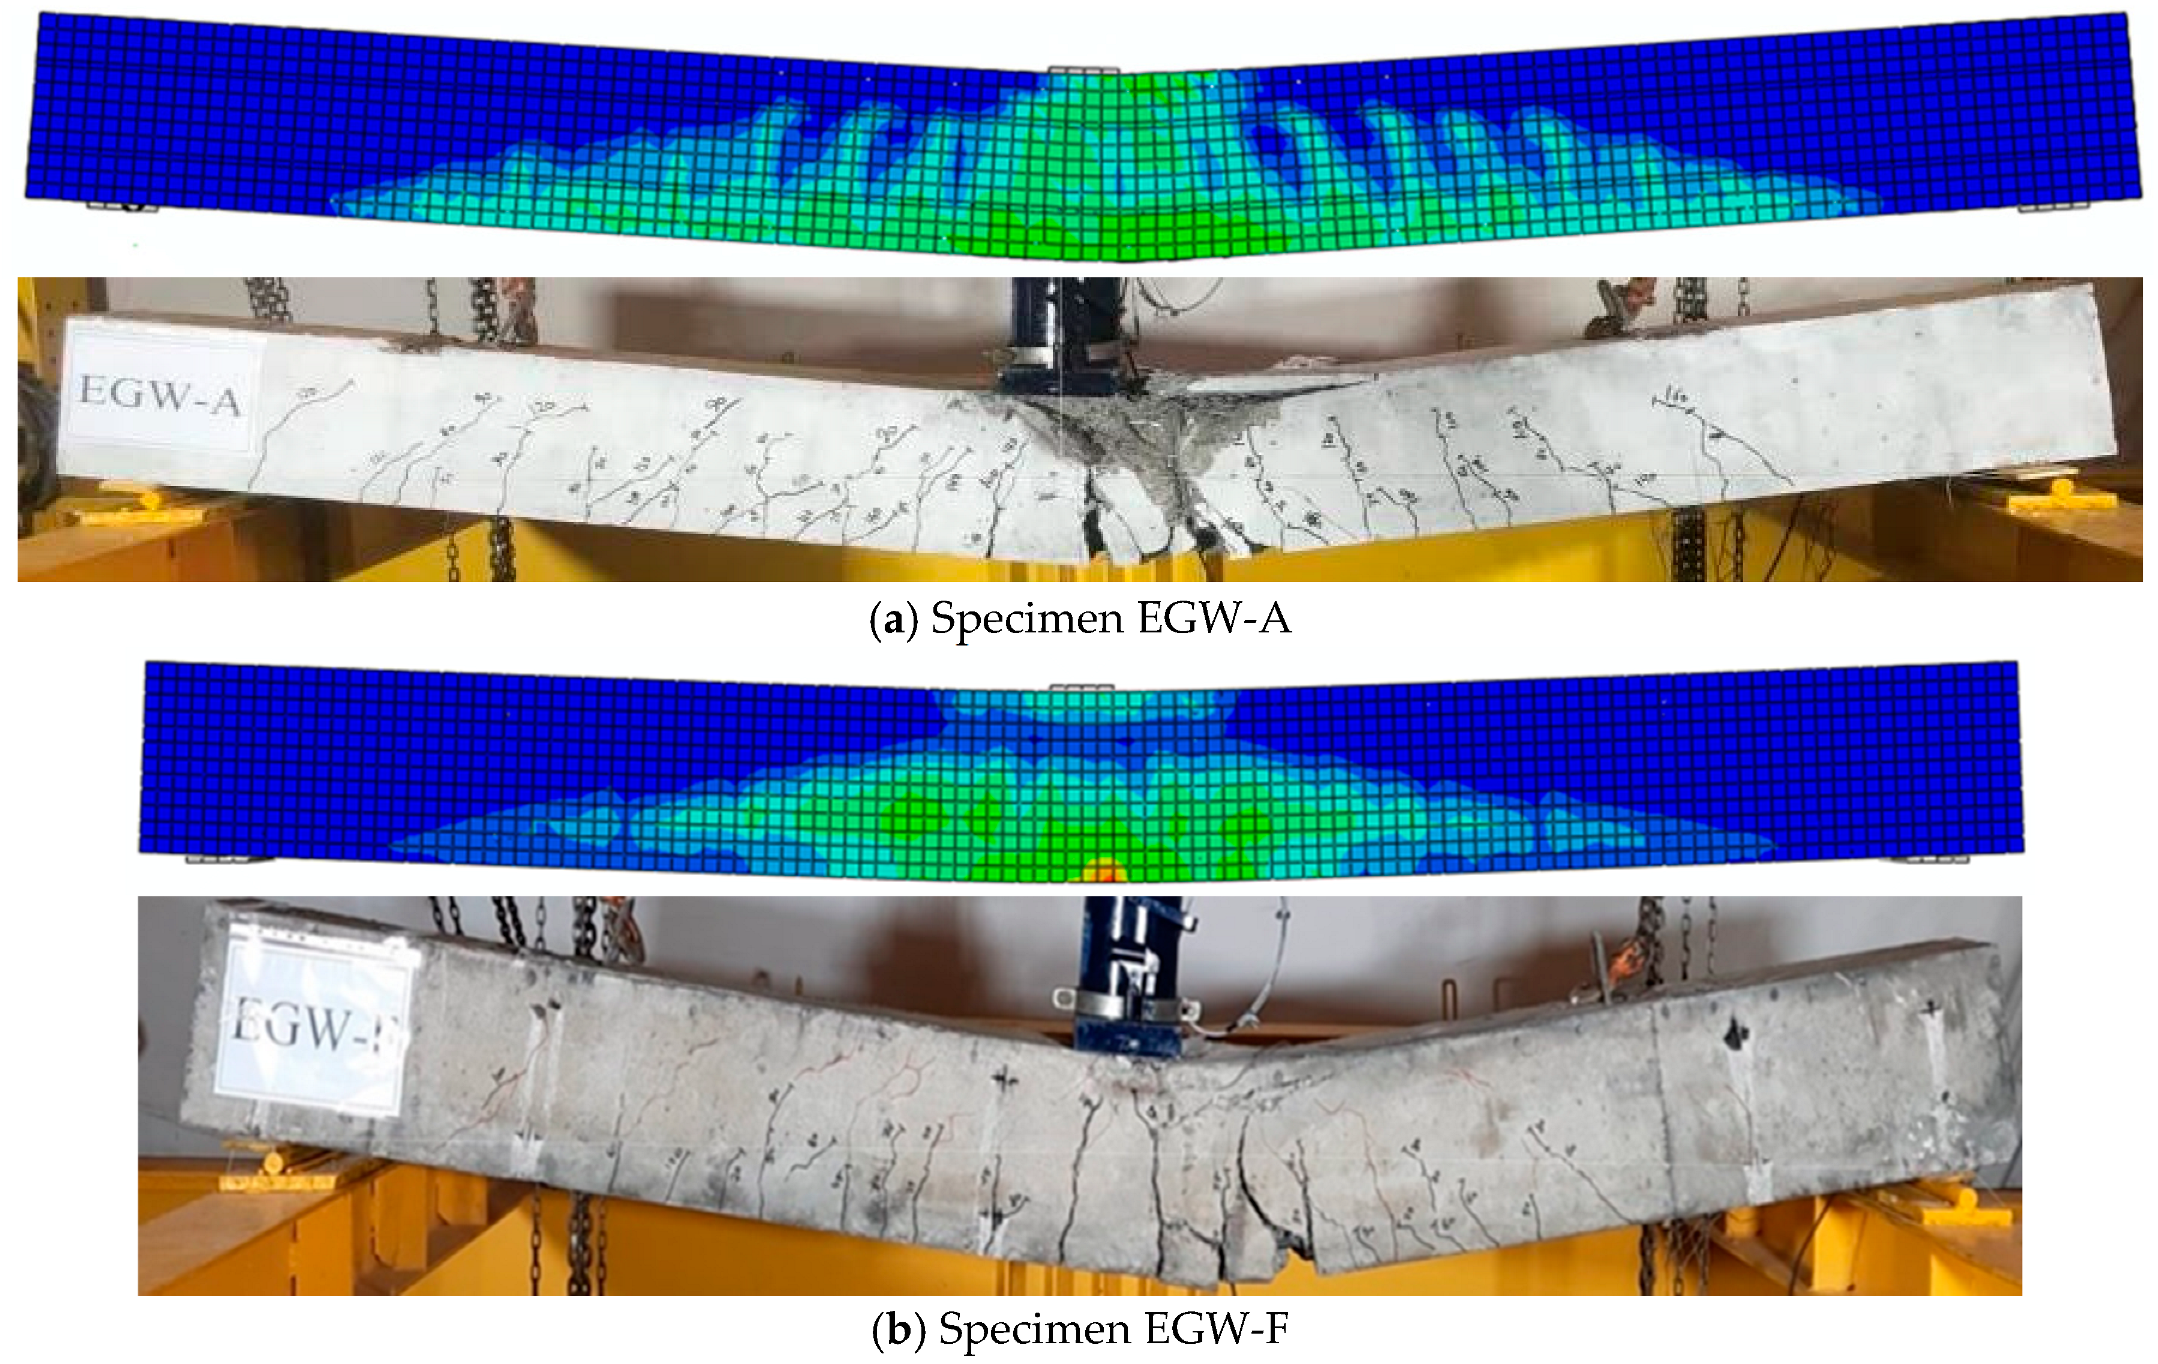
The load-deflection relations for the tested beams were utilized to validate the FE results, as illustrated in Figure 18. The FE deformations exhibited a linear elastic performance with a higher stiffness than the experimental results. This variation in performance can be attributed to using material constitutive models as well as the assumed full bond between the steel reinforcement and concrete and between the GFRP beams and concrete. Table 12 lists comparisons between the experimental and FE results in terms of the peak load and corresponding deflection. The comparisons show that the variation between the mid-span deflections was 4.52% and for peak load was about 4.25% of the unburned specimen. The variation in measured deflections of burned beams was about 4.08%, and the difference in the residual loads reached 4.52%. Figure 19 presents a crack pattern comparison between the FE and experimental results (specimen EGW-A). The tested specimens showed good agreement with the FE models. The validated FE models were used to conduct a parametric study to investigate the effect of the fire exposure duration and the temperature. Figure 20 shows the thermal strain at the end of heat exposure of 700 °C. A higher value of thermal strain was monitored at the corners of the concrete surfaces.

4.4. Effect of the Fire Exposure Duration

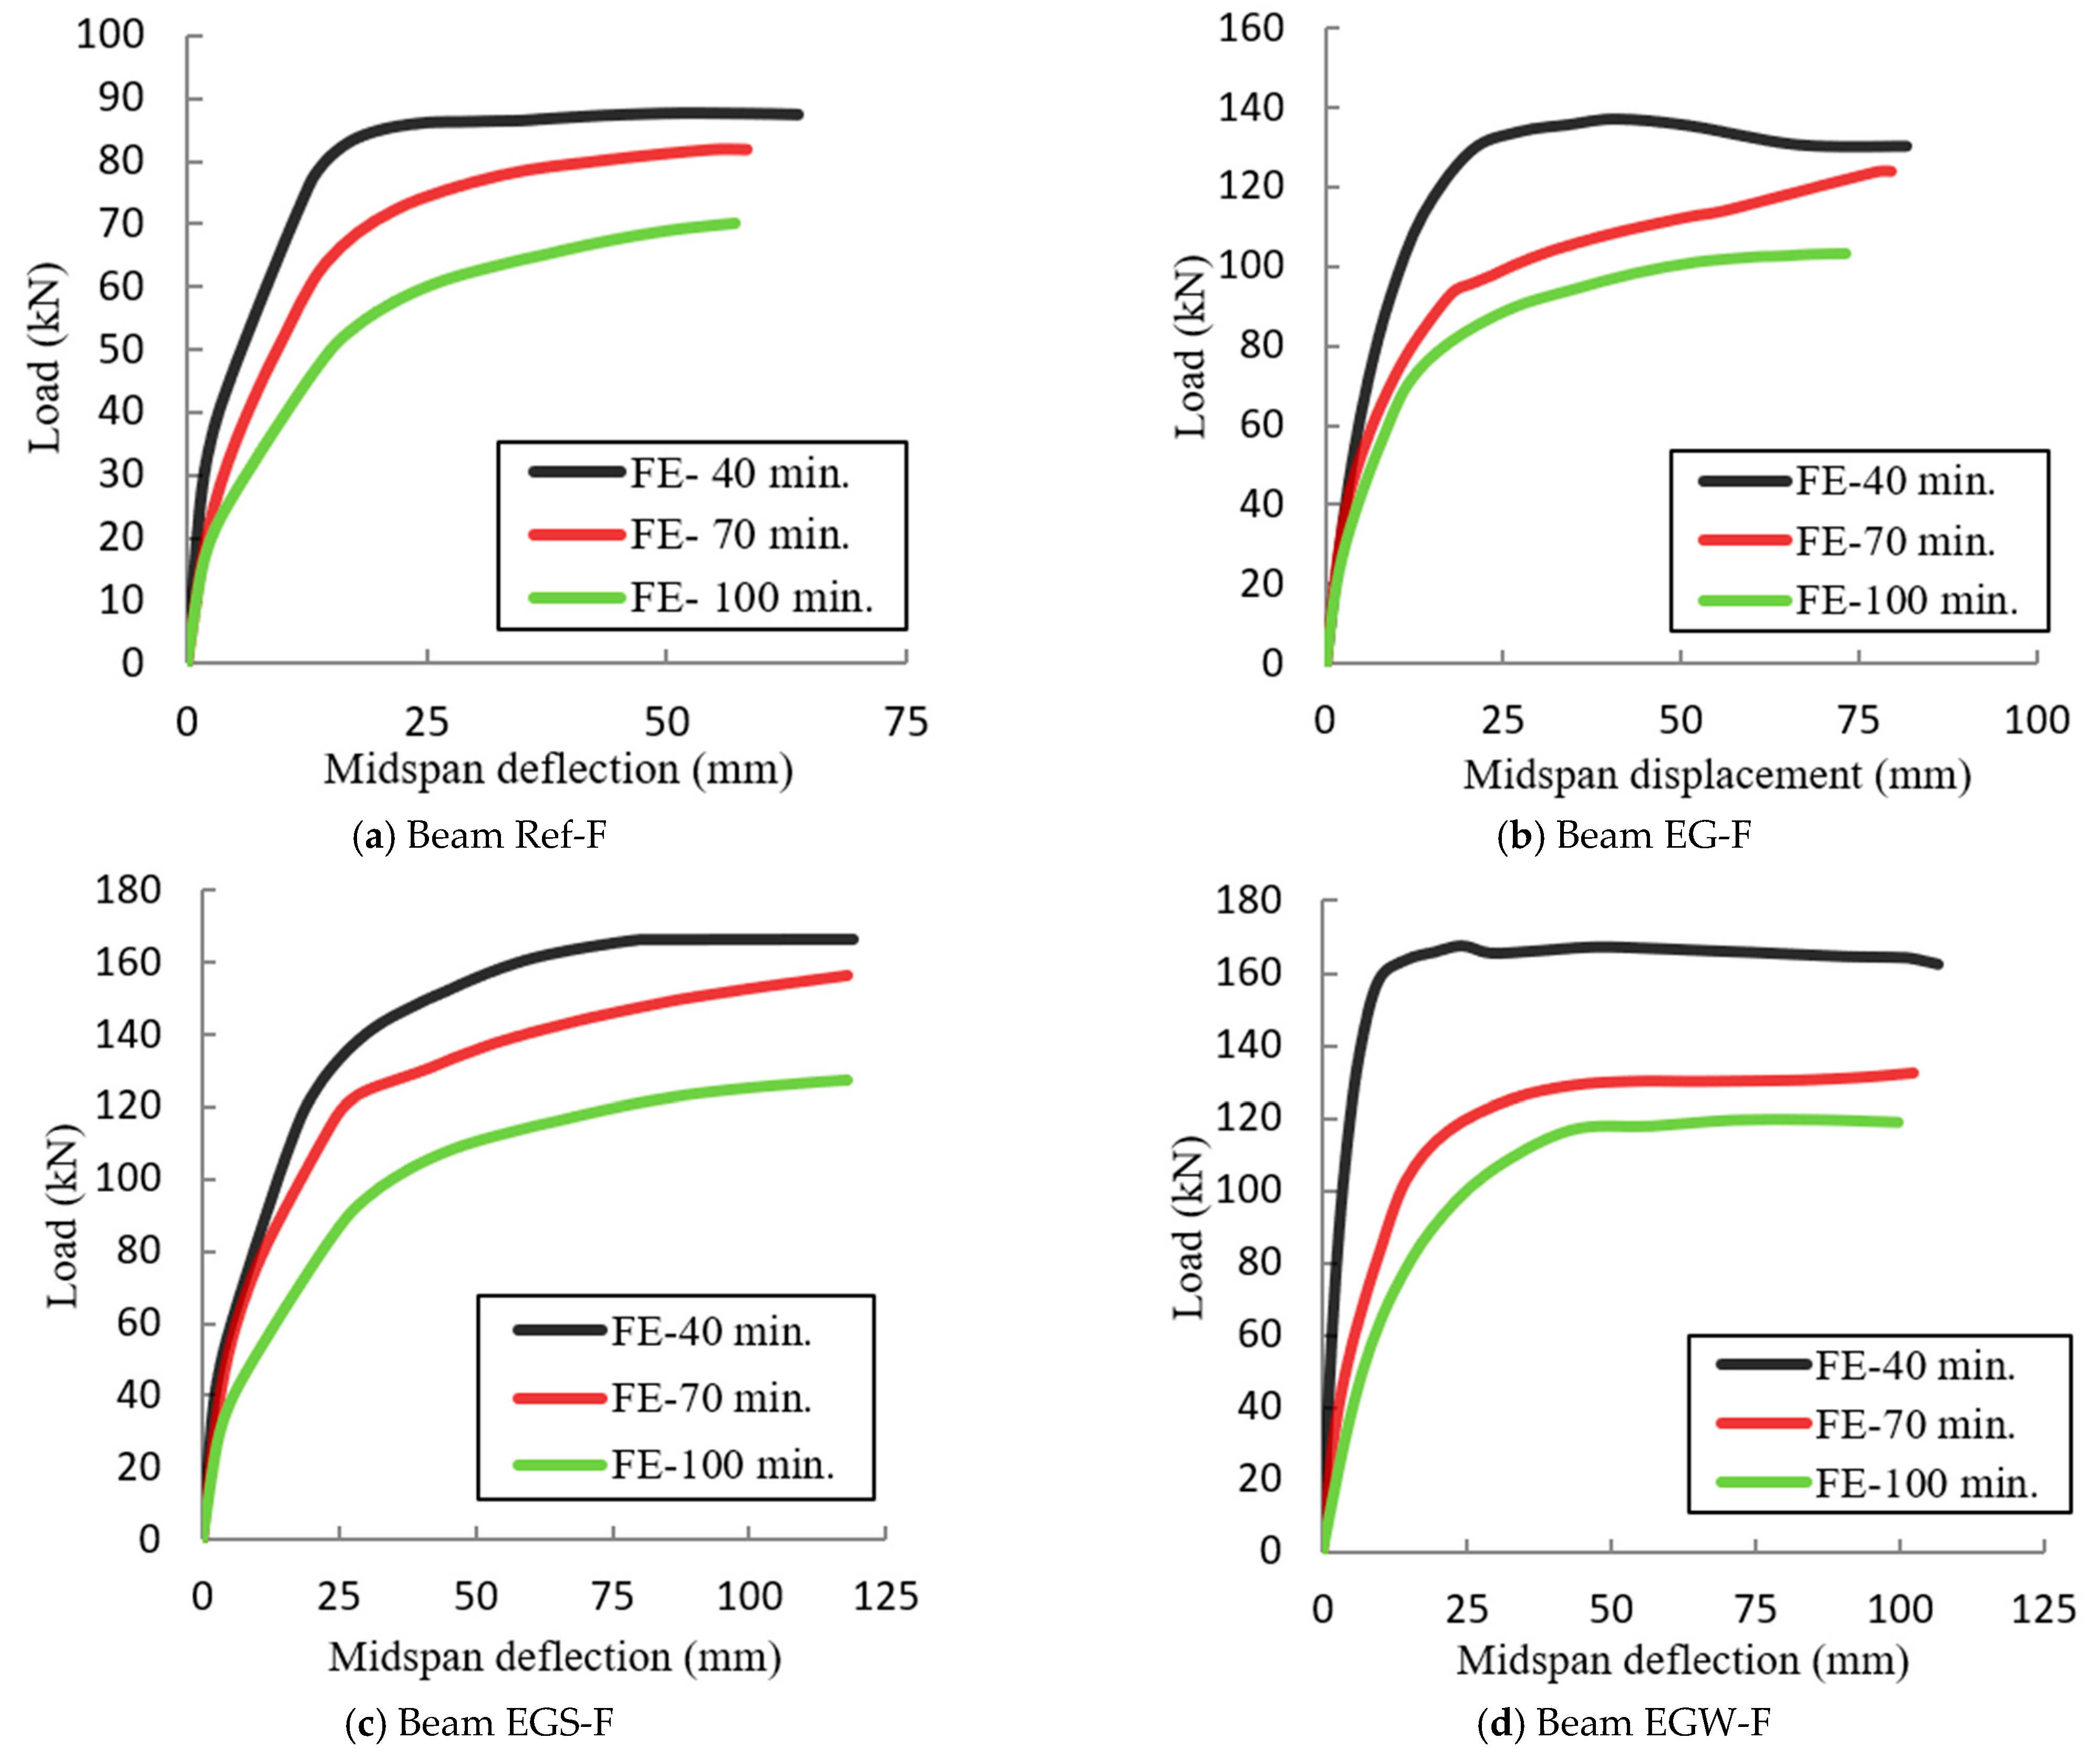
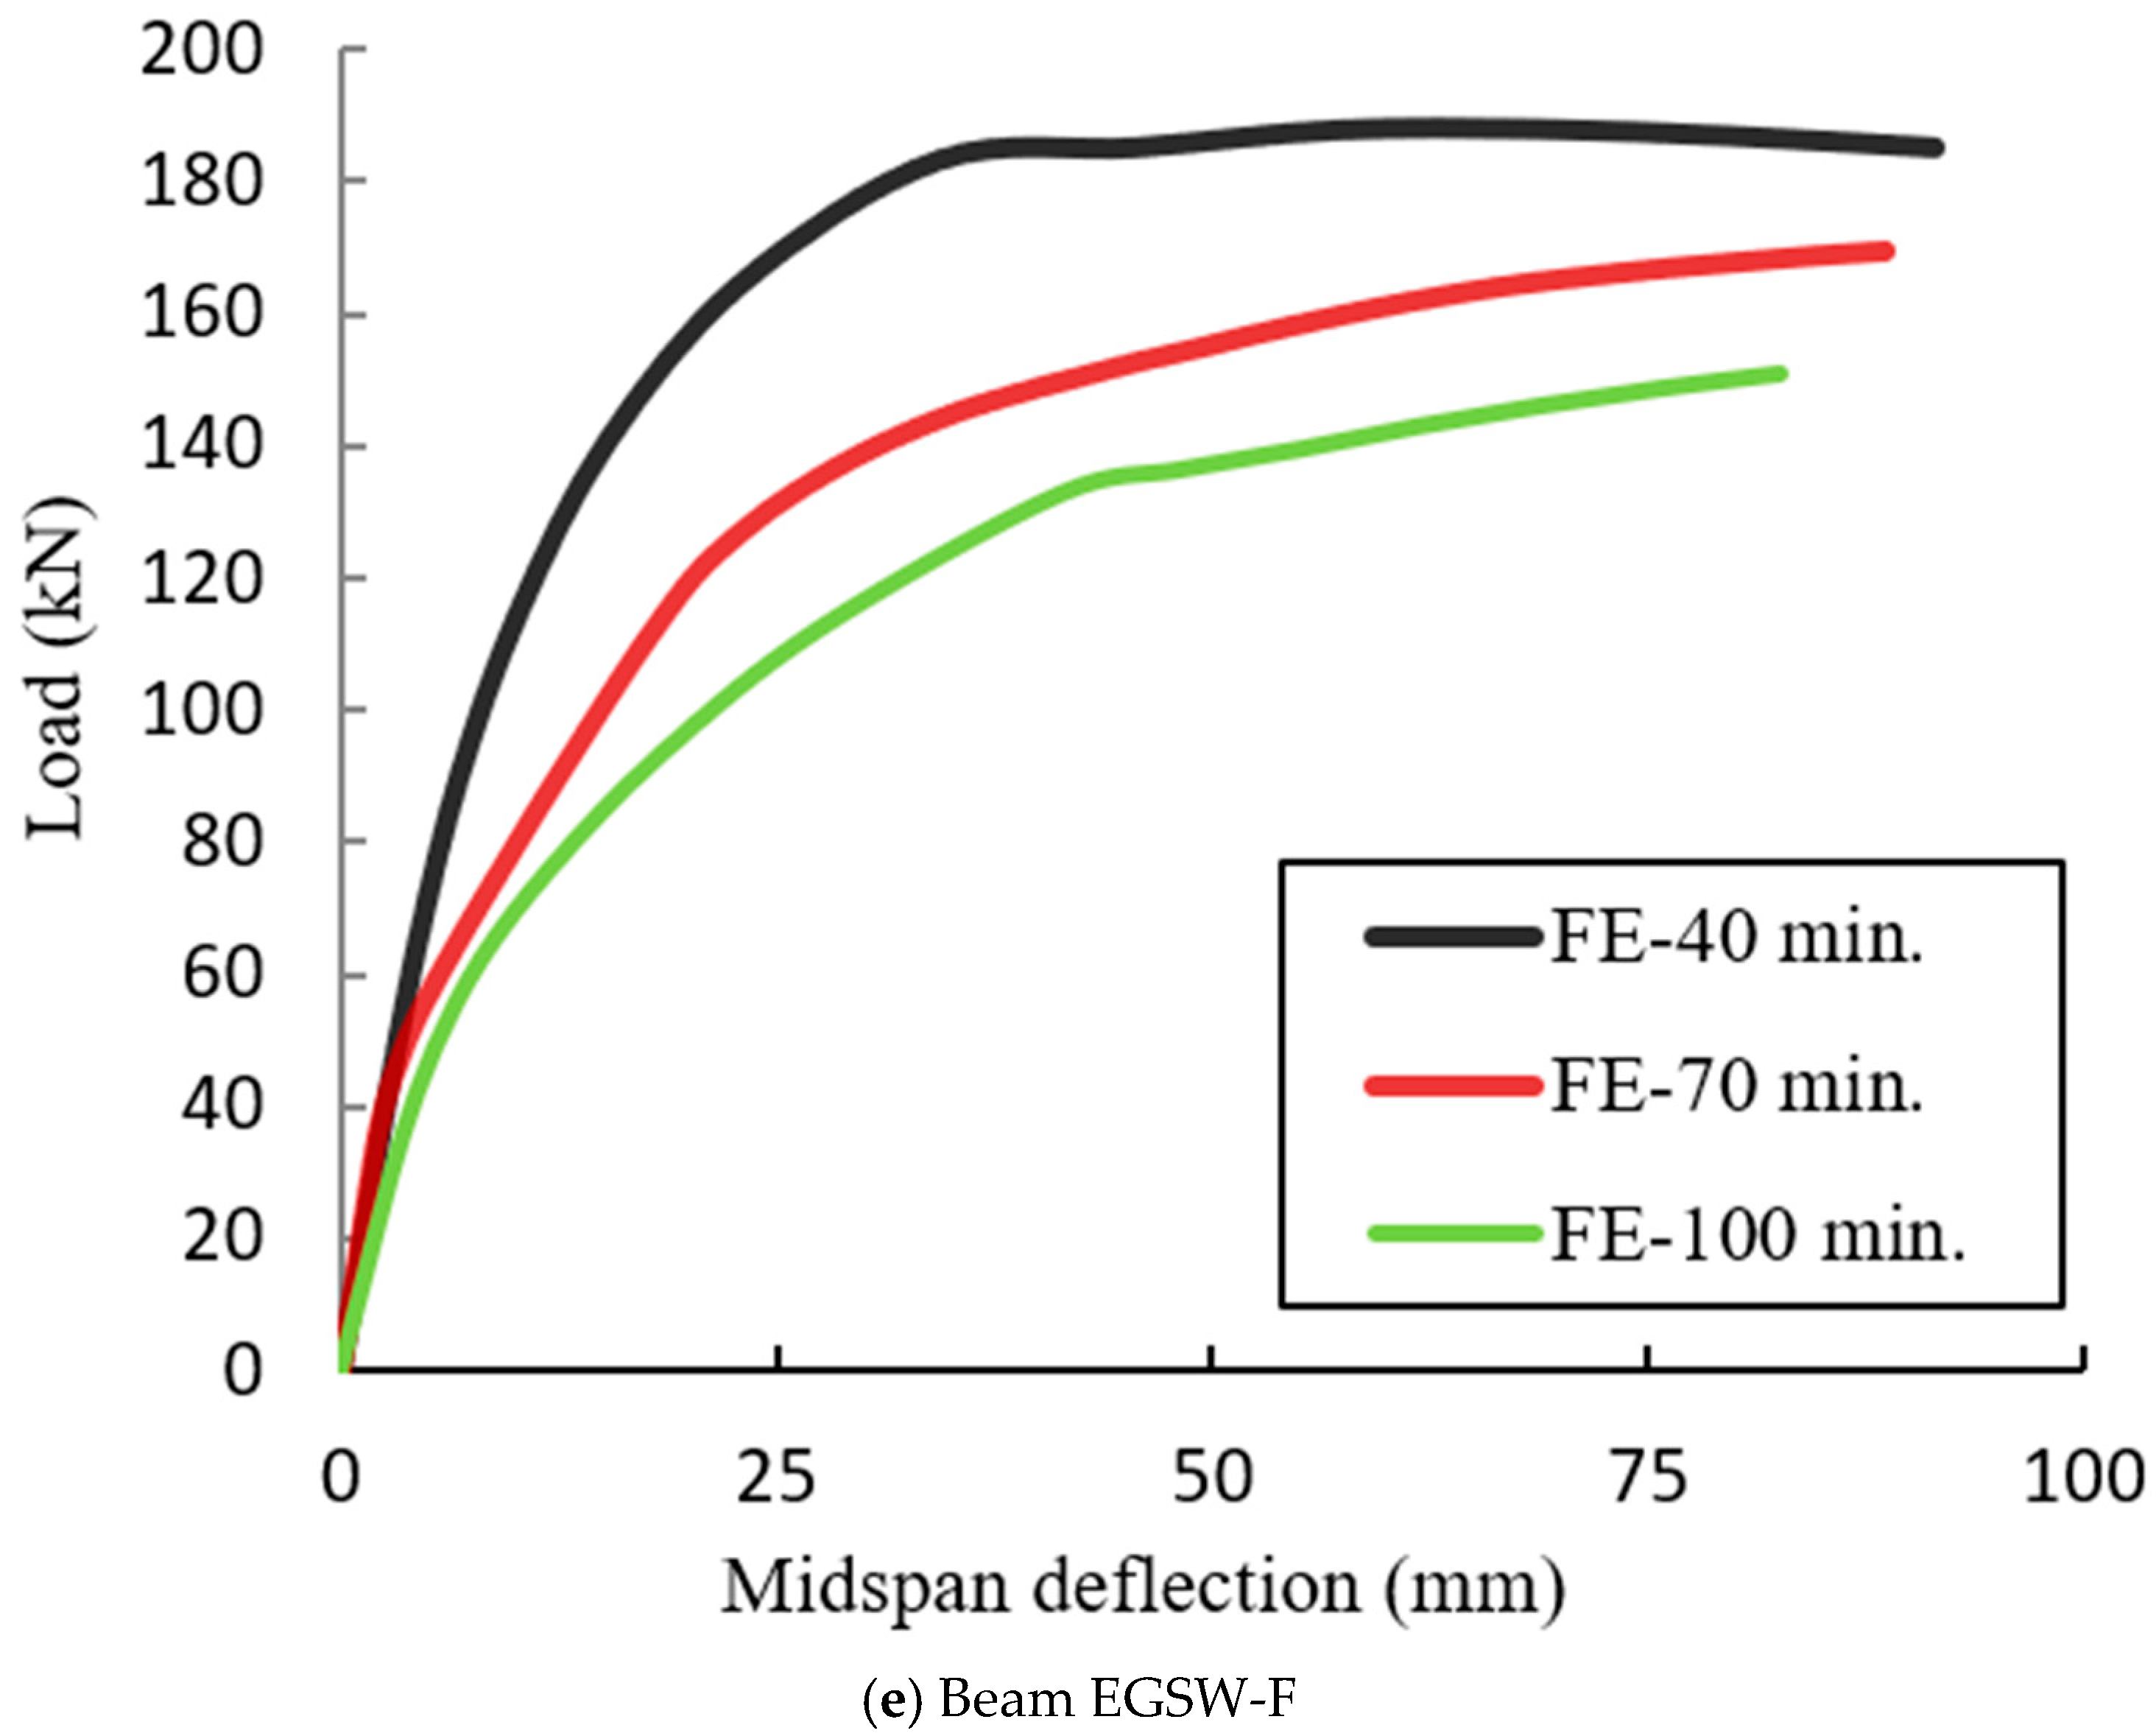
The effect of fire exposure duration on the post-fire load-carrying capacity was investigated using the validated model. The investigated fire exposure durations were 40, 70, and 100 min under a temperature of 700 °C. The FE results are presented in Figure 21 and listed in Table 13. Additional reductions in the residual capacities of the fire-damaged beams (Ref-F, EG-F, EGS-F, EGW-F, and EGSW-F) were due to exposure to longer fire durations. The improvement in the beam capacity due to using shear connectors and web stiffeners relative to the reference beam under the same exposure time decreased as the exposure duration increased. This improvement dropped from 97.64% to 88.54% when the exposure duration increased from 30 min to 90 min in the beam with shear connectors (see Table 13). However, slight changes in these improvements were observed in beam EG-F without shear connectors. The drop in the ultimate capacity of the reference beam (Ref-F) significantly increased from 15.8% to 35.2% when the exposure duration increased from 30 min to 90 min relative to the peer beams under ambient temperature. The longer exposure duration led to severe damage to the concrete and the bond between concrete and steel reinforcement, and subsequently, more reductions in the beam capacity occurred. Figure 22 shows the ultimate damage results from ABAQUS at different fire exposure durations (specimen EG-F).

4.5. Effect of Temperature

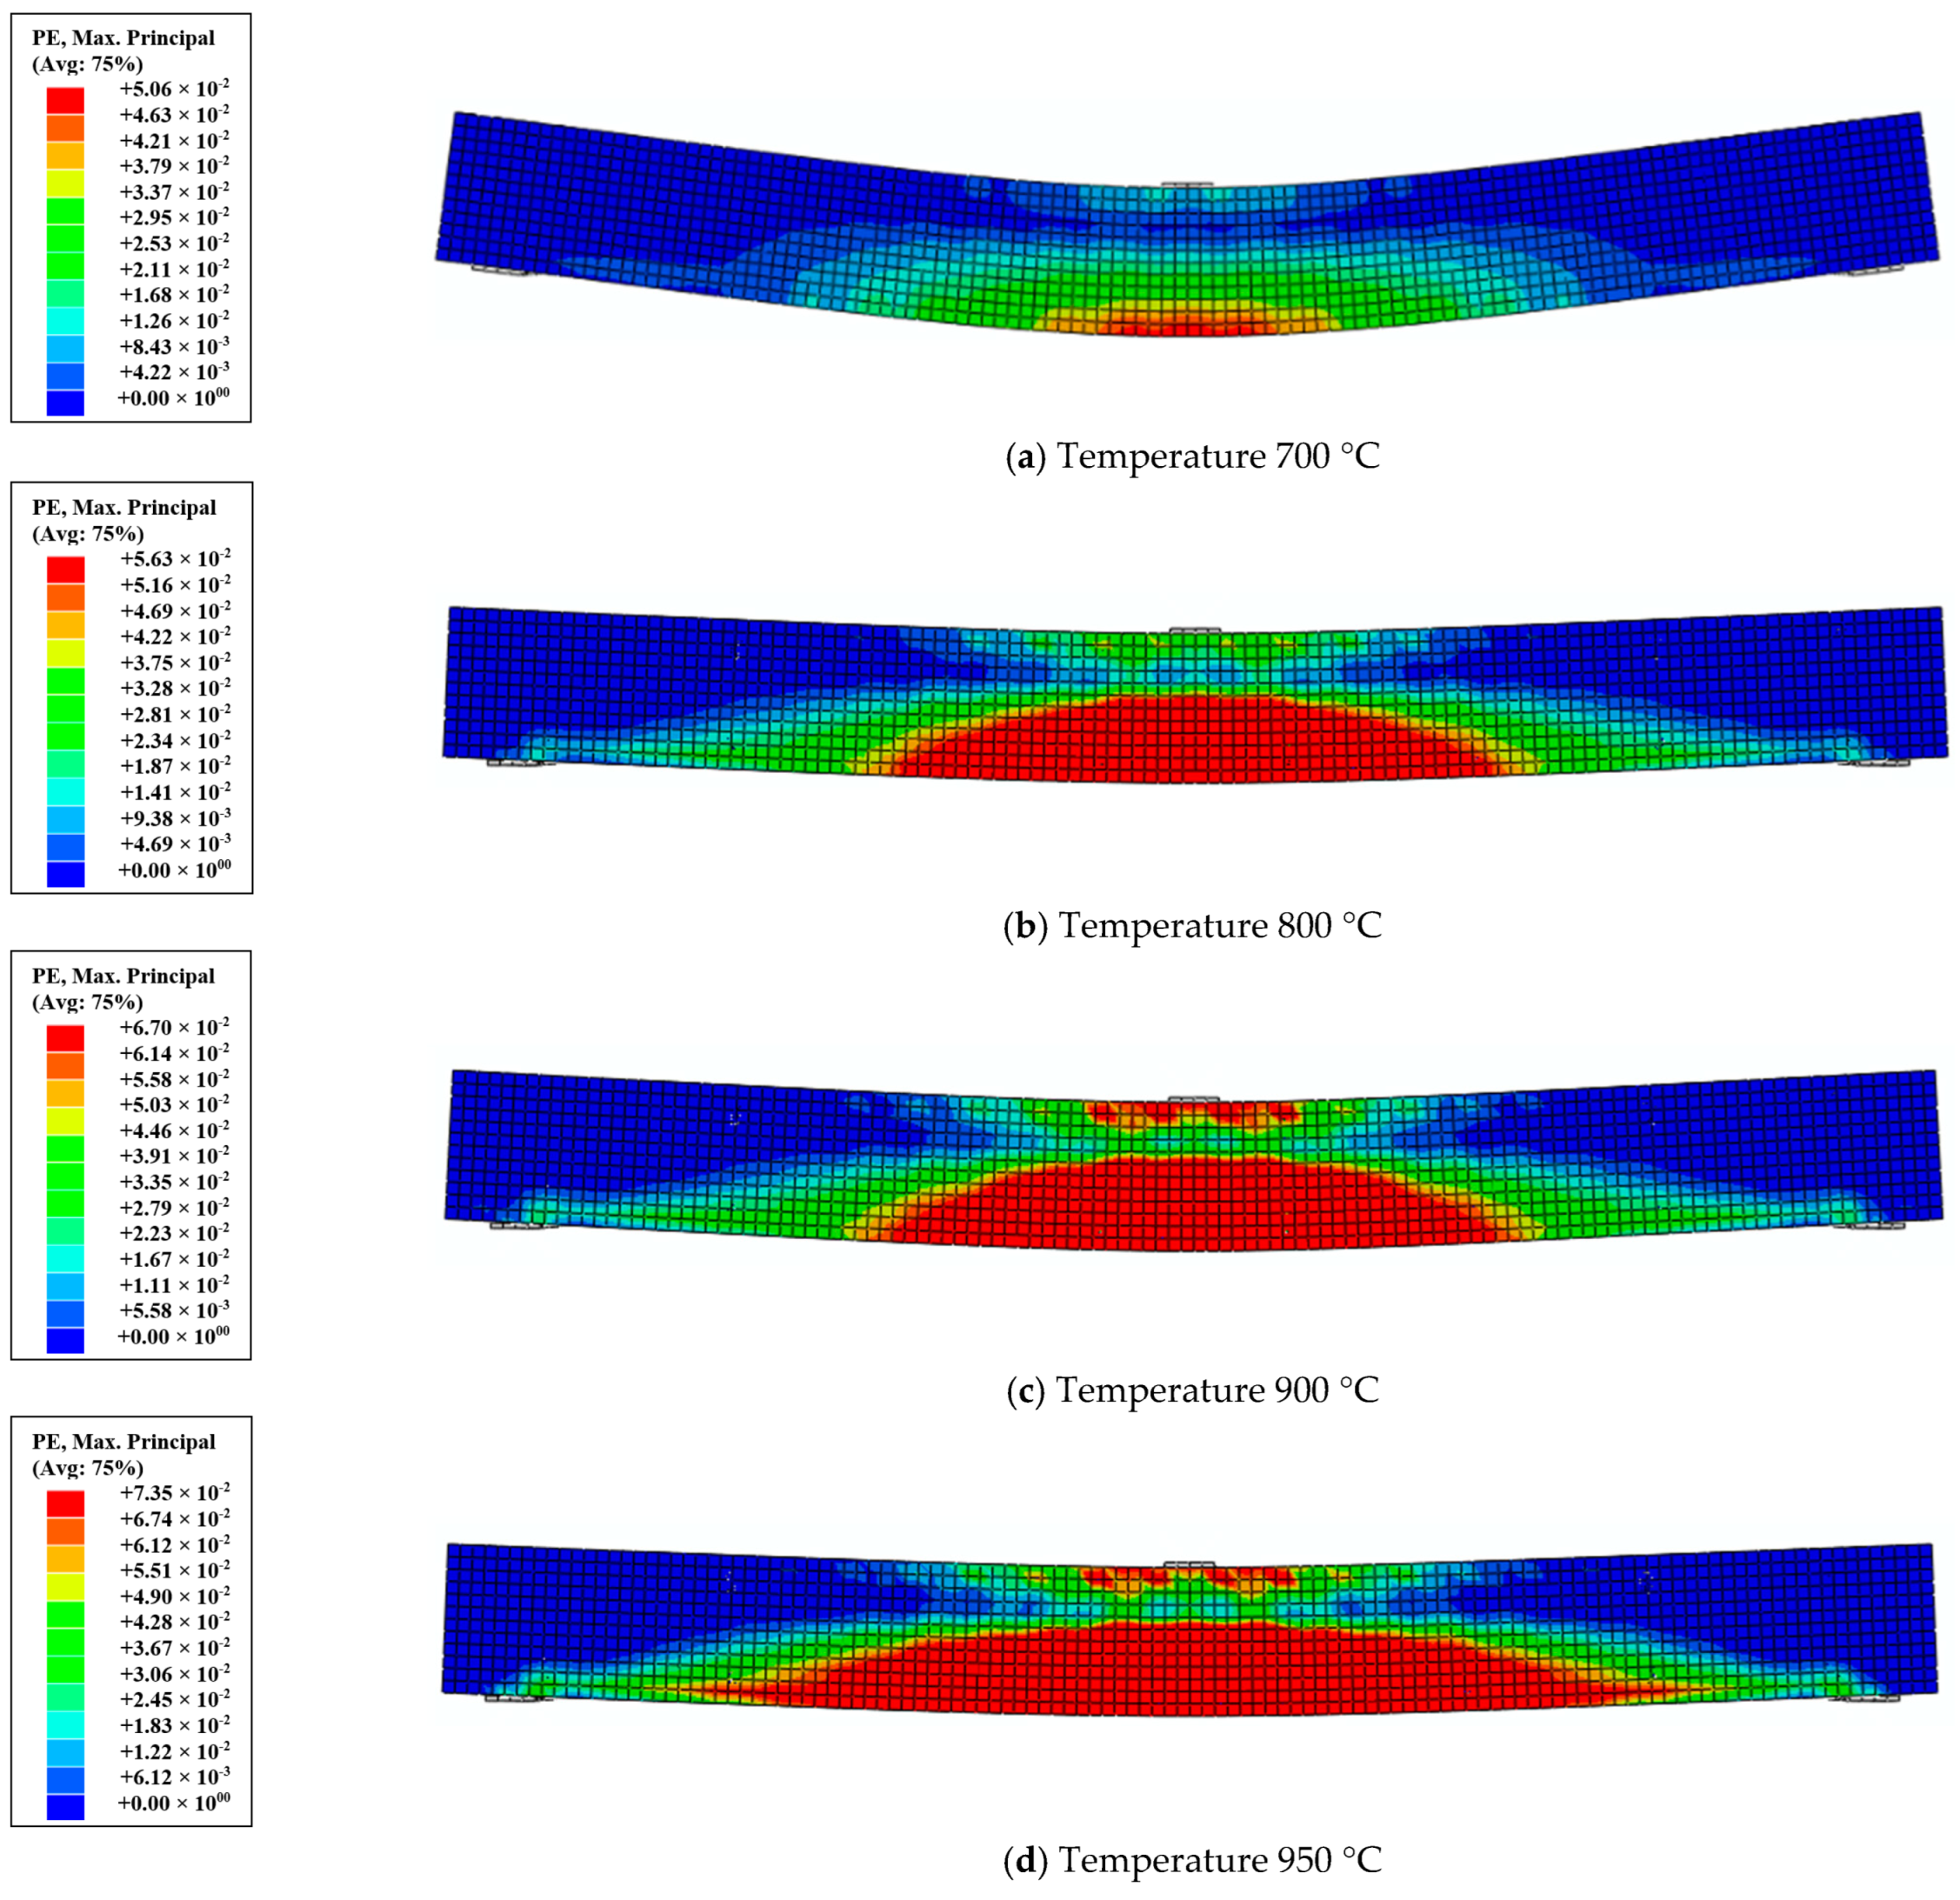
In this section, the effect of temperature was investigated. The analyzed beams were subjected to service load and elevated temperatures of 700 °C, 800 °C, 900 °C, and 950 °C for 70 min. Significant reductions in the beam capacity in terms of the residual behavior were obtained when the temperature increased from 700 °C to 950 °C, as shown in Figure 23. The reduction in the elastic modulus of concrete as well as in the effective cross-section due to cracking contributed to this loss of strength and stiffness. In addition, the higher temperature led to a weaker bond strength between the concrete and the embedded parts. Comparisons between the residual capacities of the analyzed beams are listed in Table 14. Figure 24 shows the ultimate damage results from ABAQUS under different temperatures (specimen EG-F).

5. Conclusions

In this research, experimental and numerical studies were carried out to investigate the performance of encased glass-fiber-reinforced polymer (GFRP) beams under fire. The test samples were divided into two groups to be tested under the effect of ambient and elevated temperatures. The first group was statically tested to investigate the monotonic behavior of the specimens. The second group was exposed to fire loading first and then statically tested to explore the residual behavior of the burned specimens. Adding shear connectors and web stiffeners to the GFRP beam was the main parameter in this investigation. Moreover, service loads were applied to the tested beams during the fire. Numerical analyses were performed using the general-purpose finite element (FE) ABAQUS package to conduct a parametric study. The investigated parameters included the effect of the exposure duration and the temperature. The following conclusions can be drawn based on the experimental and FE results:
  • The load capacities of the fire-damaged encased CFRP beams were less than their peers with the same configurations at ambient temperature. The load capacities dropped by 23–34%, and this drop was the highest in the cases of shear connectors and web stiffeners. However, the shear connectors and web stiffeners enhanced the load-bearing capacity of the tested beams (burned or unburned) relative to their reference beams.
  • The ductility of fire-damaged beams was lower than that of the unburned peer beams by 40.9–73%. The reduction was the highest when using shear connectors and web stiffeners. Providing shear connectors and web stiffeners at the same time caused more damage in the burned beam EGSW-F and subsequently a reduction in ductility.
  • Additional reductions were observed in the residual capacities of the fire-damaged beams due to exposure to longer fire durations. The improvement in the beam capacity due to using shear connectors and web stiffeners relative to the reference beam under the same exposure time decreased as the exposure duration increased.
  • Increasing the temperature to 700 °C, 800 °C, 900 °C, and 950 °C caused reductions in the residual capacities by about 25%, 45%, 70%, and 80% for the encased beams in comparison to their peers at ambient temperature.

Author Contributions

Conceptualization, A.A.A.; Data curation, A.E.-Z.; Formal analysis, T.H.I. and A.E.-Z.; Investigation, T.H.I.; Methodology, E.M.M.; Resources, E.M.M. and A.A.A.; Software, E.M.M.; Supervision, A.A.A. and A.E.-Z.; Validation, E.M.M. and T.H.I.; Visualization, T.H.I.; Writing—original draft, E.M.M. and T.H.I.; Writing—review & editing, A.A.A. and A.E.-Z. All authors have read and agreed to the published version of the manuscript.

Funding

This research received no external funding.

Institutional Review Board Statement

Not applicable.

Informed Consent Statement

Not applicable.

Data Availability Statement

Not applicable.

Acknowledgments

The experimental work of this research is part of the Ph.D. thesis of Enas M. Mahmood. The authors gratefully appreciate and thank the Structural Laboratory staff of the Department of Civil Engineering at the University of Baghdad, Iraq, for their support in the experimental part of the research. Furthermore, the authors would like to express their gratitude to the Consulting Engineering Bureau at the University of Baghdad (CEB-UB) for their assistance in completing the material test.

Conflicts of Interest

The authors declare no conflict of interest.

References

  1. Choi, E.G.; Shin, Y.S. The structural behavior and simplified thermal analysis of normal-strength and high-strength concrete beams under fire. Eng. Struct. 2011, 33, 1123–1132. [Google Scholar] [CrossRef]
  2. Mahmood, E.M.; Allawi, A.A.; El-Zohairy, A. Analysis and Residual Behavior of Encased Pultruded GFRP I-Beam under Fire Loading. Sustainability 2022, 14, 13337. [Google Scholar] [CrossRef]
  3. Allawi, A.A.; Ali, S.I. Flexural behavior of composite GFRP pultruded i-section beams under static and impact loading. Civ. Eng. J. 2020, 6, 143–2158. [Google Scholar] [CrossRef]
  4. Ibrahim, T.H.; Allawi, A.A.; El-Zohairy, A. Experimental and FE Analysis of Composite RC Beams with Encased Pultruded GFRP I-Beam under Static Loads. Adv. Struct. Eng. 2022, 26, 516–532. [Google Scholar] [CrossRef]
  5. Mahmood, E.M.; Allawi, A.A.; El-Zohairy, A. Flexural Performance of Encased Pultruded GFRP I-Beam with High Strength Concrete under Static Loading. Materials 2022, 15, 4519. [Google Scholar] [CrossRef]
  6. Ali, S.I.; Allawi, A.A. Effect of Web Stiffeners on the Flexural Behavior of Composite GFRP Concrete Beam Under Impact Load. J. Eng. 2021, 27, 76–92. [Google Scholar] [CrossRef]
  7. Ibrahim, T.H.; Allawi, A.A. The Response of Reinforced Concrete Composite Beams Reinforced with Pultruded GFRP to Repeated Loads. J. Eng. 2022, 29, 158–174. [Google Scholar] [CrossRef]
  8. Zhou, K.; Han, L.-H. Fire Performance of Concrete-Encased CFST Columns and Beam-Column Joints. In Proceedings of the 12th International Conference on Advances in Steel-Concrete Composite Structures, Valencia, Spain, 27–29 June 2018; pp. 779–786. [Google Scholar] [CrossRef]
  9. Morgado, T.; Correia, J.R.; Silvestre, N.; Branco, F.A. Experimental study on the fire resistance of GFRP pultruded tubular beams. Compos. Part B Eng. 2018, 139, 106–116. [Google Scholar] [CrossRef]
  10. Parthasarathi, N.; Satyanarayanan, K.S.; Thamilarasu, V. Thermal behavior of reinforced concrete beam with static loading condition. Int. J. Recent Technol. Eng. 2019, 8, 1484–1488. [Google Scholar] [CrossRef]
  11. Gao, W.Y.; Dai, J.G.; Teng, J.G.; Chen, G.M. Finite element modeling of reinforced concrete beams exposed to fire. Eng. Struct. 2013, 52, 488–501. [Google Scholar] [CrossRef]
  12. Kodur, V.K.R.; Agrawal, A. A numerical approach for evaluating the residual capacity of fire-damaged concrete members. Rev. ALCONPAT 2020, 10, 230–242. [Google Scholar] [CrossRef]
  13. Ahmed, A. The behavior of FRP-Strengthened Reinforced Concrete Beams under Fire Conditions. Ph.D. Thesis, Civil Engineering Michigan State University, East Lansing, MI, USA, 2010. [Google Scholar]
  14. Duan, D.; Ouyang, L.; Gao, W.; Xu, Q.; Liu, W.; Yang, J. Fire Performance of FRP-RC Flexural Members: A Numerical Study. Polymers 2022, 14, 346. [Google Scholar] [CrossRef] [PubMed]
  15. Cai, B.; Li, B.; Fu, F. Finite Element Analysis and Calculation Method of Residual Flexural Capacity of Post-fire RC Beams. Int. J. Concr. Struct. Mater. 2020, 14, 58. [Google Scholar] [CrossRef]
  16. Serȩga, S.; Wosatko, A. Numerical Prediction of Fire Resistance of RC Beams. AIP Conf. Proc. 2018, 1922, 130001. [Google Scholar] [CrossRef]
  17. ACI 318; Building Code Requirements for Structural Concrete (ACI 318-19) Commentary on Building Code Requirements for Structural Concrete (ACI 318R-19) an ACI Standard and Report from HIS. ACI: Farmington Hills, MI, USA, 2019.
  18. ASTM Designation C39-39M; Standard Test Method for Compressive Strength of Cylindrical Concrete Specimens Annual Book of ASTM Standards. ASTM: West Conshohocken, PA, USA, 2001.
  19. ASTM Designation C469-469M; Standard Test Method for Static Modulus of Elasticity and Poisson’s Ratio of Concrete in Compression ASTM International. ASTM: West Conshohocken, PA, USA, 2001.
  20. ASTM Designation A615-615M; Standard Test Method for Deformed and Plain Carbon-Steel Bars for Concrete Reinforcement Annual Book of ASTM Standards, American Association State Highway and Transportation Officials Standard AASHTO No.: M 31. ASTM: West Conshohocken, PA, USA, 2009.
  21. ASTM Designation D695-15; Standard Test Method for Compressive Properties of Rigid Plastics Annual Book of ASTM Standards, American International. ASTM: West Conshohocken, PA, USA, 2015.
  22. European Standard EN ISO 527-4; Determination of Tensile Properties of Plastics Part 4: Test Conditions for Isotropic and Orthotropic Fiber-Reinforced Plastic Composites, No. 1109a. ISO: Geneva, Switzerland, 1997.
  23. ASTM E119-00a; Standard Test Methods for Fire Tests of Building Construction and Materials. American Society for Testing and Materials. The United States of America legally binding document. ASTM: Washington, DC, USA, 2000.
  24. Rafi, M.M.; Nadjai, A. Experimental Behaviour of Carbon FRP Reinforced Concrete Beams at Ambient and Elevated Temperatures. J. Adv. Concr. Technol. 2008, 6, 431–441. [Google Scholar] [CrossRef]
  25. Ellis, D.S.; Tabatabai, H.; Nabizadeh, A. Residual Tensile Strength and Bond Properties of GFRP Bars after Exposure to Elevated Temperatures. Material 2018, 11, 346. [Google Scholar] [CrossRef]
  26. Yuan, J. Flexural Behavior of Composite Beams Reinforced with GFRP I-Section. Ph.D. Thesis, School of Civil, Mining, and Environmental Engineering, University of Wollongong, Wollongong, NSW, Australia, 2017. Available online: https://ro.uow.edu.au/theses1 (accessed on 18 May 2023).
  27. ABAQUS User Manual. Computer Software for Finite Element Analysis Dassault Systems; Simulia: Johnston, RI, USA, 2017. [Google Scholar]
  28. Earij, A.; Alfano, G.; Cashell, K.; Zhou, X. Nonlinear three–dimensional finite–element modeling of reinforced–concrete beams: Computational challenges and experimental validation. Eng. Fail. Anal. 2017, 82, 92–115. [Google Scholar] [CrossRef]
  29. Bazant, Z.P.; Chern, J.G.; You, C.M. Deformation of Progressively Cracking Partially Prestressed Concrete Beams. PCI J. 1992, 37, 74–85. [Google Scholar] [CrossRef]
  30. EN 1992-1-2; Eurocode 2: Design of Concrete Structures—Part 1–2: General Rules—Structural Fire Design. European Committee for Standardization: Brusseles, Belgium, 2004.
  31. Dwaikat, M.B.; Kodur, V.K.R. Hydrothermal model for predicting fire-induced spalling in concrete structural systems. Fire Safety J. 2009, 44, 425–434. [Google Scholar] [CrossRef]
  32. Hashin, Z. Failure criteria for unidirectional fiber composites. J. Appl. Mech. Trans. ASME 1980, 47, 329–334. [Google Scholar] [CrossRef]
  33. Yu, B.; Kodur, V.K.R. Factors governing the fire response of concrete beams reinforced with FRP rebars. Compos. Struct. 2013, 100, 257–269. [Google Scholar] [CrossRef]
  34. Hadi, M.N.S.; Yuan, J.S. Experimental investigation of composite beams reinforced with GFRP I-beam and steel bars. Constr. Build. Mater. 2017, 144, 462–474. [Google Scholar] [CrossRef]
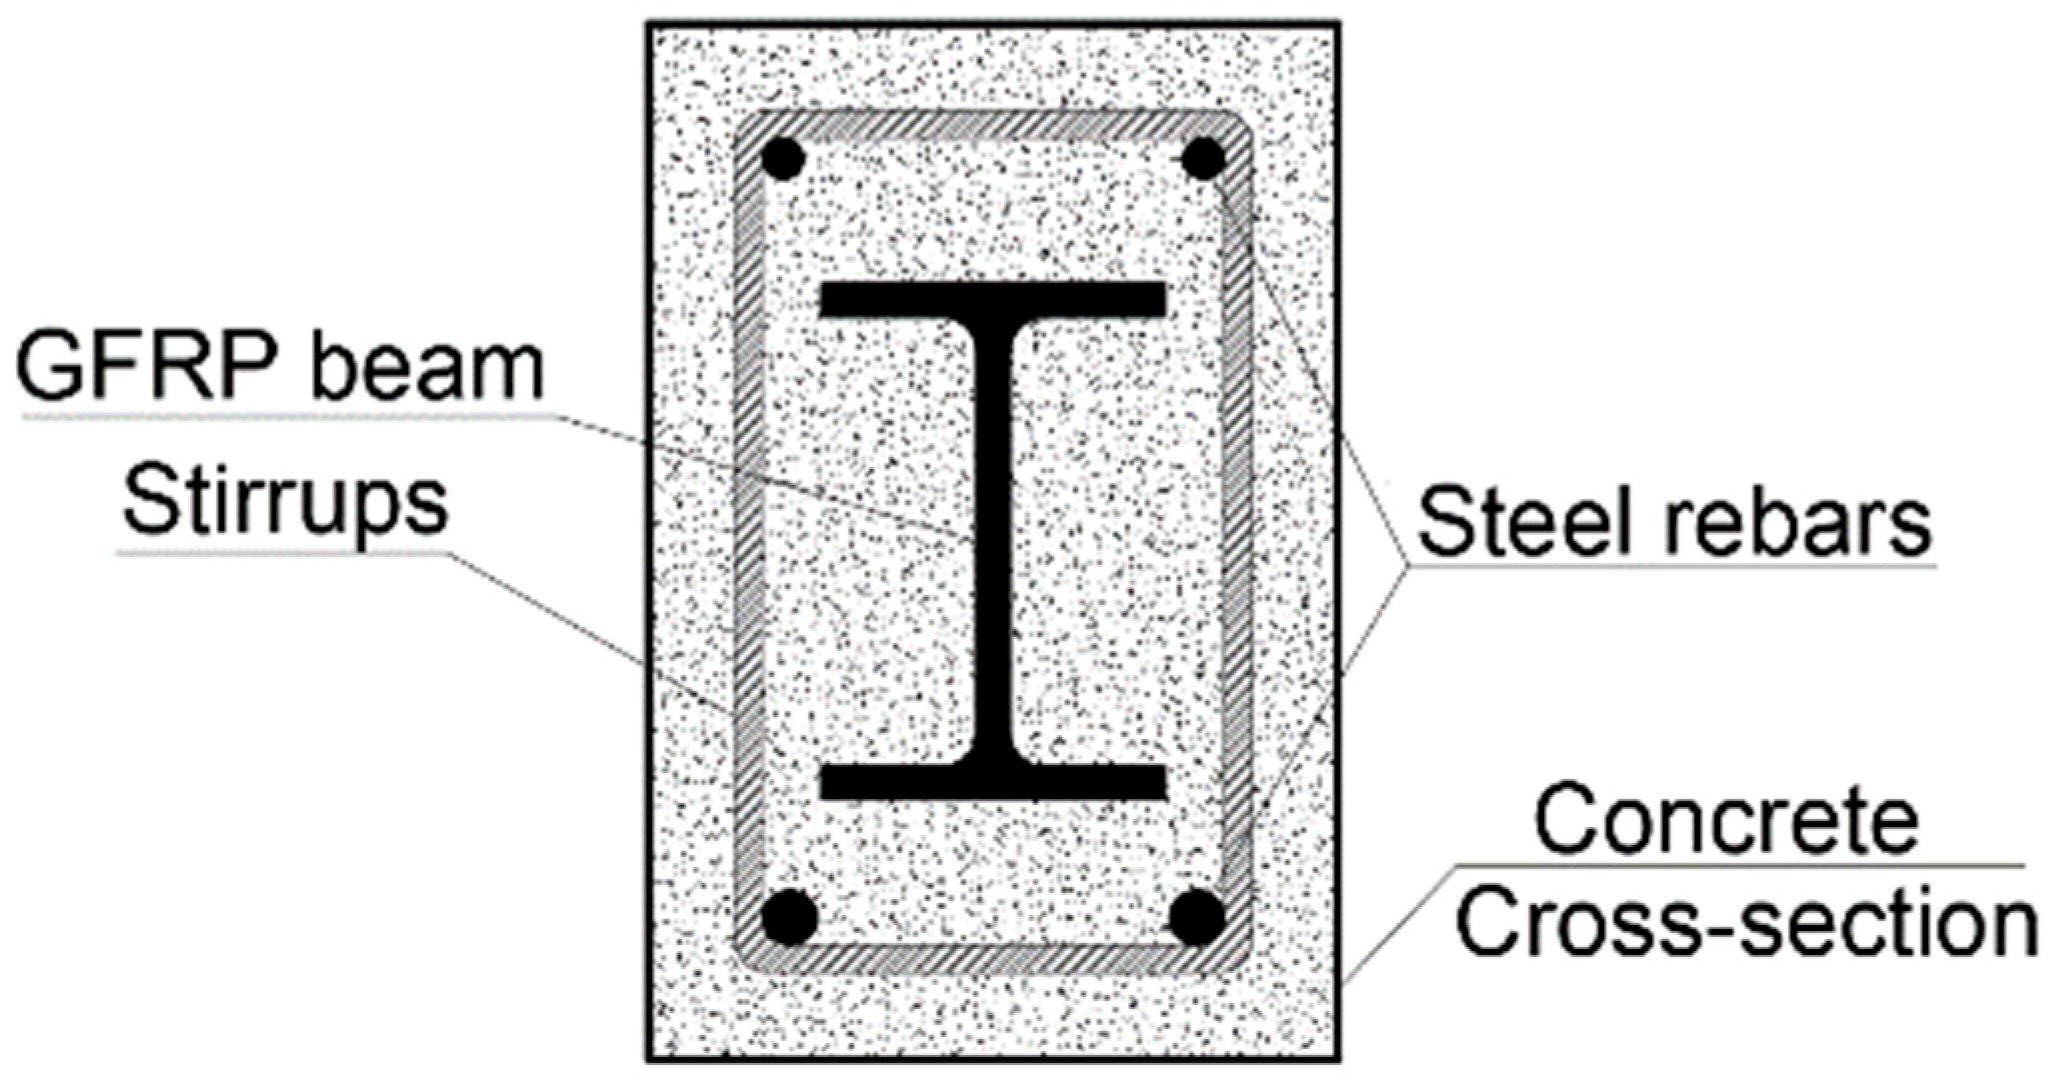
Figure 1. Cross-section of the encased GFRP I-section with reinforced concrete.
Fire 06 00212 g001
Figure 2. Schematic layout of the tested beams. (Dimensions are in mm).
Fire 06 00212 g002
Figure 3. Preparing the tested beams.
Fire 06 00212 g003
Figure 4. Coupons of the GFRP with dimensions.
Fire 06 00212 g004
Figure 5. Residual static test setup.
Fire 06 00212 g005
Figure 6. Fire test setup.
Fire 06 00212 g006
Figure 7. The service load at the mid-span of each beam during fire loading.
Fire 06 00212 g007aFire 06 00212 g007b
Figure 8. The mid-span deflections versus the fire loading time.
Fire 06 00212 g008
Figure 9. Residual behavior of the burned specimens.
Fire 06 00212 g009
Figure 10. Comparison between beams at ambient and post-elevated temperature.
Fire 06 00212 g010
Figure 11. Crack patterns and failure mode of beam Ref-F.
Fire 06 00212 g011
Figure 12. Incremental cracks for beam EGSW-F.
Fire 06 00212 g012aFire 06 00212 g012b
Figure 13. Two piecewise linear best fits for the load-deflection envelopes.
Fire 06 00212 g013
Figure 14. Comparison of ductility between the unburned and burned beams.
Fire 06 00212 g014
Figure 15. Comparison of energy between the unburned and burned beams.
Fire 06 00212 g015
Figure 16. Simulation of the encased beams in ABAQUS.
Fire 06 00212 g016aFire 06 00212 g016b
Figure 17. The behavior of concrete at ambient temperature.
Fire 06 00212 g017
Figure 18. Validations of the FE load-deflection relationships for the tested beams.
Fire 06 00212 g018aFire 06 00212 g018b
Figure 19. Crack pattern comparisons between the FE and experimental results.
Fire 06 00212 g019
Figure 20. Thermal strains at the end of the exposure period of 700 °C.
Fire 06 00212 g020
Figure 21. Post-fire load-displacement behavior of beams after different fire exposure times.
Fire 06 00212 g021aFire 06 00212 g021b
Figure 22. Ultimate damage results from the numerical ABAQUS at different fire exposure durations (specimen EG-F).
Fire 06 00212 g022
Figure 23. Effect of temperature on residual strength.
Fire 06 00212 g023
Figure 24. Ultimate damage results from the numerical ABAQUS under different temperatures (specimen EG-F).
Fire 06 00212 g024
Table 1. Details of the tested beams.
GroupSpecimensEncasedAddition *TemperatureType of Test
I Ref-A--AmbientStatic
EG-AGFRP-AmbientStatic
EGS-AGFRPSAmbientStatic
EGW-AGFRPWAmbientStatic
EGSW-AGFRPS and WAmbientStatic
II Ref-F--700 °CFire and residual static
EG-FGFRP-700 °CFire and residual static
EGS-FGFRPS700 °CFire and residual static
EGW-FGFRPW700 °CFire and residual static
EGSW-FGFRPS and W700 °CFire and residual static
* S: shear connector, W: Web stiffener, and SW: Shear connector and web stiffeners.
Table 2. The concrete mix used in this study.
Cement
(kg/m3)
Fine Aggregate
(kg/m3)
Coarse Aggregate
(kg/m3)
Water
(kg/m3)
Admixture
(kg/m3)
475 88091016515.25
Table 3. Tension test results for the used reinforcement bars.
Diameter
(mm)
As
(mm2)
Yield Stress, ƒy
(MPa)
Ultimate Strength, ƒu
(MPa)
Elongation
(%)
Grade
TestASTM-A615
(min.)
TestASTM-A615
(min.)
TestASTM-A615
(min.)
16 203.58520.73420687.0755023960
10 76.82407.7280465.63420211140
Table 4. Properties of pultruded GFRP I- section beam.
Mechanical PropertiesValue
Transverse Compressive Strength (MPa) 118.3
Longitudinal Compressive Strength (MPa) 326.14
Longitudinal Tensile Strength (MPa) 347.5
Longitudinal Modulus of Elasticity (MPa) 27,100
Transverse Modulus of Elasticity (MPa) 6800
Longitudinal Compressive Strain (%) 0.225
Transverse Compressive Strain (%) 0.93
Longitudinal Tensile Strain (%) 2.735
Longitudinal Compressive Strength (MPa) 354.17
Longitudinal Modulus of Elasticity (MPa) 26.64
Longitudinal Compressive Strain (%) 0.322
Geometrical properties *
Area (mm2) 3300
Perimeter (mm) 680
Moment of inertia (mm4) 11,647,500
Mass (kg/m) 5.94
Web and Flange thickness (mm) 10
Physical properties *
Relative density 1.8
Water absorption (%) 0.5
Specific Heat (KJ) 1.5
Thermal Conductivity (W/mk) 0.37
Coefficient of thermal expansion (1/k) 1.3 × 10⁻⁵
* The properties were supplied by the manufacturer.
Table 5. Summary of the static test results.
SpecimenInitial Crack Load
(kN)
Yield Load (kN)Peak Load
(kN)
Change
(%)
Yield Displacement (mm) *Change
(%)
Failure Mode
Ref-A 19.9390.22100.4632.80Yielding of reinforcement and crushing in concrete
EG-A 20.24151.81159.04+58.333.07+0.8Yielding of reinforcement, crushing of concrete, and fracture in GFRP
EGS-A 19.73148.26201.54+100.648.68+48.4Yielding of reinforcement, crushing of concrete, and fracture in GFRP
EGW-A 20.12175.20198.24+97.338.96+18.8Yielding of reinforcement, crushing of concrete, and fracture in GFRP
EGSW-A 22.26224.43231.88+130.852.56+60.2Yielding of reinforcement, crushing of concrete, and fracture in GFRP
* Central displacement at yielding of the steel reinforcement.
Table 6. Summary of the fire test results.
SpecimenInitial
Deflection
(mm)
Initial Stiffness
(kN/mm)
First Period
ASTM-E119
@ 10 min
Second Period
Exposure 700 °C
@70 min
Third Period
Cooling
Deflection
(mm)
Stiffness
(kN/mm)
Deflection
(mm)
Stiffness
(kN/mm)
Ultimate Deflection
(mm)
Residual Deflection
(mm)
Ref-F 38.3346.25112.27161
EG-F 41075.71192.10253
EGS-F 51077.14143.57231
EGW-F 51095.55212.38323
EGSW-F 51388.13164.06272
Table 7. The residual behavior of the burned beams.
SpecimenYielding Load
(kN)
Change (%)Peak Load
(kN)
Change (%)Ultimate Deflection (mm)Strain in ConcreteChange in Strain (%)
Ref-F 59.880.656.70.0029
EG-F 83.6+39.7122.1+51.568.60.0032+10
EGS-F 92.5+54.4149.6+85.6112.50.004+38
EGW-F 93.1+55.4130.1+61.334.70.0033+14
EGSW-F 107.1+78.7166.2+106.281.10.0033+14
Table 8. Comparisons between the fire-damaged beams and their unburned peers.
SpecimenUnburnedBurnedChange (%)
Peak Load (kN)Displacement at Peak Load (mm)Peak Load (kN)Displacement at Peak Load (mm)Peak Load Disp.
Ref 100.432.880.656.7−19.7+72.9
EG 159.133.1122.168.6−23.1+107.7
EGS 201.548.6149.6112.5−25.7+131.2
EGW 198.238.9130.134.7−34.3−10.8
EGSW 231.852.5166.281.1−28.3+54.4
Table 9. Ductility values for the tested beams.
GroupSpecimenSlope S1Slope S2Slope
S
Total Energy ET (kN·mm)Elastic Energy EE (kN·mm)Ductility
μE
Change
(%)
I Ref-A6.10.95.154439003.52
EG-A6.30.96.111,93315764.28+21.6
EGS-A6.816.116,34485210.05+185.5
EGW-A6.71.66.312,9628957.74+119.8
EGSW-A7.60.47.417,39711548.04+128.4
II Ref-F4.01.13.436459622.39
EG-F5.11.14.1731218022.53+5.86
EGS-F4.71.83.714,21730142.86+19.67
EGW-F5.62.14.610,92617393.64+52.3
EGSW-F5.51.54.111,13333522.16−9.6
Table 10. Comparisons between the ductility values for the unburned and burned beams.
SpecimenDuctility
of Group I
Ductility of
Group II
Change
(%)
Total Energy ET of Group I (kN·mm)Total Energy ET of Group II (kN·mm)Change
(%)
Ref 3.522.3932.105443364533.03
EG 4.282.5340.911,933731238.72
EGS 10.052.8671.5416,34414,21713.01
EGW 7.743.6452.9712,96210,92615.71
EGSW 8.042.1673.1317,39711,13336.00
Table 11. Mechanical properties and progressive damage parameters of the GFRP material.
DefinitionValue
Engineering Elastic Constants Longitudinal Modulus of Elasticity (Ez) 27.1 GPa
Transverse Modulus of Elasticity (Ex = Ey)6.8 GPa
Transverse Shear Modulus of Elasticity (Gxy)17.5 GPa
In-Plane Shear Modulus of Elasticity (Gzx = Gzy)2.7 GPa
Major Poisson Ratio (υzx= υzy)0.23
Minor Poisson Ratio (υxy)0.1
Strength Values Tensile StrengthLongitudinal347.5 MPa
Transverse50 MPa
Compressive StrengthLongitudinal326.14 MPa
Transverse118.3 MPa
Shear StrengthTransverse8.04 MPa
In-Plane104.23 MPa
Damage Evolution Tensile Fracture EnergyLongitudinal18.3
Transverse5
Compressive Fracture EnergyLongitudinal5.8
Transverse5.5
Table 12. Comparisons between the FE and experimental results.
Beam No.Exp. ResultsFEM ResultsChange (%)
Ultimate Load (kN)Max. Disp. (mm)Ultimate Load (kN)Max. Disp. (mm)Ultimate Load Max. Disp.
Ref-A 100.4663104.2464.113.71.76
EG-A 159.0491162.5193.192.182.4
EGS-A 201.55115206.02120.122.224.45
EGW-A 198.24100206.67102.244.252.24
EGSW-A 231.8890233.9694.070.904.52
Ref-F 80.625681.85581.533.57
EG-F 122.1577124.14801.633.90
EGS-F 149.64116156.411184.521.72
EGW-F 130.1298132.641021.944.08
EGSW-F 166.2487169.75892.112.30
Table 13. Summary of the fire duration effect.
Beam No.Ultimate Load (kN)
Ambient
Temperature
Exposure to Temperature of 700 °C
30 min60 min90 min
Ref-F 104.2487.7781.8567.55
EG-F 162.51137.35124.14103.19
EGS-F 206.02166.46156.41127.36
EGW-F 206.67167.72132.64119.72
EGSW-F 233.96188.06169.75151.14
Beam No.Comparison of the results with a reference beam (%)
Ambient
temperature
Exposure to the temperature of 700 °C
30 min60 min90 min
Ref-F
EG-F 55.9056.4951.6752.76
EGS-F 97.6489.6591.0988.54
EGW-F 98.2691.0962.0577.23
EGSW-F 124.44114.26107.39123.74
Beam No.Comparison of the results with ambient temperature (%)
Ambient
temperature
Exposure to the temperature of 700 °C
30 min60 min90 min
Ref-F 15.8021.4835.20
EG-F 15.4823.6136.50
EGS-F 19.2024.0838.18
EGW-F 18.8235.8242.07
EGSW-F 19.6227.4435.40
Table 14. Summary of the effect of temperature on residual strength.
Beam No.Ultimate Load (kN)
Ambient
Temp.
Exposure to Elevated Temperature
700 °CChange %800 °CChange %900 °CChange %950 °CChange %
Ref-F 104.2481.8521.4861.4941.0138.2263.3324.0776.91
EG-F 162.51124.1423.6193.8542.2552.6967.5832.3380.12
EGS-F 206.02156.4124.08121.3941.0760.8670.4638.3481.39
EGW-F 206.67132.6435.82104.6249.3850.7175.4633.5683.76
EGSW-F 233.96169.7527.44124.2446.9045.8880.3933.6785.61
Disclaimer/Publisher’s Note: The statements, opinions and data contained in all publications are solely those of the individual author(s) and contributor(s) and not of MDPI and/or the editor(s). MDPI and/or the editor(s) disclaim responsibility for any injury to people or property resulting from any ideas, methods, instructions or products referred to in the content.