Article

Analysis of a Novel Proposal Using Temperature and Efficiency to Prevent Fires in Photovoltaic Energy Systems

by
Jose Manuel Juarez-Lopez
1,
Jesus Alejandro Franco
1,*,
Quetzalcoatl Hernandez-Escobedo
1,*,
David Muñoz-Rodríguez
2 and
Alberto-Jesus Perea-Moreno
2,*
1
Escuela Nacional de Estudios Superiores Unidad Juriquilla, Universidad Nacional Autónoma de Mexico, Blv. Juriquilla 3001, Queretaro 76230, Mexico
2
Departamento de Física Aplicada, Radiología y Medicina Física, Campus Universitario de Rabanales, Universidad de Córdoba, 14071 Córdoba, Spain
*
Authors to whom correspondence should be addressed.
Fire 2023, 6(5), 196; https://doi.org/10.3390/fire6050196
Submission received: 18 March 2023 / Revised: 29 April 2023 / Accepted: 8 May 2023 / Published: 10 May 2023

Abstract

:
Fires in photovoltaic (PV) electrical systems are a real and serious problem because this phenomenon can have severe consequences for the safety of people and the environment. In some cases, fires result from a lack of maintenance or improper installation of PV modules. It is essential to consider prevention and continuous monitoring of the electrical parameters to minimize these risks, as these factors increase the temperature of the photovoltaic modules. The use of thermal analysis techniques can prevent hotspots and fires in photovoltaic systems; these techniques allow detecting and correcting problems in the installation, such as shadows, dirt, and poor-quality connections in PVs. This paper presents a case study of the implementation of thermal analysis in an installation of photovoltaic modules connected to a solar pumping system to identify the formation of hotspots through thermal images using an unmanned aerial vehicle (UAV). Here, a novel methodology is proposed based on the comparison of temperature increases concerning the values of short circuit current, open circuit voltage, and real efficiency of each PV module. In addition, an electrical safety methodology is proposed to design a photovoltaic system that prevents fires caused by hotspots, contemplating critical parameters such as photovoltaic power, number of photovoltaic modules, DC:AC conversion ratio, electrical conductor selection, control devices, and electrical protection; the performance power expected was obtained using standard power test conditions, including irradiance factor, photovoltaic module (PVM) temperature factor, and power reduction factor.

1. Introduction

The use of photovoltaic (PV) installations for electricity generation has been in-creasing rapidly over the past few decades, and it is projected to continue growing in the coming years. According to the International Renewable Energy Agency (IRENA), the global capacity of PV installations increased from 101 gigawatts (GW) in 2012 to over 800 GW in 2021. This growth is driven by falling costs, government incentives and policies, and increasing awareness of the environmental benefits of renewable energy sources. China is the world’s largest producer of PV installations, followed by the United States, Japan, and Germany. The growth of PV installations has also been significant in developing countries such as India, which reached 49.3 GW of solar photovoltaic power capacity in 2021 [1].
PV electrical systems have become a popular solution for renewable energy generation worldwide; however, along with their growing popularity, there has been an increase in the number of fires caused by failures in these electrical systems [2]. Fires in PV installations can be catastrophic, causing significant economic and environmental losses and seriously risking public safety. Most fires caused by PV system failures are due to electrical problems, such as arcing, short circuits, and overloads. Various factors, including poor installation, poor component selection, lack of proper maintenance, and poor system design, can cause these problems [3,4].
Additionally, fires can be exacerbated by external factors such as extreme weather conditions, lack of lightning protection, and lack of proper insulation. Understanding the mechanisms that trigger fires in photovoltaic systems is essential to develop effective preventive and corrective strategies, thereby minimizing the associated risks [5]. Although specific safety rules and regulations exist for installing and maintaining PV systems, continuous research is still required to improve knowledge about risk factors and mitigation measures [6]. In recent years, various studies have focused on the investigation and analysis of this phenomenon associated with photovoltaic systems, such as the case of Ju et al. [7], who studied the fire properties of a flexible photovoltaic module (PVM) and found that polyethylene terephthalate is the main component responsible for the decomposition and burning of the flexible PVM. Vaverkova et al. [8] analyzed the impact of photovoltaic power plants on vegetation and the associated fire hazards; as a result, they revealed that eliminating fire hazards is necessary to employ suitable vegetation management methods. Finally, Szultka et al. [9] proved that the power cables in PV systems exceed limit temperatures when the cables are directly exposed to solar radiation, showing that these elements are a significant agent in the cause of fires.
A large number of the studies carried out on the subject have focused on the related applications in building integrated photovoltaic (BIPV) and building attached photovoltaic (BAPV), such as [10,11,12,13,14,15,16]; consequently, Mohd et al. [17] presented a fault tree analysis of fires related to PV systems to understand the failure rate in the electrical components. Their quantitative analysis established an annual fire incident frequency of 0.0289 fires per MW; similarly, Cancelliere et al. [18] analyzed a set of data about the regulations and standards in Europe for the identification of fires derived from photovoltaic installations, and they also studied the new protocols focused on fire rating PV roofs. Likewise, Yang et al. [16] provided a comparison of regulatory frameworks applicable to BIPV modules in different countries, including standards and regulations classified by country. Zhao et al. [19] presented an investigation on the fire risks of building-integrated solar photovoltaic buildings; as a final result, it was shown that the influence of fire in photovoltaic systems installed in a building with a flat roof is more resistant than in a system installed in a building with a pitched roof. Similarly, Kristensen et al. [20] conducted an experimental study of fire behavior on flat roof constructions with multiple PVMs. The study demonstrated that a small initial fire under a photovoltaic installation could become a dangerous scenario due to the change in the fire dynamics of the system. In another subsequent study, Kristensen et al. [21] proposed a critical gap height for different modules sizes that could reduce the fire risk associated with PVMs on flat roofs. Consequently, some authors developed critical analyzes of various studies in state of the art on the topics of photovoltaic systems in buildings, such as fire safety and mitigation strategies, best PV installation practices, current regulations and standards, and even safety practices for firefighters during photovoltaic fires [22,23,24,25,26].
According to Wu et al. [27], there are two main types of fire risk mitigation solutions: structural reconfigurations and faulty diagnosis algorithms. The first refers to reducing the hotspot effect, as has been done in different studies, such as that of Dhimish et al. [28], who presented the design and development of a hotspot mitigation technique using a simple, low-cost, and reliable hotspot activation technique with high-performance results. In a second study, Dhimish and Badran [29] developed a current-limiting system that is capable of mitigating the current flow of PV modules affected by mismatch conditions, including partial shading and hotspot phenomena. Guerriero et al. [30] demonstrated a bypass circuit to avoid hotspots in PV systems, thereby avoiding failures and fires. The second fire risk mitigation solution is related to diagnosis through different techniques. Pillai and Dhanup [31] reviewed numerous algorithms and fault detection techniques available for photovoltaic systems that have proven practical and feasible to implement.
Therefore, to avoid the formation of hotspots that generate fires, it is recommended to have an hourly monitoring control of the electrical parameters delivered by the PVMs’ arrays to allow the detection of anomalies. Moreover, to detect fire hazards due to hotspots, performing periodic readings of thermal images is necessary, as they allow a real-time thermal diagnosis and the detection of any damage; it also makes it easier to keep a history of the occurring temperature gradients [32,33,34]. Performing a thermal analysis of a PVM installed in the parking lot of the Escuela Nacional de Estudios Superiores Unidad Juriquilla of the UNAM (ENES J-UNAM), it is possible to locate high-temperature zones with their minimum and maximum values and hotspots, as shown in Figure 1. This type of PVM is currently used for parking lot lighting systems and is susceptible to energy losses due to dust accumulation and bird waste [35,36].
In Figure 1, PVMs in the diode protection back module have the highest temperature concentration. In these cases, it is recommended to perform energy diagnostic tests to determine their lifetime, as they can cause a fire that could damage the power grid if not correctly addressed. It is important to note that in these isolated grid systems, batteries are used to store the energy obtained from the PMVs to be used when the need for consumption arises. However, commonly, these are stored together with solar charge controllers without electrical protection in small cabinets without ventilation outlets because they are airtight for outdoor use. Moreover, when the battery overheats due to the temperature inside the cabinet, it releases toxic gases and explodes, causing fires that can even grow [37].
Currently, PVMs are frequently used in street lighting recharge systems composed of batteries and power LEDs with a collimator lens to increase the illumination range due to advances in the efficiency of monocrystalline solar cells and their small size [38,39,40]. However, this makes them more prone to generate fires and short circuits, as they are not adequately maintained, owing to the height at which they are installed. Based on the thermal analysis of lighting systems in the parking lots of ENES J-UNAM, this is demonstrated in Figure 2.
Despite the advances in the establishment of regulations in several countries and the proposals for new methodologies for the prevention of and responses to fire phenomena in PV systems, there is still not enough information, and strategies are not well defined; therefore, this work presents a novel methodology for the detection of faults in PVMs that can generate fire based on the comparison of thermal analyses performed with thermal imaging and the determination of the electrical parameters of electrical current and electrical potential difference supplied by the PVMs on-site in order to detect possible fire risks in renewable installations of photovoltaic systems and reduce energy power losses.
The main contributions are summarized below:
  • A novel methodology for the detection of hotspots in PVMs that can generate fires based on the relationship between thermal analysis and the variations in the magnitude of the measured VOC and ISC.
  • An electrical security methodology proposal for the design of a PV system to prevent hotspot fires.

2. Materials and Methods

Thermal Analysis

An individual thermal analysis was performed for the detection of hotspots in PVMs that can generate fire in a solar pumping photovoltaic system. It was based on thermal images obtained with an UAV type DJI Mavic 2 Enterprise at a distance of 0.5 m above the PVMs at 13 h at the geographical coordinates 20.7051, −100.4482, with an irradiance of ~820 W/m2 at 50% humidity and 31 °C ambient temperature. The power of the PVMs analyzed was equal to 465 W as configurated in a 144 solar cells model (AS-6M144-HC-465W), and an efficiency of 21.27% was reported in standard test conditions (STC).
The PVM operating temperature (TmaxPVM) was determined based on the irradiance at the site (Irr-site), the irradiance of the normal operating temperature of the cells (NOCT) of the PVM (Irr-NOCT), the NOCT established by the PVM data sheet (TNOCT), the ambient temperature established for the NOCT (Tenv-NOCT) and the ambient temperature of the site (Tenv-site) with Equation (1). Furthermore, it was compared with the reading obtained by the UAV thermal camera.
T max PVM = I rr-site I rr-NOCT T N O C T T env-NOCT + T env-site
The PVM temperature differential (ΔT) was determined, considering the (TmaxPVM) and the PVM cell temperature at STC (Tcell-STC) reported in the datasheet, according to Equation (2) [41]. Temperature differential ΔT allows estimation of the percentage of the energy losses of the open circuit voltage (%LVoc), short circuit current (%LIsc), and maximum power (%LPmax) based on the temperature coefficient of the open circuit voltage (CT-Voc), short circuit current temperature coefficient (CT-Isc) and maximum power temperature coefficient (CT-Pmax) due to the temperature rise in the PVM, with Equations (3)–(5) successively [41,42].
Δ T = T max P V M T cell-STC
% L V o c = Δ T C T - V O C
% L I s c = Δ T C T - I S C
% L P m a x = Δ T C T-Pmax
Likewise, the PVM on-site values of open circuit voltage (VOC-site), short circuit current (ISC-site), and maximum power (Pmax-site) were quantified, taking into account the values reported in the PVM data sheet for open circuit voltage (VOC), short circuit current (ISC), and maximum power (Pmax) using Equations (6)–(8) [41,42].
V OC-site = % L V o c + 100 % 100 % V O C
I SC-site = % L I s c + 100 % 100 % I S C
P max-site = % L P m a x + 100 % 100 % P m a x
These values determine the actual module efficiency due to temperature increase with Equation (9) [41,42,43].
η PVM-site = P max-site P m a x

3. Results and Discussions

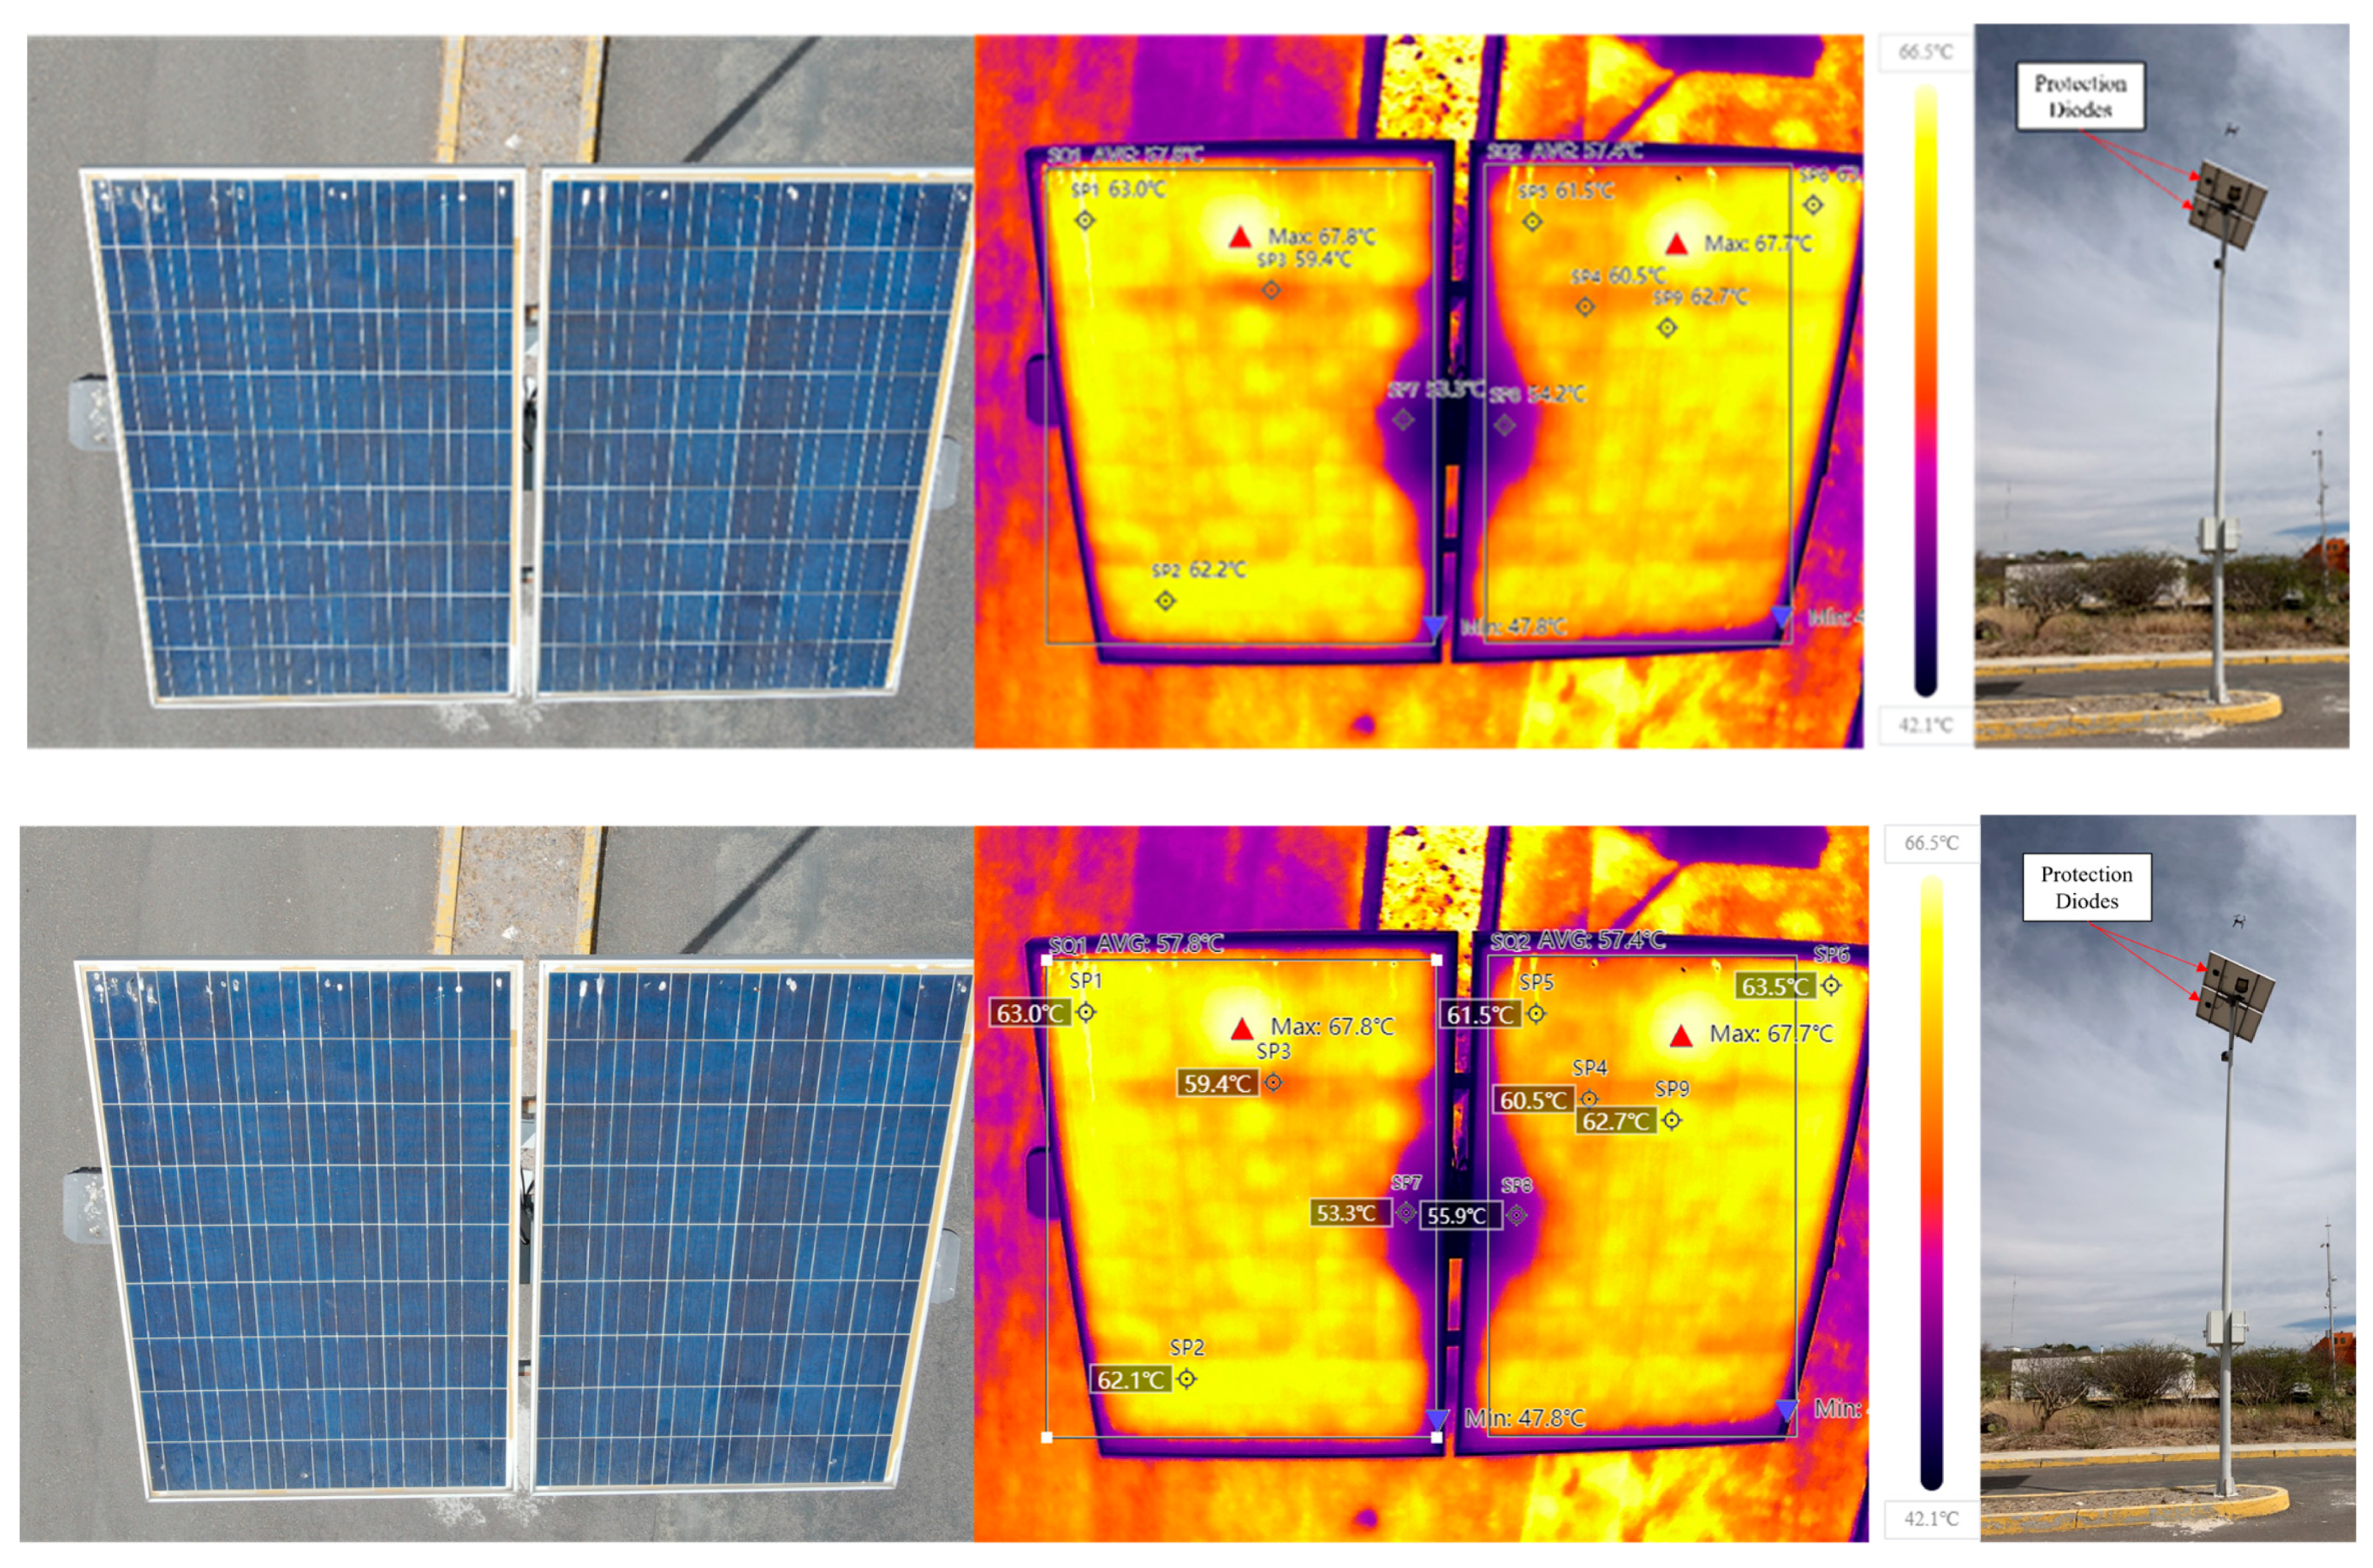
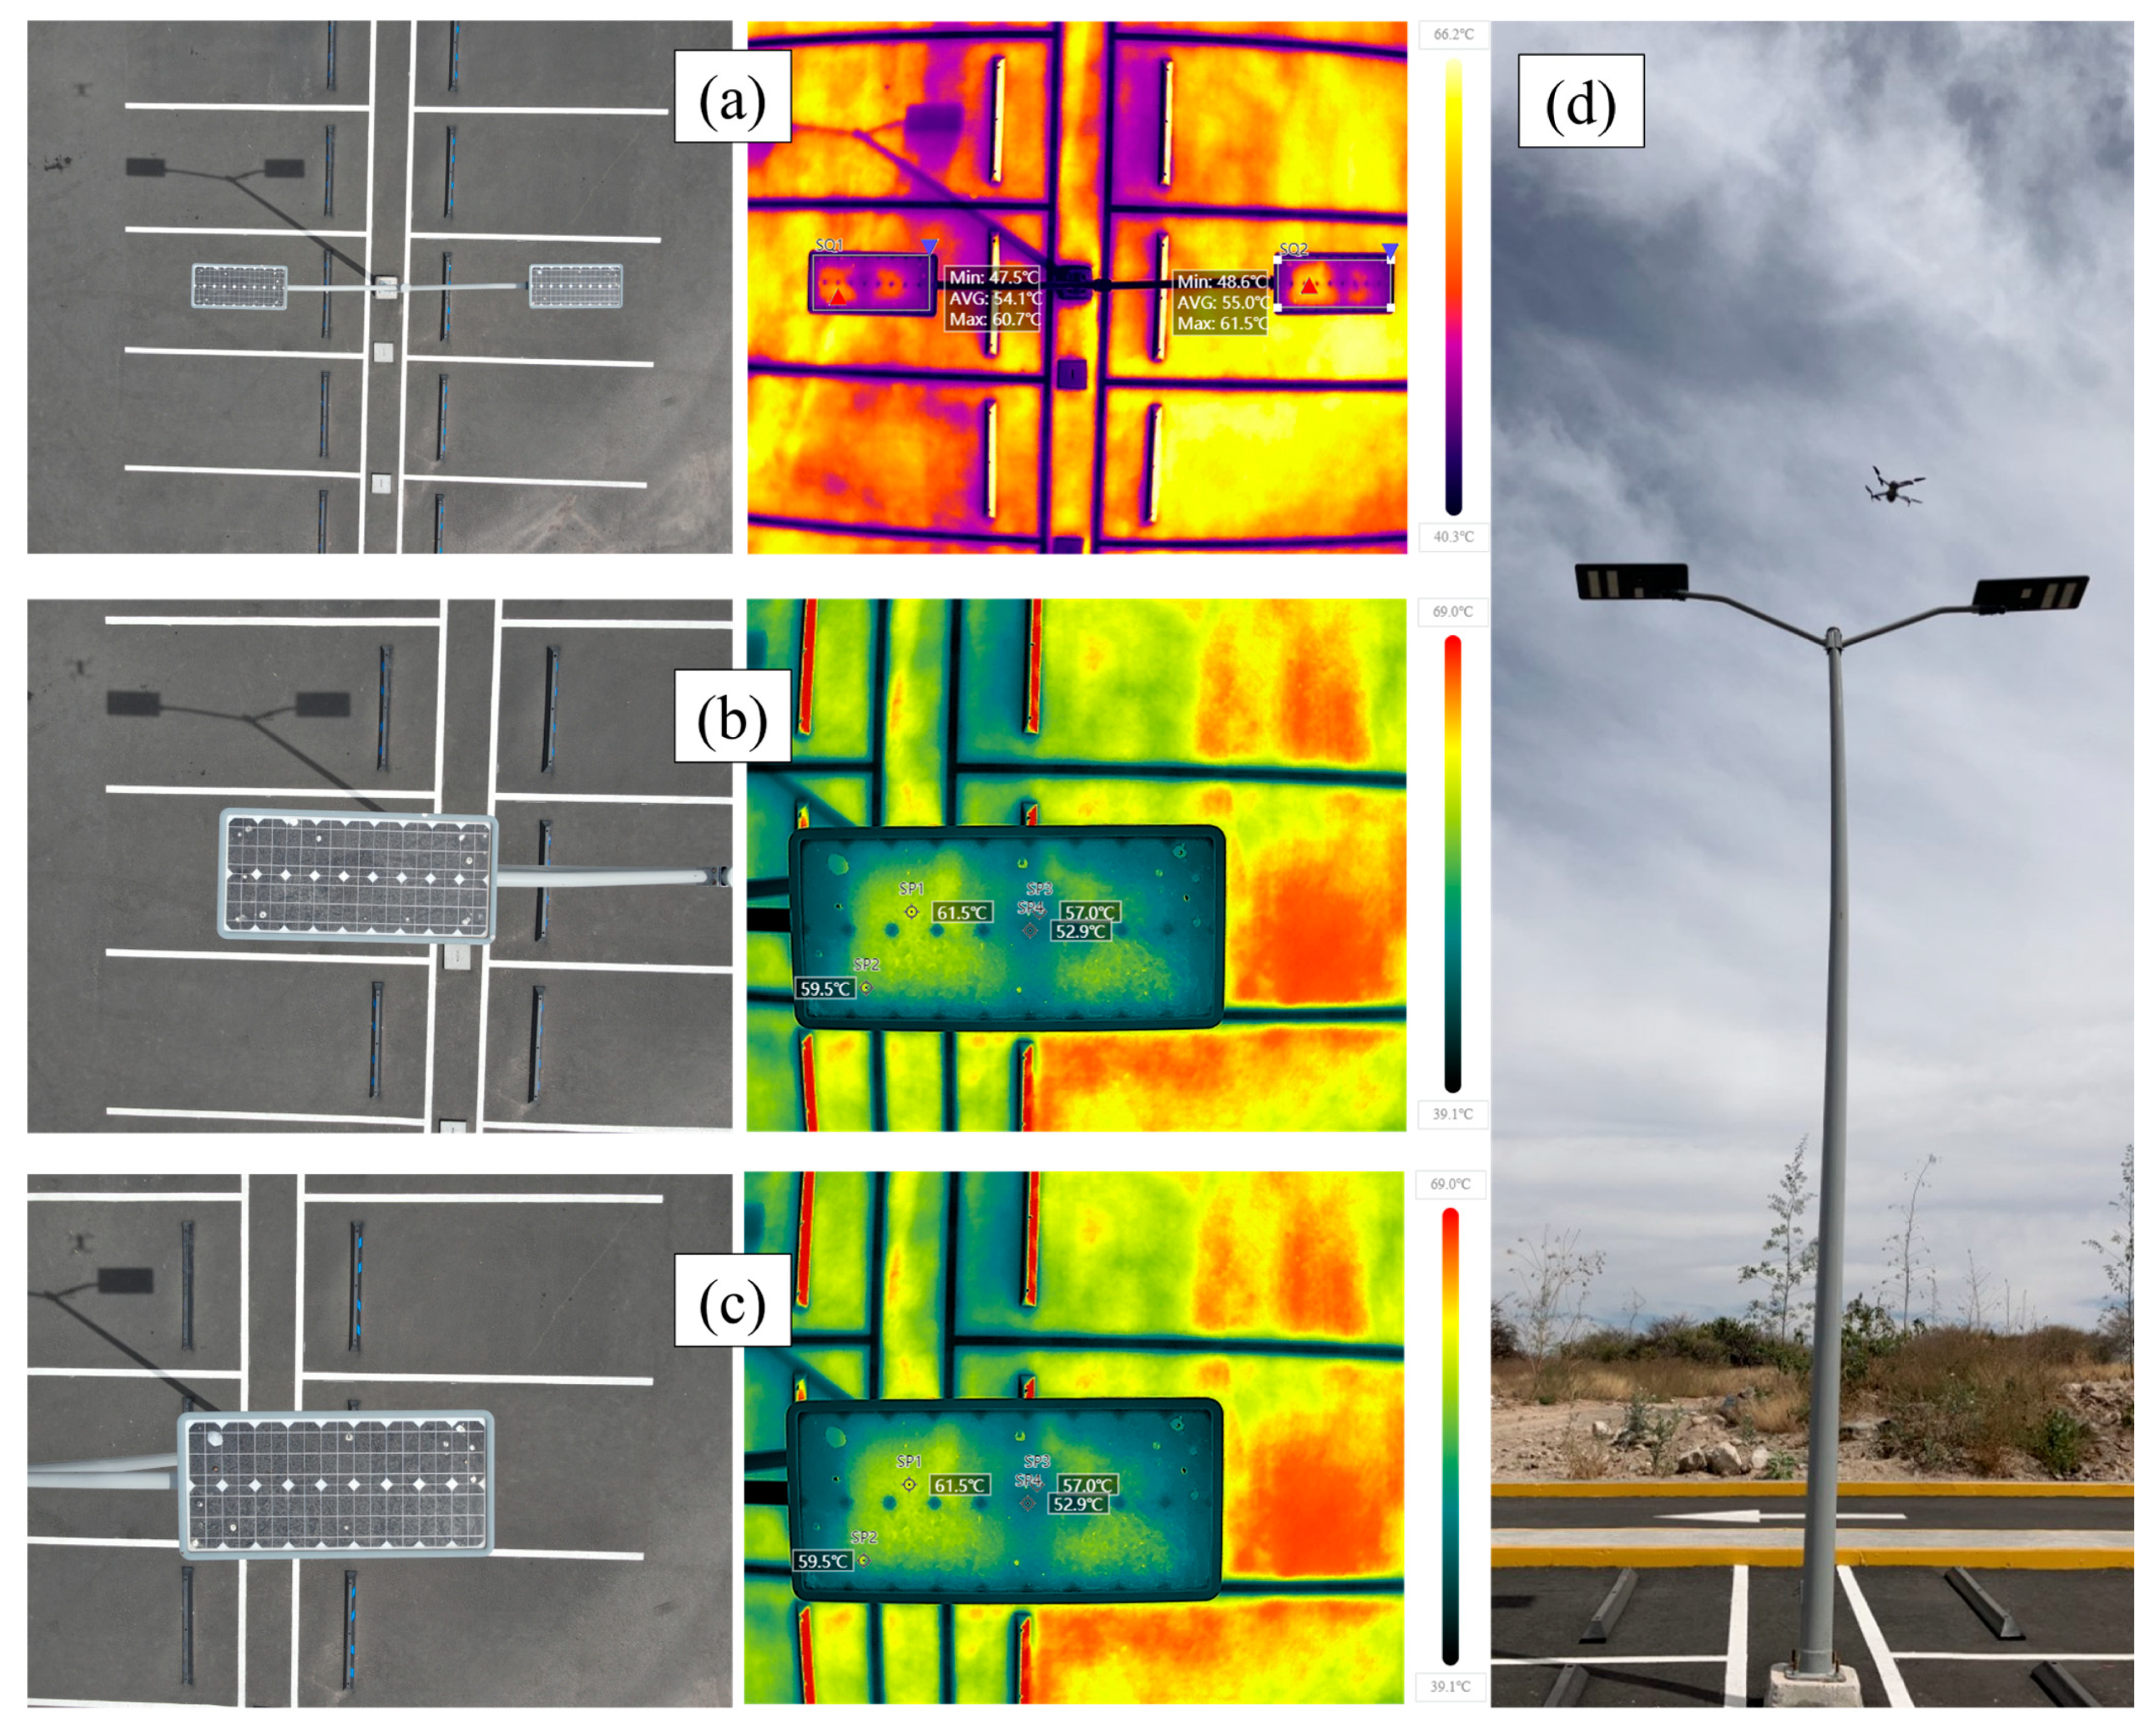
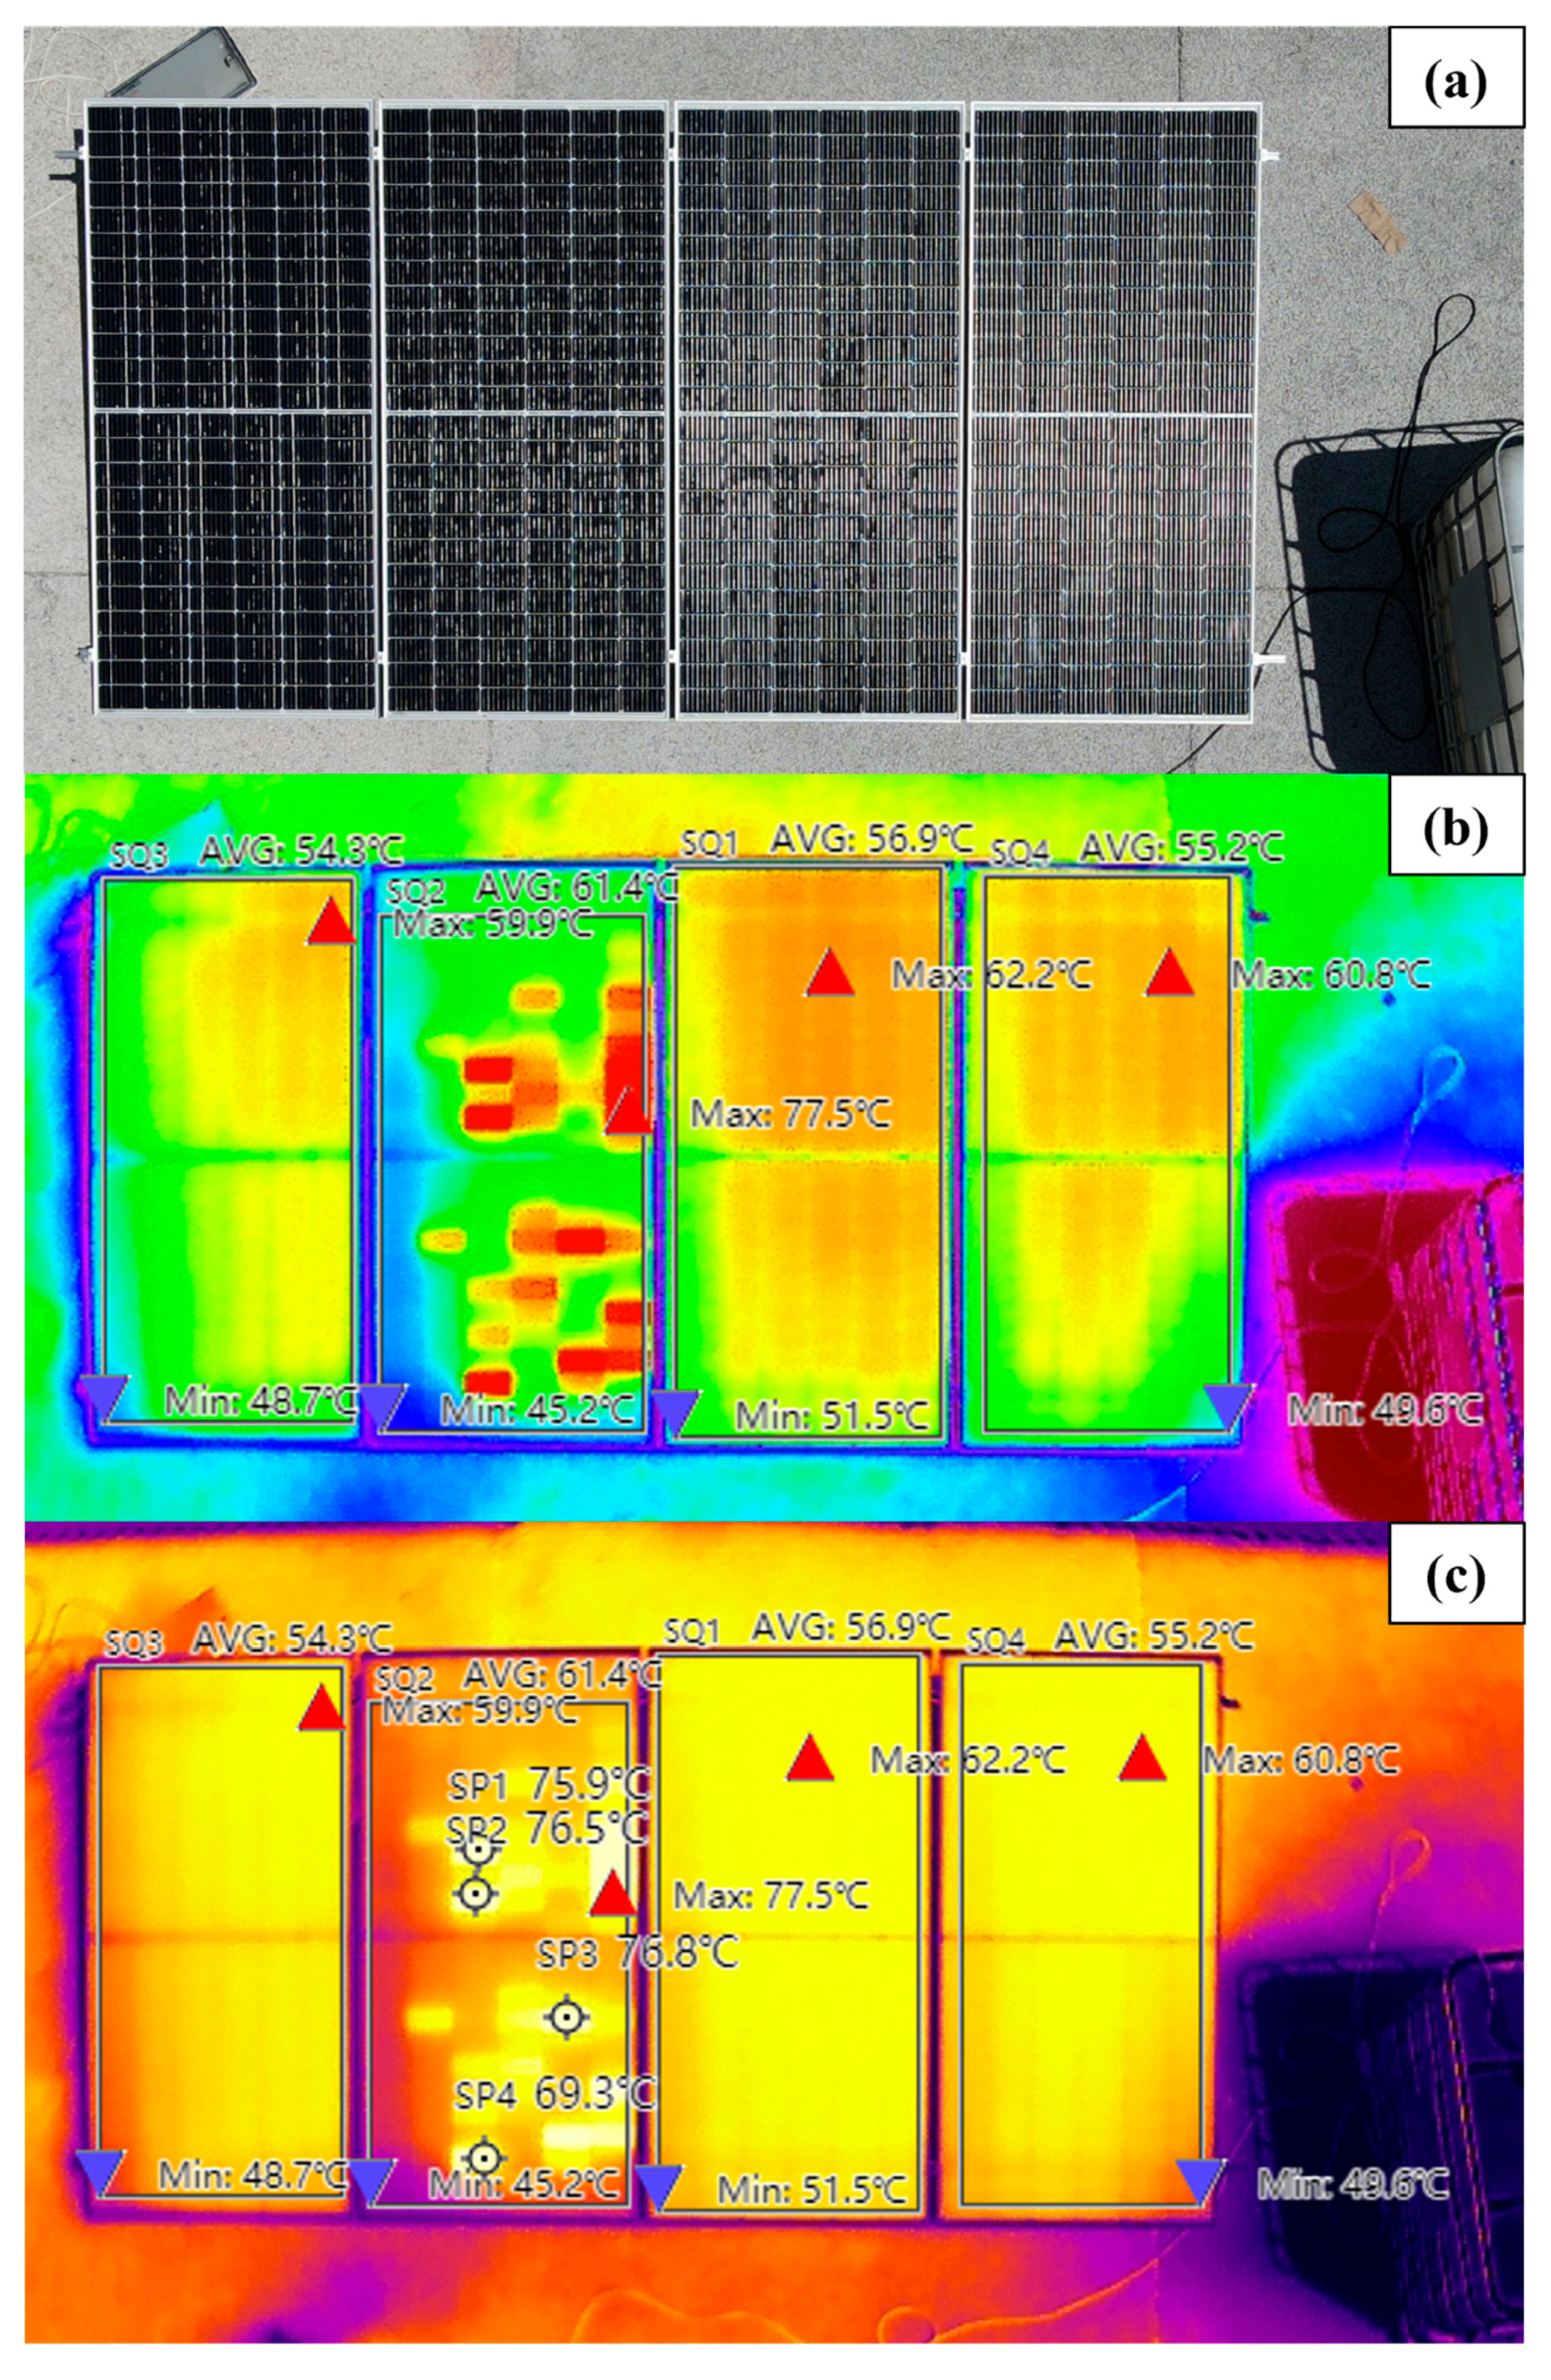
3.1. Thermal Analysis

An analysis of the PVMs is presented in Figure 3.
Figure 3 shows thermal images of a grid-isolated array placed at ground level and analyzed with thermal camera imaging; Figure 3a indicates that no obstacle could directly shadow the PVMs; Figure 3b allows us to identify the zones of higher temperature in each MVP, as well as the average temperature of each MVP and the hotspots formed in 32 cells of the MVP3. The thermal image in Figure 3c determines the temperature values of the most prominent hotspots. The value of TmaxPVM is estimated by Equation (1), and the parameters of Irr-site, Irr-NOCT, TNOCT, Tenv-NOCT, and Tenv-site are recorded in Table 1.
The value of TmaxPVM is a theoretical value that approaches the real operating temperature of the PVMs, and this is considered to be in the tolerance value of TNOCT with an operating temperature range of (52.52 °C ≤ TmaxPVM ≤ 56.62 °C). The average temperature values identified with the thermal image agree with the interval of TmaxPVM, except for PVM3, which presents a higher average temperature than the other PVMs due to the formation of hotspots.
In thermal image Figure 3c, it can be observed that the hotspots in PVM3 present temperature values higher than 75 °C. Because no obstruction is visually distinguishable from the UAV, generating an obstacle to causing these hotspots, this high fire-risk heating is attributed to the dust deposit on the outer cover. Similarly, PVM3 may have cells that are not homogeneous and impurities in the crystalline structures of the layers that integrate the cell, as well as non-homogeneous welding.
The percentages of the energy losses of (%LVoc), (%LIsc), and (%LPmax) are presented in Table 2. These data were determined from the temperature values obtained in the thermal image and PVM datasheet values of T cell-STC = 25 °C, C T - V O C = 0.28   % ° C , C T - I S C = 0.05   % ° C , and C T-Pmax = 0.36   % ° C .
The efficiency of each PVM was estimated based on the percentages of energy losses, I S C = 11.46   A , V O C = 50.8   V , P m a x = 465   W , and the values of V OC-site , I SC-site , and P max-site (Table 3). The efficiency value of each PVM was lower than the efficiency in STC due to the temperature reached by each one; however, the values obtained in PVM3 should be compared with the readings of V OC-site and I SC-site , as they will present discrepancies due to the formation of risky hotspots.
The recorded values of V O C and I S C of each PVM in the system are shown in the graphs in Figure 4 and compared with the values in the datasheet.
If a hotspot occurs in one or more of the solar cells in a PVM, it becomes a system that consumes more energy because the electrical resistance of its solar cells increases, which causes a more significant increase in temperature and a decrease in maximum power [35,44].
Figure 4 shows that PVM1, PVM2, and PVM4 generated more electric current and decreased their voltage values due to the increase in temperature. However, PVM3 shows lower values in electric current and voltage; this is attributed to the cell temperature being so high that it turns the cells into electrical loads that consume energy. This effect of hotspots in the cells does not allow adequate circulation of energy in all of the cells of each PVM because there are areas of PVM3 that have a lower temperature, as shown in Figure 3. Not performing a periodic thermal analysis implies that the PVMs have a high temperature due to daily solar irradiance, favoring the risk conditions of creating a fire.
Likewise, there is a risk of fire generation due to not following a proper methodology for sizing an off-grid, grid-connected, or hybrid PV system; this includes the correct installation of the PVM to avoid damage due to temperature increases and the electrical conditions necessary for optimal operation as well as the sizing and proper use of protection devices that take into account the variations of electricity that will occur on-site due to temperature variations and exposure of waste on the PVM. Therefore, a novel electrical safety methodology is proposed to design a photovoltaic system to reduce the risk of fire generation due to the formation of hotspots.

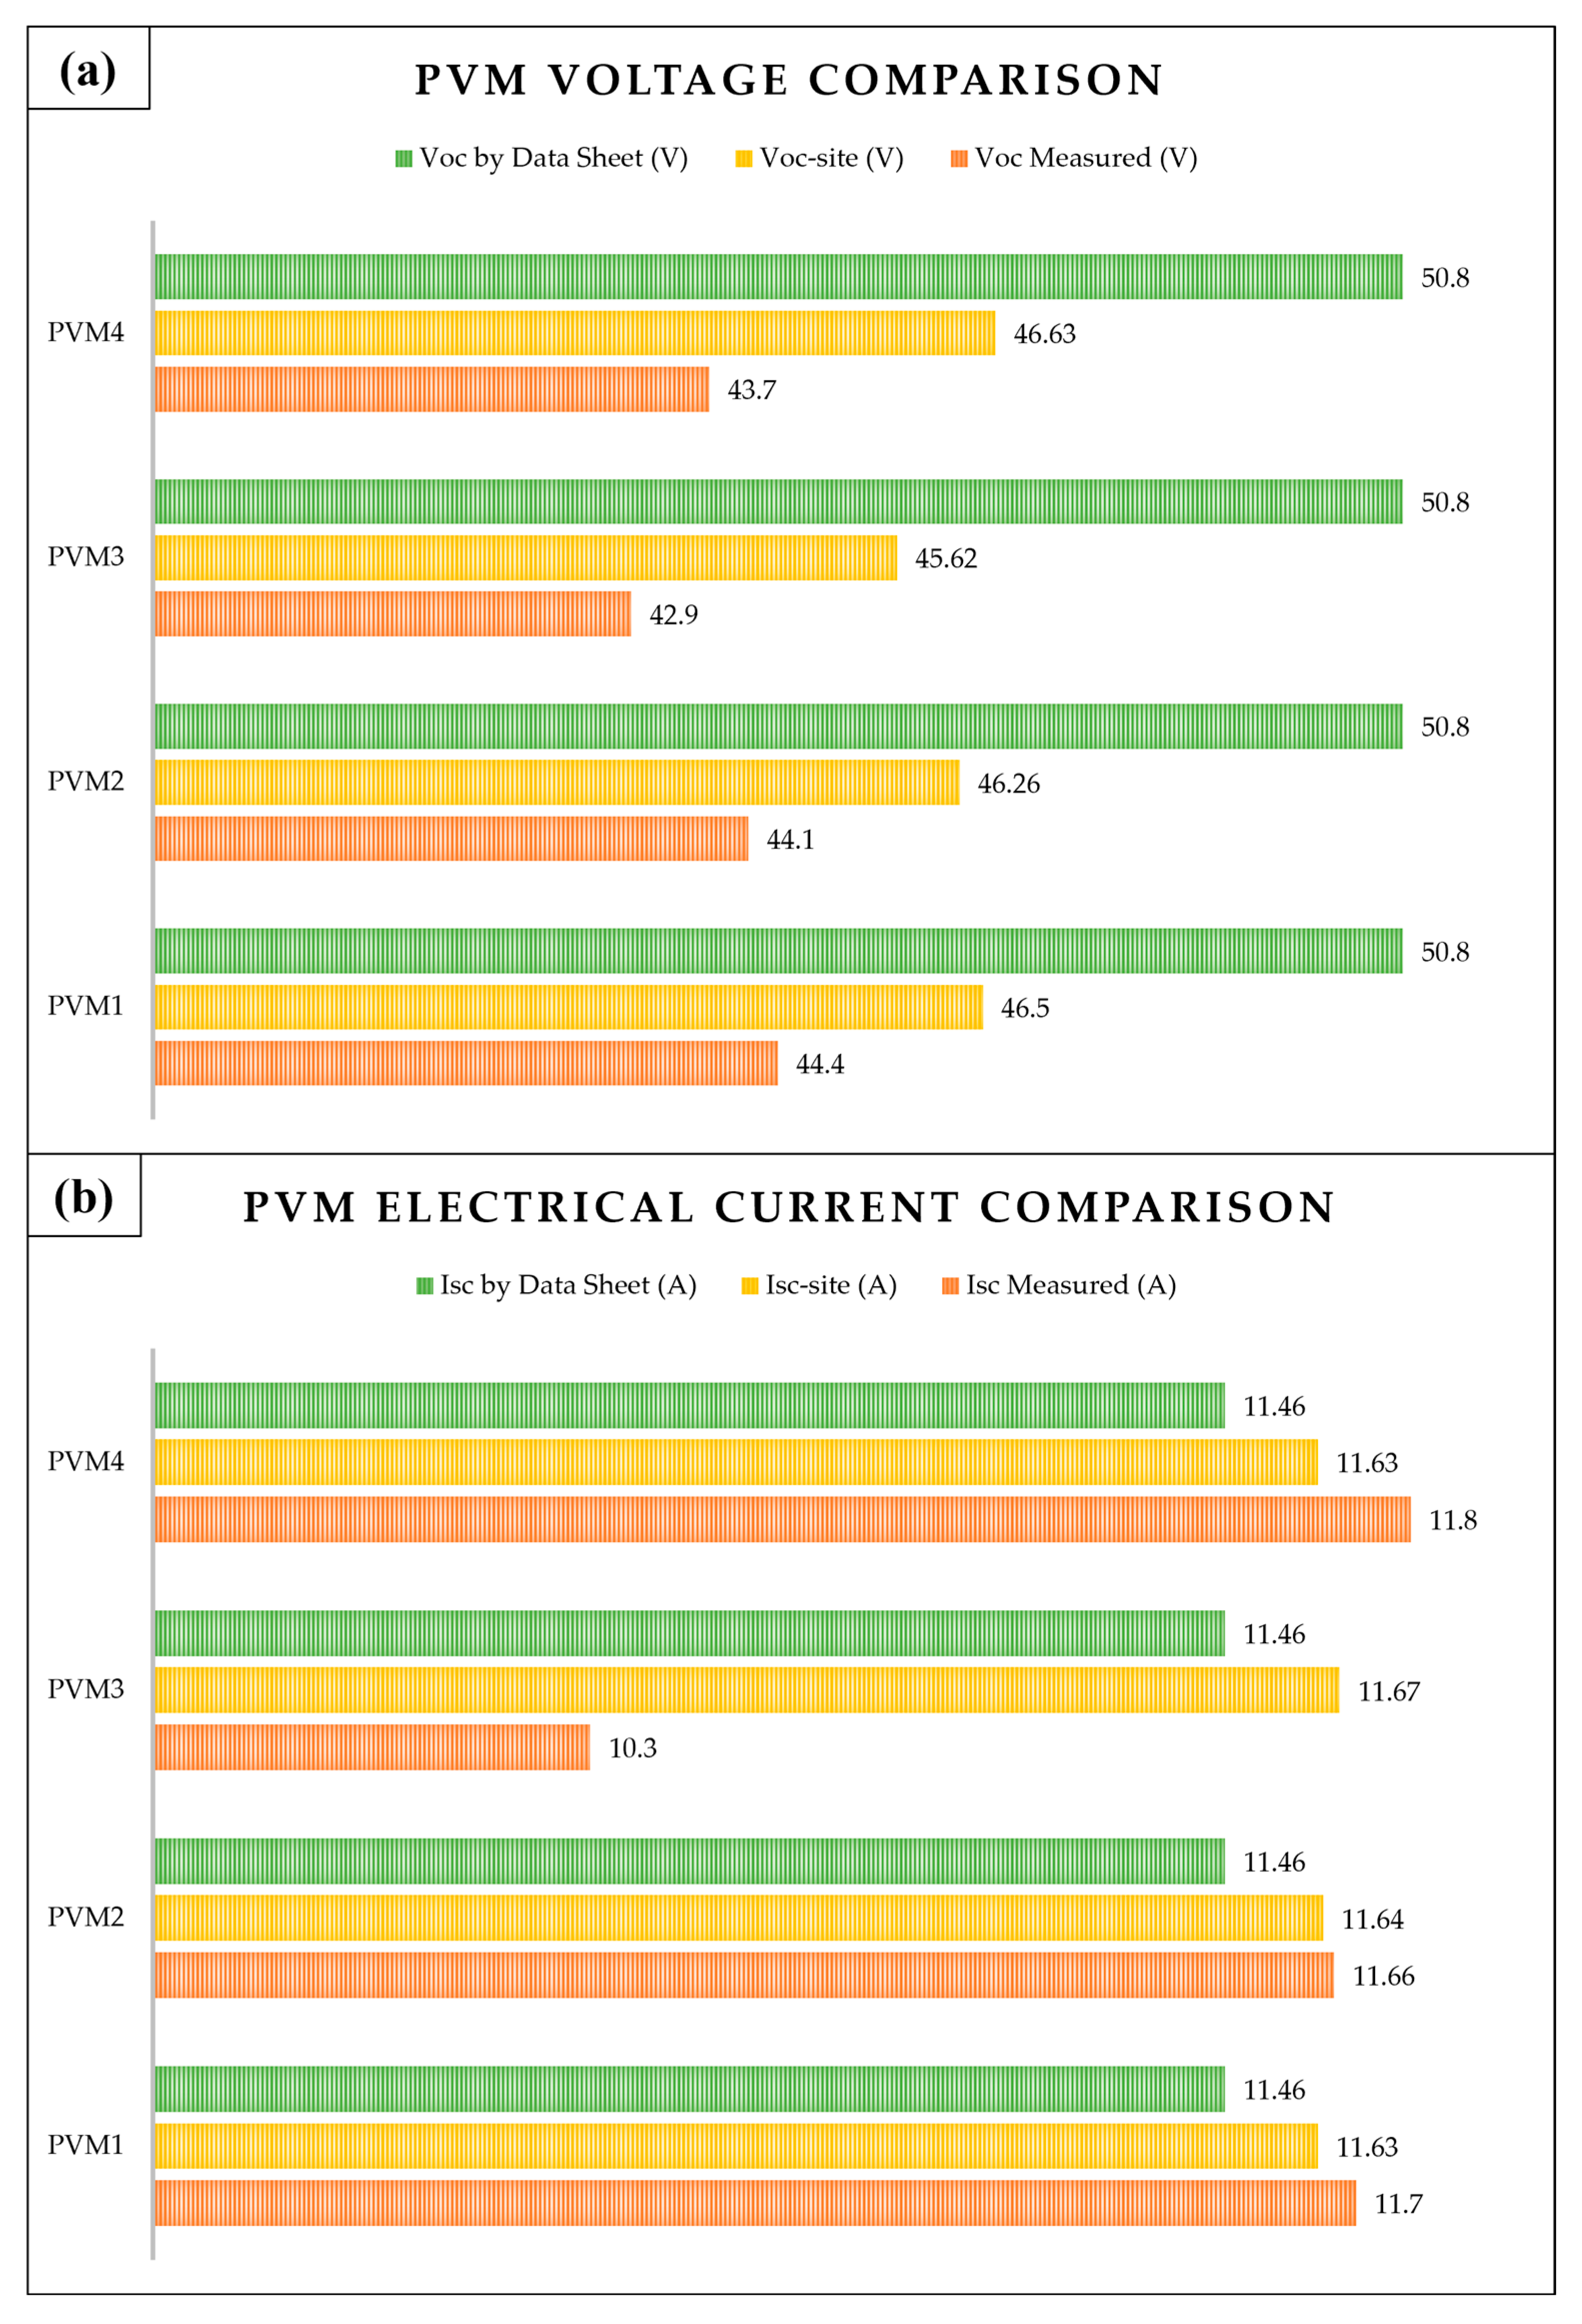
3.2. Electrical Safety Methodology Proposal for the Design of a Photovoltaic System to Prevent Hotspot Fires

In order to avoid short circuits that cause fires in the electrical installations of PV energy systems, an adequate calculation must be performed based on standards of the territorial region where it is implemented. The leading agencies are shown in the diagram in Figure 5.
As the initial step, the solar hours (HS) of maximum solar radiation utilization at the site must be determined based on the collection of meteorological data or solarimetry studies over approximately one year because these studies perform a global characterization of direct radiation capture, diffuse radiation, and indirect or reflected radiation from the ground [45,46]. It is recommended to estimate the design of a photovoltaic energy system with the value of the minimum hours registered in the most unfavorable month of radiation to take better advantage of it.
Likewise, the optimum angle of inclination of the PVMs must be determined to obtain direct radiation because not having them oriented correctly would result in energy losses equivalent to more than one solar hour. In case the optimal angle is not known via solarimetry, it has been demonstrated in empirical results that the PVMs should be installed at an inclined position concerning the latitude of the site. When PVMs are improperly positioned, the photovoltaic cells are prone to overheating, which can generate a hotspot; this occurs more frequently in PVMs installed on roofs without an inclination angle.
The hotspot is also generated by poor maintenance in the PVM because debris accumulates on them, such as dust, leaves, and dirt from birds and insects, among others; this causes an increase in temperature in the photovoltaic cells, leading to the formation of fires, as shown in Figure 6.
One of the factors for the formation of fires in photovoltaic systems occurs because PVMs are used without certifications or production standards due to the low price of PVMs. Therefore, in different regions, the following certifications are required for PVMs by the companies that provide electricity supply services to interconnect to the electricity supply and transmission grid in distributed generation. The principal certifying organizations are shown in the diagram in Figure 7.
Knowing the value of the HS, location, and inclination of the PVM, the energy loads required, and the estimated daily consumption (Cd) must be obtained; this can be known from what is reported in an electricity consumption bill by the supply company in the region. Otherwise, a census of electrical charges consumed by each device can be made considering the time of consumption.
If working with devices with inductive loads, the apparent power of each load must be added and multiplied by a factor of 7/3 because the peak power at the beginning of its operation must be considered to break the inertia of the resting state.
The photovoltaic power (PF) required to supply Cd is calculated with Equation (10), where (σ) is the correction factor equal to 1.3.
P F = C d · σ H S
It is essential to obtain the value of PF because it is compared with the contracted power or electrical load (ELC) with the utility company. Therefore, PFELC because the distribution lines and transformers can be overloaded with energy, which would represent a risk of short circuit and fire generation. However, it is possible to have the alternative of replacing the electrical transformer to which the photovoltaic energy will be supplied with a higher capacity transformer, as well as a modification in contracting the electricity consumption tariff with the supply company. Likewise, in some regions, photovoltaic installations are installed up to the maximum capacity of the transformer, and in the same way, a variation in the electricity consumption must be made with the utility company.
The PF estimation determines the number of PVMs (Z) to be used with Equation (11), considering the electrical power (PPVM) of the PVM to be installed. It is recommended to use PVM strings in series of the same electrical characteristics, cell type, and preferably of the same brand because electrical alterations may occur in the PVMs, diodes, and MC4 contacts that generate short circuits.
z = P F P P V M
Knowing the values of Z, PF, and Cd, the electrical inverter or the set of inverters interconnected to the grid must be selected to obtain a conversion to Direct Current to Alternating Current (DC:AC conversion system; it must be considered that the nominal electrical power of the inverter (PINV) must be 28% greater than Cd to avoid electrical short circuits and mitigate the risk of fire.
When carrying out photovoltaic installations where an electrical transformer will be changed, the DC:AC ratio (RCD:CA) must be calculated (Equation (12)), where cos φ is the power factor of the inverter, ηINV is the efficiency of the inverter, and LMISC represents the miscellaneous losses attributed to dust, wiring, and age with a value of 0.056. The value of RCD:CA must be (1.01 ≤ RCD:CA ≤ 1.3) to avoid electrical decompensations.
R C D : C A = P P V M   1 L M I S C   η I N V P I N V   cos φ
Based on the electrical current and voltage output values of the inverters, the electrical conductor is determined based on its ampacity, conductor material, gauge, and coating, without exceeding the rated operating temperature values. The most used conductors in photovoltaic energy systems are listed in Table 4.
The ampacity calculation of the conductors in a PV system is determined from the maximum current of the circuit (IMAX) and the design current (ID) (Equations (4) and (5)). Considering the short circuit current (ISC) of the PVM or arrangement of PVM chains, the factor of 1.25 was established because the system will have a continuous operating load, and the irradiation will be higher because it was previously calculated for the HS of the least unfavorable month.
I M A X = ( I S C ) 1.25
I D = I M A X 1.25
From the value of I D , the conductor gauge that supports a value immediately above I D is selected.
Continuously, the corrected electric current intensity value I C (Equation (15)), must be determined. It considers the electric current value of the selected conductor gauge I A C , grouping factor k A that is associated with the quantity value of current-carrying conductors installed inside a conduit, temperature correction factor k T for regions where the ambient temperature is different from 30 °C, and the factor for exposure to sunlight of conduits k s . The k T value depends directly on the material used for canalization and the separation distance from the ground as the operating temperature of the conductor increases.
I C = I A C k A k T k s
In the circulation of electric currents through the conductors connected from the PVM to the inverter, there is a drop in voltage due to the length and gauge of the conductor. Therefore, the percentage of voltage drop % V D R O P must be estimated, and it must have a value of 3% to mitigate energy losses in a standard of 1000 m, considering the electrical resistance over 1 km. In this way, the minimum length L m between the PVM and the inverter must be quantified (Equation (16)).
L m = 1000 m % V D R O P V M P I M P R 2
Afterward, the electrical protections must be selected according to the immediate superior value of I C . It is important to place, as first protection to the photovoltaic system, a grounding system that consists of anchoring a conductor of a larger gauge than the I A C from the PVMs’ structures to a grounding electrode; therefore, when a short circuit or lightning discharge occurs in the PVMs, the energy will be distributed throughout the structure of the PVMs towards a conductor with a gauge of lower electrical resistance than the one used to interconnect the inverter. Similarly, a direct current (DC) surge protection device (SPD) should be placed and interconnected from the PVMs’ lines in a parallel arrangement to the grounding electrode (Figure 8a). The SPD limits transient atmospheric overvoltage and redirects them to the grounding electrode to avoid electrical current variations, and a thermomagnetic switch (TS) should be connected in series to the PVMs (Figure 8b). Finally, a selector switch (SS) for DC should be placed to disconnect the PVMs from the inverter to take care of electrical overloads and system maintenance (Figure 8c).
DC electrical protection devices should not be confused with alternating current (AC) devices because they have a different internal configuration due to the magnitude of the voltage, current, and frequency with which they operate. Figure 9 shows an internal comparison of two DC and AC TSs. The figure highlights that the arc fault, fire extinguishing chamber, and magnetic trip coil are more significant in a DC device because they handle higher current and voltage parameters than an AC device. Installing an AC TS instead of a DC one is conducive to the rapid deterioration of the protection device, in addition to the fact that it would melt due to the electrical power operated with DC, leading to the formation of fires.
The SPD, TS, and PV disconnect selector switches are installed in combiner boxes built for extreme weather conditions and mounted in easily accessible locations in case of an electrical contingency (Figure 10).
Failure to install these electrical protections is conducive to generating fires because an increase in temperature in the PVMs generates electrical current peaks that will be transmitted directly to the solar charge controllers. Upon receiving the different variations of current peaks, these devices melt internal components, including their protective plastic casings, as shown in Figure 11. These types of high-fire hazard events occur primarily in off-grid systems.
Similarly, in off-grid PV systems, a thermomagnetic switch should be placed between the solar charge controller, the batteries, and the inverter, as there have been cases of current and voltage spikes leaking and damaging the internal surface-mounted electronic components of the inverters, as shown in Figure 12.
To determine the effectiveness of a photovoltaic system, an expected performance power protocol P E is carried out using Equation (20). It begins by determining power standard test conditions (PSTC) (Equation (17)) and the irradiance factor δ I (Equation (18)), comparing the incident radiation per squared length units Γ I at the site, and the same plane of inclination as the PVM. In the same way, the temperature factor of the PVM ( δ T - P V M ) (Equation (19)) is determined, where T C - P V M is the temperature coefficient of the maximum power of the PVM, T P V M is the PVM temperature, T E is the ambient temperature, and δ S is the power reduction factor of the photovoltaic system due to the efficiencies of the equipment that compose it, which is equivalent to ~0.9.
P S T C = P P V M z
δ I = Γ I   1000   W / m 2
δ T - P V M = 1 + T C - P V M T P V M T E 100
P E = P S T C + δ I + δ T - P V M + δ S
The PVMs should have a length L S H A D E of separation between them in the structure (Figure 13) to avoid the shading effect between modules. This is determined from the optimum angle of inclination α, shading angle β, and PVM length L M F V , as shown in Equation (21). It is recommended to have a separation between the ground and the bottom of the module, called L V , where (LV ≥ 8 inches) the PVMs can be cooled with wind currents.
L S H A D E = sin α + β sin β L M F V

4. Conclusions

Fire risks are present in renewable energy devices and systems exposed to the outdoors, particularly in energy systems with photovoltaic modules that could present the inconvenience of not having correct placement and orientation due to the lack of a solarimetric study. This generates the conditions to have a high temperature increases in its components (hotspots), which favors the risk of fire in electrical systems interconnected to low-, medium-, and high-voltage electrical grids as well as in off-grid and hybrid systems. In photovoltaic systems without self-positioning systems, solar tracking, or fixed photovoltaic modules, it is recommended to perform preventive and predictive maintenance with temperature recording through thermal cameras to provide a better overview of the technical and contingency actions; however, knowing that not all photovoltaic systems will comply with this type of recommendation, it is necessary to have an adequate electrical installation that uses electrical parameter monitoring systems.
This work presents a novel methodology based on the relationship between temperature increases and the variations in the magnitude of the measured VOC and ISC of the PMVs. The temperature values were visualized through the thermal images obtained with UAVs, allowing hotspot identification. On the other hand, having a reading of the ISC value higher than the value reported in the technical datasheet of each PMV will cause overheating and the formation or presence of hotspots that could become a possible cause of fires. This is because as the irradiance of the sun at the site increases, the PMV temperature increases, the VOC value decreases concerning the value reported in the datasheet, and the ISC increases, causing the Pmax and ηPVM to decrease; consequently, the lifetime of the PMV will be reduced.
Based on these results, it is crucial to place electrical protection devices and size the control and conversion equipment appropriately, as described in the proposed methodology for electrical safety to prevent fires. Likewise, the proposed methodology is oriented to adapt the photovoltaic systems already installed, considering the power and capacity of the photovoltaic modules and inverters. It is important to highlight that the proposed electrical security methodology is based on the acquisition of photovoltaic equipment that is certified by regional and international standard testing organizations, as well as on the proper selection of conductors and conduits for its operation according to the energy needs of the system and, mainly, the weather conditions of the site. Finally, this work reveals that research on fire safety and renewable energies is an important and evolving topic, and this interest is expected to continue and increase to ensure the safe and efficient use of renewable energies worldwide.

Author Contributions

Conceptualization, J.M.J.-L., J.A.F., Q.H.-E., D.M.-R. and A.-J.P.-M.; methodology, J.M.J.-L., J.A.F., Q.H.-E., D.M.-R. and A.-J.P.-M.; investigation, J.M.J.-L., J.A.F., Q.H.-E., D.M.-R. and A.-J.P.-M.; writing—original draft preparation, J.M.J.-L., J.A.F., Q.H.-E., D.M.-R. and A.-J.P.-M. All authors have read and agreed to the published version of the manuscript.

Funding

This research received no external funding.

Institutional Review Board Statement

Not applicable.

Informed Consent Statement

Not applicable.

Data Availability Statement

Not applicable.

Acknowledgments

The authors would like to thank Universidad Nacional Autónoma de Mexico through PAPIIT 2023 project IA103323 “Determinación de fallas en álabes de aerogeneradores a través de procesamiento digital de imágenes y aprendizaje automático no supervisado”, PAPIIT TA100323 “Diseño e implementación de un banco de pruebas experimental para el estudio de sistemas de control de flujo activo en aerogeneradores a escala; una perspectiva hacía el desarrollo de aspas inteligentes”, PE100822 “Desarrollo e Implementación de una plataforma didáctica para la enseñanza práctica de la energía eólica en la ENES Juriquilla mediante el análisis y caracterización de turbinas eólicas”, and PAPIME PE100722 “Fortalecimiento a la enseñanza del cálculo diferencial, integral y vectorial utilizando cuadernos con problemas aplicados a las energías renovables”. The authors thank Engineer Daniel Alejandro Moya Galván for his technical support in the operation of the UAV. We are grateful for the academic enthusiasm of the students of the Renewable Energy Engineering program at ENES Juriquilla—UNAM. The authors would also like to thank the University of Córdoba (Spain) through PPIT_2022E_026695 “Nuevas Soluciones para la Sostenibilidad Energética y Ambiental en Edificios Públicos”.

Conflicts of Interest

The authors declare no conflict of interest.

References

  1. Renewable Capacity Statistics. 2022. Available online: https://www.irena.org/publications/2022/Apr/Renewable-Capacity-Statistics-2022 (accessed on 5 March 2023).
  2. Laukamp, H.; Bopp, G.; Grab, R.; Wittwer, C.; Häberlin, H.; Heeckeren, B.V.; Phillip, S.; Reil, F.; Schmidt, H.; Sepanski, A.; et al. PV Fire Hazard—Analysis and Assessment of Fire Incidents. In Proceedings of the 28th European Photovoltaic Solar Energy Conference and Exhibition, Paris, France, 30 September–4 October 2013; pp. 4304–4311. [Google Scholar] [CrossRef]
  3. Akram, M.W.; Li, G.; Jin, Y.; Chen, X. Failures of Photovoltaic modules and their Detection: A Review. Appl. Energy 2022, 313, 118822. [Google Scholar] [CrossRef]
  4. Yang, H.-Y.; Zhou, X.-D.; Yang, L.-Z.; Zhang, T.-L. Experimental Studies on the Flammability and Fire Hazards of Photovoltaic Modules. Materials 2015, 8, 4210–4225. [Google Scholar] [CrossRef]
  5. Köntges, M.; Kurtz, S.; Packard, C.; Jahn, U.; Berger, K.A.; Kato, K. Performance and Reliability of Photovoltaic Systems: Subtask 3.2: Review of Failures of Photovoltaic Modules: IEA PVPS Task 13: External Final Report IEA-PVPS; International Energy Agency, Photovoltaic Power Systems Programme: Sankt Ursen, Switzerland, 2014; ISBN 978-3-906042-16-9. [Google Scholar]
  6. Manzini, G.; Gramazio, P.; Guastella, S.; Liciotti, C.; Baffoni, G.L. The Fire Risk in Photovoltaic Installations—Checking the PV Modules Safety in Case of Fire. Energy Procedia 2015, 81, 665–672. [Google Scholar] [CrossRef]
  7. Ju, X.; Zhou, X.; Zhao, K.; Peng, F.; Yang, L. Experimental study on fire behaviors of flexible photovoltaic panels using a cone calorimeter. J. Fire Sci. 2017, 36, 63–77. [Google Scholar] [CrossRef]
  8. Vaverková, M.D.; Winkler, J.; Uldrijan, D.; Ogrodnik, P.; Vespalcová, T.; Aleksiejuk-Gawron, J.; Adamcová, D.; Koda, E. Fire hazard associated with different types of photovoltaic power plants: Effect of vegetation management. Renew. Sustain. Energy Rev. 2022, 162, 112491. [Google Scholar] [CrossRef]
  9. Szultka, S.; Czapp, S.; Tomaszewski, A.; Ullah, H. Evaluation of Fire Hazard in Electrical Installations Due to Unfavorable Ambient Thermal Conditions. Fire 2023, 6, 41. [Google Scholar] [CrossRef]
  10. Aram, M.; Zhang, X.; Reda, I.; Dghim, M.; Qi, D.; Ko, Y. Similarity assessment of using helium to predict smoke movement through buildings with double skin façades during building integrated photovoltaics fires. J. Clean. Prod. 2023, 405, 136996. [Google Scholar] [CrossRef]
  11. Miao, L.; Chow, C.-L. Investigation of burning photovoltaic panels on a double-skin facade with ejecting flame from an adjacent room fire. Indoor Built Environ. 2018, 28, 938–949. [Google Scholar] [CrossRef]
  12. Despinasse, M.-C.; Krueger, S. First developments of a new test to evaluate the fire behavior of photovoltaic modules on roofs. Fire Saf. J. 2015, 71, 49–57. [Google Scholar] [CrossRef]
  13. Mazziotti, L.; Cancelliere, P.; Paduano, G.; Setti, P.; Sassi, S. Fire risk related to the use of PV systems in building facades. MATEC Web Conf. 2016, 46, 5001. [Google Scholar] [CrossRef]
  14. NFPA. Development of Fire Mitigations Solutions for PV Systems. Available online: https://www.nfpa.org/News-and-Research/Data-research-and-tools/Electrical/Development-of-Fire-Mitigations-Solutions-for-PV-Systems-Installed-on-Building-Roofs-Phase-1 (accessed on 25 April 2023).
  15. SFPE Europe Digital Issue 21—Investigation of the Effects of Photovoltaic (PV) System Component Aging on Fire Properties for Residential Rooftop Applications. Available online: https://www.sfpe.org/publications/periodicals/sfpeeuropedigital/sfpeeurope21/europeissue21feature5#_ENREF_11 (accessed on 25 April 2023).
  16. Yang, R.; Zang, Y.; Yang, J.; Wakefield, R.; Nguyen, K.; Shi, L.; Trigunarsyah, B.; Parolini, F.; Bonomo, P.; Frontini, F.; et al. Fire safety requirements for building integrated photovoltaics (BIPV): A cross-country comparison. Renew. Sustain. Energy Rev. 2023, 173, 113112. [Google Scholar] [CrossRef]
  17. Mohd Nizam Ong, N.A.F.; Sadiq, M.A.; Md Said, M.S.; Jomaas, G.; Mohd Tohir, M.Z.; Kristensen, J.S. Fault tree analysis of fires on rooftops with photovoltaic systems. J. Build. Eng. 2022, 46, 103752. [Google Scholar] [CrossRef]
  18. Cancelliere, P.; Manzini, G.; Traina, G.; Cavriani, M.G. PV modules on buildings—Outlines of PV roof samples fire rating assessment. Fire Saf. J. 2020, 120, 103139. [Google Scholar] [CrossRef]
  19. Zhao, G.; Li, M.; Jian, L.; He, Z.; Shuang, J.; Yuping, S.; Zhang, Q.; Zhongxian, L. Analysis of Fire Risk Associated with Photovoltaic Power Generation System. Adv. Civ. Eng. 2018, 2018, 2623741. [Google Scholar] [CrossRef]
  20. Kristensen, J.S.; Jomaas, G. Experimental Study of the Fire Behaviour on Flat Roof Constructions with Multiple Photovoltaic (PV) Panels. Fire Technol. 2018, 54, 1807–1828. [Google Scholar] [CrossRef]
  21. Kristensen, J.S.; Faudzi, F.B.M.; Jomaas, G. Experimental study of flame spread underneath photovoltaic (PV) modules. Fire Saf. J. 2020, 120, 103027. [Google Scholar] [CrossRef]
  22. Aram, M.; Zhang, X.; Qi, D.; Ko, Y. A state-of-the-art review of fire safety of photovoltaic systems in buildings. J. Clean. Prod. 2021, 308, 127239. [Google Scholar] [CrossRef]
  23. Mohd Nizam Ong, N.A.F.; Mohd Tohir, M.Z.; Said, M.S.; Md Said, M.S.; Alias, A.H.; Ramali, M.R. Development of fire safety best practices for rooftops grid-connected photovoltaic (PV) systems installation using systematic review methodology. Sustain. Cities Soc. 2021, 78, 103637. [Google Scholar] [CrossRef]
  24. Ko, Y.; Aram, M.; Zhang, X.; Qi, D. Fire safety of building integrated photovoltaic systems: Critical review for codes and standards. Indoor Built Environ. 2022, 32, 25–43. [Google Scholar] [CrossRef]
  25. Ramali, M.R.; Mohd Nizam Ong, N.A.F.; Md Said, M.S.; Mohamed Yusoff, H.; Baharudin, M.R.; Tharima, A.F.; Akashah, F.W.; Mohd Tohir, M.Z. A Review on Safety Practices for Firefighters During Photovoltaic (PV) Fire. Fire Technol. 2022, 59, 247–270. [Google Scholar] [CrossRef] [PubMed]
  26. Fiorentini, L.; Marmo, L.; Danzi, E.; Puccia, V. Fire risk assessment of photovoltaic plants. a case study moving from two large fires: From accident investigation and forensic engineering to fire risk assessment for reconstruction and permitting purposes. Chem. Eng. Trans. 2016, 48, 427–432. [Google Scholar] [CrossRef]
  27. Wu, Z.; Hu, Y.; Wen, J.X.; Zhou, F.; Ye, X. A Review for Solar Panel Fire Accident Prevention in Large-Scale PV Applications. IEEE Access 2020, 8, 132466–132480. [Google Scholar] [CrossRef]
  28. Dhimish, M.; Holmes, V.; Mather, P.; Sibley, M. Novel hot spot mitigation technique to enhance photovoltaic solar panels output power performance. Sol. Energy Mater. Sol. Cells 2018, 179, 72–79. [Google Scholar] [CrossRef]
  29. Dhimish, M.; Badran, G. Current limiter circuit to avoid photovoltaic mismatch conditions including hot-spots and shading. Renew. Energy 2019, 145, 2201–2216. [Google Scholar] [CrossRef]
  30. Guerriero, P.; Tricoli, P.; Daliento, S. A bypass circuit for avoiding the hot spot in PV modules. Sol. Energy 2019, 181, 430–438. [Google Scholar] [CrossRef]
  31. Pillai, D.S.; Rajasekar, N. A comprehensive review on protection challenges and fault diagnosis in PV systems. Renew. Sustain. Energy Rev. 2018, 91, 18–40. [Google Scholar] [CrossRef]
  32. Singh, S.K.; Chander, N. Mid-life degradation evaluation of polycrystalline Si solar photovoltaic modules in a 100 kWp grid-tied system in east-central India. Renew. Energy 2022, 199, 351–367. [Google Scholar] [CrossRef]
  33. Bansal, N.; Pany, P.; Singh, G. Visual degradation and performance evaluation of utility scale solar photovoltaic power plant in hot and dry climate in western India. Case Stud. Therm. Eng. 2021, 26, 101010. [Google Scholar] [CrossRef]
  34. Carta González, J.A.; Calero Pérez, R.; Colmenar Santos, A.; Castro Gil, M.A.; Collado Fernández, E. Centrales de Energías Renovables: Generación Eléctrica con Energías Renovables; Pearson Educación: Madrid, Spain, 2013; ISBN 978-84-8322-997-2. [Google Scholar]
  35. Čabo, F.G.; Marinić-Kragić, I.; Garma, T.; Nižetić, S. Development of thermo-electrical model of photovoltaic panel under hot-spot conditions with experimental validation. Energy 2021, 230, 120785. [Google Scholar] [CrossRef]
  36. Aghaei, M.; Fairbrother, A.; Gok, A.; Ahmad, S.; Kazim, S.; Lobato, K.; Oreski, G.; Reinders, A.; Schmitz, J.; Theelen, M.; et al. Review of degradation and failure phenomena in photovoltaic modules. Renew. Sustain. Energy Rev. 2022, 159, 112160. [Google Scholar] [CrossRef]
  37. Ammari, C.; Belatrache, D.; Touhami, B.; Makhloufi, S. Sizing, optimization, control and energy management of hybrid renewable energy system—A review. Energy Built Environ. 2021, 3, 399–411. [Google Scholar] [CrossRef]
  38. Lu, S.; Dai, R.; Zhang, G.; Wang, Q. Investigation of Street Lamp with Automatic Solar Tracking System. J. Sol. Energy Eng. 2018, 140, 061002. [Google Scholar] [CrossRef]
  39. Sutopo, W.; Mardikaningsih, I.S.; Zakaria, R.; Ali, A. A Model to Improve the Implementation Standards of Street Lighting Based on Solar Energy: A Case Study. Energies 2020, 13, 630. [Google Scholar] [CrossRef]
  40. Zajac, P.; Przybylek, G. Lighting lamps in recreational areas—Damage and prevention, testing and modelling. Eng. Fail. Anal. 2020, 115, 104693. [Google Scholar] [CrossRef]
  41. Tobajas Vásquez, C. Instalaciones Solares Fotovoltaicas, 2nd ed.; Ediciones de la U: Bogota, Colombia, 2015; ISBN 978-958-762-267-6. [Google Scholar]
  42. Casa Vilaseca, M.; Barrio López, M. Instalaciones Solares Fotovoltaicas, 1st ed.; Alfaomega Marcombo: Barcelona, Spain, 2017; ISBN 978-607-622-055-9. [Google Scholar]
  43. Pérez-Higueras, P.; Ferrer-Rodríguez, J.P.; Almonacid, F.; Fernández, E.F. Efficiency and acceptance angle of High Concentrator Photovoltaic modules: Current status and indoor measurements. Renew. Sustain. Energy Rev. 2018, 94, 143–153. [Google Scholar] [CrossRef]
  44. Farret, F.A.; Simões, M.G. Integration of Alternative Sources of Energy; Power, Energy and Industry Applications; Wiley-IEEE Press: Hoboken, NJ, USA, 2006; ISBN 978-0-471-71232-9. [Google Scholar]
  45. Tejeda Martínez, A.; Gómez Azpeitia, G. Prontuario Solar de México; Universidad de Colima: Colima, Mexico, 2015; ISBN 978-607-8356-45-4. [Google Scholar]
  46. Twidell, J.; Weir, T. Renewable Energy Resources, 3rd ed.; Routledge: London, UK, 2015; ISBN 978-0-415-58438-8. [Google Scholar]
Figure 1. Thermal analysis of a PVM for lighting in ENES J-UNAM parking lots.
Fire 06 00196 g001
Figure 2. Thermal readings of lighting systems in ENES J-UNAM parking lots with PVM with monocrystalline cells. (a) Temperature averages and highest temperature point of each luminaire energized with PVM. (b) Location of hotspots in the left luminaire by visual and thermal inspection. (c) Location of hotspots in the left luminaire by visual and thermal inspection. (d) Unmanned aerial vehicle (UAV) overflight of luminaires with PVMs.
Fire 06 00196 g002
Figure 3. Thermal images of the PVM array of the solar pumping system at ENES J-UNAM. (a) Surface image of the PVMs. (b) Thermal image of PVM hotspot identification and reading of average temperature values of the PVMs. (c) Identification and quantification of the temperature of the hotspots in the PVMs.
Fire 06 00196 g003
Figure 4. Electrical current and voltage comparison graphs for each PVM. (a) PVM voltage comparison. (b) PVM electrical current comparison.
Fire 06 00196 g004
Figure 5. Leading international associations and standards on electrical devices for renewable energies.
Fire 06 00196 g005
Figure 6. Visualization of a fire caused by a hotspot in a PVM in ENES J-UNAM.
Fire 06 00196 g006
Figure 7. PVM-certifying organizations.
Fire 06 00196 g007
Figure 8. Direct current (DC) protection device (SPD): (a) surge protection device for photovoltaic systems; (b) direct current thermomagnetic switch; (c) photovoltaic selector switch.
Fire 06 00196 g008
Figure 9. Internal comparison of a DC and AC thermomagnetic switch.
Fire 06 00196 g009
Figure 10. Combiner box with electrical protections for a photovoltaic system.
Fire 06 00196 g010
Figure 11. Melting of electronic components of solar charge controllers due to peak current.
Fire 06 00196 g011
Figure 12. Electrical peak current explosion in internal capacitors of an inverter of an off-grid photovoltaic system.
Fire 06 00196 g012
Figure 13. Shading length diagram between PVMs.
Fire 06 00196 g013
Table 1. Maximum temperature calculation parameters of the PVM.
I rr-site
(W/m2)
I rr-NOCT
(W/m2)
T N O C T
(°C)
T env-NOCT
(°C)
T env-site
(°C)
T max P V M
(°C)
82080043 (±2)203154.57
Table 2. Percentage of actual energy losses of each PVM.
PVM1PVM2PVM3PVM4
T max P V M 55.2 °C56.9 °C61.4 °C54.3 °C
Δ T 30.2 °C31.9 °C36.4 °C29.3 °C
% L V o c −8.456%−8.932%−10.192%−8.204%
% L I s c 1.51%1.595%1.82%1.465%
% L P m a x −10.87%−11.48%−13.10%−10.55%
Table 3. Theoretical values at the sites of V OC-site , I SC-site and P max-site .
PVM1PVM2PVM3PVM4
V OC-site 55.2 °C56.9 °C61.4 °C54.3 °C
I SC-site 30.2 °C31.9 °C36.4 °C29.3 °C
P max-site −8.456%−8.932%−10.192%−8.204%
η PVM-site 18.96%18.83%18.48%19.03%
Table 4. Electrical conductors for photovoltaic systems.
Electrical Conductor MaterialType of Electrical ConductorConductor CoatingStandardsMaximum Operating Temperatures
Aluminum
Aluminum–Tin
Copper
XLPE
UV
UL 85460 °C
75 °C
90 °C
THWUL 4703
THW-LSUL 1685
THHWUL 44
THHW-LSUL 83
RHW-2ASTM B3
USE-2ASTM B8
THHNASTM B787
THWN-2ASTM B800
XHHWANSI/NEMA WC-70 ICEA S-95-658
XHHW-2NTE INEN 2 345
Disclaimer/Publisher’s Note: The statements, opinions and data contained in all publications are solely those of the individual author(s) and contributor(s) and not of MDPI and/or the editor(s). MDPI and/or the editor(s) disclaim responsibility for any injury to people or property resulting from any ideas, methods, instructions or products referred to in the content.

