Abstract
Hermetic pressurized buildings have been developed to reduce the effects of high altitude. The behavior and effect of fire in this new type of building have not been studied before. Unlike common buildings, the inside pressure in this new type of building is maintained at around standard atmospheric pressure, which is significantly higher than the outside environment pressure in high altitude regions. In addition, at the early stage of a fire, the oxygen required to maintain combustion in the sealed building is supplied by mechanical vents (if in operation) instead of opening windows or doors as in common buildings. This paper presents a case study on the behavior of fire in a sealed pressurized hotel building located in Tibet. Fire dynamics simulator (FDS) is used to study fire behavior under different design fire scenarios. Available evacuation time under different fire scenarios are obtained by analyzing oxygen concentration, gas content, temperature, visibility and other indicators. Based on this, a fire protection design scheme is suggested.
1. Introduction
High altitude hermetic pressurization buildings (HAHPB) are a new type of building structure developed by China Construction Third Engineering Bureau Group Co./Center for Advanced Technology (Wuhan, China) [1]. HAHPB can make cabin atmospheric pressure, oxygen concentration, temperature, humidity, and other key human settlement indicators reach the same levels as ordinary areas, and effectively solve problems such as altitude sickness through the use of cabin pressurization oxygen replenishment technology. HAHPB has to withstand the pressure difference between inside and outside. The indoor pressure is higher than the ambient pressure during the course of service. Therefore, fire behavior in the cabin body might be quite different from that in ordinary buildings, which could make existing fire safety design methods and measures for common buildings not applicable to HAHPB.
Because a HAHPB is sealed inside, hot gases and smoke cannot overflow through building gaps or windows, and fire size is limited by the lack of oxygen. Further, the indoor pressure is greater than the outdoor environment pressure so that the relief of indoor pressure must be first completed in order to open the escape door. Therefore, the fire protection and evacuation strategy for HAHPB could be different from that of common buildings. At present, many studies have been carried out to study fire behavior in common buildings in high altitude areas [2], and there are also relevant regulations for fire control measures of pressurized cabins (such as hospital hyperbaric oxygen chambers) [3]. However, there is no report on fire research with regard to HAHPB.
This paper investigates numerically the fire behavior of a HAHPB for a hotel project. The fire protection design method for common buildings has been referred to in consideration of the environmental pressure in high altitude areas. A fire dynamics simulator (FDS) [4] is used to study the fire development state and available evacuation time under eight designed fire scenarios. Parameters such as different fire source location, the opening and closing of the fire door, and automatic sprinkler system settings are considered. Based on the numerical results, fire protection measures are proposed.
2. Project Overview
The HAHPB complex in this project is composed of several modular units, each of which includes basic modules such as standard cabin, corridor, and transition cabin, as shown in Figure 1. The standard cabins are used as rooms (office room, bedroom, gym, etc.) and the corridor cabins are used as pathways. The transition cabins are used to connect the inside and outside, the different horizontal and/or vertical zones, and can quickly be pressurized and depressurized. Figure 2 shows an overall view of the building complex, and plane layouts are shown in Figure 3 and Figure 4.
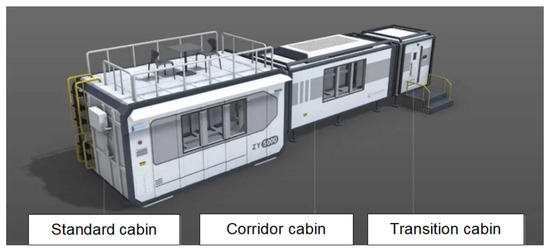
Figure 1.
Standard cabin, corridor cabin, and transition cabin for HAHPB [1].
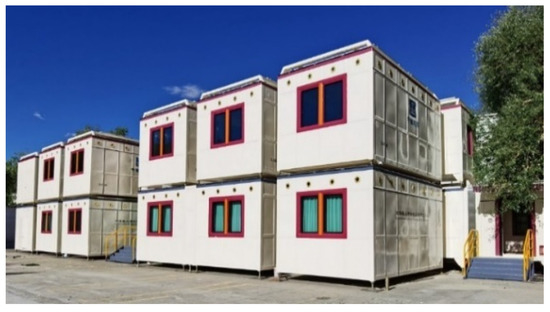
Figure 2.
Example of a HAHPB complex in Lhasa, Tibet [1].
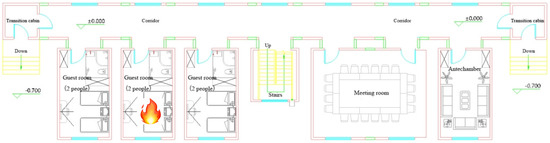
Figure 3.
Layout of the 1st floor of the building complex (fire source position A is also shown).
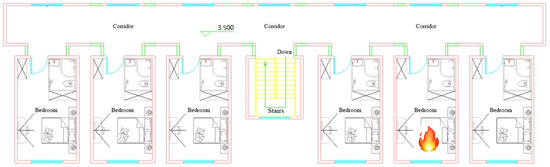
Figure 4.
Layout of the 2nd floor of the building complex (fire source position B is also shown).
There is no standard or code for fire protection design in HAHPB. As a reference, the Chinese national code for fire protection design of (common) buildings (GB50016-2014 [5]) is used in this project. Since HAHPB is quite different from common buildings, advanced fire dynamic simulations were carried out to predict fire behavior in HAHPB and verify the fire protection design. The main function of the HAHPB complex in this project is accommodation, and its fire risk is compared to that of hotels, which have the following characteristics [6]:
- There are a lot of combustible materials, which can easily cause heavy casualties and economic losses;
- The building structure itself can easily to cause the rapid spread of fire;
- Concentrated personnel, frequent flow, and difficult management;
- Many disaster-causing factors, such as electricity, fire, and gas.
3. Fire Scenario Setting and FDS Simulation
3.1. Scenario Setting
The selection of fire scenarios mainly refers to the following principles [6]:
- The most likely but not necessarily the most harmful principle;
- The principle of greater fire harm; and
- The principle that fire damage is great, but the possibility of occurrence is small.
When determining a fire scenario, the fire load, fire source location, fire development rate, possible maximum heat release rate (HRR), and the applied fire protection system need to be determined.
3.1.1. Fire Load
Since the 1970s, a great deal of investigation and research on the fire load of functional buildings has been carried out in order to grasp the fire distribution law of various buildings. Table 1 shows the investigation results of fire load on hotel rooms [7,8,9,10,11,12,13].

Table 1.
Fire load of guest rooms.
In addition to guest rooms, there is also a meeting room and an antechamber. The main combustibles in the meeting room are office tables and chairs, projectors, curtains, trash cans and so on. The combustible materials in the antechamber include a sofa, bookcase, books, printer, coffee table, trash can, curtain, water dispenser, and so on. Wang [14] investigated and studied the fire load of 373 office rooms in 12 high-rise office buildings in Chongqing. Table 2 gives the obtained fire load distribution.
Table 2.
Fire load of office buildings [14].
It can be seen from the above survey data that the fire load density of the guest rooms in this project is the highest, and the guest rooms are prone to fire due to smoking or careless use of fire. Comparatively, the probabilities of fire in the meeting room and antechamber are relatively low. Further, when fire occurs in a guest room, the guests may be sleeping, so the fire is unlikely to be detected and put out in time. In comparison, the staff in the meeting room and antechamber are usually awake, and so fire is very likely to be observed and put out in time. Therefore, the probability and risk of fire in the guest rooms of this building complex are both higher than the other rooms.
3.1.2. Fire Source Position
In the analysis of fire load, two fire source positions are set, labeled as fire source A and B. Fire source A is located in a guest room on the first floor (Figure 3), and fire source B is located in a guest room on the second floor (Figure 4). Both fires are assumed to be caused by the careless smoking of the occupants. On this assumption, the cigarettes first ignite the pillows, sheets, quilts, etc., and then ignite mattresses, beds, and other furniture. The impact of the fire in the first and second floor guest rooms on the personnel evacuation of the building will be investigated in the following sections.
3.1.3. Coefficient of Fire Growth
The t2 fire model is adopted in the fire development stage, so that the heat release rate Q is calculated as follows [6]:
where α is the coefficient of fire growth, kW/s2; t is the burning time of the fire, s. Table 3 shows the values for the coefficient of fire growth for different fire types. The combustibles in the guest rooms of this project mainly include furniture, mattresses, quilts, curtains, etc., and the fire type is assessed to be between medium speed and fast fire. Therefore, fast fire is conservatively considered, and the coefficient of fire growth is taken to be 0.047 kW/s2.
Table 3.
Fire growth coefficient (α).
3.1.4. Maximum Heat Release Rate
The building is sealed so that there is no outdoor ventilation during the fire process, thus the maximum heat release rate is calculated as ventilation control type [15]:
where Ao and Ho are the equivalent area and height of the vent. The air vent in the guest room of this project is the door, which is 1 m width × 2 m height. Considering that the door is completely open, the maximum heat release rate without automatic sprinklers is about 3.3 MW. When the fast response sprinkler is set (the response time index of the sprinkler is 50 (m.s) 1/2), according to the simulation results of FDS, the sprinkler in the fire room operates at 80 s after ignition. Using 1.2 as the safety factor, the sprinkler is assumed to be operating at 96 s after ignition. Accordingly, the maximum heat release rate for a sprinkler-controlled fire is calculated as 0.43 MW (from Equation (1)).
3.1.5. Fire Scenario Setting
Based on the above analysis, eight fire scenarios are investigated, as shown in Table 4.
Table 4.
Fire scenario settings.
3.2. Numerical Model
Figure 5 shows the FDS numerical model of the HAHPB. The size of the calculation grid is determined according to the characteristic diameter of the fire source [4]:
where is the total heat release rate; is the specific heat of ambient air; is the ambient air density; is the ambient air temperature; is the gravity acceleration. In the calculation, the value range of D*/δx is generally between 4 and 16, where δx is the characteristic mesh size. For a 3.3 MW fire source, D* is about 1.55 m, and δx is suitable for 0.1~0.39 m. Therefore, the mesh size in the calculation is selected as 0.2 m × 0.2 m × 0.2 m. Other settings and assumptions of the numerical model are as follows:
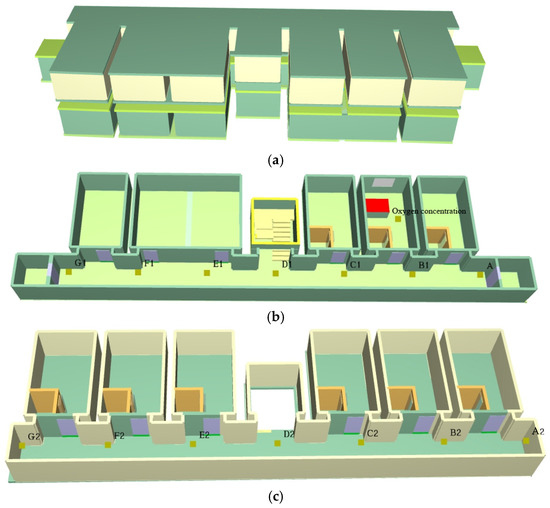
Figure 5.
(a) FDS model; (b) First floor; (c) Second floor. FDS model of the HAHPB.
- Environment: ambient temperature is 20 °C; outdoor pressure is 0.652 standard atmosphere pressure (atm); and the indoor pressure is 0.852 atm. The effect of wind is not considered, or the wind speed is 0 m/s;
- Opening condition: in the fire simulation process, all doors are kept closed except the door of the guest room on fire;
- Fire source position: see the position of each fire source in the previous section;
- Combustible type: the combustibles in the guest room are complicated, including wood, synthetic fibers, etc., and it is difficult to carry out simulation calculation on all combustibles. In order to simplify the calculation, it is assumed that the combustion material used in the simulation calculation is composed of 50% wood and 50% synthetic fibers. The soot yield and CO yield are set as 0.05 g/g, as commonly used in fire engineering design;
- Object surface: the external walls of the building are set as thermal insulation walls, and the thermal conductivities are taken as 0.05 W/(m.K);
- The simulation time is set as 900 s.
In the simulation, temperature, visibility, and FED monitoring points are set at 1.7 m high in the middle of the corridor on the first floor and the second floor respectively. The locations of the monitoring points are shown in the first-floor model (A1–G1) and second-floor model (A2–G2).
3.3. Criterion for Safe Evacuation
As shown in Figure 6, the following conditions should be met for safe evacuation:
where tASET is the available evacuation time; tRSET is the required evacuation time. tASET depends on the toxicity, thermal effect, and dimming of fire smoke. The toxicity of fire smoke is generally evaluated quantitatively by the FED (Fractional Effective Dose) index [4], and its value is calculated by Equation (5). Definitions for parameters in Equation (5) can be found in [4]. It is generally believed that when FED ≥ 1.0, trapped personnel exposed to this environment will lose the ability to move or even die [6].
tASET > tRSET
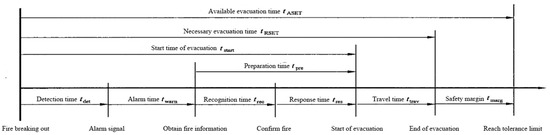
Figure 6.
Timeline of personnel safe evacuation.
The thermal effect of fire smoke includes thermal radiation and thermal convection. The human body’s tolerance limit can exceed 5 min when the thermal radiation intensity is less than 2.5 kW/m2 [6]. By calculation, when the upper gas layer is 2.5 m above the ground and with a temperature of 200 °C, the calculated radiation intensity at the floor level is about 2.5 kW/m2. Therefore, 200 °C is taken as the limit temperature of human body tolerance of a 2.5 m high upper gas layer. The maximum temperature of air that can be inhaled by the human body (convection) is usually 100 °C. In addition to toxicity, smoke also has the ability to reduce light and cause irritation to human eyes. The combined action of these two factors leads to visual impairment of people caught in the fire. The critical value of visibility in a small building space is 5 m [6]. Table 5 presents thresholds for smoke temperature, FED, and visibility that are used in this study.
Table 5.
Limits of performance parameters affecting personnel safety.
The time required to start evacuating a building, tstart, is related to the amount of floor space (Afloor, m2) to be evacuated, and varies with the purpose of the building. For hotels or other similar buildings, the required time for starting evacuation can be calculated by Equatuion (6):
4. Simulation Result Analysis
4.1. Fire Scenario A1
The fire develops rapidly in fire scenario A1. A smoke detector in the fire room activates at 20 s after the fire breaks out. Introducing a safety factor of 2, the tenants are considered to leave the fire room through the door at about 40 s. The smoke detector in the first-floor corridor activates at 60 s.
Figure 7 shows the change curves of heat release rate (HRR) and oxygen concentration in the fire room for scenarios A1 and A2. As can be seen from the figure, the maximum HRR for fire scenario A1 is about 1.9 MW, much less than the set HRR of 3.3 MW. The main reason is the insufficient ventilation. The oxygen concentration in the fire room drops to below 13% after 200 s, which cannot meet the needs of combustion. In fire scenario A2, for which the fire room door is closed, the oxygen concentration drops to 13% at 130 s and the fire is self-extinguished with a maximum HRR of 0.57 kW.
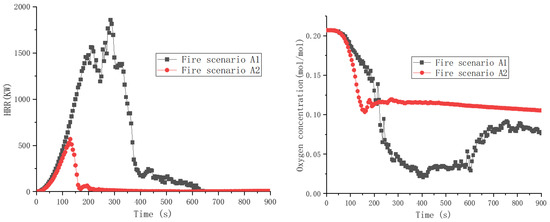
Figure 7.
HRR and oxygen concentration of fire room in fire scenarios A1 and A2.
Figure 8 shows the smoke spread at different moments for fire scenario A1. The tenant opens the door 40 s after the fire breaks out. Smoke spreads from the room to the corridor at 50 s. At 100 s, a large amount of smoke spreads to the first-floor corridor, forming a thick layer of smoke. At 150 s, the smoke fills the corridor and staircase on the first floor and begins to spread to the corridor on the second floor. At 200 s, the second-floor corridor is filled with smoke.
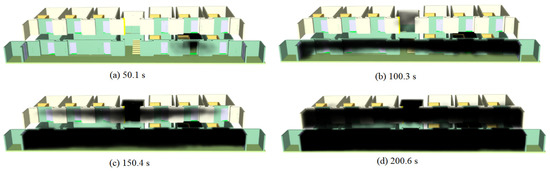
Figure 8.
Smoke distribution of fire scenario A1 at different times (numbers are in second).
Figure 9 shows the FED distribution at different measuring points at 1.7 m height in the corridor for fire scenario A1. The red line value is the limit of FED affecting personnel safety. As can be seen from the figure, the FEDs for points A1 and B1 (locations shown in Figure 5) of the first floor corridor reach 1 at 265–280 s. The FEDs for points C1, D1, E1, and G1 reach 1 at 310–330 s. The FEDs for monitoring points in the second-floor corridor (A2 to G2 in Figure 5) reach 1 within 540 s.
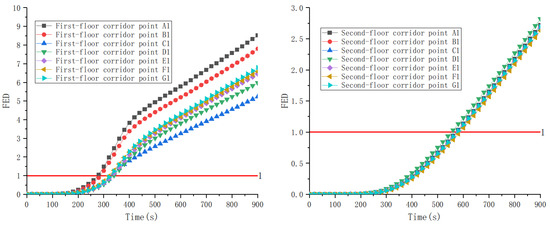
Figure 9.
FED distribution at different measuring points at 1.7 m height of corridor in fire scenario A1.
Figure 10 shows the corridor temperature distribution at different moments for fire scenario A1. As can be seen from the figure, 100 s after the fire breaks out, the ceiling temperature of the first-floor corridor outside the fire room reaches 100 °C. At 200 s, the temperatures in most areas of the first-floor corridor reach 100 °C. At 300 s, the temperature in the ceiling of the second-floor corridor reaches 100 °C, and at 400 s, the temperatures in most areas of the second-floor corridor reach 100 °C.
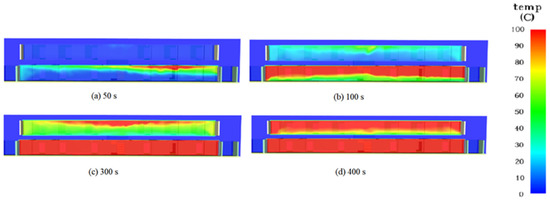
Figure 10.
Corridor temperature distribution at different times in fire scenario A1.
Figure 11 shows the temperature distribution at different measuring points at a height of 1.7 m in the corridor for fire scenario A1. The red line value is the limit of temperature affecting personnel safety. As can be seen from the figure, the temperatures at points A1, B1, and C1 in the first-floor corridor reach 100 °C at around 140 s. The temperatures at points D1, E1, F1, and G1 reach 100 °C at around 190 s. The temperatures at the monitoring points in the second-floor corridor reach 100 °C at around 350 s.
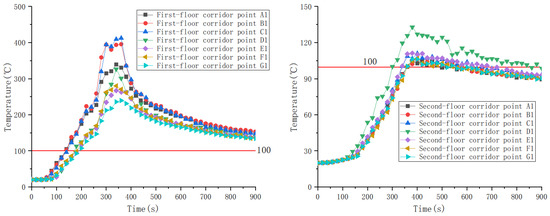
Figure 11.
Temperature distribution of different measuring points at height of 1.7 m height in corridor A1 in fire scenario A1.
Figure 12 shows the visibility distribution of the corridor at different moments for fire scenario A1. As can be seen from the figure, 100 s after fire breaks out, the visibility at the top of the first-floor corridor outside the fire room decreases to 5 m. At 150 s, the visibilities in most areas of the first-floor corridor decrease to 5 m, and the visibility on the ceiling of the second-floor corridor begins to decrease. At 200 s, the visibilities in most areas of the second-floor corridor decrease to 5 m.
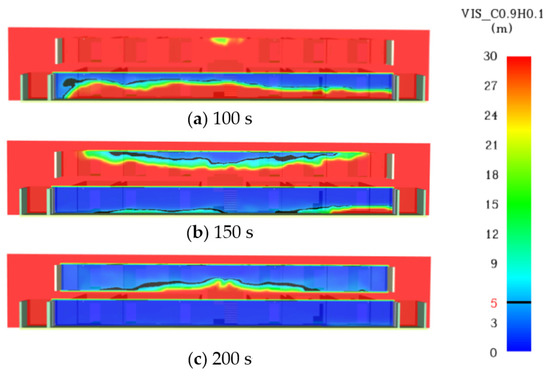
Figure 12.
Visibility distribution of corridor at different times in fire scenario A1.
Figure 13 shows the visibility distribution of different measuring points at a height of 1.7 m in the corridor for fire scenario A1. The red line value is the limit of visibility affecting personnel safety. As can be seen from the figure, the visibilities for the measuring points in the first-floor corridor fall below 5 m between 80–110 s. The visibilities for the measuring points in the second-floor corridor fall below 5 m between 160–180 s.
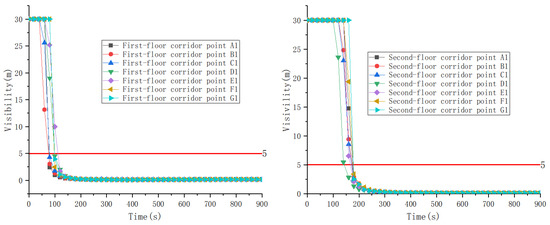
Figure 13.
Visibility distribution of different measuring points at height of 1.7 m height in corridor in fire scenario A1.
Based on the above analysis, the values of FED, temperature, and visibility for monitoring points A1 and G1 at the two exits of the first-floor corridor are taken as the evaluation criteria. Table 6 gives the available evacuation time for fire scenario A1.
Table 6.
Available evacuation time for each fire scenario (s).
4.2. Fire Scenarios A2 to B4
The same analysis strategy for scenario A1 is adopted for fire scenarios A2 to B4. Table 6 also gives the available evacuation time for scenarios A2 to B4, which are determined based on the critical values of FED, temperature, and visibility.
4.3. Analysis of Personnel Safety Evacuation
The fire simulation results show that the smoke detector in the fire room activated at 20 s after fire breaks out. The smoke detector in the corridor detected the fire at around 60 s and 85 s for the scenarios with the door of the fire room opened or closed, respectively. According to the settings, the broadcast alarm of fire to the whole building is made when both the smoke detectors in the fire room and the corridor are activated. Therefore, the fire alarm time is 60 s when the door of the fire room is opened, and 85 s when the door of the fire room is closed.
The sum of the building area to be evacuated is about 400 square meters. According to Equation (6), the time required for start evacuation, tstart, is 5.7 min, or about 340 s. Typical unimpeded horizontal travel speeds are about 1.2 m/s, unimpeded downward speeds are about 0.8 m/s, and upward speeds are about 0.7 m/s. The studied HAHPB has a simple layout and a single evacuation route, and the density of personnel is very low. Therefore, the evacuation process time is determined by the evacuation time of the tenant farthest away from the evacuation exit. It is about 40 m from the furthest point in the guest room at the end of the second-floor corridor to the evacuation door on the first floor. Assuming the speed in the entire evacuation process takes the unhindered downward speed of 0.8 m/s, we get the evacuation process time of 40 m ÷ 0.8 m/s = 50 s. Therefore, the entire evacuation time is 340 s + 50 s = 390 s.
The effect of HAHPB depressurization on the evacuation time has not been addressed in this paper. In normal situations, when people exit the building, they need to enter the transition cabin first, then they need to depressurize the transition cabin to the outdoor pressure. Only then can they escape from the transition cabin to the outside. As the response time of the occupants is not the same during the fire, they cannot reach the transition cabin at the same time, so it will take quite a long time for the transition cabin to depressurize and re-pressurize over and over again. Note that the transition cabin needs to be re-pressurized to open the door which connects the cabin and the other space in the building. To ensure the occupants can enter the transition cabin without waiting, the entire building must be depressurized, which is the subject needing study in the future.
It can be concluded from Table 6 that when a fire occurs on the first floor, the safe evacuation of the whole building can be satisfied only under fire scenarios A2 and A4, for which the door of the fire room is closed. When a fire breaks out on the second floor, only the second-floor corridor has hazardous visibility under fire scenarios B2 and B4. In fire scenarios B2 and B4, the first-floor corridor is in a smoke-free environment. Therefore, it is considered that in fire scenarios B2 and B4, the personnel on the second floor can escape safely by first stooping through the second-floor corridor and then getting down to the first floor.
5. Conclusions and Suggestions
The FDS was used to simulate the fire development situation in different fire scenarios in a HAHPB. The FED value, air temperature, and indoor visibility at different measuring points in the HAHPB are investigated and used to determine the available evacuation time and corresponding fire protection strategies. Based on the numerical results, the following conclusions can be drawn:
- (1)
- When the door of the fire room is opened, the smoke detector in the corridor detects the fire earlier, while the smoke spreads into the corridor faster. A closed door can effectively delay and prevent the smoke spread from the fire room to the corridor. The start of the automatic sprinkler system can significantly reduce the scale of the fire and restrain the increase of toxic gas concentration and indoor temperature rise.
- (2)
- Only when the fire source is on the first floor and the fire room door is closed can the available evacuation time meet the required safe evacuation time. When the fire source is on the second floor and the fire room door is closed, personnel may evacuate safely by stooping down through the smoke layer to reach the staircase connecting to the first floor.
Based on the above conclusions, the following fire protection strategies are proposed:
- (1)
- Automatic sprinkler systems should be set in the guest rooms and the corridor, and a rapid response sprinkler is suggested.
- (2)
- A door-closing device should be installed on the room door to ensure that the door is always closed.
- (3)
- As it will take quite a long time for the occupants to depressurize and re-pressurize the transition cabin when escaping to the outside, the entire building must be depressurized after a fire breaks out.
The above conclusions and suggestions are based on the numerical simulation results of this paper, and the validity of relevant contents needs to be further verified through further experiments and other research.
Author Contributions
Conceptualization, K.Z. and K.-Q.W.; methodology, J.-P.Y., Z.-M.L., Z.-W.Y. and J.-Y.Z.; software, J.-P.Y.; validation, Z.-W.Y. and J.-Y.Z.; formal analysis, J.-P.Y.; investigation, Z.-W.Y. and J.-Y.Z.; data curation, J.-P.Y.; writing—original draft preparation, S.-J.L.; writing—review and editing, C.Z.; supervision, K.Z., K.-Q.W. and C.Z.; project administration, Z.-M.L. and C.Z.; funding acquisition, Z.-M.L. and C.Z. All authors have read and agreed to the published version of the manuscript.
Funding
This research was funded by China State Construction Engineering Corporation Ltd. grant number [CSCEC-PT-011].
Data Availability Statement
Not applicable.
Conflicts of Interest
The authors declare no conflict of interest.
References
- China Construction Three Bureau. “Zero Altitude House” Let You Conquer the Tibetan Plateau. Available online: https://www.kepuchina.cn/Article/articleInfo?business_type=100&classify=0&ar_id=85175 (accessed on 7 April 2023).
- Tu, R.; Zeng, Y.; Fang, J.; Zhang, Y.M. Influence of high altitude on the burning behaviour of typical combustibles and the related responses of smoke detectors in compartments. R. Soc. Open Sci. 2018, 5, 180188. [Google Scholar] [CrossRef] [PubMed]
- GB/T12130-2005; Standard for Medical Air Pressurized Oxygen Chamber. National Standard of the People’s Republic of China: Beijing, China, 2005. (In Chinese)
- McGrattan, K.; Hostikka, S.; Floyd, J.; Mcdermott, R.; Vanella, M. Fire Dynamics Simulator User’s Guide. NIST Special Publication 1019, 6th ed.; National Institute of Standards and Technology: Gaithersburg, MD, USA, 2022. [Google Scholar]
- GB50016-2014; Code for Fire Protection Design of Buildings. National Standard of the People’s Republic of China: Beijing, China, 2014. (In Chinese)
- Hurley, M.J.; Gottuk, D.; Hall, J.R.; Harada, K.; Kuligowski, E.; Puchovsky, M.; Torero, J.L.; Watts, J.M.; Wieczorek, C. SFPE Handbook of Fire Protection Engineering-Fifth Edition; Springer: New York, NY, USA, 2016. [Google Scholar]
- Babrauskas, V. Fire Endurance in Buildings, UCB FRG 76-16; University of California: Berkeley, CA, USA, 1976. [Google Scholar]
- Thomas, P.H. Design guide: Structure fire safety CIB W14 workshop report. Fire Saf. J. 1986, 10, 77–137. [Google Scholar] [CrossRef]
- Fire Prevention Council of Tokyo Fire Department. Fire Safety Assessment Based on the Architectural Characteristics; University of Tokyo Press: Tokyo, Japan, 2001. [Google Scholar]
- Cai, Y.; Li, T. Statistics and analysis of fire load of hotel buildings in Tianjin. Fire Tech. Prod. Inf. 2008, 4, 24–27. (In Chinese) [Google Scholar]
- Gao, W.; Sun, J.H. Analysis on the distribution regularity of fire load in hotel and college students’ dormitory buildings. J. Saf. Environ. 2009, 9, 153–156. (In Chinese) [Google Scholar]
- Guo, Z.D.; Xu, F.Y.; Wu, L.Z.; Yue, L.H. Survey and statistical analysis of the fire load in hotel rooms. J. Saf. Environ. 2011, 11, 149–153. (In Chinese) [Google Scholar]
- Luo, J.; Sun, C.M. Investigation and statistical analysis of fire load in Yunnan ancient city hotel. Fire Sci. Technol. 2019, 358, 1171–1173. (In Chinese) [Google Scholar]
- Wang, N.S. Performance Based Design of High Rise Buildings Based on Fire Load Survey. Master’s Dissertation, Chongqing University, Chongqing, China, 2013. (In Chinese). [Google Scholar]
- Zhang, C.; Li, G.Q. Modified one zone model for fire resistance design of steel structures. Adv. Steel Constr. 2013, 9, 284–299. [Google Scholar]


Disclaimer/Publisher’s Note: The statements, opinions and data contained in all publications are solely those of the individual author(s) and contributor(s) and not of MDPI and/or the editor(s). MDPI and/or the editor(s) disclaim responsibility for any injury to people or property resulting from any ideas, methods, instructions or products referred to in the content. |
© 2023 by the authors. Licensee MDPI, Basel, Switzerland. This article is an open access article distributed under the terms and conditions of the Creative Commons Attribution (CC BY) license (https://creativecommons.org/licenses/by/4.0/).