Abstract
The Caldor fire burned ~222,000 acres of the Eastern Sierra Nevada during summer–fall 2021. We evaluated the effects of this “megafire” on the physical properties of a sandy soil developed from glacial tills to document fire-induced soil modifications in this region. We measured soil water retention and hydraulic conductivity functions as well as the thermal properties of five core samples from control (unburned) areas and eight core samples from burned soil of the same soil unit. Soil water repellency was measured in terms of water drop penetration time (WDPT) in the field and apparent contact angle in the laboratory on control and burned soil as well as ash samples. Soil organic matter (SOM) and particle and aggregate size distributions were determined on control and burned soil samples. Additionally, scanning electron microscopy (SEM) was used to image microaggregates of control and burned soil samples. We found a significant difference in SOM content and sand and silt aggregate size distribution between control and burned samples, which we associated with the disintegration of microaggregates due to the fire. We found no significant difference between soil water retention and hydraulic conductivity functions of control and burned soil but observed greater variation in saturated hydraulic conductivity and systematic shifts in thermal conductivity functions of burned compared to control samples. WDPT and apparent contact angle values were significantly higher for burned soils, indicating the occurrence of fire-induced soil hydrophobicity (FISH). Interestingly, the average apparent contact angle of the control soil was >90°, indicating that even the unburned soil was hydrophobic. However, the ash on top of the burned soil was found to be hydrophilic, having apparent contact angles <10°. Our results indicate that SOM and microaggregates were readily affected by the Caldor fire, even for sandy soil with a weakly developed structure. The fire seemed to have moderated thermal properties, significantly and soil wettability but had only minimal effects on water retention and hydraulic conductivity functions. Our findings demonstrate the complex nature of fire-soil interactions in a natural environment and highlight the need for additional investigation into the causes and processes associated with FISH and structure alterations due to fire to improve our ability to rapidly determine potential problem areas in terms of hazards commonly associated with fire-affected soils.
1. Introduction
The 2021 “megafires” in the United States burned prominently in Washington, Colorado, Oregon, California, Arizona, New Mexico, and Nevada, totaling burned areas exceeding 4.2 million acres (~17,000 km2) and devastating forested areas across the western US. Many of these fires caused severe damage to roads and other infrastructure due to post-fire flooding and instability created on steep slopes, ultimately owing to the inclement weather that followed during the fall of 2021, particularly in Eastern California. These fires are likely to increase in frequency and intensity in the future due to changing climate [1] and are, thus, expected to have strong impacts on soil properties that ultimately control infiltration, runoff, and soil erodibility in fire-prone areas [2,3,4].
Conditions that cause reduced infiltration and enhanced runoff are directly related to changes in the physical arrangements and surface chemistry of soil particles. It has been shown that soil structure deteriorates due to the rapid vaporization of pore water and the breakdown of soil organic matter (SOM) in the soil during a fire [5,6,7]. Other studies have also shown that hydrophobic conditions occur in the soil after a fire, caused by the combustion of fuel on the soil surface and/or exposure of the underlying soil to fire-induced heat and volatile organic compounds [8,9,10], ultimately reducing infiltration rates into the soil after a fire. Fire effects on soil hydrophobicity and structure have been studied extensively in laboratory-controlled environments (e.g., [7,11]), but these commonly do not replicate field conditions. Although there is a multitude of field studies from various regions that document fire effects on soil properties, similar studies have not been conducted in fire-prone areas of the Eastern Sierra Nevada. As such, our understanding of the fundamental processes that enhance hydrophobicity and surface runoff after a fire [12,13], depth and intensity of heat transport within the soil column [14], as well as generation of sediment and debris flows [15,16] from soils of this region is surprisingly limited, hampering potential for land management successes in areas of increasing fire frequency that may have the potential to cause negative and even catastrophic downstream effects.
In this study, we examined the potential impacts of a wildfire on the physical properties, specifically soil structure, water repellency, and thermal capacity, as well as thermal conductivity of a typical sandy soil of the Eastern Sierra Nevada mountains under conifer forest vegetation, using the Caldor fire as an example (Figure 1A). We followed standard methods used in soil physics and wildland fire hydrology to measure the physical properties of soils from burned and unburned (control) sites with the primary goal of investigating whether the Caldor fire might have changed the physical properties of a typical soil in this environment. This paper summarizes the results from our pilot study and presents new data from a region in the Eastern Sierra Nevada where post-fire soil studies are lacking in comparison to other regions in the southwestern USA.
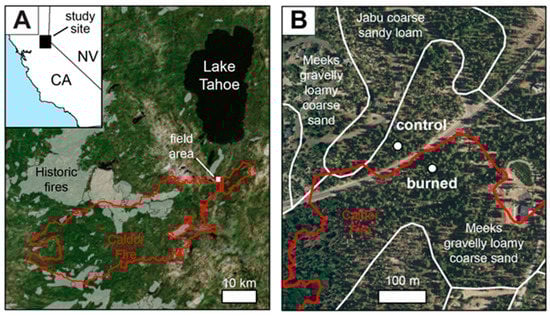
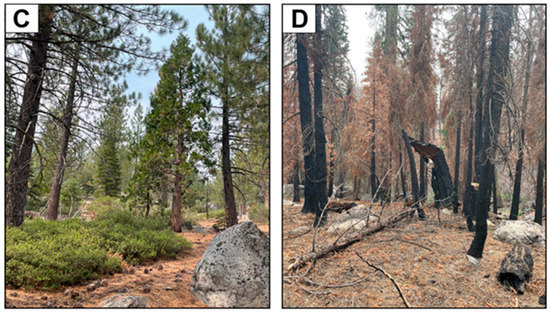
Figure 1.
(A) Map of the Caldor Fire perimeter (red line) in Northern California south of Lake Tahoe (see inset map). Also shown in gray polygons are historic fire perimeters from 1878 to 2020 (Conservation Biology Institute, 2022). (B) Close-up aerial image showing the locations of control and burned sample sites with fire perimeter (red line) and soil map units (white line) also shown. The paved road separating the two sites provided a fire line north of which the fire did not cross. (C) Typical vegetation and soil surface conditions at the control site at the time of soil sampling. Trees have undamaged bark and live needles. Shrubs in the vicinity have green leaves. Pinecones and needles at the surface do not show evidence of recent burning. (D) Typical vegetation and soil surface conditions at the burned site at the time of soil sampling and field testing. Tree bark is charred on most trees. Needles present on a few trees are dead, but most trees have shed their needles since being burned. A mix of uncharred (pre-fire) and charred (post-fire) needles was present at the surface.
2. Materials and Methods
2.1. Site Characteristics
The Caldor fire started on 14 August 2021, burned ~900 km2 (~222,000 acres) within the Sierra Nevada range of Eastern California (Figure 1A) and became the second of only two fires in recorded history to cross the Sierra Nevada. Extensive areas within the fire perimeter include steep slopes (up to 50%) with thin soil cover. Over 50% of the fire-affected areas were reported as having moderate- to high-intensity burns [17]. Primary fuels included chaparral (low to moderate elevations in the Western Sierras) and closed timber litter and timber (higher elevations). Areas with the highest soil burn severity occurred in the chaparral zones west of the Sierras [17]. The Caldor fire was reported 100% contained on 21 October 2021, in the wake of a record-breaking California bomb cyclone event that covered the region in rain and snow.
For this study, we selected a site within the perimeter of the Caldor fire where both burned and unburned areas were within the same Natural Resources Conservation Service (NRCS) soil map unit (Figure 1B). We identified areas of similar soil conditions between the burned and control sites using data from soil survey maps, geomorphological characteristics, and qualitative observations of tree canopy and soil-surface characteristics. This study targeted soils mapped as part of the Meeks series by the NRCS (Figure 1B), classified as Humic Dystroxerepts that occur on the summit and backslope positions of glacial moraines. Typical Meeks pedons are somewhat excessively well-drained, occur on gentle to moderate slopes (15–30%), and consist of gravelly loamy coarse sand from parent materials composed of granodiorite tills. Meeks soil profiles commonly exhibit 0 to 5 cm-thick O horizons above a ~20 to 30 cm-thick sandy A-horizon sequence. The mean annual precipitation at the study site is ~880 mm, with the majority of precipitation occurring in winter from December to March. The average annual temperature at the study site is ~5.7 °C, with mean annual min and max of −2 °C and 17 °C, respectively. Local vegetation primarily consists of Jeffrey pine. Based on fire records from 1874 to 2020, the selected site has not been burned since 1874 [18].
Our approach reflects a space-for-time substitution of soil properties that allowed us to establish a control (unburned) site, a proxy for pre-fire soil conditions that we use to compare against a nearby burned site (Figure 1B). The control site is located north of an access road to the Humboldt-Toiyabe National Forest. The paved road served as a fire break and limited the northern extent of the fire in this location. We selected a burned site where the Burned Area Emergency Response (BAER) team estimated a low-to-moderate burn severity within the Caldor fire perimeter ~100 m south of the control site (Figure 1B, [19]).
The control site (Figure 1C) was unaffected by the fire, indicated by the lack of any signs of charring on vegetation or soil, as well as the relative abundance of uncharred litter (twigs, pine needles, and pinecones) found on the soil surface. The vegetation at the burned site, however, showed typical signs of low to moderate burn severity [19], indicated by the presence of ash and charred litter on the soil surface as well as charred bark of conifers (Figure 1D). Note that the uncharred pine needles found at the surface of the burned soil (Figure 1D and Figure 2) were deposited after the fire.
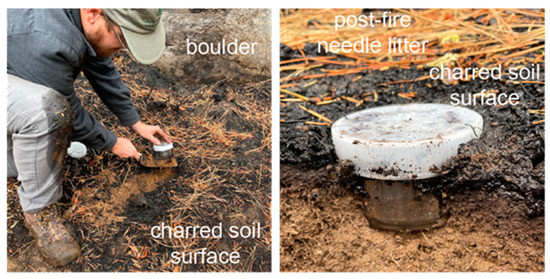
Figure 2.
(Left) Collection of core samples for measuring soil hydraulic and thermal properties. Samples were carefully excavated to minimize sample disturbance. (Right) Close-up view of core sample in place prior to excavation.
We observed dark organic-rich A-horizons above weakly developed sandy Bw horizons in the soils from the study site. The materials in the upper ~5 to 10 cm of soils in the study area lacked sufficient organic materials to qualify as O-horizons; however, the A horizons did appear organic-rich, exhibiting very dark to dark grayish brown (10 YR 3/2 to 4/2) dry colors. Charred needles and other organic matter were present in this zone of soils from the burned site and left soot on excavation and sampling tools. A small rain event (~5 mm during a 24-h period) partially saturated the charred soil materials in the upper 5 cm of the surface several days prior to sampling. We observed dry soil conditions below this zone at the burned site, indicating the presence of a hydrophobic zone at depth, while the same horizons at the control site were moist due to infiltration below this interface. The selected study site, therefore, demonstrated the presence of elevated hydrophobicity associated with burned areas and provided the opportunity for an evaluation of in-situ soil characteristics from a paired burned/control study site.
2.2. Field Measurements
Water Drop Penetration Time (WDPT) Tests
We conducted WDPT tests at seven control and seven burned locations within our study site according to the WDPT method described by [20,21]. We placed five to eight drops of deionized water (25 ± 4 µL drop volume) on the soil surface for each WDPT test from a height of 1 cm using 2 mL glass pipettes (VWR; Radnor, PA, USA). WDPT tests were first performed on ash after removing any freshly fallen litter, followed by additional tests on the soil surface after removing ash from the surface of the soil. The elapsed time between the placement of the drop and the moment the drop was completely absorbed by the soil was recorded as the WDPT. The shortest WDPTs recorded were ~0.5 s, and water drops were monitored for a maximum of 900 s (15 min) to minimize the impact of drop evaporation on the WDPT test.
2.3. Soil Sampling Protocols
We collected five soil cores from the control and eight soil cores from the burned soil site employing stainless steel sample rings (8 cm diameter, 5 cm height). Sample rings were pressed into the soil until the tops of the rings were flush with the surrounding soil surface (Figure 2). We then capped and excavated the sample rings such that extra bulk material was retained at the bottom of the sample ring to avoid sample disturbance. The bottoms of the cores were then trimmed with a spade and capped for transport to the laboratory. In the laboratory, we used the core samples to measure saturated hydraulic conductivity (Ks), the soil water retention function (θ(h)), thermal capacity (cv) as well as the thermal conductivity function (λ(θ)) of control and burned soils described in the laboratory analyses section. We calculated the hydraulic conductivity function (K(θ)) for each core using the van Genuchten [22] equation and the Ks and θ(h) measurements. We also collected additional samples from the mineral soil surface as well as ash samples from the same locations where we carried out WDPT tests to measure apparent contact angles of control soil, burned soil, and ash in the laboratory.
2.4. Laboratory Analyses
2.4.1. Qualitative Assessment of Soil Structure
We used scanning electron microscopy (SEM) to image the microstructure of six of the soil core samples. SEM images were used to identify potential differences in microstructure between control and burned soil that was not directly observable in the field. We sieved the very fine to fine sand fraction (50–250 μm equivalent diameter) from the oven-dried bulk soil core sample and placed them onto double-coated PELCO Tabs™ carbon tab adhesives (Ted Pella, Inc.; Redding, CA, USA). We then imaged the samples at 100× magnification using a Hitachi TM4000 scanning electron microscope, and images of control and burned soil were compared in terms of aggregate size distribution. Although the Hitachi TM4000 has the capability of producing elemental spectral data for selected points within the field of view, we did not perform elemental analysis of the aggregate composition to estimate differences in SOM via soil carbon (C) because of the expected interference from the carbon-based mounting tabs.
2.4.2. Measurement of Soil Hydraulic Properties
We measured saturated hydraulic conductivity (Ks) on the core samples collected from control and burned soils using a KSAT unit (METER Group; Pullman, WA, USA). For the Ks tests, we kept the cores within their sample rings to minimize sample disturbance. We first saturated the cores in degassed, deionized water to minimize the inclusion of air bubbles and maximize the initial saturation degree. We then used the falling head method to measure pressure head as a function of time curves. We obtained Ks for the core samples by fitting the pressure head time series data with the METER Group fitting software. We carried out a total of ten replicate measurements on each core sample to calculate an average Ks value for each core sample as well as to determine the variance of the Ks experiment. Ten replicate measurements on each soil core also ensured sufficient saturation of the soil core, critical not only for the Ks but also for the following soil water retention measurements, especially because control and burned soils showed some clear signs of hydrophobicity.
To measure the soil water retention (SWR) function of the control and burned soil core samples, we used a HYPROP unit and a WP4C dew point potentiometer unit (METER Group; Pullman, WA, USA). For the tests in the HYPROP unit, we transferred the saturated soil cores from the KSAT unit into the HYPROP unit. We then installed two tensiometers positioned at different depths within the core sample to monitor tensions within the core sample during the HYPROP test. For the HYPROP test, we allowed the cores to dry by evaporation under ambient laboratory conditions while monitoring changes in sample mass and tension. We dried the core samples until the tension in the soil reached the air entry value of the tensiometer, which occurred within a time range from several days to several weeks. The evaporation experiments with the HYPROP device enabled us to determine the “wet end” of the water retention function of the soil cores (i.e., for tensions ranging from 0 kPa to 120 kPa). Following the HYPROP tests, we used a WP4C unit to determine the “dry end” of the soil water retention functions of the soil cores (i.e., for tensions from 120 kPa to 300 MPa). For the WP4C tests, we placed small, subsampled aliquots from the top, middle, and bottom of each soil core sample in the chamber of the WP4C and allowed them to equilibrate with the air above the soil aliquots in the chamber. The WP4C device measures the water potential of the soil by determining the relative humidity (RH) of the air above the soil aliquots in the sealed, temperature-controlled chamber using a small mirror to chill until dew forms and the sample and mirror temperatures are measured at the dew point. RH values are then converted to soil water potential values using Kelvin’s equation [23]. We recombined the subsamples from WP4C measurement with the material from the original sample core, oven-dried the sample at 105 °C, and recorded the final dry soil mass to determine final soil moisture contents during the soil analysis.
2.4.3. Measurement of Soil Thermal Properties
We measured soil thermal properties simultaneously alongside the HYPROP tests using a triple probe heat pulse (TPHP) sensor (East 30 Sensors; Pullman, WA, USA) installed at the exposed soil surface of the core samples and connected to a CR3000 datalogger device (Campbell Scientific; Logan, UT, USA). The TPHP sensor consists of a central heater needle and two outer thermistor needles. For the TPHP measurement, we applied a current to the heater needle for a duration of 8 s, sending out a heat pulse through the soil surrounding the heater needle, and monitored the temperature fluctuations in the thermistor needles 6 mm from the heater caused by the incoming heat pulse from the heater needle. We recorded temperatures at each thermistor needle every 0.5 s for 80 s and repeated this process each hour during the experiment until the HYPROP tests were completed.
We processed the raw TPHP temperature data by computing the thermal diffusivity (κ) of the soil between the heater needle and the two thermistor needles to determine the heat capacity and thermal conductivity of the core sample based on the time it takes for the heat pulse to travel from the heater to the thermistor needles. This approach is based on the single-point method of [15], where the volumetric heat capacity () is calculated as
such that q’ is the energy input (W/m), κ is the thermal diffusivity of the media (m2/s), is the maximum temperature difference (°C) measured in response to the heat pulse, and Γ is an exponential integral that is evaluated based on Equation 5.1.53 of [24]. We computed the heat capacity, (J/m3/°C), for both thermistor needles separately and then used it to compute the thermal conductivity from the relationship,
where λ has units of W/m/°C.
Following calculations for the time series of λ, we estimated thermal conductivity functions (TCFs), λ(θ), based on relationships between λ and the volumetric moisture contents of the core sample computed from HYPROP analyses. We used a curve-fitting routine to obtain the TCF for each sample following the theories outlined by [25]. This method assumes a mathematical form of λ(θ), similar to that of the SWR curve of van Genuchten [14], such that
where and represent the thermal conductivities under dry- and water-saturated conditions, respectively, with the volumetric moisture content, the volumetric moisture content at which funicular water occurs (see [25] for details) and , a curve-fitting parameter defined as the pore fluid network connectivity parameter for λ [25]. Following the curve-fitting procedures achieved by least squares regression, we extracted and m for each soil core as fitting parameters, which were evaluated in this study.
2.4.4. Determination of Particle/Aggregate Size Distribution and SOM Content
We used the laser diffraction method to perform particle and aggregated size distribution analyses on two different subsamples taken from the soil cores after completing the hydraulic and thermal measurements described previously. For the first subsamples, hereafter termed “bulk dry samples”, we sieved oven-dried soil from the core samples using a 2 mm sieve. As such, the “bulk dry samples” consisted of soil aggregates and individual mineral grains with equivalent diameters <2 mm, which allowed us to determine the combined size distribution of aggregates and mineral grains. For the second subsamples, hereafter termed “dispersed samples”, we sieved oven-dried soil from the same core samples using a 2 mm sieve, mixed the sieved soil with 5% hexametaphosphate, and shook the soil-hexametaphosphate-mix for 24 h on a shaker table to disperse any aggregates in the soil samples prior to the particle size analysis. We assumed that aggregates formed primarily due to the presence of SOM as well as the cohesion between clay-sized particles. The hexametaphosphate weakens these bonds and disperses the aggregates. The “dispersed samples” were used to determine the particle size distribution of the mineral grains only. Particle size analyses with the laser diffraction method yielded the volume density as a percentage of the sample volume for 100 particle size bins from 10−2 µm to 2 mm equivalent particle diameter. The resulting density distributions (Figure 3) allowed the identification of the particle size distributions of the individual mineral grains (Figure 3D,F) as well as the size distributions of the aggregates. The size distributions of the mineral grains were used to classify the soil core samples according to the United States Department of Agriculture (USDA) textural classes. The aggregate size distribution was employed to quantify any differences in soil aggregation between control and burned soil.
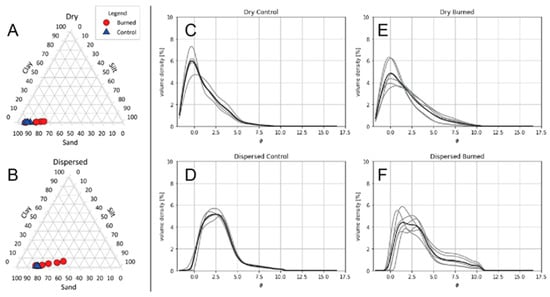
Figure 3.
(A,B) Ternary diagrams show particle size classes for dry (untreated) samples and dispersed (treated) samples. Burned samples show overall increase in silt and decrease in sand-sized particles, while control samples appear tightly clustered. (C–F) Particle size distribution curves for control (C,D) and burned (E,F) samples plotted in terms of phi-based grain size. Top panels (C,E) represent dry (untreated) distributions, and bottom panels (D,F) represent dispersed (treated) samples. Mean values for all samples are shown by solid black lines, and individual samples are plotted as lighter, gray lines. In both dry and dispersed samples, we observe an increase in the variability of grain size distributions and an increase in finer grain sizes.
We determined SOM content using the loss-on-ignition method [26] on subsamples taken from the soil cores after completing hydraulic and thermal characterization. Soil sub-samples were obtained from the soil cores after oven-drying the cores at 105 °C for 16 h and sieving the oven-dry soil with a 2 mm sieve to obtain the fine-earth fraction (particle diameter < 2 mm). We then split aliquots of 1.0 to 3.3 g from the sieved samples, placed them in ceramic crucibles, and heated them in a muffle furnace to 400 °C for 1 h to ensure complete combustion of the soil organic material. SOM was then determined as loss of soil mass due to SOM combustion divided by the total mass of the oven-dry soil sample aliquot.
2.4.5. Soil Hydrophobicity and Apparent Contact Angle
We measured apparent contact angles that sessile water drops form with the underlying solid surface using a contact angle analyzer (model FTA1000, First Ten Angstroms Inc.; Portsmouth, VA, USA), loosely following the method outlined by [27,28]. For sample preparation, air-dry soil samples were sifted using a 500 μm mesh-size sieve. Sifted soil subsamples were mounted on pre-cleaned, blank, glass microscope slides (2.54 cm × 7.62 cm size, AmScope Inc.; Irvine, CA, USA) using double-sided adhesive tape (Scotch and 3M, permanent double-sided tape “Narrow”). These subsamples are hereafter referred to as “soil slides”. Single drops of deionized water (drop volume 8 µL) were dispensed onto the soil slide via a 2.0 μL micrometer syringe (Gilmont Instruments) through a 27-gage syringe needle. Immediately after placing the drop, the liquid-solid contact angle between the sessile water drop and the soil slide surface was measured with the aid of a video microscope. Five replicate drop tests were conducted on each soil slide within 10 min of soil slide preparation. Apparent contact angle measurements were also carried out on ash samples using the same procedure as for soil collected from the burned soil locations. All apparent contact angle measurements were carried out in the laboratory at ambient air temperatures between 23 °C and 24 °C and relative humidity between 15% and 20%.
3. Results
3.1. Particle Size Distributions, Soil Structure, and SOM Content
The USDA particle size classes for the entire sample set range from sand to loamy sand in the fine earth fraction (Figure 3B). The data are also summarized in Table 1. Results from the bulk dry sample analysis (i.e., aggregate distribution measurements) indicate that the samples from the control soil were coarser than the samples from the burned soil. Mean sand- and silt-sized fractions of the bulk dry samples for control soil are 91% and 9%, respectively, while those for the burned samples are 84% and 16%. Similarly, samples from the dispersed sample treatment show a difference in mean sand content from 80% sand in the control population to 69% sand in the burned population, with an associated difference in silt from 19% to 28%. The clay contents show only marginal differences for burned soil samples relative to control soil samples (up to 2%), indicating that the most significant differences are reflected in the sand and silt fraction of the upper 5 cm of the soil profile. Note that the bulk dry samples included both mineral grains as well as aggregates with equivalent diameters <2 mm, whereas the dispersed samples only included mineral grains. In other words, the presence of microaggregates is likely the reason for the coarser “texture” of the bulk dry compared to the dispersed samples (see also SEM images in Figure 4).

Table 1.
Results from physical and hydraulic analysis of control and burned soil samples. Mean and median population values are shown for both populations, and p-values from Student t-tests compare the two populations.
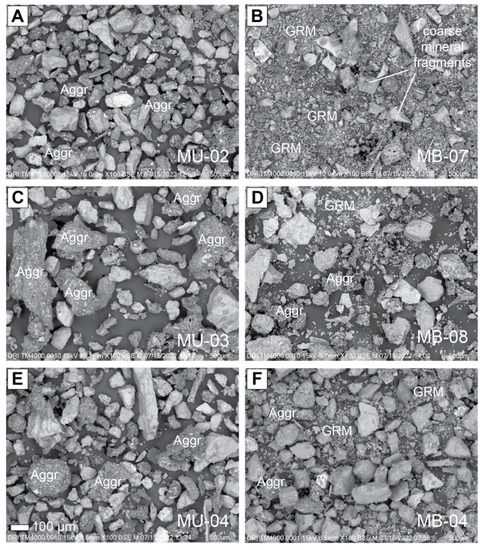
Figure 4.
Scanning electron microscope (SEM) images of control (A,C,E) and burned (B,D,F) soil sifted to a particle range of 50–250 µm equivalent diameter. Aggregates (aggr.) held together by OM are present in all control samples. Degradation of aggregates is indicated by the presence of ground mass (grm) in the images where finer textures are observed, consistent with results from particle size analysis. Aggregate degradation was likely fostered by the decrease in soil organic matter (SOM) due to burning. The highest degree of degradation is shown in panel B and the least is shown in panel F. Variability likely reflects variability in sustained fire temperature throughout the burn.
Particle size distribution plots are shown in Figure 3C–F and illustrate more subtle differences between the control and burned samples for both dispersed and bulk dry treatments. Volume percentages are plotted in terms of midpoint grain sizes for 38 bins ranging from 0 to 4 mm (17.5 to −2 phi). In general, the burned samples are finer textured than the control samples for both the dispersed and dry bulk samples, as indicated by greater proportions of particles in the 5 to 10 phi (30 µm to 1 µm) sizes. In addition to relatively finer textures, the burned samples show greater variability in texture compared with the control samples, especially in the coarse range.
Figure 4 shows SEM images of the three control soil samples, MU-02, MU-03, and MU-04 (Figure 4, left column), and the three burned soil samples, MB-07, MB-08, and MB-04 (Figure 4, right column). Aggregates of varying sizes from roughly 50 to 250 µm equivalent diameter were found in the SEM images from the control soil samples that we infer to be mineral particles held together by SOM. We did not analyze the elemental compositions of the aggregates to estimate total C because of expected elemental interference by the underlying sample mounts. However, we note that the aggregates did return elevated C contents where the compositions were evaluated during image analysis. Most of the mineral particles visible in the aggregates of the control soil samples (Figure 4, left column) were finer than 50 µm (i.e., belonging to the silt and clay fraction of the mineral soil). We found comparatively fewer intact aggregates in the burned soil samples. Disaggregated fine mineral fragments were also more common in the burned compared to the control soil samples. These fine mineral soil fragments indicated as “ground mass” in Figure 4 are more prevalent in MB-07 than in MB-04 or MB-08 and are mostly smaller than 50 µm in diameter. Note that none of the images of the control soil samples (Figure 4, left column) showed similar fine mineral soil fragments as found in the burned soil sample (Figure 4, left column).
SOM contents, shown in Table 1, reflect the depth-averaged SOM from the fine earth fraction of the upper 5 cm of the land surface. We found mean SOM contents of 11.9% and 6.3% for the control and burned sample populations, respectively. These results indicate a statistically significant difference in SOM by a factor of ~2.
3.2. Soil Hydraulic Properties
Saturated hydraulic conductivity (Ks) values among all samples vary by as much as two orders of magnitude. Figure 5A shows the distributions of mean Ks values obtained from ten replicate measurements per sample. Control samples have a median value of 1108 cm/d (1.28 × 10⁻⁴ m/s) over the range of 653 to 5047 cm/d (7.56 × 10⁻⁵ to 5.84 × 10⁻⁴ m/s). The median Ks value for burned samples is 514 cm/d, although the range of measured values is greater, from 111 to 10,781 cm/d (1.28 × 10⁻⁵ to 1.25 × 10³ m/s). Despite the apparent difference in saturated hydraulic conductivity between the control and burned soil samples, the Ks values of the sample set show no significant differences (p-value of 0.418; Table 1).
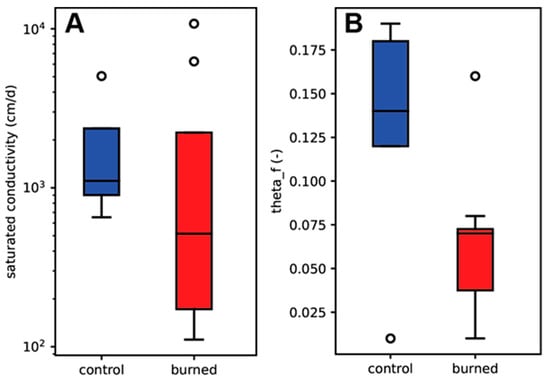
Figure 5.
Boxplots (A) show the distributions of saturated hydraulic conductivity for core samples from control and burned soils. Black lines represent median values, the upper and lower limits of boxes represent 75th and 25th quartiles, respectively, whiskers show maximum/minimum values, and open circles are outliers. Control samples have a narrower distribution and higher median value than burned samples, which exhibit Ks values spanning three orders of magnitude. Boxplots (B) show distributions of input parameters for thermal conductivity functions. Both m and θf are statistically lower for burned samples relative to control samples.
Van Genuchten parameters α, n, , and [22] for the corresponding SWR functions determined from the HYPROP and WP4C measurements are summarized in Table 1. Respective median values for control soil samples are α = 0.0624, n = 1.589, = 0, and = 0.481, whereas median values for burned samples are α = 0.0560, n = 1.613, = 0.004, and = 0.440. The Student t-test comparisons of each van Genuchten parameter for control and burned soil indicate no statistically significant difference between the respective parameters of the control and burned soil samples (Table 1).
Figure 6A shows hydraulic conductivity functions, K(θ), and Figure 6B SWR functions for individual control and burned soil specimen, respectively, using the Ks and van Genuchten parameters α, n, , and presented in Table 1. K(θ) and SWR functions were calculated using the K(θ) and SWR equations by van Genuchten [22]. As expected, the hydraulic conductivity functions vary considerably for the individual core samples, considering the variance of the Ks values shown in Table 1. Hydraulic conductivity functions of individual core samples varied more for burned soil than for the control soil. The median hydraulic conductivity functions for control and burned soil, however, are surprisingly similar. The SWR functions of the control and burned core samples varied considerably as well, whereas the difference between the median SWR functions of the control and burned core samples was small. The difference between the median SWR functions of the control and the burned soil was most pronounced at the “wet end” of the function between water saturation and air entry value (Figure 6B), likely because of the slightly lower median saturated water content found for the burned compared to the control soil. This difference in the “wet end” of the median SWR curves could theoretically be an indicator of soil structure alteration due to fire. Considering the large variance of the SWR functions for individual core samples, however, the difference in the “wet end” of the median SWR functions is likely the result of averaging the individual SWR curves and not actual differences in the structure of the burned compared to the control soil.
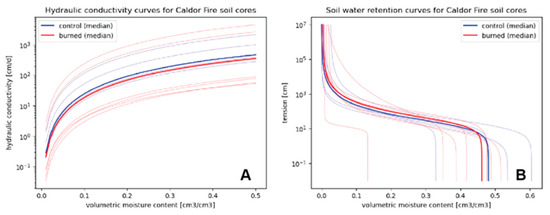
Figure 6.
(A) hydraulic conductivity functions of control and burned soil samples from measured data (faint lines) and median values (bold lines). Hydraulic conductivity curves are highly variable for burned core samples and more clustered for control core samples. (B) soil water retention functions of control and burned soil samples from measured data (faint lines) and median values (bold lines). Only minor differences in SWC are found between burned and control samples, and only at the “wet end” of the median SWC curves.
3.3. Soil Thermal Properties
The results from parameter estimation techniques used to estimate TCFs are shown in Table 1 and in Figure 5B. Median values for parameters and are 2.15 and 0.14, respectively, for control samples and 1.92 and 0.07 for burned samples. While is not significantly different for control and burned soil samples (p = 0.423), our results indicate that differences in are significant (Table 1). In addition, evaluation of the saturated thermal conductivity for these sample sets indicates significantly different values of (p = 0.031), with median values of 0.912 and 0.935 W/m2/K for control soil samples compared with burned soil samples.
3.4. Soil Hydrophobicity
Figure 7A shows WDPT values for control and burned soils. The arithmetic mean and standard deviation of the WDPT are 166 ± 93 s for control soil (N = 7) and 750 ± 241s (N = 7) for the burned soil. In other words, the mean WDPT of the burned soil was approximately 4.5 times higher than the arithmetic mean of the control soil with a p-value < 0.0001, indicating a significant difference between the mean WDPT of control and burned soil. Note that four samples from the burned soil site exceeded the maximum WDPT measurement time of 900 s, and we used this maximum value in our mean and standard deviation calculations. Thus, if we ran the WDPT test longer than 900 s for these cases, the difference in WDPT between control and burned soils would likely have been even more pronounced. Notably, WDPT measurements on ash materials at the burned site yielded WDPT values of <1 s for all seven tests carried out in this study, as expected and observed in previous studies [29,30].
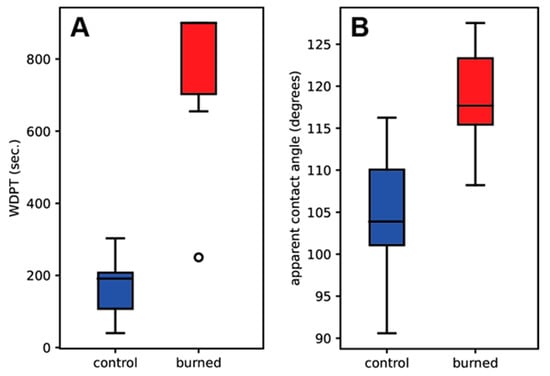
Figure 7.
Water drop penetration time (WDPT) measurements taken in the field on 21 October 2021. Panel (A) shows mean values, IQR ranges, and standard deviations for 7 control and 7 burned soil samples, with outliers represented as pink stars. WDPT ranges for control samples are up to a factor of four less than WDPT ranges for burned samples. Note that the upper limit of WDPT values for burned samples reflects the maximum duration of field tests (900 s). Panel (B) shows similar statistical distributions of apparent contact angles measured in the lab for 15 control and 15 burned soil samples. Mean apparent contact angle values are ~10–20% higher for burned relative to control soil samples.
Figure 7B shows apparent contact angle values for control and burned soil samples. The average apparent contact angle of the burned soil (arithmetic mean and standard deviation of 118.5 ± 5.8°, N = 15) is significantly higher (p-value < 0.0001) than the average contact angle of the control soil (arithmetic mean and standard deviation of 104.6 ± 7.4°, N = 15). It is worth noting that the mean apparent contact angles of the control soil samples are greater than 90°, indicating that the soil was also hydrophobic under background (i.e., unburned) conditions. All ash samples (N = 5), however, yielded apparent contact angles below the detection limit of the contact angle analyzer (apparent contact angle <10°), indicating that the ash found at the burned sites was hydrophilic.
4. Discussion
4.1. Apparent Modifications Soil Physical Properties
The results from field and laboratory tests demonstrate variable degrees of apparent modifications to soil properties, presumably resulting from the fire. Although our sampling protocols only allow an analysis of space-for-time differences between background (i.e., unburned or control) soil conditions and nearby burned conditions, we nevertheless examined our results in terms of apparent fire-induced modifications.
The SEM images in Figure 4 provided clear evidence for the deterioration of soil microaggregates. These observations are consistent with observed differences in overall SOM content between controlled and burned samples. We hypothesize that, in addition to fining from the potential incorporation of ash (which we did not readily observe), the destabilization of soil aggregates, initially formed by the presence of SOM, likely plays a role in the fire-induced modification of soil structure. As the fire temperature increases to the point of SOM alteration, and eventually, SOM combustion (i.e., at soil temperatures >200 °C; [2,3,6,31]), the combustion of SOM that binds particles into coarser aggregates principally causes a change in soil structure [7] in the upper few cm of the mineral soil. Albalasmeh et al. [5] and Jian et al. [7] showed that microaggregates might deteriorate at temperatures as low as 100 °C due to water vapor formation within the aggregates. Several studies have shown differences in soil texture after a fire, although their interpretations are less straightforward. Two contrasting examples include Woods and Balfour [32], who observed post-fire fining of soil textures, and Ketterings et al. [33], who reported overall coarser textures of burned soil. The findings by Ketterings et al. [33] were determined from fine-textured, clay-rich soils (>50% clay and <5% sand). While they did not elaborate on these findings in detail, their data suggest that an overall increase in the sand-sized fraction is likely related to observed chemical transformations of clay minerals during intense heating. Conversely, Woods and Balfour [32] indicated the addition of ash as a mechanism for reducing overall grain size in sandy loam and gravelly silt loam soils that they studied. The results from our dataset demonstrate modest differences in the relative amounts of silt and clay-sized particles when comparing burned and control samples and are similar to the fining trend observed by Woods and Balfour [32]. While we acknowledge that the overall fining of mineral soil textures may occur due to the physical breakdown of mineral grains during intense heating, we document the combustion of SOM and subsequent aggregate deterioration as a principal driver for the apparent reduction in soil texture in burned soils.
Despite the relatively pronounced differences in soil texture and aggregate size distributions, we find only minimal differences in the median soil water retention and hydraulic conductivity functions for burned compared to control (unburned) soils. It is commonly shown that the field-saturated hydraulic conductivity (Kfs) of soil can be greatly reduced after a fire, with a high potential for recovery within a span of 5 years [34]. Numerous studies have attempted to constrain the hydraulic properties of fire-affected soils, including controlled laboratory measurements [35,36] and field measurements [37,38,39] of saturated or field-saturated hydraulic conductivity. Much of the findings in these studies indicate either a reduction in saturated conductivity despite the complex infiltration dynamics associated with fire-affected soils [40] or the minimal change associated with thresholds in burn severity. Although our pilot study demonstrates slightly lower median Ks values for burned compared to control soils, the stronger trend we observe is towards an apparently increased variability in Ks (Figure 5A and Figure 7A). When we examine the differences in hydraulic conductivity curves between control and burned samples (Figure 6), we observe a slight difference in hydraulic conductivity over the range of soil moisture contents from median parameter values. However, the sample-to-sample variations that we observe are not systematic and may instead arise from the natural variability of pre-burned soil conditions as well as variability in burn patterns of the fire itself. Similarly, the SWR functions of fire-affected soils appear to indicate differences in available pore space (Figure 7B), possibly related to a reduction in SOM. However, there is no significant difference between the soil moisture contents in burned and control samples at tensions greater than 10 cm. These relationships are intriguing to us and demonstrate the need for continued exploration of the impacts of fire on soil hydraulic properties, especially in light of spatial variation of soil properties, which may be of similar magnitude as expected due to changes after a fire.
In contrast to the inferred minimal effects on SWR, Ks, and K(θ), we observed significant differences in the thermal conductivity functions (i.e., the relationship between thermal conductivity, λ, and volumetric water content, θ) between burned and control samples (Figure 8). Previous attempts have been made to examine fire effects on thermal properties in prescribed burns and laboratory settings (e.g., [41,42]); however, we believe the findings from this study to be some of the first indicating potential fire-induced modifications to soil thermal properties resulting from a natural fire. Our findings, therefore, have potentially important implications for soil temperature evolution during fires and for considering the impacts of fires on regions, such as polar areas, that are highly sensitive to climate change (e.g., [43]). Our results suggest that burning the near-surface soil environment results in an increase in thermal conductivity by >40% at volumetric water contents below 0.20 cm3/cm3. This condition that is likely satisfied during the majority of the year for these sandy soils in the high desert environment.
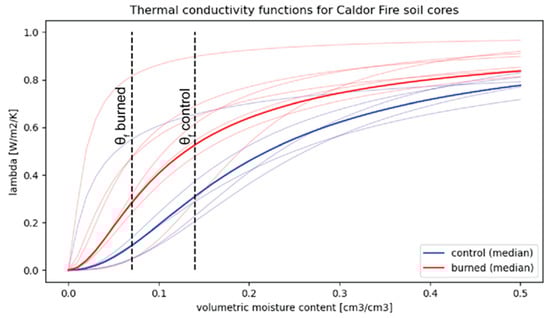
Figure 8.
Thermal conductivity functions for control (blue) and burned (red) samples. The bold lines represent thermal conductivity functions that use median values for input parameters derived from the sample set shown by faint lines. Vertical dashed lines indicate median values of θf, indicating an overall decrease in burned samples. Thermal conductivity values at saturation levels of 5–25% indicate higher values of thermal conductivity in burned samples relative to the control.
Given the discussion thus far, it is important to consider several facts about our results for understanding the effects of burning on the soil environment in more general terms. First and most importantly, soil variability likely accounts for a considerable proportion of the variations in our datasets. However, this topic has not been studied in detail for the present project. As mentioned previously, we do see systematic differences among each of the soil physical properties investigated here that are consistent with expected fire-induced changes. Not surprisingly, the most significant of these changes correlate with an apparent reduction in SOM due to burning. Indeed, our particle and aggregate size analyses and SEM images provide strong evidence for differences in soil texture as well as meso- and micro-structure (Figure 3 and Figure 4). These observations are consistent with findings from other studies that cite soil structure alterations as playing a major role in fire-induced soil modification [7]. Surprisingly, we noted these differences in sandy soil with only weakly developed soil structure. We expect to find even greater differences in terms of soil aggregation and, hence, aggregate stability for soils with better-developed structures or in soils of finer texture. As such, and in addition to studying pre- and post-fire soil conditions from the same soils, future studies should focus on fire effects using soils that span a variety of parent material textures, mineral compositions (i.e., lithosequences), and soil structures to explore the effects of fire on grain size, mineralogy, and soil structure. One interesting observation is the fact that our particle size analysis showed differences that are suggestive of fire-induced aggregate destabilization, while other studies show coarsening of overall soil texture, likely related to the clay-rich textures of the soils they studied [33]. This observation presents a potential complex response to combustion that likely impacts the hydraulic and thermal properties of soils in very different ways, so it is important to evaluate the nature of these potential changes on a variety of soil types in different geomorphic and climatic environments.
4.2. Fire, Soil Water Repellency, and Their Effects on Infiltration and Runoff
Our WDPT and contact angle analyses clearly show a significant difference in soil water repellency for burned compared to control soils, despite high background levels of water repellency for the control (unburned) soil. Our results suggest fire effects, especially when considering the presence of a strongly hydrophobic soil layer at about 4 cm depth at the burned site (Figure 9B) that was not present at the control site. The hydrophobic soil conditions also present at the control site are not surprising given that surface soils under conifer forests typically have higher degrees of inherent soil water repellency, especially during dry conditions, likely caused by the presence of hydrophobic organic compounds washed out of the conifer litter [21,44,45].
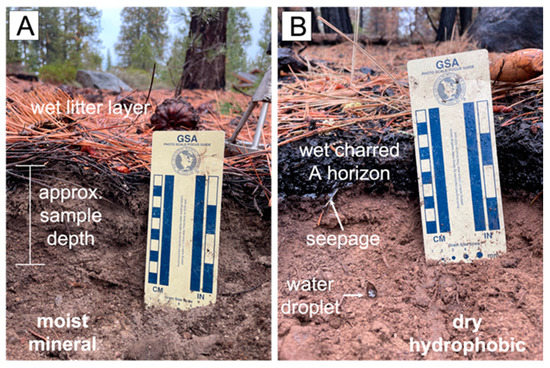
Figure 9.
Images showing examples of control (A) and burned (B) sample locations taken on the same day during sampling. The soil at the control site was moist in the sampling interval from a small rain event that occurred after fire containment. Note the thin layer of charred and dead pine needles at the soil surface that indicates very low but detectable fire impacts in the area. The burned soil contains a very thin layer of uncharred needles that fell after trees in the vicinity were burned. Moreover, note the ~4 cm thick zone of charred A-horizon that has been moistened from the rain event. Below this zone, the mineral soil layer is dry and hydrophobic, with an observable plane of water seepage occurring at the interface. Small roots and apparent granular soil structure are present below this interface, likely indicating minimal fire effects at this depth.
Our WDPT results (~4.5 times higher WDPT for burned compared to control soil) agree well with previous laboratory- and field-based studies where water repellency of the burned soil was more pronounced after a fire compared to the unburned soil [11,46,47,48,49]. For example, Carrà et al. [46] observed changes to soil water repellency for soils in pine and oak forests of Southern Italy from slightly water repellent (5 < WDPT (s) < 60) to severely water repellent (600 < WDPT (s) < 3600) after exposure to prescribed burning while also observing no change in soils in a chestnut forest. Granged et al. [50] also reported an increase in WDPT, as well as in runoff rates, for post-fire soils under pines of southwest Spain, despite the initially high pre-fire water repellent conditions there. Despite its widespread occurrence, surprisingly, little is known about the geochemistry of fire-induced soil hydrophobicity (FISH) or the processes that lead to FISH. Debano and Krammes [31] reported that FISH largely depends on the heat level and the presence of organic substances that coat mineral soil particles. They found extreme water repellency of soils containing hydrophobic organics when the fire temperature is between 175 °C and 205 °C. They also showed that water repellency is destroyed when the temperature exceeds 280–290 °C [8,9]. Therefore, we assume that the top layer of the soil with the highest water repellency values did not experience temperatures above 280–290 °C, consistent with low-to-moderate burn severity in the study area. Additionally, the combustion products of conifer tissues (i.e., resins and wax) and the presence of other hydrophobic compounds in the combustion smoke likely contribute to the water repellency we observed in our study, even though the soils already had high background levels of water repellency noted at the control sites.
4.3. Implications and Directions for Future Research
Our study highlights several key aspects of anticipated fire-induced modifications to soil properties that have implications for a variety of research topics related to wildland fires and the associated management of those lands.
First, our observations of only limited effects of fire on soil structure [quantified as SWR, Ks, and K(θ)] but significant effects of fire on soil water repellency (quantified as WDPT and apparent contact angle) reject the notion that all soils undergo the same physical changes in response to wildfire activity. This is somewhat expected given the relative lack of macrostructure in the predominantly sandy soils studied here, as well as the well-known sensitivity of SWR, Ks, and K(θ) to spatial variability of soil properties and soil burn severity, even over relatively small spatial scales. The significant increase in fire-induced soil water repellency motivates further work on the causes and mechanisms leading to FISH and how FISH changes soil hydraulic properties that lead to decreasing infiltration and increasing runoff [51]. After all, the presence of FISH will affect the infiltration of rainfall into and percolation through the soil profile (e.g., see Figure 9B) and is, therefore, a factor that should be investigated further to enable fundamental research into the study of landscape responses to wildfire (i.e., debris flow and overall sediment redistribution).
Second, the profound differences that we observed in relation to soil thermal properties may be important for future ecological studies. The upper 10 cm of soil acts as a seed bank in many forested environments globally [52,53,54]. The upper few cm of this zone is also the most likely region to be affected by intense heating during a fire (e.g., [55,56]). As such, the knowledge gained by understanding the extent to which fires may disturb this zone due to heat transfer is critical for understanding the recovery times and expected ecological diversity associated with fire-affected areas, including prescribed burns [57,58]. Therefore, a more thorough understanding of the relationships between fire severity, the efficiency of heat transport before and after a fire for a given soil type, and the seed bank compositions may further inform the extent to which specific landscapes may recover after a fire.
Finally, the thermal evolution during fires for soil in sensitive environments is likely a critical area of needed research. For example, in high-latitude regions where freeze-thaw cycles are important for ecosystem health and where organic-rich soils are common, combustion of SOM not only contributes to carbon emissions and reduces the inventory of long-term organic carbon [59] but may also alter the thermal conditions of the soil environment as to reduce the insulating effects of the SOM from strong seasonal atmospheric fluctuations. As a result, we hypothesize that positive feedback may occur wherein the burning of these soils will increase the soil’s thermal conductivity, thereby increasing the effective rate of thawing frozen soils and exposing greater land surface areas to future burns. Although we have not explored this possibility in detail, further examination of the thermal evolution of fire-affected soils is prudent to investigate the extent to which the trends observed here are present in other environmental settings.
5. Conclusions
We conclude in this study that measured differences in soil physical properties between a site burned by the 2021 Caldor Fire, and a nearby control site are consistent with expected changes due to burning. Specifically, we found significant differences between SOM, water repellency, and thermal properties of the control (unburned) and burned soil but little to no differences between soil water retention and hydraulic conductivity of control (unburned) and burned soil. Furthermore, soil particle and aggregate size distribution of control (unburned) and burned soil were found to be different. Our findings prompt the need for more systematic studies involving a wider range of soil properties and landscape settings to gain a more holistic understanding of how fire-induced soil modifications may relate to soil burn severity. The results from our study further document the complex nature of the soil environment, especially in response to dynamic perturbations such as fire, and highlight the need for additional investigation into the causes and processes associated with fire-induced soil hydrophobicity to improve our ability to rapidly determine potential problem areas in terms of hazards commonly associated with fire-affected soils.
Author Contributions
Conceptualization, B.S., V.S. and M.B.; methodology, B.S., V.S. and M.B.; formal analysis, B.S., V.S. and M.B.; writing—original draft preparation, B.S. and V.S.; writing—review and editing, M.B., C.B., J.B. and S.H.; visualization, B.S.; funding acquisition, B.S., V.S. and M.B. All authors have read and agreed to the published version of the manuscript.
Funding
This material is based upon work supported by the National Science Foundation under Grant No EAR2154013. This material is also based upon work supported in part by the National Science Foundation under Grant No. OIA-2148788 and by the US Army Corps of Engineers under Grant No. W912HZ1920011. The APC was funded by the Division of Earth and Ecosystem Sciences at DRI.
Acknowledgments
The authors thank students Palina Bahdanovich and Kevin Axelrod and DRI student employee Shelby Inouye for assistance with soil sample preparation and laboratory measurements. The authors also thank three anonymous reviewers for their helpful comments that improved the quality of the manuscript.
Conflicts of Interest
The authors declare no conflict of interest.
References
- Khorshidi, M.S.; Dennison, P.E.; Nikoo, M.R.; AghaKouchak, A.; Luce, C.H.; Sadegh, M. Increasing concurrence of wildfire drivers tripled megafire critical danger days in Southern California between1982 and 2018. Environ. Res. Lett. 2020, 15, 104002. [Google Scholar] [CrossRef]
- DeBano, L.F. The role of fire and soil heating on water repellency in wildland environments: A review. J. Hydrol. 2000, 231, 195–206. [Google Scholar] [CrossRef]
- DeBano, L.F.; Neary, D.G.; Ffolliott, P.F. Fire Effects on Ecosystems; John Wiley & Sons: New York, NY, USA, 1998. [Google Scholar]
- Neary, D.G.; Ryan, K.C.; DeBano, L.F. Wildland Fire in Ecosystems: Effects of Fire on Soils and Water; General Technical Report RMRS-GTR-42-vol. 4; US Department of Agriculture, Forest Service, Rocky Mountain Research Station: Ogden, UT, USA, 2005; Volume 42, 250p.
- Albalasmeh, A.A.; Berli, M.; Shafer, D.S.; Ghezzehei, T.A. Degradation of moist soil aggregates by rapid temperature rise under low intensity fire. Plant Soil 2013, 362, 335–344. [Google Scholar] [CrossRef]
- García-Corona, R.; Benito, E.; De Blas, E.; Varela, M. Effects of heating on some soil physical properties related to its hydrological behaviour in two north-western Spanish soils. Int. J. Wildland Fire 2004, 13, 195–199. [Google Scholar] [CrossRef]
- Jian, M.; Berli, M.; Ghezzehei, T. Soil structural degradation during low-severity burns. Geophys. Res. Lett. 2018, 45, 5553–5561. [Google Scholar] [CrossRef]
- DeBano, L.; Savage, S.; Hamilton, D. The transfer of heat and hydrophobic substances during burning. Soil Sci. Soc. Am. J. 1976, 40, 779–782. [Google Scholar] [CrossRef]
- Savage, S. Mechanism of fire-induced water repellency in soil. Soil Sci. Soc. Am. J. 1974, 38, 652–657. [Google Scholar] [CrossRef]
- Savage, S.; Osborn, J.; Letey, J.; Heaton, C. Substances contributing to fire-induced water repellency in soils. Soil Sci. Soc. Am. J. 1972, 36, 674–678. [Google Scholar] [CrossRef]
- Samburova, V.; Shillito, R.M.; Berli, M.; Khlystov, A.Y.; Moosmüller, H. Effect of Biomass-Burning Emissions on Soil Water Repellency: A Pilot Laboratory Study. Fire 2021, 4, 24. [Google Scholar] [CrossRef]
- Doerr, S.H.; Shakesby, R.A.; MacDonald, L.H. Soil water repellency: A key factor in post-fire erosion. In Fire Effects on Soils and Restoration Strategies; CRC Press: Enfield, NH, USA, 2009; pp. 213–240. [Google Scholar]
- Larsen, I.J.; MacDonald, L.H.; Brown, E.; Rough, D.; Welsh, M.J.; Pietraszek, J.H.; Libohova, Z.; de Dios Benavides-Solorio, J.; Schaffrath, K. Causes of post-fire runoff and erosion: Water repellency, cover, or soil sealing? Soil Sci. Soc. Am. J. 2009, 73, 1393–1407. [Google Scholar] [CrossRef]
- Massman, W. Modeling soil heating and moisture transport under extreme conditions: Forest fires and slash pile burns. Water Resour. Res. 2012, 48, 10548. [Google Scholar] [CrossRef]
- Cannon, S.H.; Gartner, J.E.; Rupert, M.G.; Michael, J.A.; Rea, A.H.; Parrett, C. Predicting the probability and volume of postwildfire debris flows in the intermountain western United States. Bulletin 2010, 122, 127–144. [Google Scholar] [CrossRef]
- Meyer, G.A.; Wells, S.G. Fire-related sedimentation events on alluvial fans, Yellowstone National Park, USA. J. Sediment. Res. 1997, 67, 776–791. [Google Scholar]
- USDA. USDA Forest Service. Caldor Post-Fire BAER Assessment Report. Available online: https://inciweb.nwcg.gov/incident/7842/ (accessed on 12 April 2022).
- Conservation Biology Institute. California Fire Perimeters (1898–2020). Available online: https://databasin.org/datasets/bf8db57ee6e0420c8ecce3c6395aceeb/ (accessed on 18 November 2022).
- Ellsworth, T.; Stamer, M. 2021 Caldor Fire Burned Area Emergency Response (BAER) Assessment Report Summary; USDA Forest Service: Washington, DC, USA, 2021; p. 16.
- Letey, J. Measurement of contact angle, water drop penetration time, and critical surface tension. In Proceedings of the Symposium on Water-Repellent Soils, University of California, Riverside, CA, USA, 6–10 May 1968; pp. 43–47. [Google Scholar]
- Doerr, S.H. On standardizing the ‘water drop penetration time’and the ‘molarity of an ethanol droplet’techniques to classify soil hydrophobicity: A case study using medium textured soils. Earth Surf. Process. Landf. J. Br. Geomorphol. Group 1998, 23, 663–668. [Google Scholar] [CrossRef]
- van Genuchten, M.T. A closed-form equation for predicting the hydraulic conductivity of unsaturated soils. Soil Sci. Soc. Am. J. 1980, 44, 892–898. [Google Scholar] [CrossRef]
- Thomson, W. On the equilibrium of vapour at a curved surface of liquid. Proc. R. Soc. Edinb. 1872, 7, 63–68. [Google Scholar] [CrossRef]
- Abramowitz, M.; Stegun, I.A. Handbook of Mathematical Functions with Formulas, Graphs, and Mathematical Tables; National Bureau of Standards Applied Mathematics Series 55, Tenth Printing; US Government Printing Office: Washington, DC, USA, 1972.
- Lu, N.; Dong, Y. Closed-Form Equation for Thermal Conductivity of Unsaturated Soils at Room Temperature. J. Geotech. Geoenvironmental Eng. 2015, 141, 04015016. [Google Scholar] [CrossRef]
- Storer, D.A. A simple high sample volume ashing procedure for determination of soil organic matter. Commun. Soil Sci. Plant Anal. 1984, 15, 759–772. [Google Scholar] [CrossRef]
- Bachmann, J.; Horton, R.; Van Der Ploeg, R.; Woche, S. Modified sessile drop method for assessing initial soil–water contact angle of sandy soil. Soil Sci. Soc. Am. J. 2000, 64, 564–567. [Google Scholar] [CrossRef]
- Bachmann, J.; Woche, S.; Goebel, M.O.; Kirkham, M.; Horton, R. Extended methodology for determining wetting properties of porous media. Water Resour. Res. 2003, 39, 12. [Google Scholar] [CrossRef]
- Cerdà, A.; Doerr, S.H. The effect of ash and needle cover on surface runoff and erosion in the immediate post-fire period. Catena 2008, 74, 256–263. [Google Scholar] [CrossRef]
- Dlapa, P.; Bodí, M.B.; Mataix-Solera, J.; Cerdà, A.; Doerr, S.H. FT-IR spectroscopy reveals that ash water repellency is highly dependent on ash chemical composition. Catena 2013, 108, 35–43. [Google Scholar] [CrossRef]
- Debano, L.F.; Krammes, J. Water repellent soils and their relation to wildfire temperatures. Hydrol. Sci. J. 1966, 11, 14–19. [Google Scholar] [CrossRef]
- Woods, S.W.; Balfour, V.N. The effects of soil texture and ash thickness on the post-fire hydrological response from ash-covered soils. J. Hydrol. 2010, 393, 274–286. [Google Scholar] [CrossRef]
- Ketterings, Q.M.; Bigham, J.M.; Laperche, V. Changes in soil mineralogy and texture caused by slash-and-burn fires in Sumatra, Indonesia. Soil Sci. Soc. Am. J. 2000, 64, 1108–1117. [Google Scholar] [CrossRef]
- Ebel, B.A.; Martin, D.A. Meta-analysis of field-saturated hydraulic conductivity recovery following wildland fire: Applications for hydrologic model parameterization and resilience assessment. Hydrol. Process. 2017, 31, 3682–3696. [Google Scholar] [CrossRef]
- Moody, J.A.; Ebel, B.A.; Nyman, P.; Martin, D.A.; Stoof, C.; McKinley, R. Relations between soil hydraulic properties and burn severity. Int. J. Wildland Fire 2015, 25, 279–293. [Google Scholar] [CrossRef]
- Moody, J.A.; Kinner, D.A.; Úbeda, X. Linking hydraulic properties of fire-affected soils to infiltration and water repellency. J. Hydrol. 2009, 379, 291–303. [Google Scholar] [CrossRef]
- Ebel, B.A.; Romero, O.C.; Martin, D.A. Thresholds and relations for soil-hydraulic and soil-physical properties as a function of burn severity 4 years after the 2011 Las Conchas Fire, New Mexico, USA. Hydrol. Process. 2018, 32, 2263–2278. [Google Scholar] [CrossRef]
- Robichaud, P.R. Fire effects on infiltration rates after prescribed fire in Northern Rocky Mountain forests, USA. J. Hydrol. 2000, 231, 220–229. [Google Scholar] [CrossRef]
- Valzano, F.; Greene, R.; Murphy, B. Direct effects of stubble burning on soil hydraulic and physical properties in a direct drill tillage system. Soil Tillage Res. 1997, 42, 209–219. [Google Scholar] [CrossRef]
- Ebel, B.A.; Moody, J.A. Rethinking infiltration in wildfire-affected soils. Hydrol. Process. 2013, 27, 1510–1514. [Google Scholar] [CrossRef]
- Massman, W.; Frank, J.; Reisch, N. Long-term impacts of prescribed burns on soil thermal conductivity and soil heating at a Colorado Rocky Mountain site: A data/model fusion study. Int. J. Wildland Fire 2008, 17, 131–146. [Google Scholar] [CrossRef]
- Smits, K.M.; Kirby, E.; Massman, W.J.; Baggett, L.S. Experimental and modeling study of forest fire effect on soil thermal conductivity. Pedosphere 2016, 26, 462–473. [Google Scholar] [CrossRef]
- Jiang, Y.; Rocha, A.V.; O’Donnell, J.A.; Drysdale, J.A.; Rastetter, E.B.; Shaver, G.R.; Zhuang, Q. Contrasting soil thermal responses to fire in Alaskan tundra and boreal forest. J. Geophys. Res. Earth Surf. 2015, 120, 363–378. [Google Scholar] [CrossRef]
- Hewelke, E.; Oktaba, L.; Gozdowski, D.; Kondras, M.; Olejniczak, I.; Górska, E.B. Intensity and persistence of soil water repellency in pine forest soil in a temperate continental climate under drought conditions. Water 2018, 10, 1121. [Google Scholar] [CrossRef]
- Rodríguez-Alleres, M.; Benito, E.; de Blas, E. Extent and persistence of water repellency in north-western Spanish soils. Hydrol. Process. Int. J. 2007, 21, 2291–2299. [Google Scholar] [CrossRef]
- Carrà, B.G.; Bombino, G.; Denisi, P.; Plaza-Àlvarez, P.A.; Lucas-Borja, M.E.; Zema, D.A. Water infiltration after prescribed fire and soil mulching with fern in mediterranean forests. Hydrology 2021, 8, 95. [Google Scholar] [CrossRef]
- Letey, J. Causes and consequences of fire-induced soil water repellency. Hydrol. Process. 2001, 15, 2867–2875. [Google Scholar] [CrossRef]
- Lewis, S.A.; Wu, J.Q.; Robichaud, P.R. Assessing burn severity and comparing soil water repellency, Hayman Fire, Colorado. Hydrol. Process. Int. J. 2006, 20, 1–16. [Google Scholar] [CrossRef]
- Stoof, C.R.; Moore, D.; Ritsema, C.J.; Dekker, L.W. Natural and fire-induced soil water repellency in a Portuguese shrubland. Soil Sci. Soc. Am. J. 2011, 75, 2283–2295. [Google Scholar] [CrossRef]
- Granged, A.J.; Jordán, A.; Zavala, L.M.; Bárcenas, G. Fire-induced changes in soil water repellency increased fingered flow and runoff rates following the 2004 Huelva wildfire. Hydrol. Process. 2011, 25, 1614–1629. [Google Scholar] [CrossRef]
- Shillito, R.M.; Berli, M.; Ghezzehei, T.A. Quantifying the effect of subcritical water repellency on sorptivity: A physically based model. Water Resour. Res. 2020, 56, e2020WR027942. [Google Scholar] [CrossRef]
- Fenner, M. Ecology of seed banks. In Seed Development and Germination; Routledge: Milton Park, UK, 2017; pp. 507–528. [Google Scholar]
- Roberts, H. Seed banks in soils. Adv. Appl. Biol. 1981, 6, 1–55. [Google Scholar]
- Tiebel, K.; Huth, F.; Wagner, S. Soil seed banks of pioneer tree species in European temperate forests: A review. Iforest-Biogeosciences For. 2018, 11, 48. [Google Scholar] [CrossRef]
- Bao, T.; Liu, S.; Qin, Y.; Liu, Z.L. 3D modeling of coupled soil heat and moisture transport beneath a surface fire. Int. J. Heat Mass Transf. 2020, 149, 119163. [Google Scholar] [CrossRef]
- Valette, J.-C.; Gomendy, V.; Maréchal, J.; Houssard, C.; Gillon, D. Heat-transfer in the soil during very low-intensity experimental fires-the role of duff and soil-moisture content. Int. J. Wildland Fire 1994, 4, 225–237. [Google Scholar] [CrossRef]
- Auld, T.D.; Denham, A.J. How much seed remains in the soil after a fire? Plant Ecol. 2006, 187, 15–24. [Google Scholar] [CrossRef]
- Choczynska, J.; Johnson, E.A. A soil heat and water transfer model to predict belowground grass rhizome bud death in a grass fire. J. Veg. Sci. 2009, 20, 277–287. [Google Scholar] [CrossRef]
- Johnson, D.W. Effects of forest management on soil carbon storage. In Natural Sinks of CO2; Springer: Dordrecht, The Netherlands, 1992; pp. 83–120. [Google Scholar]
Disclaimer/Publisher’s Note: The statements, opinions and data contained in all publications are solely those of the individual author(s) and contributor(s) and not of MDPI and/or the editor(s). MDPI and/or the editor(s) disclaim responsibility for any injury to people or property resulting from any ideas, methods, instructions or products referred to in the content. |
© 2023 by the authors. Licensee MDPI, Basel, Switzerland. This article is an open access article distributed under the terms and conditions of the Creative Commons Attribution (CC BY) license (https://creativecommons.org/licenses/by/4.0/).