
Recent Trends in Fire Regimes and Associated Territorial Features in a Fire-Prone Mediterranean Region


 ,
,  , , ,
, , ,  , ,
, ,  and
and
Abstract
:1. Introduction
2. Materials and Methods
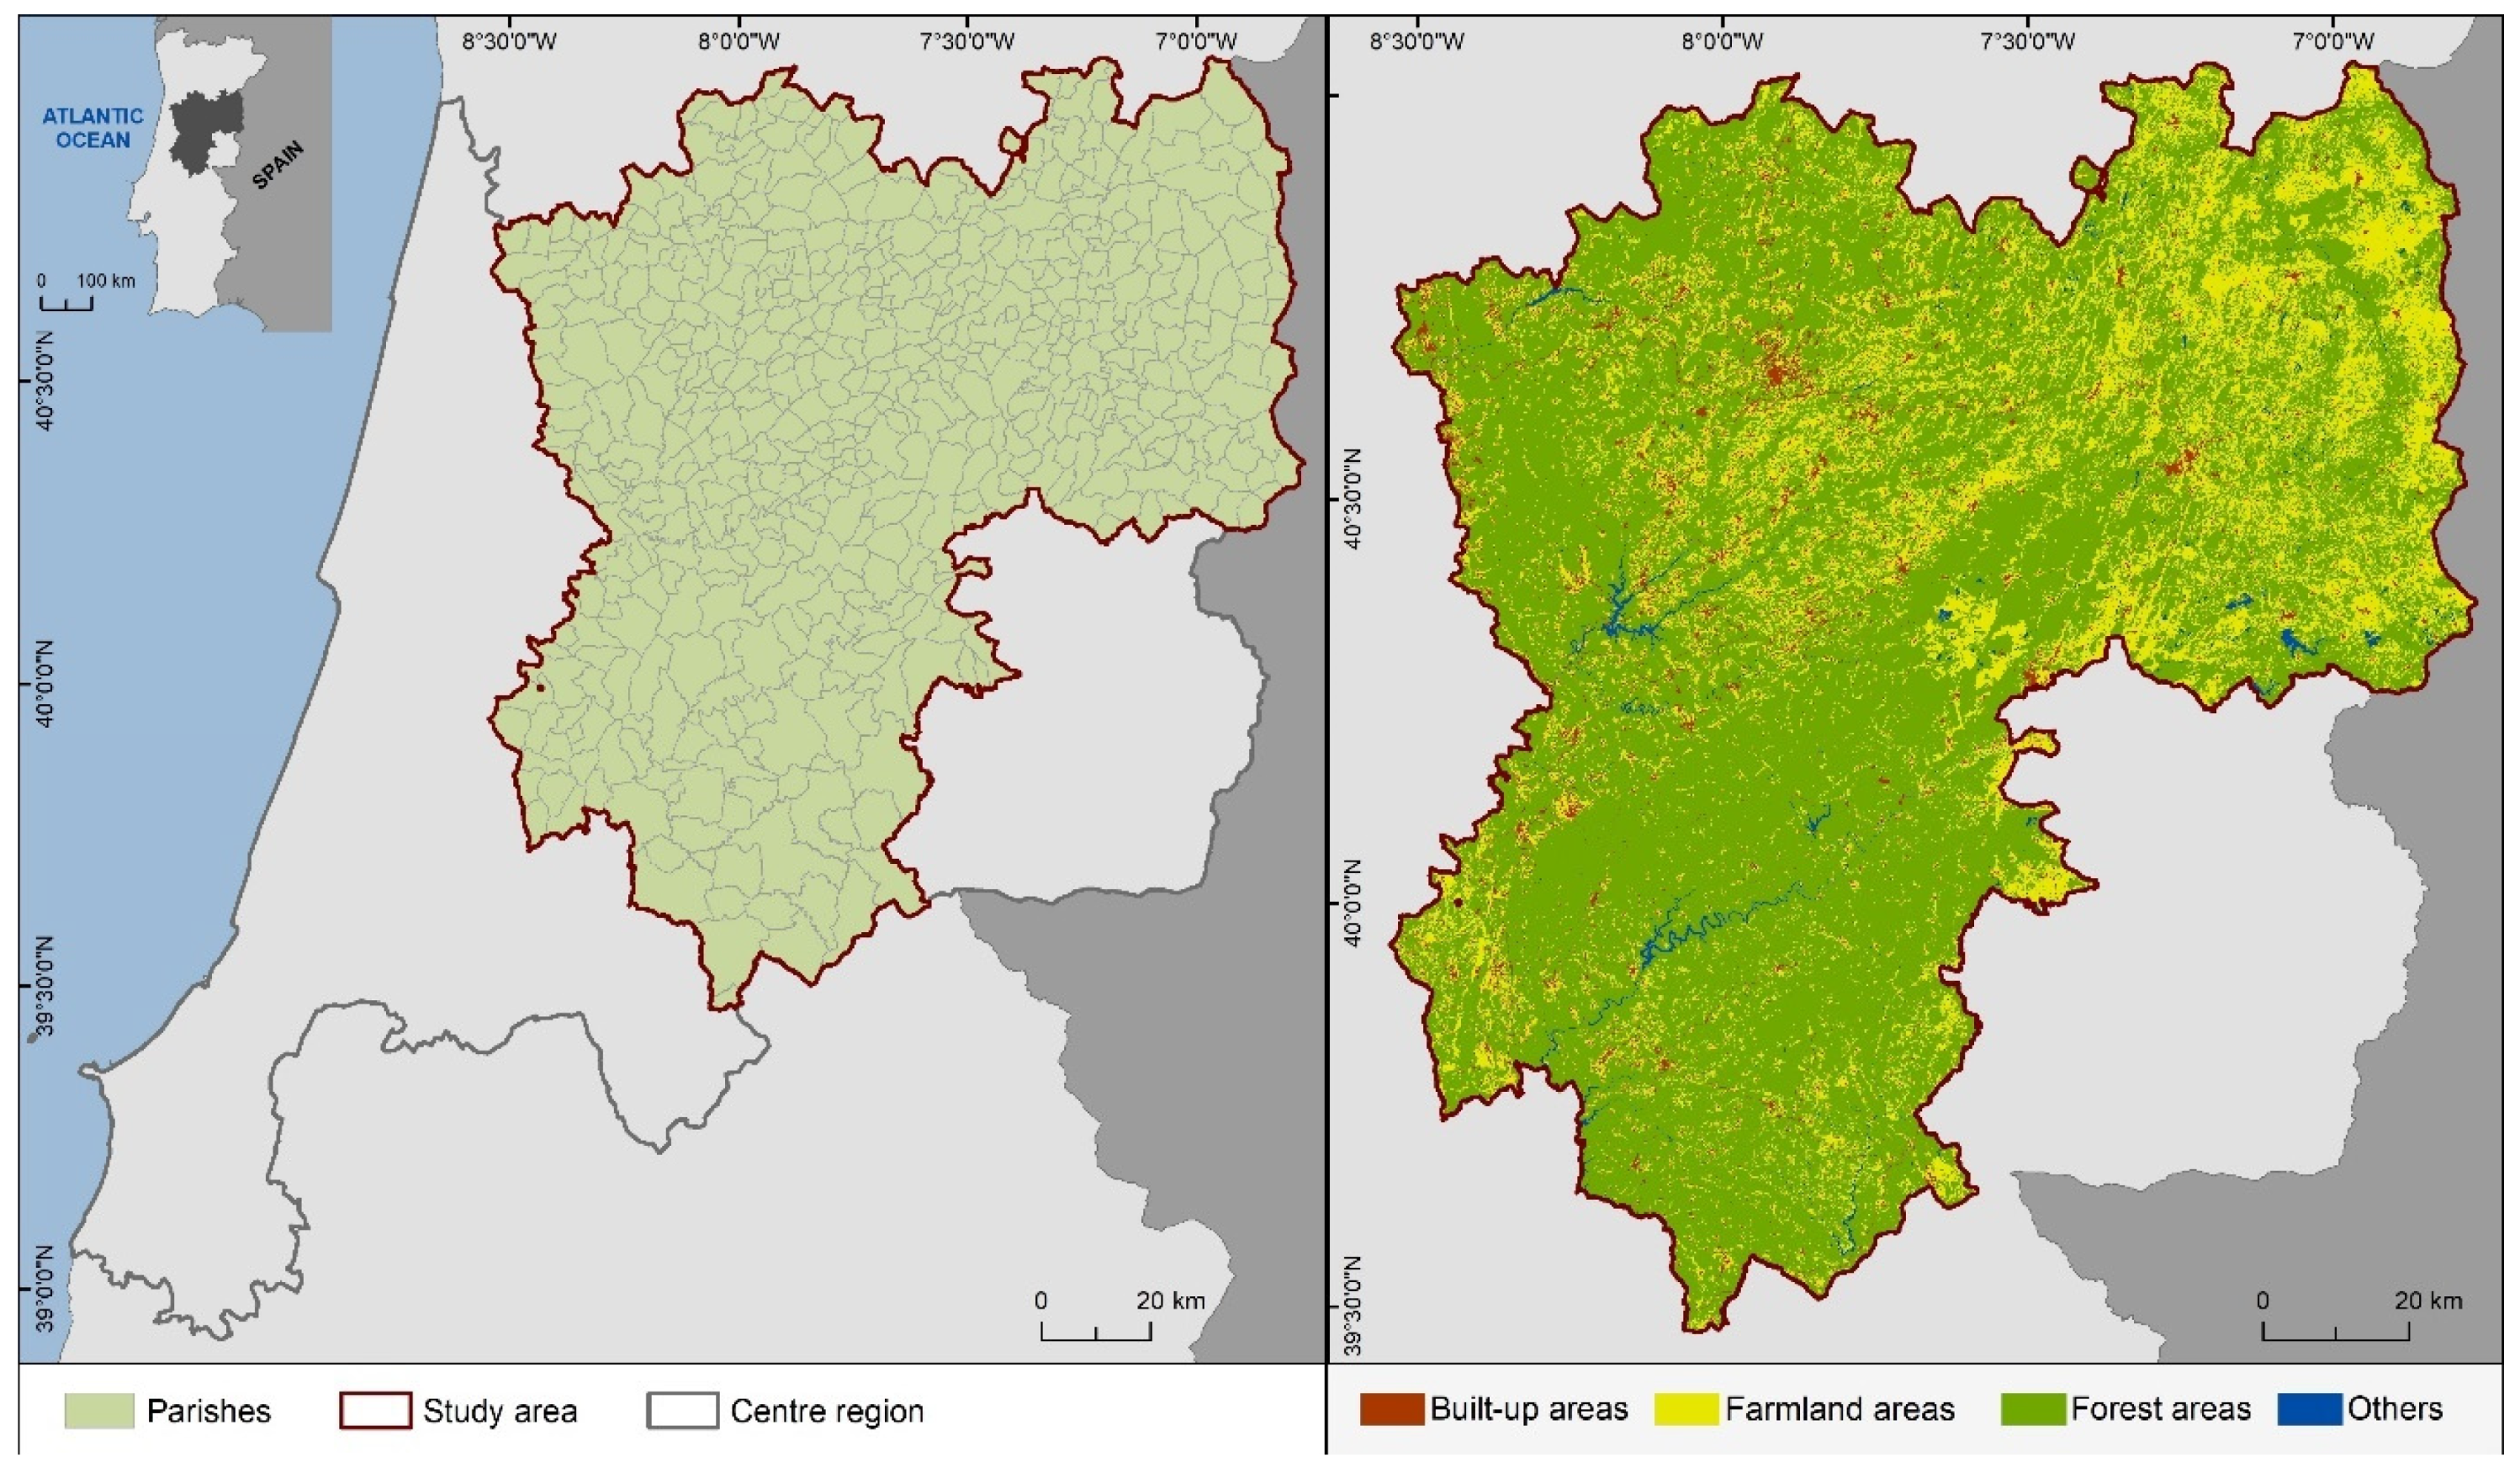
2.1. Study Area
2.2. Fire Regime Characterization
2.3. Territorial Features
2.4. Data Analyses
3. Results
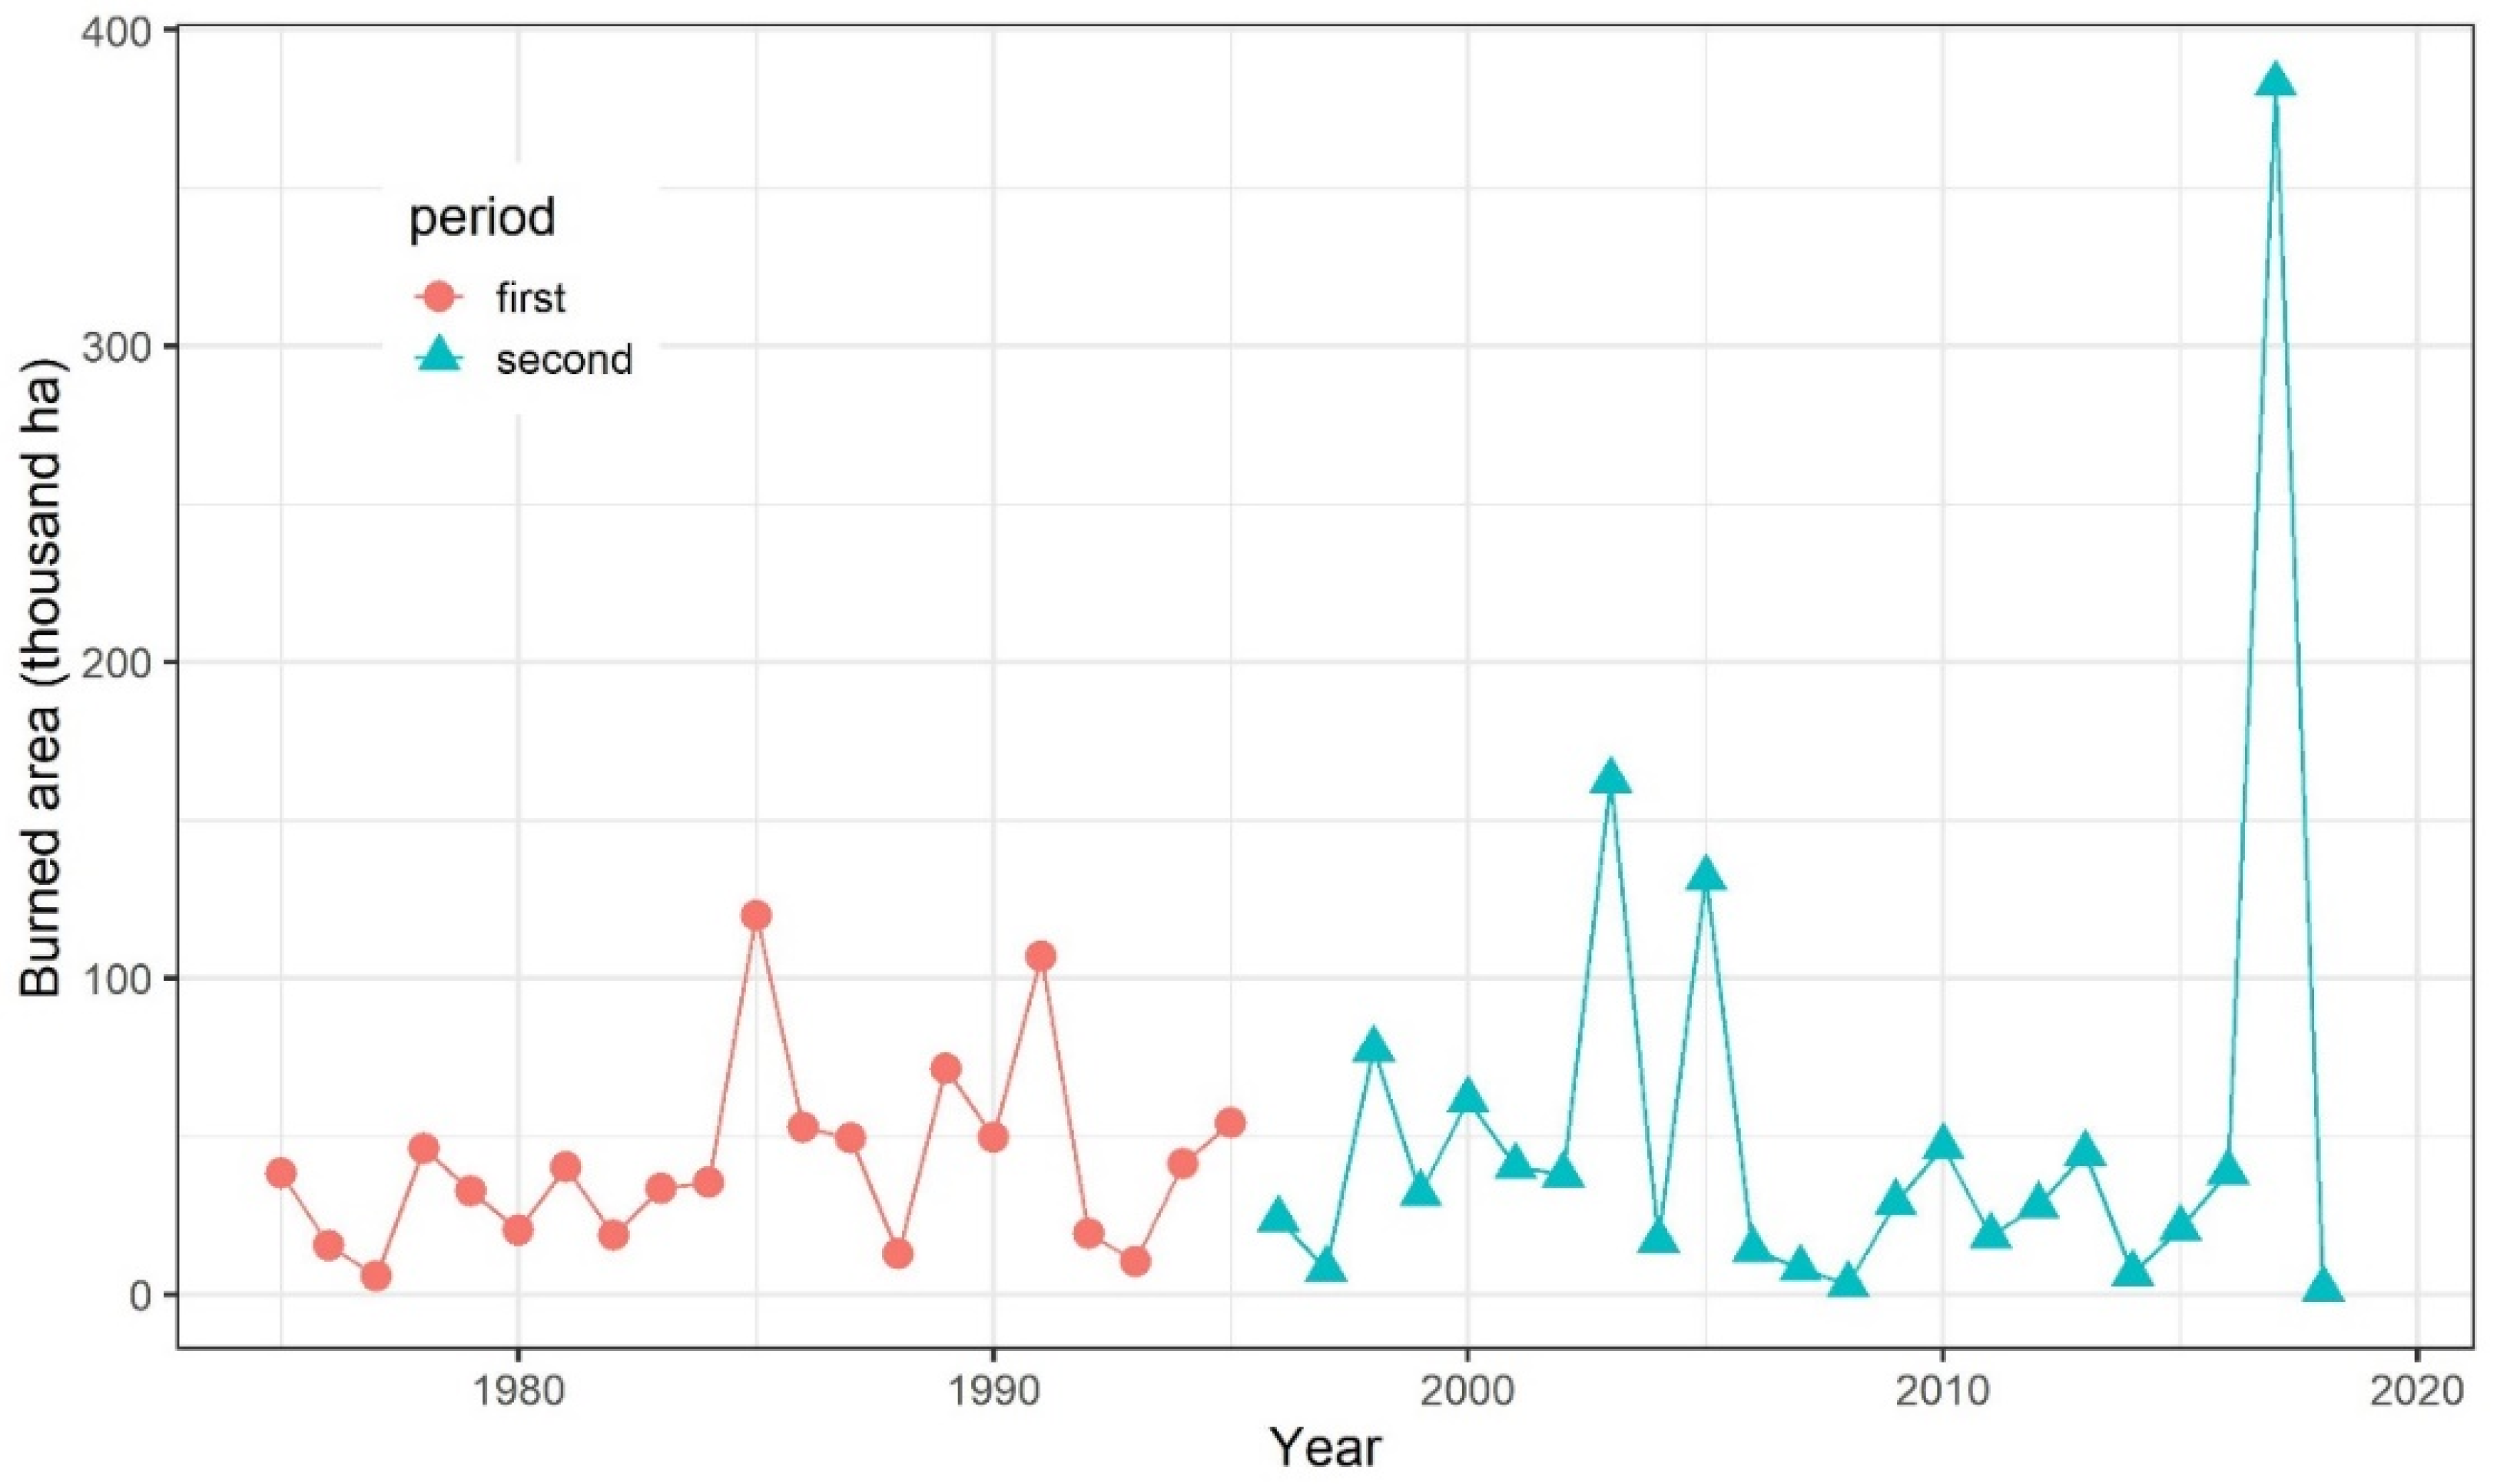
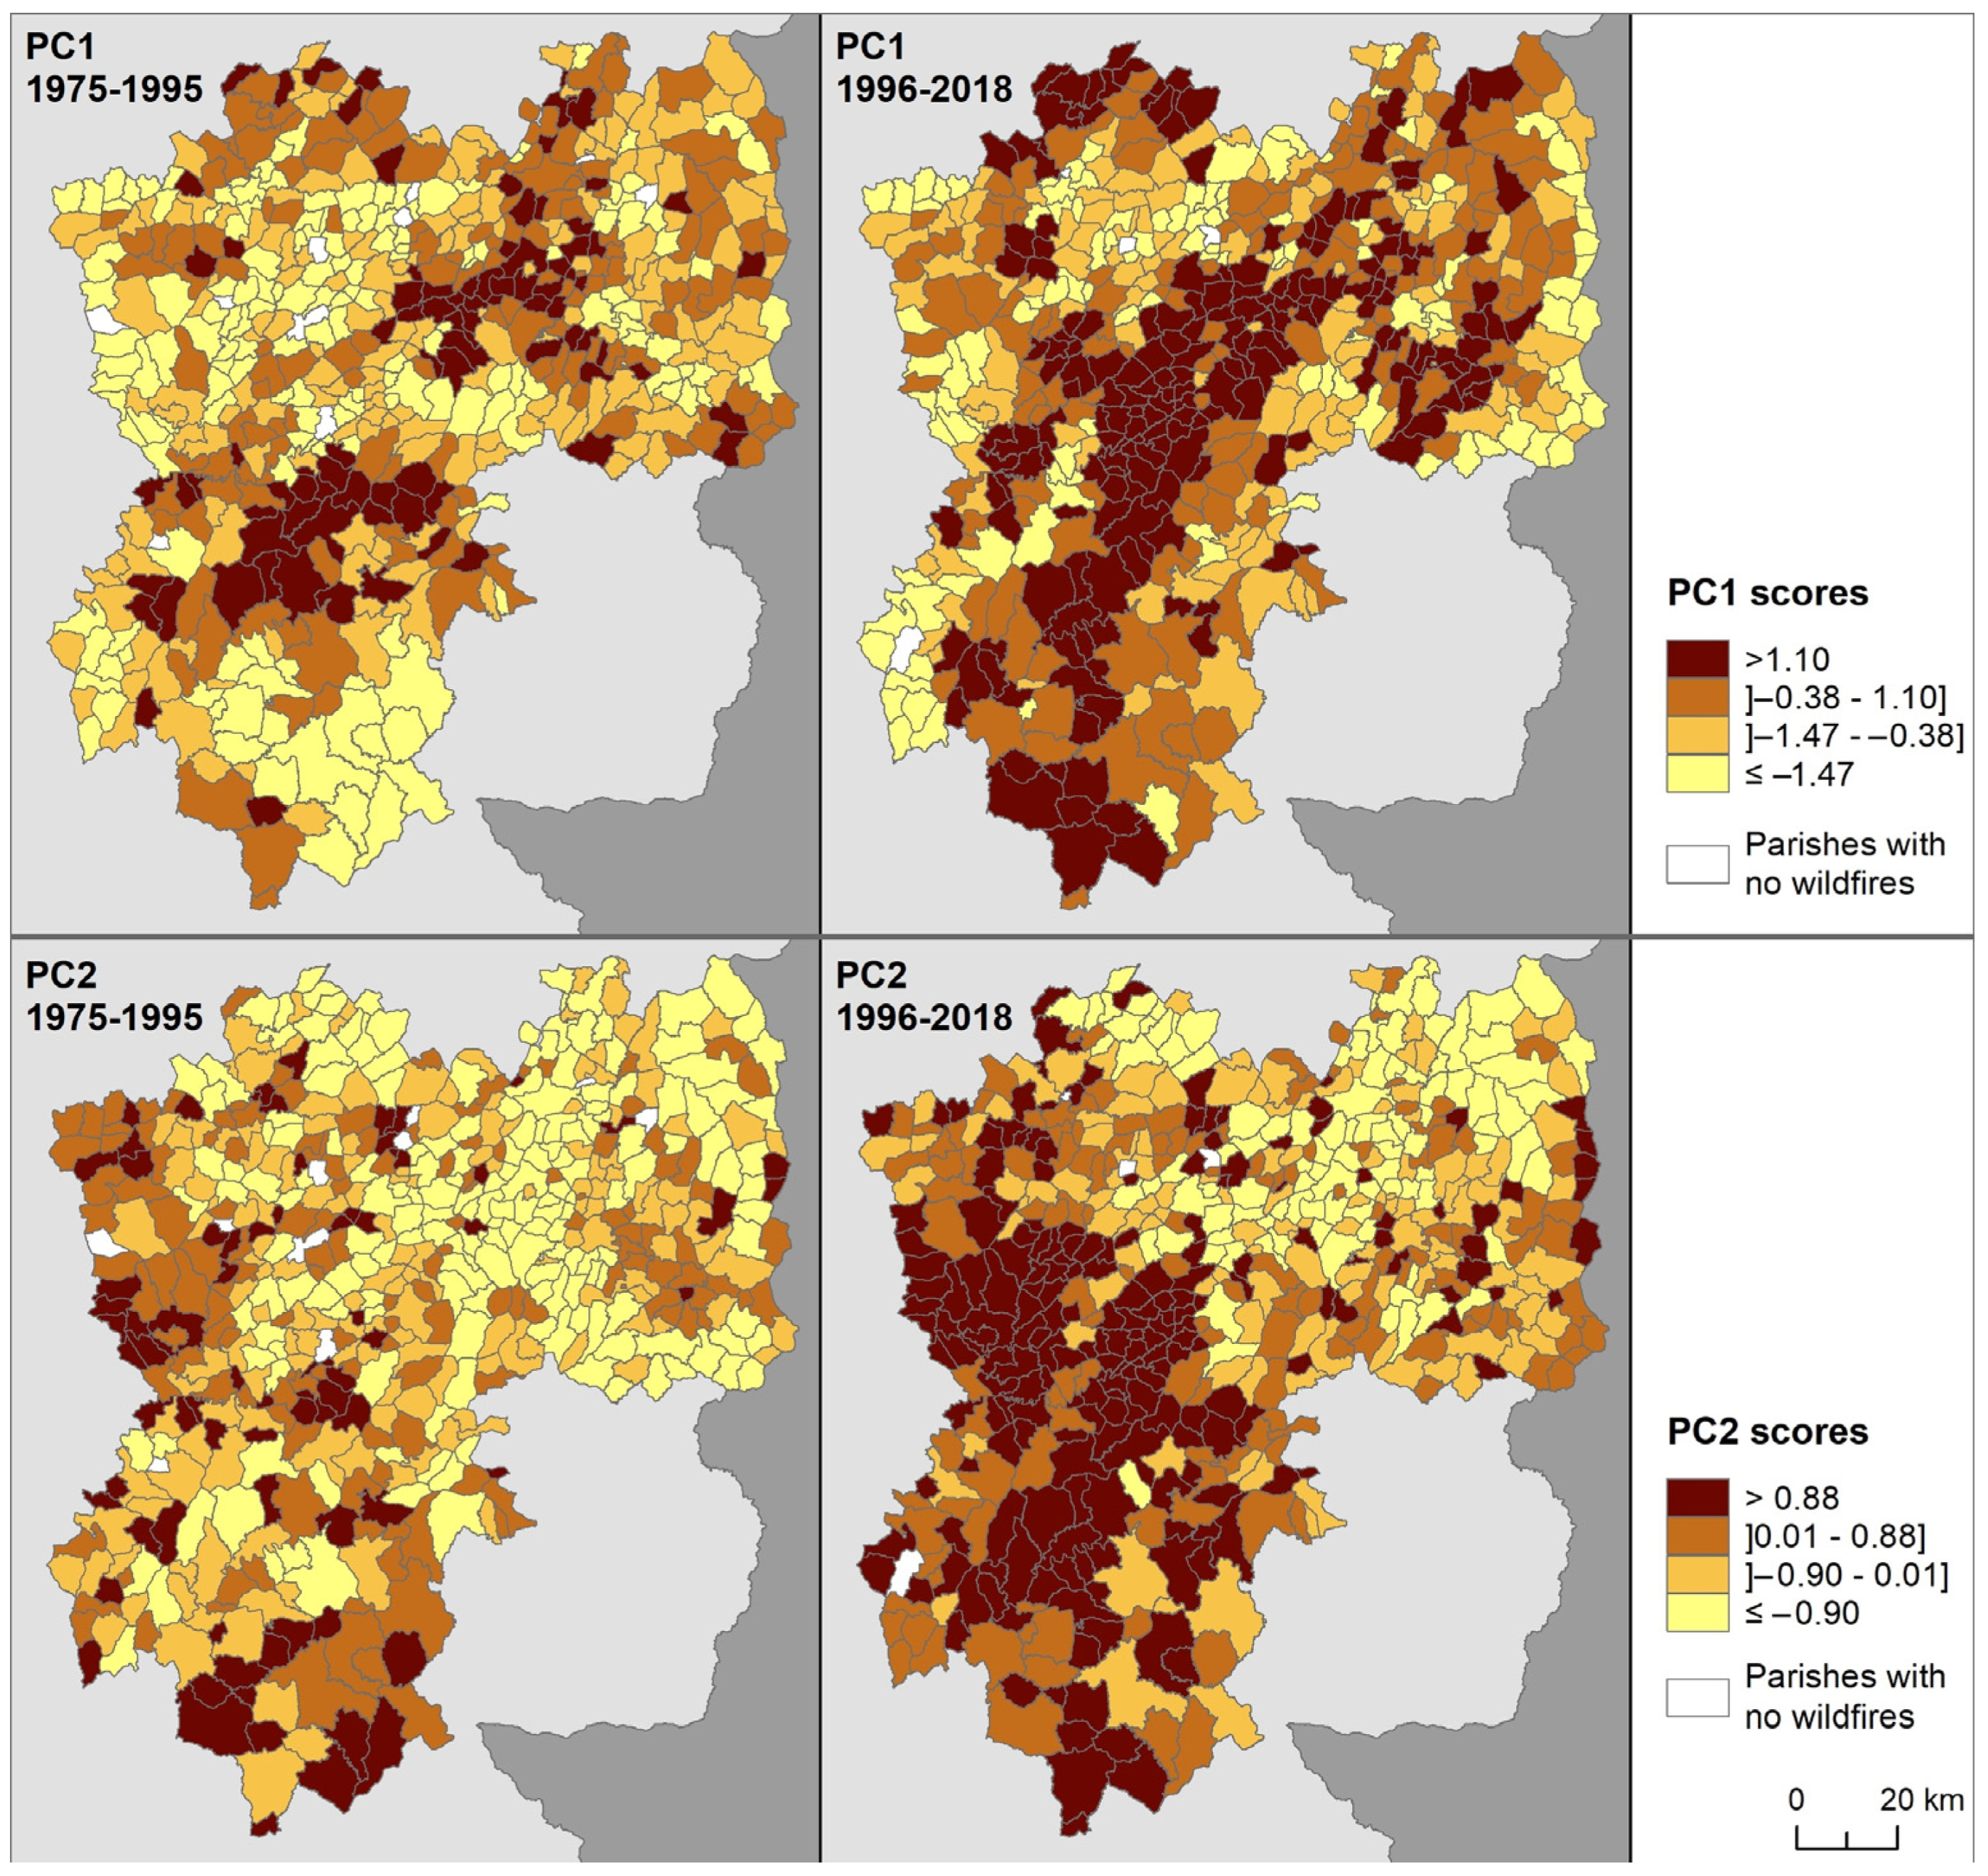
3.1. Fire Regimes
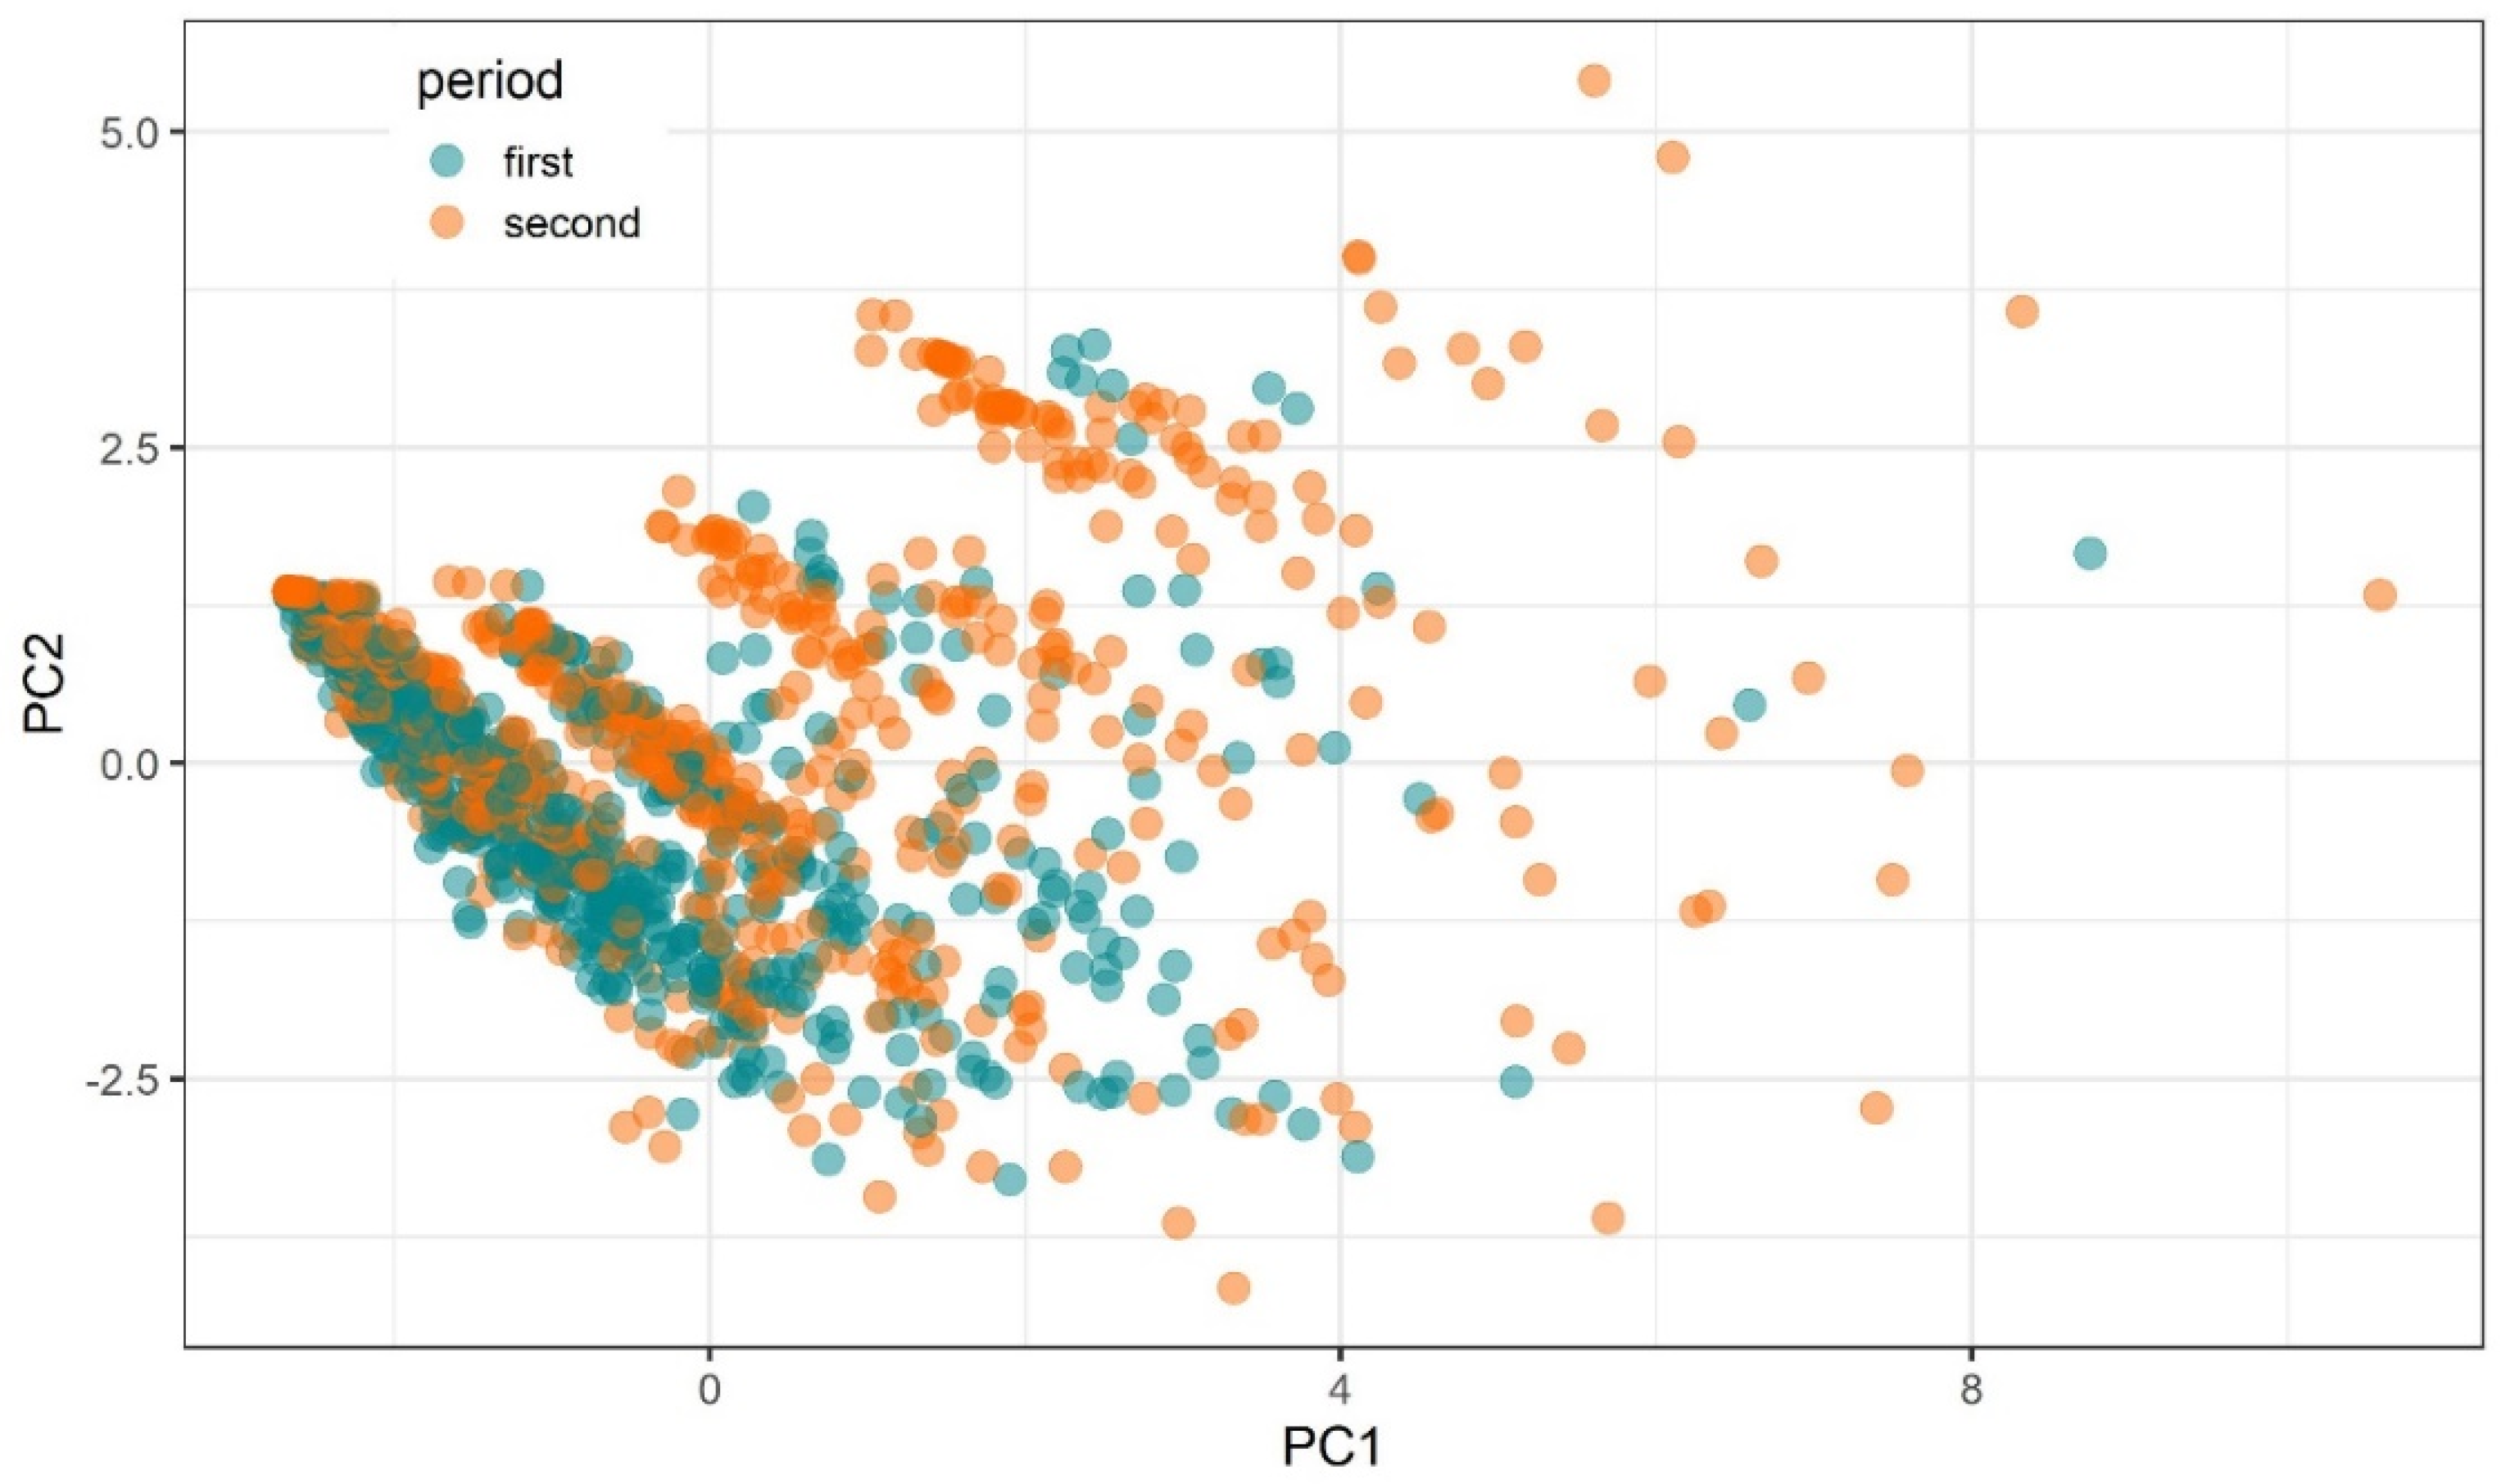
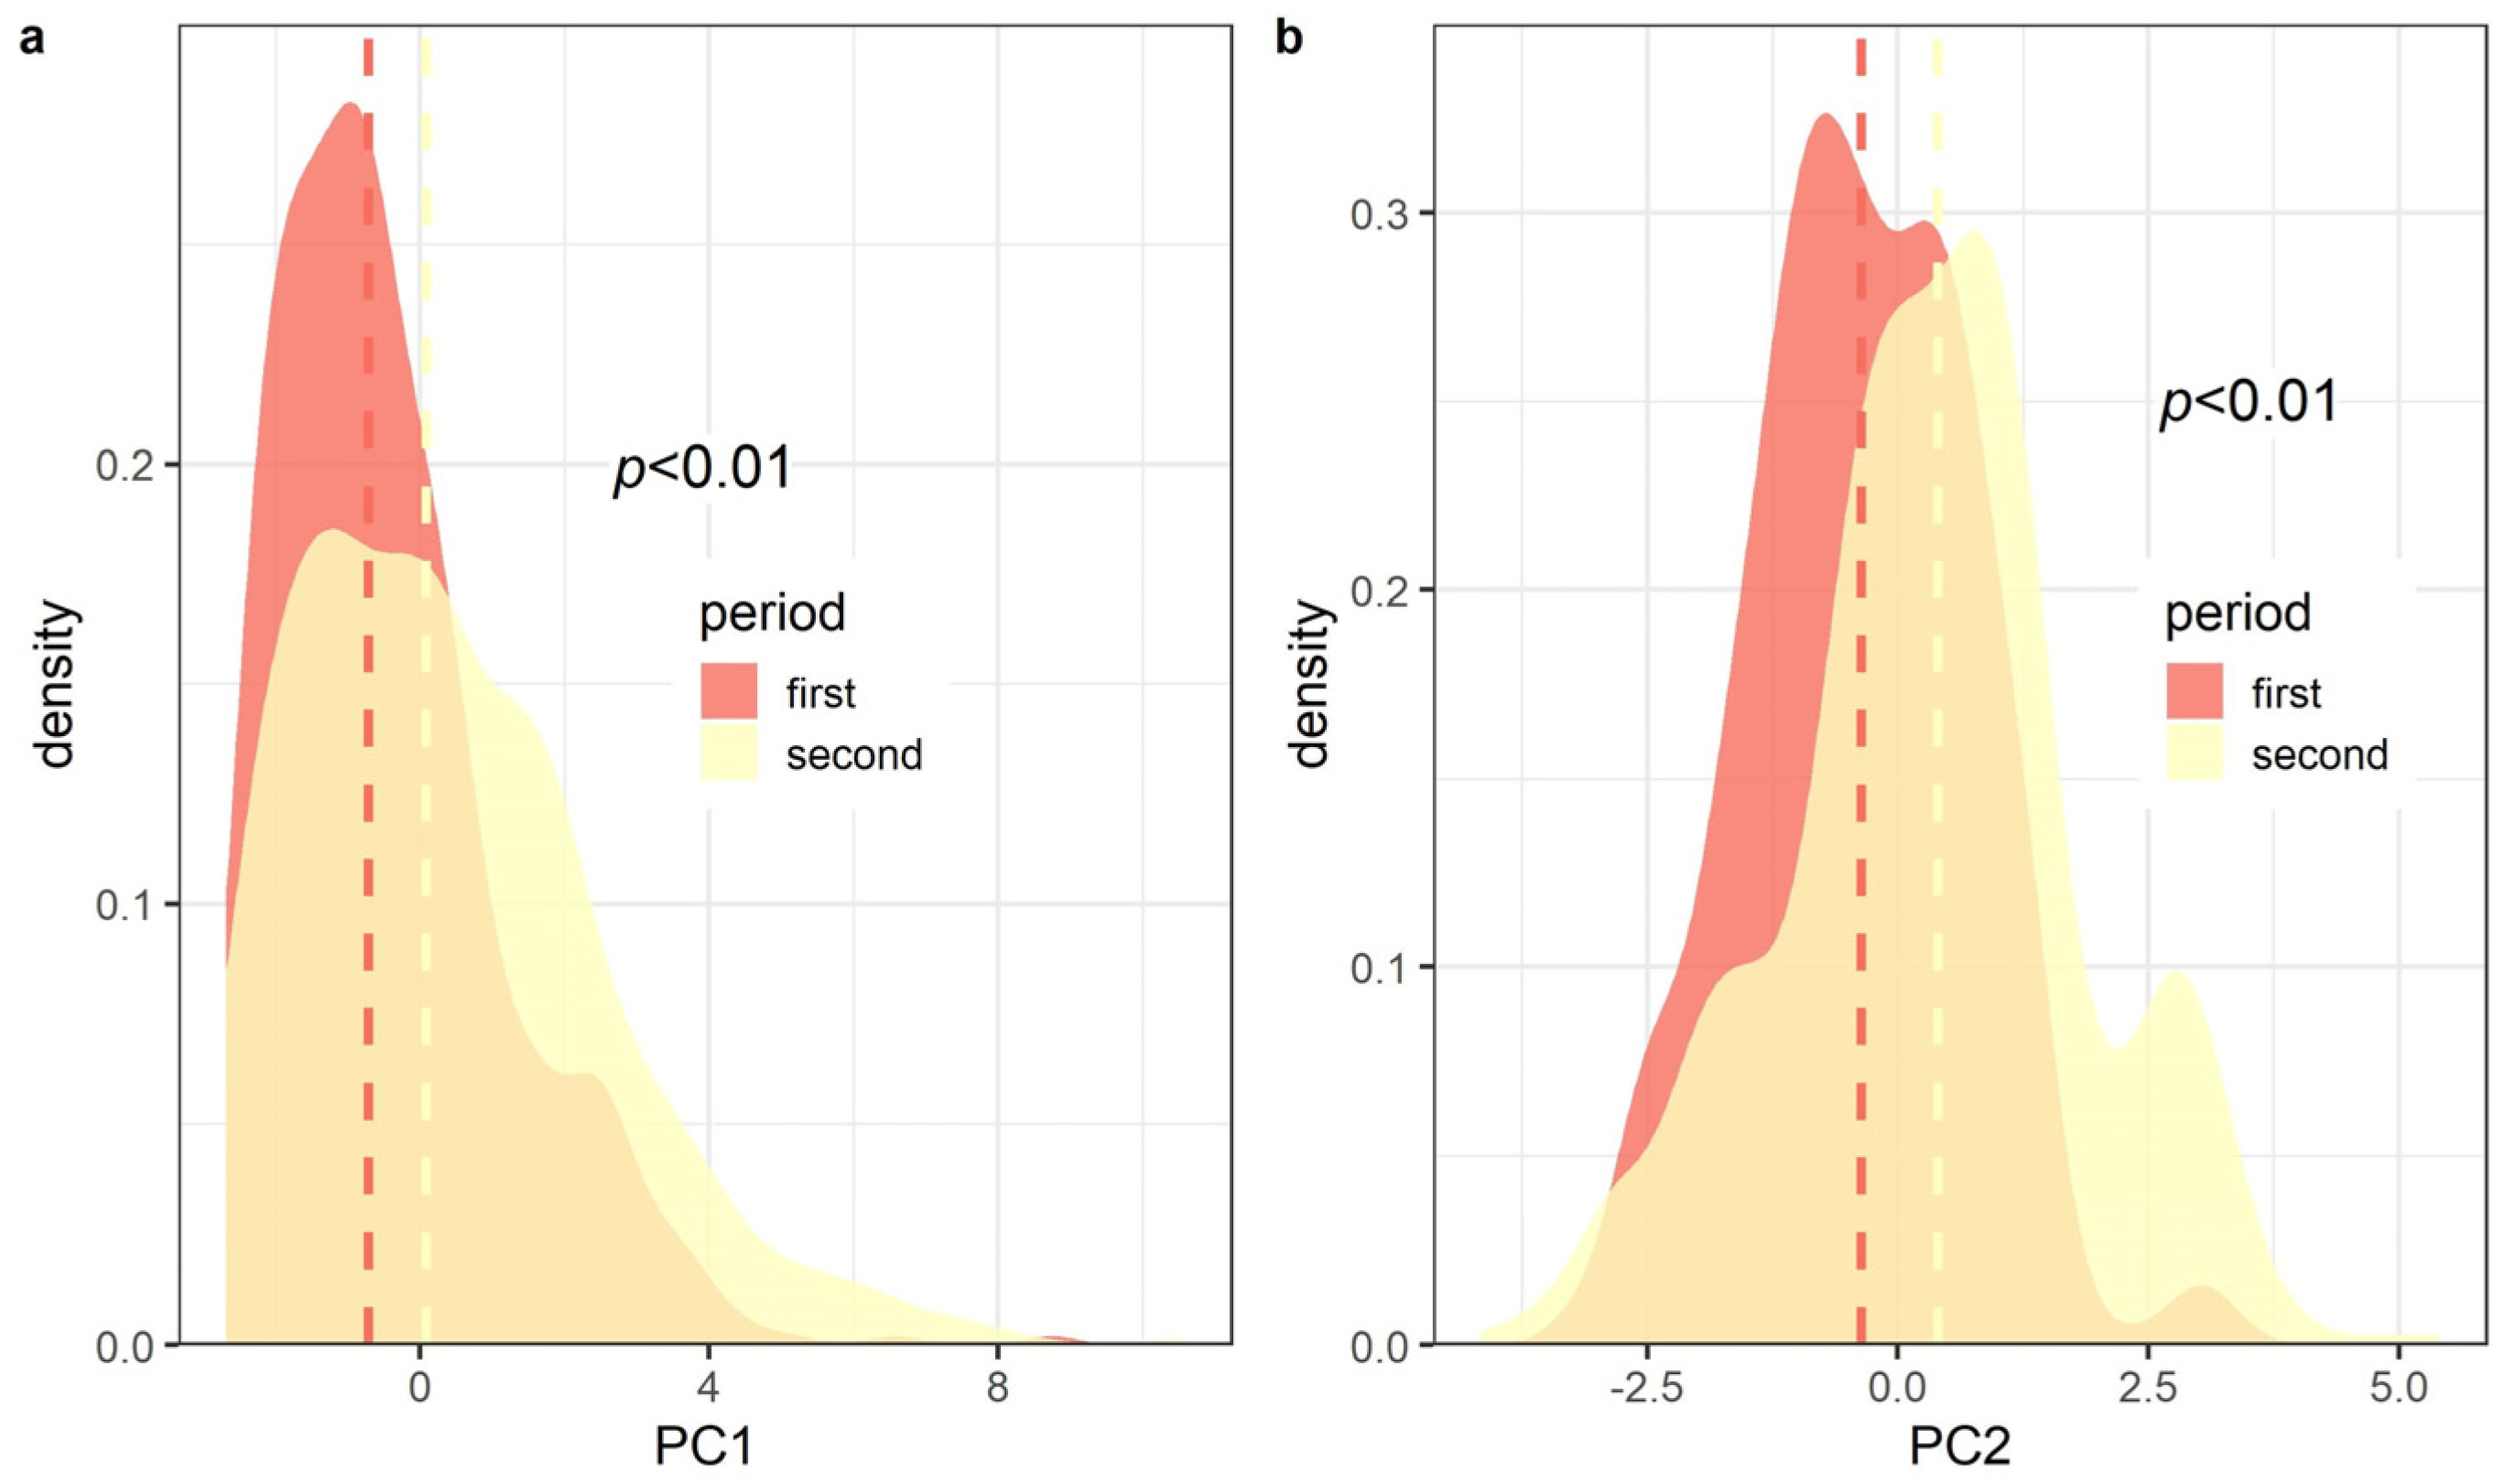
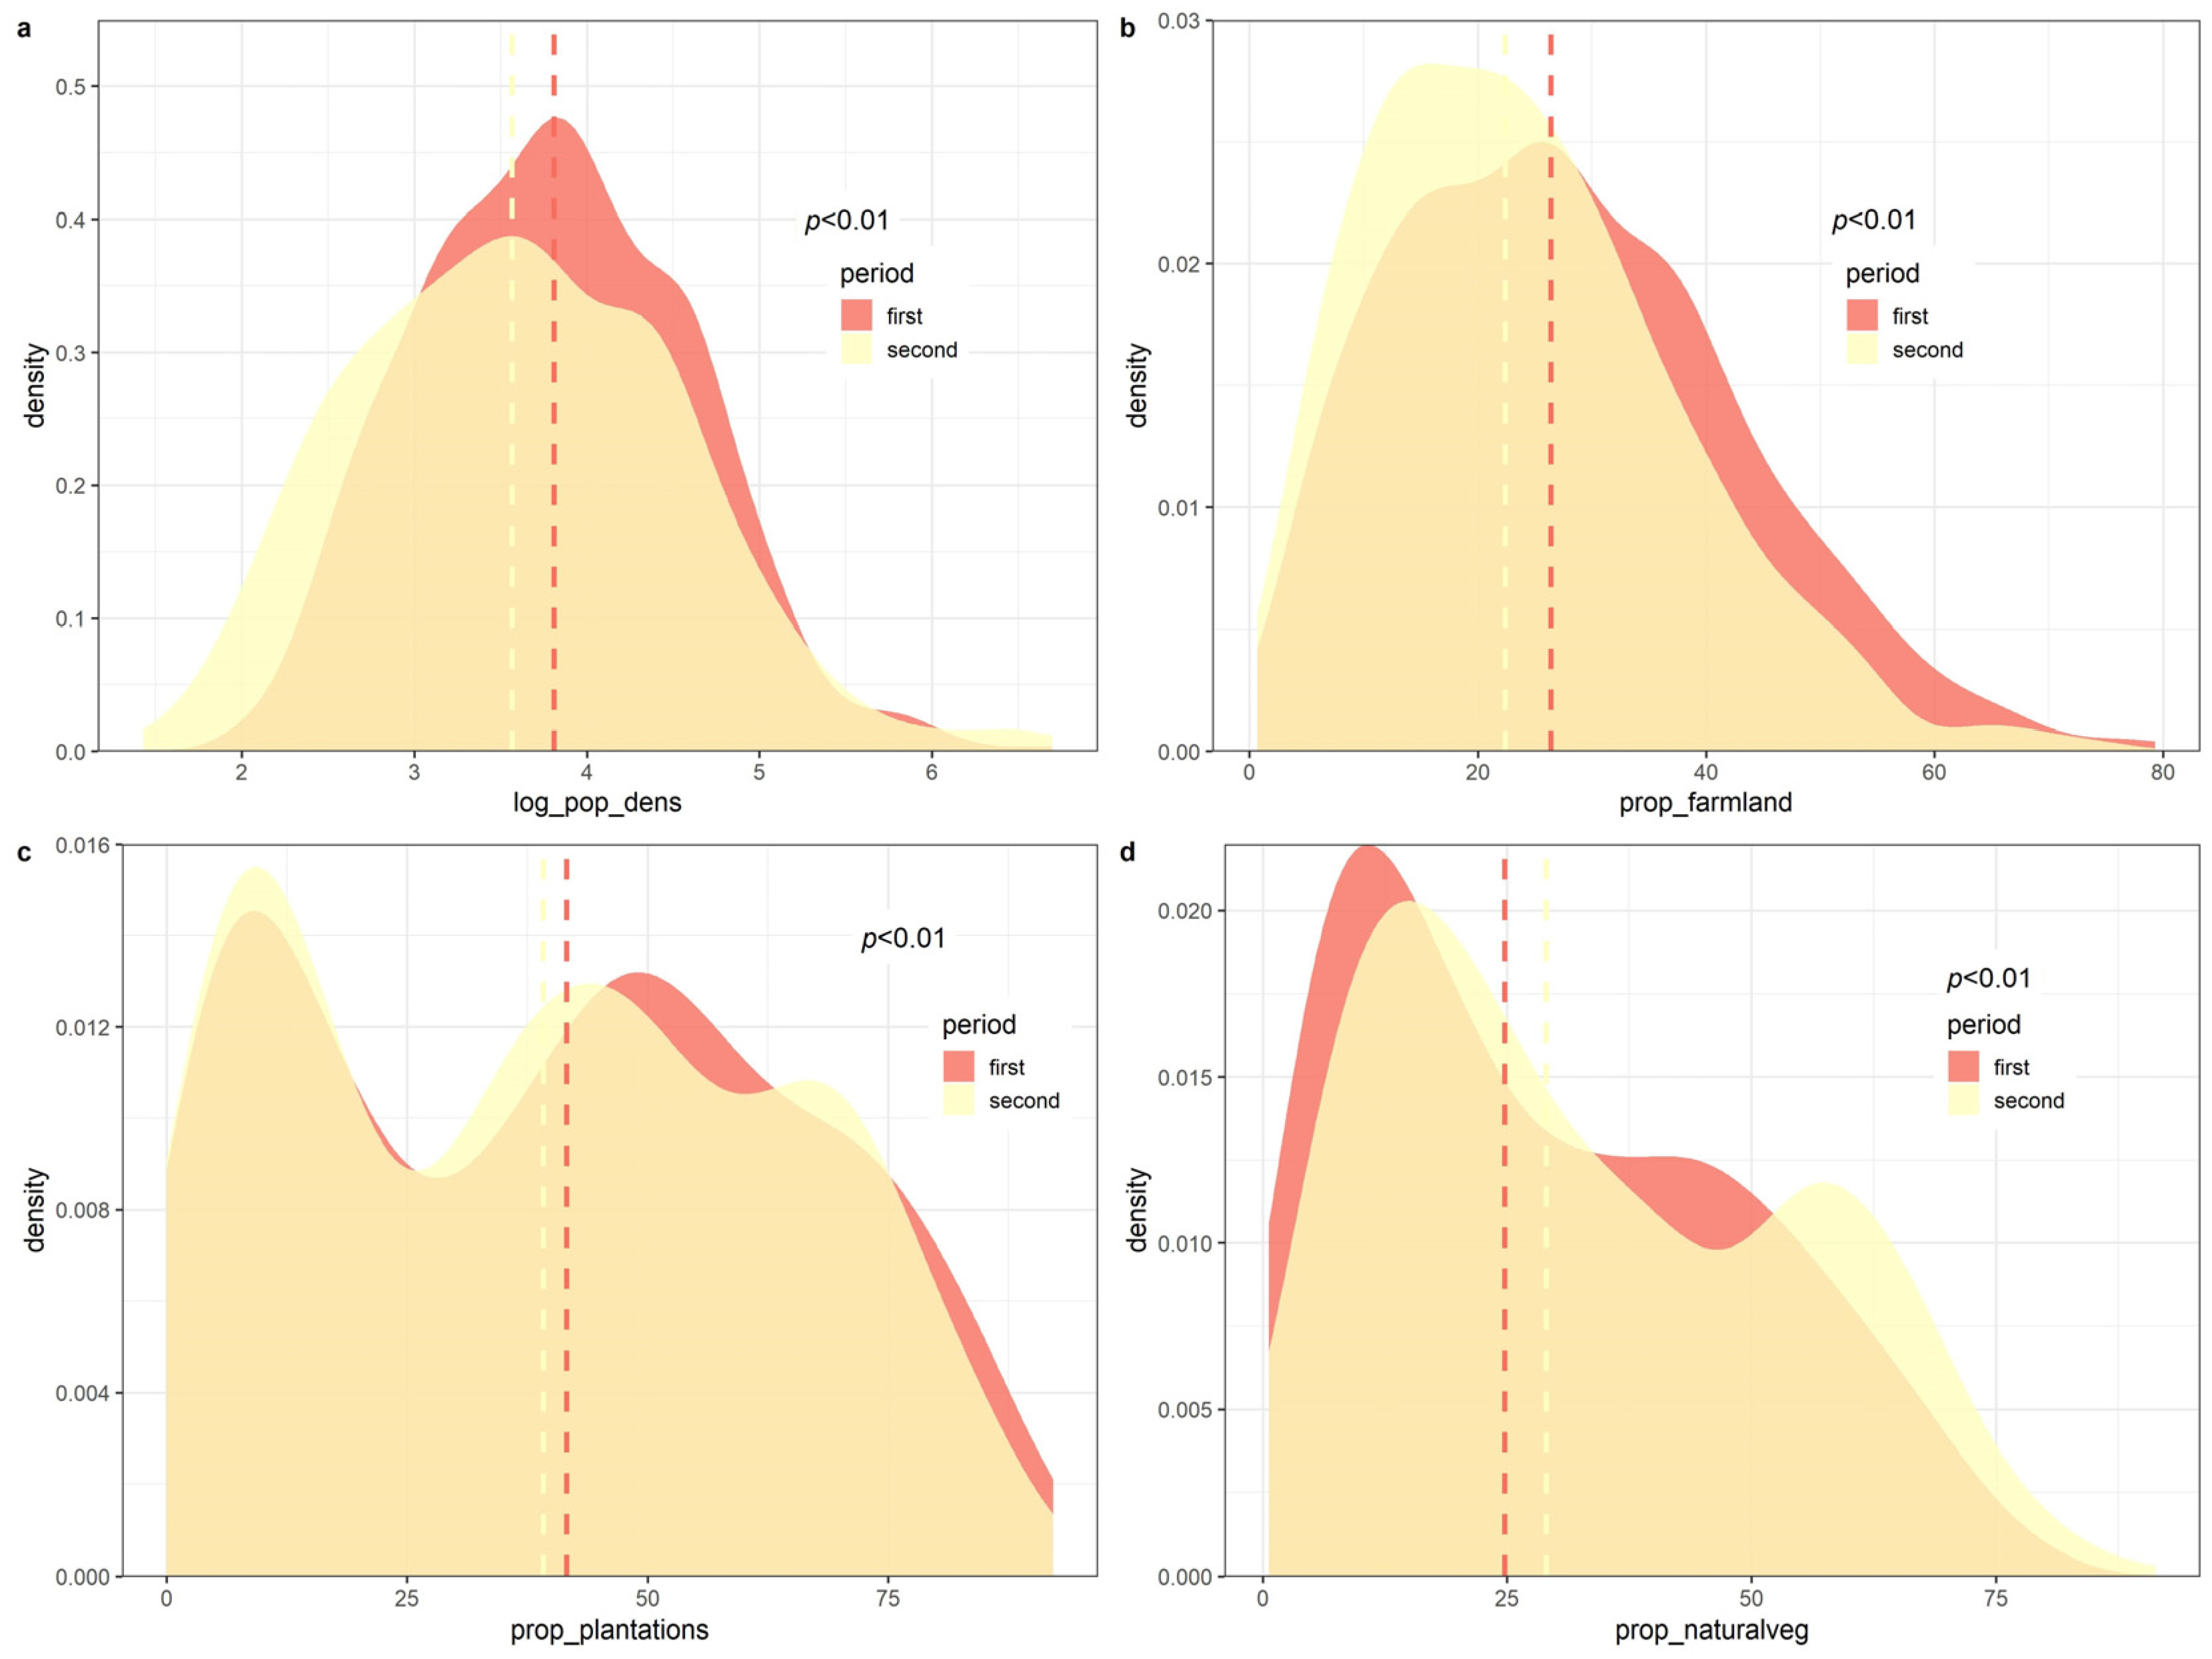
3.2. Territorial Features Associated with Study Periods
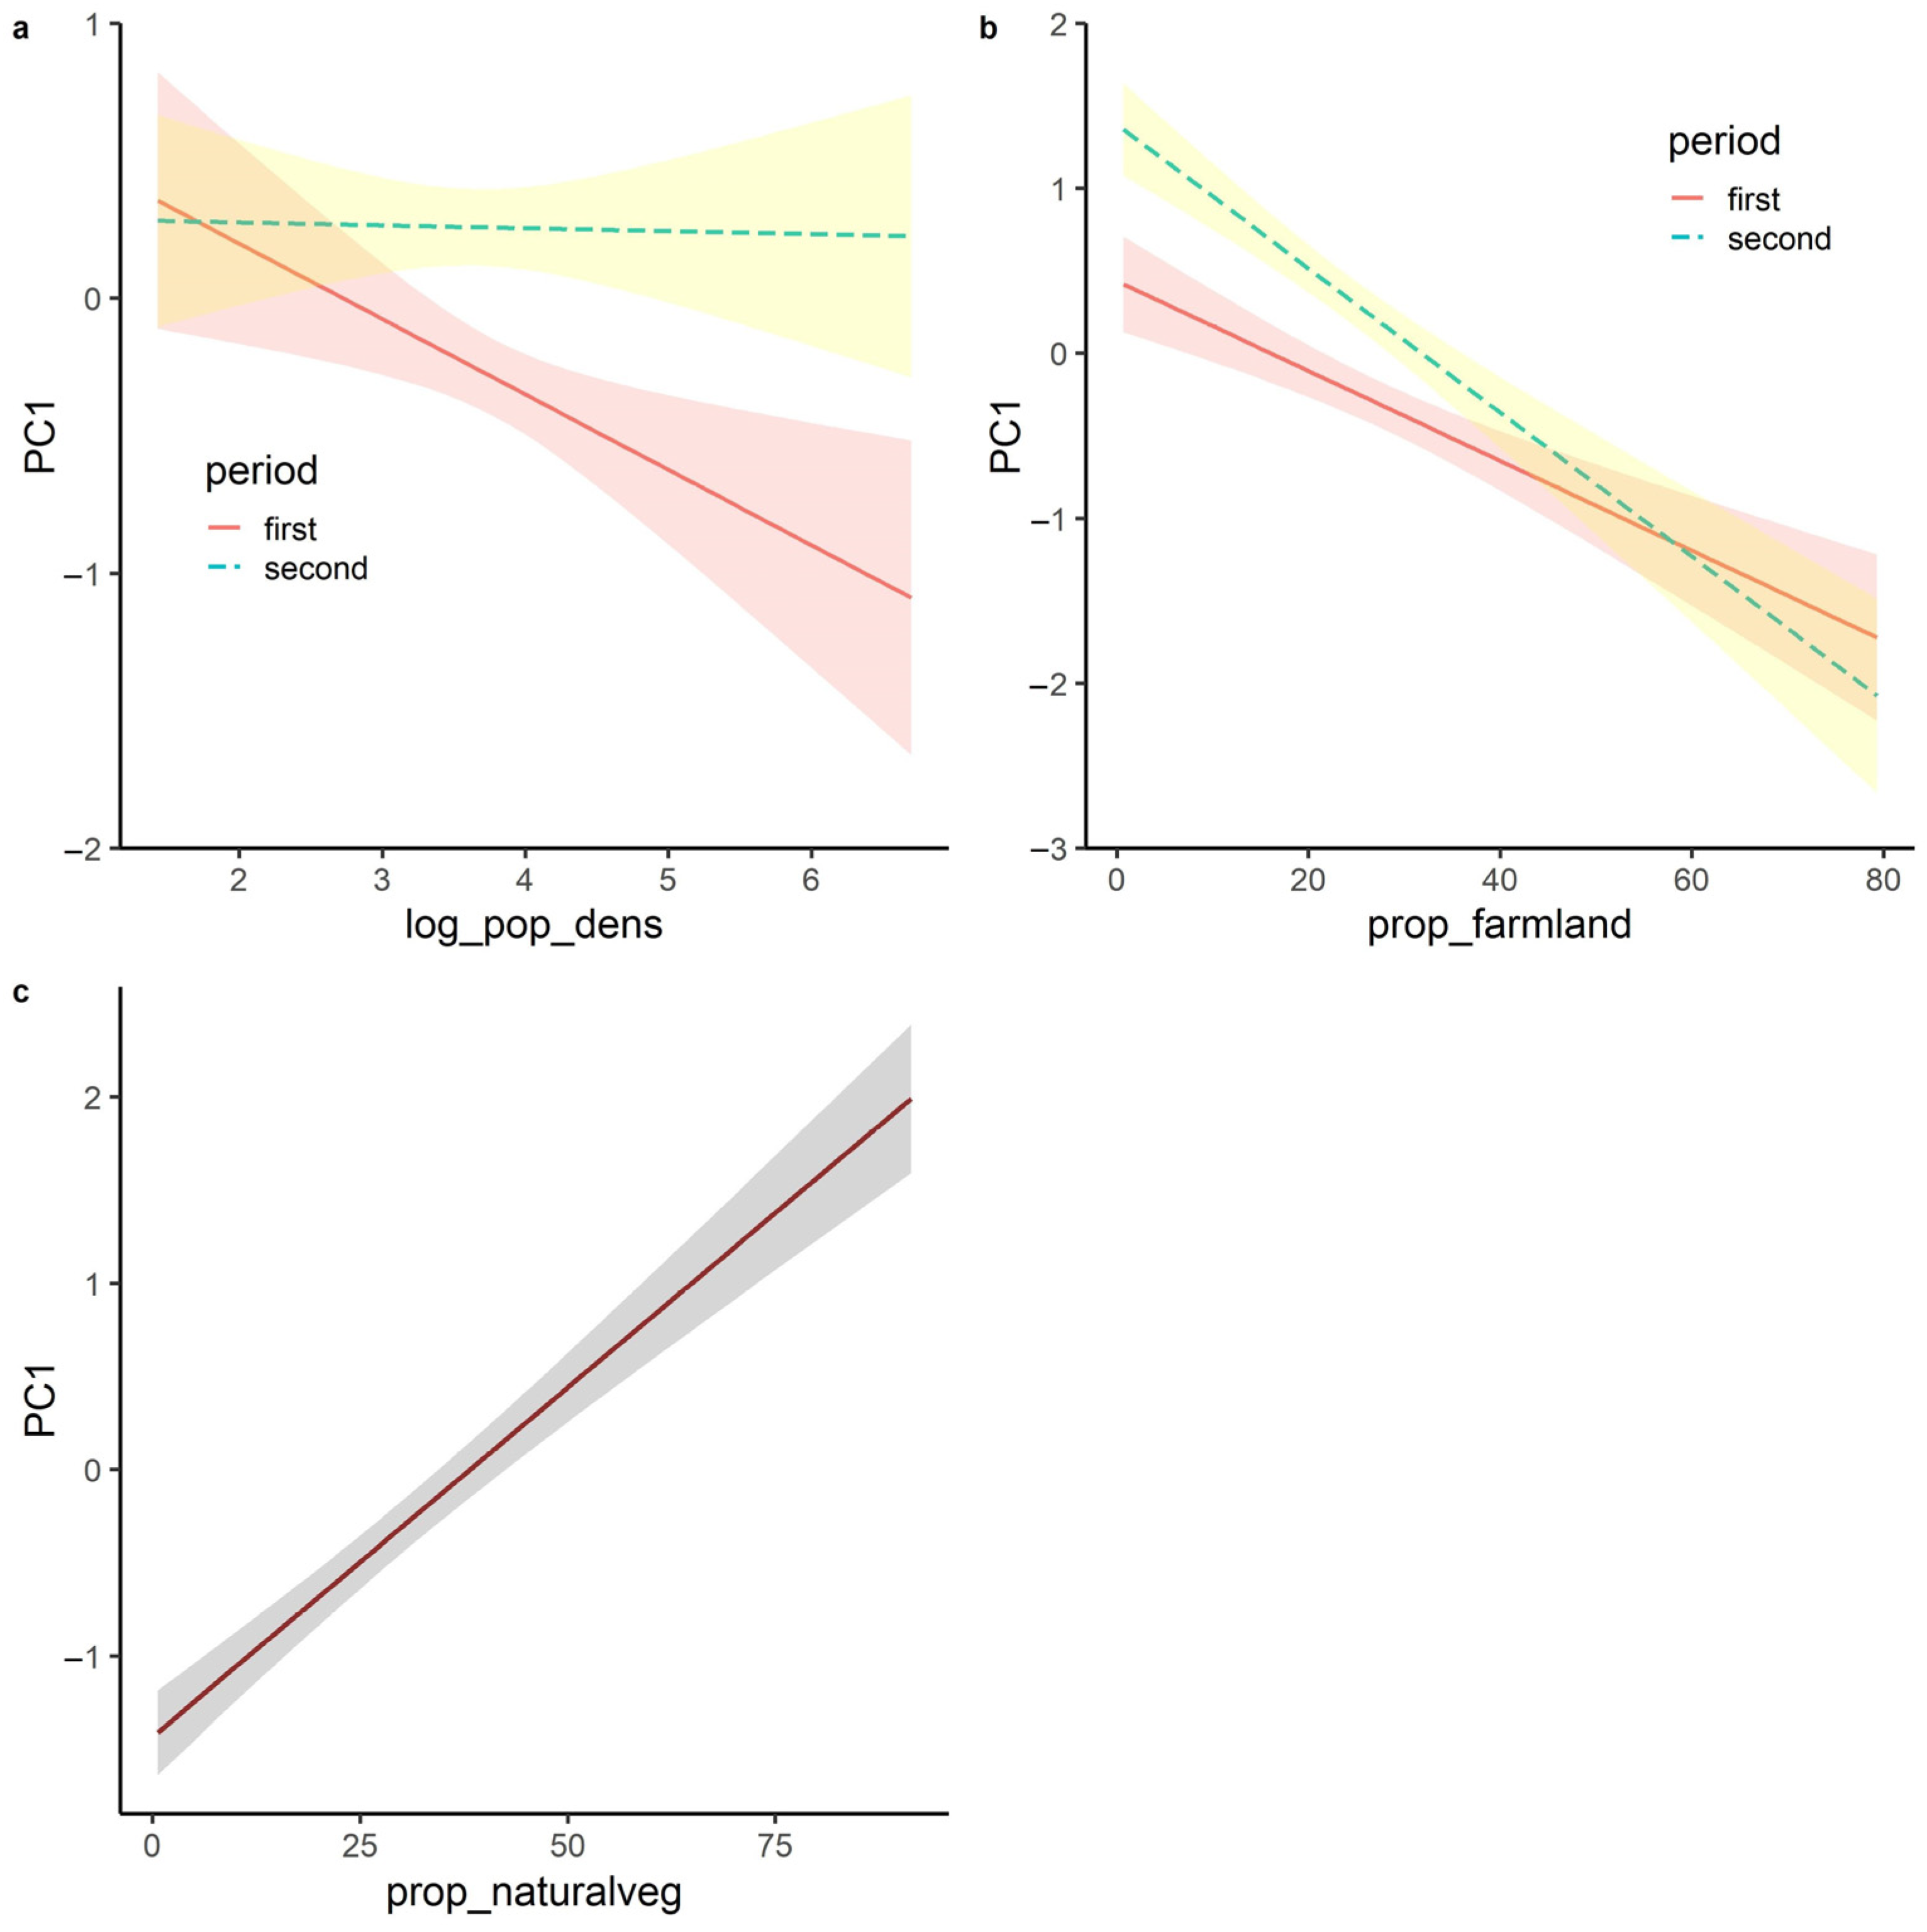
3.3. Influence of Period and Territorial Features on Fire Regime Indicators
4. Discussion
4.1. Changes in Fire Regime and Territorial Features
4.2. Changes in Territorial Features—Fire Regime Associations across Period
5. Conclusions
Author Contributions
Funding
Institutional Review Board Statement
Informed Consent Statement
Data Availability Statement
Conflicts of Interest
References
- Carlucci, M.; Zambon, I.; Colantoni, A.; Salvati, L. Socioeconomic Development, Demographic Dynamics and Forest Fires in Italy, 1961–2017: A Time-Series Analysis. Sustainability 2019, 11, 1305. [Google Scholar] [CrossRef]
- Chuvieco, E.; Giglio, L.; Justice, C. Global characterization of fire activity: Toward defining fire regimes from Earth observation data. Glob. Change Biol. 2008, 14, 1488–1502. [Google Scholar] [CrossRef]
- Krebs, P.; Pezzatti, G.B.; Mazzoleni, S.; Talbot, L.M.; Conedera, M. Fire regime: History and definition of a key concept in disturbance ecology. Theory Biosci. 2010, 129, 53–69. [Google Scholar] [CrossRef] [PubMed]
- Morgan, P.; Hardy, C.C.; Swetnam, T.W.; Rollins, M.G.; Long, D.G. Mapping fire regimes across time and space: Understanding coarse and fine-scale fire patterns. Int. J. Wildland Fire 2001, 10, 329–342. [Google Scholar] [CrossRef]
- Eskandari, S.; Miesel, J.R.; Pourghasemi, H.R. The temporal and spatial relationships between climatic parameters and fire occurrence in northeastern Iran. Ecol. Indic. 2020, 118, 106720. [Google Scholar] [CrossRef]
- Jiménez-Ruano, A.; Mimbrero, M.R.; de la Riva Fernández, J. Understanding wildfires in mainland Spain. A comprehensive analysis of fire regime features in a climate-human context. Appl. Geogr. 2017, 89, 100–111. [Google Scholar] [CrossRef]
- Chergui, B.; Fahd, S.; Santos, X.; Pausas, J.G. Socioeconomic Factors Drive Fire-Regime Variability in the Mediterranean Basin. Ecosystems 2017, 21, 619–628. [Google Scholar] [CrossRef]
- Amraoui, M.; Pereira, M.G.; DaCamara, C.C.; Calado, T.J. Atmospheric conditions associated with extreme fire activity in the Western Mediterranean region. Sci. Total. Environ. 2015, 524–525, 32–39. [Google Scholar] [CrossRef]
- Pinto, G.; Rousseu, F.; Niklasson, M.; Drobyshev, I. Effects of human-related and biotic landscape features on the occurrence and size of modern forest fires in Sweden. Agric. For. Meteorol. 2020, 291, 108084. [Google Scholar] [CrossRef]
- Rodrigues, M.; Jiménez-Ruano, A.; Peña-Angulo, D.; de la Riva, J. A comprehensive spatial-temporal analysis of driving factors of human-caused wildfires in Spain using Geographically Weighted Logistic Regression. J. Environ. Manag. 2018, 225, 177–192. [Google Scholar] [CrossRef] [Green Version]
- Calheiros, T.; Nunes, J.P.; Pereira, M. Recent evolution of spatial and temporal patterns of burnt areas and fire weather risk in the Iberian Peninsula. Agric. For. Meteorol. 2020, 287, 107923. [Google Scholar] [CrossRef]
- Fernandes, P.M.; Loureiro, C.; Guiomar, N.; Pezzatti, G.B.; Manso, F.T.; Lopes, L. The dynamics and drivers of fuel and fire in the Portuguese public forest. J. Environ. Manag. 2014, 146, 373–382. [Google Scholar] [CrossRef] [PubMed]
- Mancini, L.D.; Corona, P.; Salvati, L. Ranking the importance of Wildfires’ human drivers through a multi-model regression approach. Environ. Impact Assess. Rev. 2018, 72, 177–186. [Google Scholar] [CrossRef]
- Molina, C.M.; Martín, O.K.; Martín, L.G. Regional fire scenarios in Spain: Linking landscape dynamics and fire regime for wildfire risk management. J. Environ. Manag. 2018, 233, 427–439. [Google Scholar] [CrossRef] [PubMed]
- Mueller, S.E.; Thode, A.E.; Margolis, E.Q.; Yocom, L.L.; Young, J.D.; Iniguez, J.M. Climate relationships with increasing wildfire in the southwestern US from 1984 to 2015. For. Ecol. Manag. 2020, 460, 117861. [Google Scholar] [CrossRef]
- Nunes, A.; Lourenço, L.; Castro-Meira, A. Exploring spatial patterns and drivers of forest fires in Portugal (1980–2014). Sci. Total Environ. 2016, 573, 1190–1202. [Google Scholar] [CrossRef] [PubMed]
- Oliveira, S.; Gonçalves, A.; Zêzere, J.L. Reassessing wildfire susceptibility and hazard for mainland Portugal. Sci. Total. Environ. 2020, 762, 143121. [Google Scholar] [CrossRef]
- Pezzatti, G.B.; Zumbrunnen, T.; Bürgi, M.; Ambrosetti, P.; Conedera, M. Fire regime shifts as a consequence of fire policy and socio-economic development: An analysis based on the change point approach. For. Policy Econ. 2013, 29, 7–18. [Google Scholar] [CrossRef]
- Elia, M.; D’Este, M.; Ascoli, D.; Giannico, V.; Spano, G.; Ganga, A.; Colangelo, G.; Lafortezza, R.; Sanesi, G. Estimating the probability of wildfire occurrence in Mediterranean landscapes using Artificial Neural Networks. Environ. Impact Assess. Rev. 2020, 85, 106474. [Google Scholar] [CrossRef]
- Ganteaume, A.; Camia, A.; Jappiot, M.; San-Miguel-Ayanz, J.; Long-Fournel, M.; Lampin, C. A Review of the Main Driving Factors of Forest Fire Ignition Over Europe. Environ. Manag. 2012, 51, 651–662. [Google Scholar] [CrossRef] [Green Version]
- Saura-Mas, S.; Paula, S.; Pausas, J.G.; Lloret, F. Fuel loading and flammability in the Mediterranean Basin woody species with different post-fire regenerative strategies. Int. J. Wildland Fire 2010, 19, 783–794. [Google Scholar] [CrossRef]
- Moreira, F.; Viedma, O.; Arianoutsou, M.; Curt, T.; Koutsias, N.; Rigolot, E.; Barbati, A.; Corona, P.; Vaz, P.; Xanthopoulos, G.; et al. Landscape—wildfire interactions in southern Europe: Implications for landscape management. J. Environ. Manag. 2011, 92, 2389–2402. [Google Scholar] [CrossRef] [PubMed]
- Bajocco, S.; Ricotta, C. Evidence of selective burning in Sardinia (Italy): Which land-cover classes do wildfires prefer? Landsc. Ecol. 2007, 23, 241–248. [Google Scholar] [CrossRef]
- Oliveira, S.; Moreira, F.; Boca, R.; San-Miguel-Ayanz, J.; Pereira, J.M.C. Assessment of fire selectivity in relation to land cover and topography: A comparison between Southern European countries. Int. J. Wildland Fire 2014, 23, 620–630. [Google Scholar] [CrossRef]
- Carmo, M.; Moreira, F.; Casimiro, P.; Vaz, P. Land use and topography influences on wildfire occurrence in northern Portugal. Landsc. Urban Plan. 2011, 100, 169–176. [Google Scholar] [CrossRef]
- Calviño-Cancela, M.; Chas-Amil, M.L.; García-Martínez, E.D.; Touza, J. Wildfire risk associated with different vegetation types within and outside wildland-urban interfaces. For. Ecol. Manag. 2016, 372, 1–9. [Google Scholar] [CrossRef]
- Curt, T.; Borgniet, L.; Bouillon, C. Wildfire frequency varies with the size and shape of fuel types in southeastern France: Implications for environmental management. J. Environ. Manag. 2013, 117, 150–161. [Google Scholar] [CrossRef]
- Lloret, F.; Calvo, E.; Pons, X.; Díaz-Delgado, R. Wildfires and landscape patterns in the Eastern Iberian Peninsula. Landsc. Ecol. 2002, 17, 745–759. [Google Scholar] [CrossRef]
- Catry, F.; Rego, F.C.; Moreira, F.; Bacao, F. Characterizing and modelling the spatial patterns of wildfire ignitions in Portugal: Fire initiation and resulting burned area. Trans. Ecol. Environ. 2008, 119, 213–221. [Google Scholar] [CrossRef]
- Vilar, L.; Gómez, I.; Martínez-Vega, J.; Echavarría, P.; Riaño, D.; Martín, M.P. Multitemporal Modelling of Socio-Economic Wildfire Drivers in Central Spain between the 1980s and the 2000s: Comparing Generalized Linear Models to Machine Learning Algorithms. PLoS ONE 2016, 11, e0161344. [Google Scholar] [CrossRef] [PubMed] [Green Version]
- Price, O.; Bradstock, R. Countervailing effects of urbanization and vegetation extent on fire frequency on the Wildland Urban Interface: Disentangling fuel and ignition effects. Landsc. Urban Plan. 2014, 130, 81–88. [Google Scholar] [CrossRef]
- Syphard, A.D.; Radeloff, V.C.; Keeley, J.E.; Hawbaker, T.J.; Clayton, M.K.; Stewart, S.I.; Hammer, R.B. Human influence on California fire regimes. Ecol. Appl. 2007, 17, 1388–1402. [Google Scholar] [CrossRef]
- Alcasena, F.J.; Ager, A.A.; Bailey, J.D.; Pineda, N.; Vega-García, C. Towards a comprehensive wildfire management strategy for Mediterranean areas: Framework development and implementation in Catalonia, Spain. J. Environ. Manag. 2018, 231, 303–320. [Google Scholar] [CrossRef]
- Costafreda-Aumedes, S.; Comas, C.; Vega-Garcia, C. Human-caused fire occurrence modelling in perspective: A review. Int. J. Wildland Fire 2017, 26, 983–998. [Google Scholar] [CrossRef]
- Benali, A.; Sá, A.; Pinho, J.; Fernandes, P.; Pereira, J. Understanding the Impact of Different Landscape-Level Fuel Management Strategies on Wildfire Hazard in Central Portugal. Forests 2021, 12, 522. [Google Scholar] [CrossRef]
- Nunes, A.N. Regional variability and driving forces behind forest fires in Portugal an overview of the last three decades (1980–2009). Appl. Geogr. 2012, 34, 576–586. [Google Scholar] [CrossRef]
- Rodrigues, M.; Jiménez-Ruano, A.; de la Riva, J. Fire regime dynamics in mainland Spain. Part 1: Drivers of change. Sci. Total. Environ. 2019, 721, 135841. [Google Scholar] [CrossRef]
- Torres, F.; Fernandes, P.; Pinto, R.; Botelho, H.; Monzon, A. Regional livestock grazing, human demography and fire incidence in the Portuguese landscape. For. Syst. 2014, 23, 15. [Google Scholar] [CrossRef]
- Canadas, M.J.; Leal, M.; Soares, F.; Novais, A.; Ribeiro, P.F.; Schmidt, L.; Delicado, A.; Moreira, F.; Bergonse, R.; Oliveira, S.; et al. Wildfire mitigation and adaptation: Two locally independent actions supported by different policy domains. Land Use Policy 2023, 124, 106444. [Google Scholar] [CrossRef]
- Parente, J.; Pereira, M.; Amraoui, M.; Fischer, E. Heat waves in Portugal: Current regime, changes in future climate and impacts on extreme wildfires. Sci. Total. Environ. 2018, 631–632, 534–549. [Google Scholar] [CrossRef]
- Sarricolea, P.; Serrano-Notivoli, R.; Fuentealba, M.; Hernández-Mora, M.; de la Barrera, F.; Smith, P.; Meseguer-Ruiz, Ó. Recent wildfires in Central Chile: Detecting links between burned areas and population exposure in the wildland urban interface. Sci. Total. Environ. 2019, 706, 135894. [Google Scholar] [CrossRef] [PubMed]
- Sousa, P.M.; Trigo, R.M.; Pereira, M.G.; Bedia, J.; Gutiérrez, J.M. Different approaches to model future burnt area in the Iberian Peninsula. Agric. For. Meteorol. 2015, 202, 11–25. [Google Scholar] [CrossRef]
- Da Camara, C.C.; Pereira, M.G.; Calado, T.J.; Calheiros, T. Impacts of Climate Change on the Fire Regime in Portugal. In Advances in Forest Fire Research; Viegas, D.X., Ed.; Imprensa da Universidade de Coimbra: Coimbra, Portugal, 2014; pp. 1743–1748. [Google Scholar] [CrossRef]
- Bergonse, R.; Oliveira, S.; Gonçalves, A.; Nunes, S.; DaCamara, C.; Zêzere, J.L. Predicting burnt areas during the summer season in Portugal by combining wildfire susceptibility and spring meteorological conditions. Geomat. Nat. Hazards Risk 2021, 12, 1039–1057. [Google Scholar] [CrossRef]
- Silva, J.M.N.; Moreno, M.V.; Le Page, Y.; Oom, D.; Bistinas, I.; Pereira, J.M.C. Spatiotemporal trends of area burnt in the Iberian Peninsula, 1975–2013. Reg. Environ. Change 2018, 19, 515–527. [Google Scholar] [CrossRef]
- Pausas, J.G.; Fernández-Muñoz, S. Fire regime changes in the Western Mediterranean Basin: From fuel-limited to drought-driven fire regime. Clim. Change 2011, 110, 215–226. [Google Scholar] [CrossRef]
- Oliveira, S.; Zêzere, J.L.; Queirós, M.; Pereira, J.M. Assessing the social context of wildfire-affected areas. The case of mainland Portugal. Appl. Geogr. 2017, 88, 104–117. [Google Scholar] [CrossRef]
- Jiménez-Ruano, A.; Fernández, J.D.L.R.; Rodrigues, M. Fire regime dynamics in mainland Spain. Part 2: A near-future prospective of fire activity. Sci. Total. Environ. 2019, 705, 135842. [Google Scholar] [CrossRef]
- San-Miguel-Ayanz, J.; Durrant, T.; Boca, R.; Maianti, P.; Libertá, G.; Artés-Vivancos, T.; Oom, D.; Branco, A.; de Rigo, D.; Ferrari, D.; et al. Forest Fires in Europe, Middle East and North Africa 2019; Joint Research Centre, European Commission: Luxembourg, 2020. [Google Scholar] [CrossRef]
- Rodrigues, M.; Costafreda-Aumedes, S.; Comas, C.; Vega-García, C. Spatial stratification of wildfire drivers towards enhanced definition of large-fire regime zoning and fire seasons. Sci. Total. Environ. 2019, 689, 634–644. [Google Scholar] [CrossRef]
- Tonini, M.; Parente, J.; Pereira, M.G. Global assessment of rural–urban interface in Portugal related to land cover changes. Nat. Hazards Earth Syst. Sci. 2018, 18, 1647–1664. [Google Scholar] [CrossRef]
- Parente, J.; Pereira, M.G.; Tonini, M. Space-time clustering analysis of wildfires: The influence of dataset characteristics, fire prevention policy decisions, weather and climate. Sci. Total. Environ. 2016, 559, 151–165. [Google Scholar] [CrossRef]
- Gini, C. Measurement of Inequality of Incomes. Econ. J. 1921, 31, 124. [Google Scholar] [CrossRef]
- Miralles Ortega, R. Anàlisi Climàtica i Ambiental dels Incendis Forestals de Catalunya (1968–2008); Universitat de Barcelona: Barcelona, Spain, 2016. [Google Scholar]
- Royé, D.; Tedim, F.; Martin-Vide, J.; Salis, M.; Vendrell, J.; Lovreglio, R.; Bouillon, C.; Leone, V. Wildfire burnt area patterns and trends in Western Mediterranean Europe via the application of a concentration index. Land Degrad. Dev. 2019, 31, 311–324. [Google Scholar] [CrossRef]
- Loepfe, L.; Martinez-Vilalta, J.; Oliveres, J.; Piñol, J.; Lloret, F. Feedbacks between fuel reduction and landscape homogenisation determine fire regimes in three Mediterranean areas. For. Ecol. Manag. 2010, 259, 2366–2374. [Google Scholar] [CrossRef]
- Barreal, J.; Jannes, G. Spatial and Temporal Wildfire Decomposition as a Tool for Assessment and Planning of an Efficient Forest Policy in Galicia (Spain). Forests 2020, 11, 811. [Google Scholar] [CrossRef]
- R Core Team. R: A Language and Environment for Statistical Computing; R Foundation for Statistical Computing: Vienna, Austria, 2019; Available online: https://www.R-project.org/ (accessed on 21 April 2022).
- Wigtil, G.; Hammer, R.B.; Kline, J.D.; Mockrin, M.H.; Stewart, S.I.; Roper, D.; Radeloff, V.C. Places where wildfire potential and social vulnerability coincide in the coterminous United States. Int. J. Wildland Fire 2016, 25, 896–908. [Google Scholar] [CrossRef]
- Wickham, H. ggplot2: Elegant Graphics for Data Analysis, 2nd ed.; Springer: New York, NY, USA, 2016. [Google Scholar] [CrossRef]
- Bates, D.; Mächler, M.; Bolker, B.; Walker, S. Fitting Linear Mixed-Effects Models Using lme4. J. Stat. Softw. 2015, 67, 48. [Google Scholar] [CrossRef]
- Naimi, B.; Hamm, N.A.S.; Groen, T.A.; Skidmore, A.K.; Toxopeus, A.G. Where is positional uncertainty a problem for species distribution modelling? Ecography 2013, 37, 191–203. [Google Scholar] [CrossRef]
- Zuur, A.F.; Ieno, E.N.; Elphick, C.S. A protocol for data exploration to avoid common statistical problems. Methods Ecol. Evol. 2010, 1, 3–14. [Google Scholar] [CrossRef]
- Long, J.A. jtools: Analysis and Presentation of Social Scientific Data. 2020. Available online: https://cran.r-project.org/package=jtools (accessed on 2 May 2022).
- Tedim, F.; Leone, V.; Amraoui, M.; Bouillon, C.; Coughlan, M.R.; Delogu, G.M.; Fernandes, P.M.; Ferreira, C.; McCaffrey, S.; McGee, T.K.; et al. Defining Extreme Wildfire Events: Difficulties, Challenges, and Impacts. Fire 2018, 1, 9. [Google Scholar] [CrossRef]
- Liu, N.; Lei, J.; Gao, W.; Chen, H.; Xie, X. Combustion dynamics of large-scale wildfires. Proc. Combust. Inst. 2021, 38, 157–198. [Google Scholar] [CrossRef]
- García-Llamas, P.; Suárez-Seoane, S.; Taboada, A.; Fernández-Manso, A.; Quintano, C.; Fernández-García, V.; Fernández-Guisuraga, J.M.; Marcos, E.; Calvo, L. Environmental drivers of fire severity in extreme fire events that affect Mediterranean pine forest ecosystems. For. Ecol. Manag. 2018, 433, 24–32. [Google Scholar] [CrossRef]
- Mourão, P.R.; Martinho, V.D. The choices of the fire—Debating socioeconomic determinants of the fires observed at Portuguese municipalities. For. Policy Econ. 2014, 43, 29–40. [Google Scholar] [CrossRef]
- Vicente-Serrano, S.M.; Lopez-Moreno, I.; Beguería, S.; Lorenzo-Lacruz, J.; Sanchez-Lorenzo, A.; García-Ruiz, J.M.; Azorin-Molina, C.; Morán-Tejeda, E.; Revuelto, J.; Trigo, R.; et al. Evidence of increasing drought severity caused by temperature rise in southern Europe. Environ. Res. Lett. 2014, 9, 044001. [Google Scholar] [CrossRef]
- Pausas, J.G. Changes in Fire and Climate in the Eastern Iberian Peninsula (Mediterranean Basin). Clim. Change 2004, 63, 337–350. [Google Scholar] [CrossRef]
- Portela, M.; Espinosa, L.; Zelenakova, M. Long-Term Rainfall Trends and Their Variability in Mainland Portugal in the Last 106 Years. Climate 2020, 8, 146. [Google Scholar] [CrossRef]
- Santo, F.E.; de Lima, M.I.P.; Ramos, A.M.; Trigo, R.M. Trends in seasonal surface air temperature in mainland Portugal, since 1941. Int. J. Clim. 2013, 34, 1814–1837. [Google Scholar] [CrossRef]
- Meira Castro, A.C.; Nunes, A.; Sousa, A.; Lourenço, L. Mapping the Causes of Forest Fires in Portugal by Clustering Analysis. Geosciences 2020, 10, 53. [Google Scholar] [CrossRef] [Green Version]
- Curth, M.D.T.; Biscayart, C.; Ghermandi, L.; Pfister, G. Wildland–Urban Interface Fires and Socioeconomic Conditions: A Case Study of a Northwestern Patagonia City. Environ. Manag. 2012, 49, 876–891. [Google Scholar] [CrossRef]
- Canadas, M.J.; Novais, A. Bringing local socioeconomic context to the analysis of forest owners’ management. Land Use Policy 2014, 41, 397–407. [Google Scholar] [CrossRef]
- Baptista, F.O. O Espaço Rural: Declínio da Agricultura; Celta: Lisbon, Portugal, 2010. [Google Scholar]
- Rolo, J.C.; Cordovil, F. Rural, Agriculturas e Políticas; ANIMAR: Lisboa, Portugal, 2014. [Google Scholar]
- Radich, M.C.; Baptista, F.O. Terra e Agricultura: Século XX; 100LUZ: Lisboa, Portugal, 2021. [Google Scholar]
- Rodrigues, M.; Jiménez, A.; de la Riva, J. Analysis of recent spatial–temporal evolution of human driving factors of wildfires in Spain. Nat. Hazards 2016, 84, 2049–2070. [Google Scholar] [CrossRef]
- Barbero, R.; Curt, T.; Ganteaume, A.; Maillé, E.; Jappiot, M.; Bellet, A. Simulating the effects of weather and climate on large wildfires in France. Nat. Hazards Earth Syst. Sci. 2019, 19, 441–454. [Google Scholar] [CrossRef]
- Turco, M.; von Hardenberg, J.; AghaKouchak, A.; Llasat, M.C.; Provenzale, A.; Trigo, R.M. On the key role of droughts in the dynamics of summer fires in Mediterranean Europe. Sci. Rep. 2017, 7, 81. [Google Scholar] [CrossRef] [PubMed]
- Parente, J.; Amraoui, M.; Menezes, I.; Pereira, M. Drought in Portugal: Current regime, comparison of indices and impacts on extreme wildfires. Sci. Total. Environ. 2019, 685, 150–173. [Google Scholar] [CrossRef] [PubMed]
- Ruffault, J.; Curt, T.; Martin-StPaul, N.K.; Moron, V.; Trigo, R.M. Extreme wildfire events are linked to global-change-type droughts in the northern Mediterranean. Nat. Hazards Earth Syst. Sci. 2018, 18, 847–856. [Google Scholar] [CrossRef]
- Bergons, R.; Oliveira, S.; Gonçalves, A.; Nunes, S.; da Câmara, C.; Zêzere, J.L. A combined structural and seasonal approach to assess wildfire susceptibility and hazard in summertime. Nat. Hazards 2021, 106, 2545–2547. [Google Scholar] [CrossRef]
- Duane, A.; Brotons, L. Synoptic weather conditions and changing fire regimes in a Mediterranean environment. Agric. For. Meteorol. 2018, 253–254, 190–202. [Google Scholar] [CrossRef]
- Moreira, F.; Vaz, P.; Catry, F.; Silva, J. Regional variations in wildfire susceptibility of land-cover types in Portugal: Implications for landscape management to minimize fire hazard. Int. J. Wildland Fire 2009, 18, 563–574. [Google Scholar] [CrossRef]
- Bistinas, I.; Harrison, S.P.; Prentice, I.C.; Pereira, J.M.C. Causal relationships versus emergent patterns in the global controls of fire frequency. Biogeosciences 2014, 11, 5087–5101. [Google Scholar] [CrossRef]
- Andela, N.; Morton, D.C.; Giglio, L.; Chen, Y.; van der Werf, G.R.; Kasibhatla, P.S.; DeFries, R.S.; Collatz, G.J.; Hantson, S.; Kloster, S.; et al. A human-driven decline in global burned area. Science 2017, 356, 1356–1362. [Google Scholar] [CrossRef]
- Calviño-Cancela, M.; Chas-Amil, M.L.; García-Martínez, E.D.; Touza, J. Interacting effects of topography, vegetation, human activities and wildland-urban interfaces on wildfire ignition risk. For. Ecol. Manag. 2017, 397, 10–17. [Google Scholar] [CrossRef]
- Nunes, M.C.; Vasconcelos, M.J.; Pereira, J.M.; Dasgupta, N.; Alldredge, R.J.; Rego, F.C. Land Cover Type and Fire in Portugal: Do Fires Burn Land Cover Selectively? Landsc. Ecol. 2005, 20, 661–673. [Google Scholar] [CrossRef]
- Marques, S.; Borges, J.G.; Garcia-Gonzalo, J.; Moreira, F.; Carreiras, J.; Oliveira, M.; Cantarinha, A.; Botequim, B.; Pereira, J.M.C. Characterization of wildfires in Portugal. Eur. J. For. Res. 2011, 130, 775–784. [Google Scholar] [CrossRef]
- Lomba, A.; Moreira, F.; Klimek, S.; Jongman, R.H.; Sullivan, C.; Moran, J.; Poux, X.; Honrado, J.P.; Pinto-Correia, T.; Plieninger, T.; et al. Back to the future: Rethinking socioecological systems underlying high nature value farmlands. Front. Ecol. Environ. 2019, 18, 36–42. [Google Scholar] [CrossRef] [Green Version]


| Variable | Description | First Period (1975–1995) | Second Period (1996–2018) |
|---|---|---|---|
| Total burned percentage | Total accumulated burned area expressed as % of the parish area. | 49.3/58.1 (0.1–259.3) | 73.8/80.1 (0.3–329.5) |
| Gini | Gini index of the yearly distribution of the total burned area | 81.5/81.1 (58.8–95.2) | 87.7/85.4 (53.9–95.7) |
| Mean times burned | Average number of years a pixel inside the parish was burned | 0.49/0.58 (0.0–2.6) | 0.74/0.80 (0.0–3.3) |
| Max times burned | Maximum number of years a pixel inside the parish was burned | 3/3.5 (1.0–8.0) | 3/3.6 (1.0–10.0) |
| Prop years 25% | Proportion of years that a parish burned over 25% of its area | 0/0.02 (0.0–0.24) | 0.04/0.04 (0.0–0.22) |
| Prop years 50% | Proportion of years that a parish burned over 50% of its area | 0/0.0 (0.0–0.14) | 0/0.02 (0.0–0.13) |
| Prop years 75% | Proportion of years that a parish burned over 75% of its area | 0/0.0 (0.0–0.05) | 0/0.01 (0.0–0.09) |
| Variable Name | First Period (1975–1995) | Second Period (1996–2018) |
|---|---|---|
| Population density (inhabitants/km2) | 45.1 (7.4–810.6) | 35.3 (4.2–741.1) |
| Proportion of area covered by farmland (%) | 26.4 (1.8–79.3) | 22.4 (0.7–75.3) |
| Proportion of area covered by plantations (%) | 41.5 (0–92.2) | 39.1 (0–88.8) |
| Proportion of area covered by natural vegetation (%) | 24.8 (0.6–79.8) | 28.9 (0.9–91.3) |
| Variable | PC1 | PC2 |
|---|---|---|
| Total burned percentage | 0.98 | −0.05 |
| Gini | −0.29 | 0.88 |
| Mean times burned | 0.98 | −0.06 |
| Max times burned | 0.64 | −0.67 |
| Prop years 25% | 0.83 | 0.17 |
| Prop years 50% | 0.70 | 0.56 |
| Prop years 75% | 0.46 | 0.59 |
| Explained variance (%) | 53.9 | 27.4 |
| LULC Classes | First Period (1975–1995) | Second Period (1996–2018) | |||||||||
|---|---|---|---|---|---|---|---|---|---|---|---|
| LULC Area | Burned Areas | LULC Area | Burned Areas | ||||||||
| ha | % | ha | % of Total | % of LULC Area | ha | % | ha | % of Total | % of LULC Area | ||
| Farmland | 368,570 | 24.2 | 70,940 | 8.1 | 19.2 | 308,420 | 20.2 | 98,370 | 8.0 | 31.9 | |
| Plantations | 675,590 | 44.3 | 363,190 | 41.4 | 53.8 | 650,840 | 42.7 | 520,480 | 42.1 | 80.0 | |
| Natural vegetation | Oak forests | 148,650 | 9.8 | 92,410 | 10.5 | 62.2 | 202,060 | 13.3 | 130,780 | 10.6 | 64.7 |
| Scrubland | 281,860 | 18.5 | 338,950 | 38.7 | 120.3 | 298,250 | 19.6 | 468,680 | 37.9 | 157.1 | |
| Total (study area) | 1,524,190 | 100 | 876,510 | 100 | 57.5 | 1,524,190 | 100 | 1,237,020 | 100 | 81.2 | |
| Variable | F-Value | Significance |
|---|---|---|
| prop_naturalveg | 174.2 | <0.0001 |
| log_pop_dens:period | 7.00 | 0.0083 |
| period:prop_farmland | 7.48 | 0.0064 |
| Variable | F-Value | Significance |
|---|---|---|
| period:prop_naturalveg | 13.1 | 0.0003 |
| period:prop_farmland | 21.6 | <0.0001 |
Disclaimer/Publisher’s Note: The statements, opinions and data contained in all publications are solely those of the individual author(s) and contributor(s) and not of MDPI and/or the editor(s). MDPI and/or the editor(s) disclaim responsibility for any injury to people or property resulting from any ideas, methods, instructions or products referred to in the content. |
© 2023 by the authors. Licensee MDPI, Basel, Switzerland. This article is an open access article distributed under the terms and conditions of the Creative Commons Attribution (CC BY) license (https://creativecommons.org/licenses/by/4.0/).
Share and Cite
Moreira, F.; Leal, M.; Bergonse, R.; Canadas, M.J.; Novais, A.; Oliveira, S.; Ribeiro, P.F.; Zêzere, J.L.; Santos, J.L. Recent Trends in Fire Regimes and Associated Territorial Features in a Fire-Prone Mediterranean Region. Fire 2023, 6, 60. https://doi.org/10.3390/fire6020060
Moreira F, Leal M, Bergonse R, Canadas MJ, Novais A, Oliveira S, Ribeiro PF, Zêzere JL, Santos JL. Recent Trends in Fire Regimes and Associated Territorial Features in a Fire-Prone Mediterranean Region. Fire. 2023; 6(2):60. https://doi.org/10.3390/fire6020060
Chicago/Turabian StyleMoreira, Francisco, Miguel Leal, Rafaello Bergonse, Maria João Canadas, Ana Novais, Sandra Oliveira, Paulo Flores Ribeiro, José Luís Zêzere, and José Lima Santos. 2023. "Recent Trends in Fire Regimes and Associated Territorial Features in a Fire-Prone Mediterranean Region" Fire 6, no. 2: 60. https://doi.org/10.3390/fire6020060
APA StyleMoreira, F., Leal, M., Bergonse, R., Canadas, M. J., Novais, A., Oliveira, S., Ribeiro, P. F., Zêzere, J. L., & Santos, J. L. (2023). Recent Trends in Fire Regimes and Associated Territorial Features in a Fire-Prone Mediterranean Region. Fire, 6(2), 60. https://doi.org/10.3390/fire6020060