Article

Analysis of Flow Field Characteristics of the Propane Jet Combustion Flame

College of Power Engineering, Naval University of Engineering, Wuhan 430030, China
*
Author to whom correspondence should be addressed.
Fire 2023, 6(12), 464; https://doi.org/10.3390/fire6120464
Submission received: 9 November 2023 / Revised: 3 December 2023 / Accepted: 5 December 2023 / Published: 7 December 2023
(This article belongs to the Special Issue Combustion Diagnostics)

Abstract

:
In order to effectively prevent fire accidents and improve fire management capability, this paper describes the independent designs and builds of an experimental low-cost particle image velocimetry platform for a propane jet combustion flame using traditional mutual correlation theory. The particle image velocimetry (PIV) algorithm is written based on MATLAB software, allowing it to realise image preprocessing, multi-level grid window deformation inter-correlation calculations, and other functions. Fluid flow velocity and vorticity are used as entry points to study the flame combustion mechanism. The air flow field and vorticity above the propane jet flame are analysed. The results show that, from the level of fluid flow velocity, the maximum fluid flow velocity in the test area does not exceed 0.23 m/s, and the maximum transverse fluid flow velocity is close to 0.15 m/s. Additionally, the longitudinal fluid flow velocity is opposite the upper and lower portions of the longitudinal flow velocity, and there is a swirling phenomenon in the propane flame jet. From the vorticity level, the closer to the centre of the jet in the vortex plane, the faster the air flow speed, and simultaneously, in the upper and lower parts of the vortex, the air flow travels in the opposite direction and is of equal size. The particle image velocimetry platform that was independently designed in this study can efficiently characterise the dynamic flow field and the flow characteristics of complex combustion chambers, simultaneously ensuring high efficiency and reducing research costs. It provides a measurement method and experimental basis for the development of fire extinguishing equipment and numerical simulation, while also helping us to carry out a series of subsequent studies on fire extinguishing mechanisms.

1. Introduction

According to the 28th report of the World Centre for Fire Statistics (CTIF) [1], the number of fires around the world is significant, resulting in a large number of deaths and injuries. Worldwide, more than 1.1 million people were victims of 104 million fires in the last 28 years. China’s State Fire and Rescue Administration (SFRA) released fire statistics [2] that showed that the number of reported fires and the number of injured in China in the first half of 2023 rose by 19.9 percent and 9.3 percent, respectively, compared with the same period in 2022. Fire accidents are dangerous, difficult to prevent, and one of the most common disasters that threaten personal safety and hinder social development. Fire safety must be taken seriously; all fire safety accidents should be prevented, and fire management capacity should be improved. Fire strategy must be an important part of risk management and disaster risk reduction strategies in every country. Therefore, it is of great significance to provide scientific support for fire prevention and management through the study of flame combustion mechanisms.
The combustion state of the flame is not only an important index to measure fire extinguishing efficiency, but also an indispensable index to study the flame combustion process. The combustion state of the flame can be found by measuring the parameters of the flame combustion process [3], including flow rate, vorticity, temperature, etc. Therefore, the flame combustion parameter is taken as the starting point to study the flame combustion mechanism, and studying the measurement method of the flow rate in the flame combustion parameter can provide a scientific explanation for how to effectively control the fire.
There are various ways to measure fluid flow velocity. Raffel et al. [4] classified these ways into two categories: intrusive and non-intrusive methods, as shown in Figure 1. Intrusive methods refer to when the probe, including hot-wire probes and pitot tubes, etc., is placed directly in the fluid flow and the fluid velocity measurement is taken at a single point; non-intrusive methods refer to when the fluid velocity measurement is taken without interfering with the fluid flow. The indirect, non-intrusive methods include particle image velocimetry (PIV) [5], particle tracking velocimetry (PTV) [6], laser Doppler velocimetry (LDV) [7], etc. The early use of intrusive methods for contact measurements [8] has been mostly replaced by the laser Doppler velocimetry (LDV) method [8]. LDV [9], as a non-invasive measurement method, uses a photodetector to circumvent the need to measure the velocity of the fluid by measuring the velocity of a particle. Although the use of photodetectors avoids the interference of the flow field being measured and can test the flow velocity at a point with high test accuracy, LDV technology cannot measure the global flow field. Like LDV, the PTV technique [10] is essentially a single-point measurement and is only applicable to sparse velocity fields. PIV, on the other hand, serves as a quantitative method for indirect flow field mapping and is not only a non-contact measurement process, but also determines many instantaneous velocity vectors in the measurement area simultaneously, which is global in nature.
PIV technology was first proposed by Adrian [11] in the 1980s. PIV is an optical measurement technology that measures the velocity field by recording the motion of tracer particles carried by the moving fluid. Under ideal conditions, the tracer particles are small and have neutral buoyancy, and the movement trajectory of the tracer particles is highly consistent with the fluid flow during the experiment. The distribution of the tracer particles at different times is recorded by a charge-coupled device digital camera (CCD), and the real velocity of the fluid is obtained by a post-processing algorithm to determine the displacement of the particles in two consecutive frames. Over the past 40 years, with the continuous progress of tracer particles, light sources, recording systems, algorithms, computer computing power, and resolution, PIV technology has been widely used in various fields of fluid research [12]. Chen et al. [13] adopted high-speed schlieren visualisation and phase-locked PIV technology to study the flow fields generated by different frequency acoustic excitations and discovered that they have different degrees of influence on the mode and brightness of the diffusion flame. Wang [14] used PIV technology to find the velocity of the combustion field in a combustion chamber and found that the laser energy, cross-frame time, and other factors affected the experimental results. The problems of tracer particle input and flame luminescent dry data processing in PIV were solved. Wang et al. [15] corrected the PIV fidelity and reduced measurement error using a pressure correction scheme.
In recent years, researchers and scholars have conducted studies to obtain more accurate and efficient laser diagnostic imaging techniques. Planar laser-induced fluorescence (PLIF), an important flow measurement technique, can reveal the turbulence mechanism, which is crucial for detecting the position of the interface between two turbulent fluids. The PLIF technique is mostly used to study turbulent background fluid and is mostly used in the fields of fuel and combustion product concentration. Verdier et al. [16] combined PLIF with the instantaneous global rainbow technique (GRT) to measure droplet temperatures in different regions of the jet flame, providing a basis for the study of the thermal properties of fuel droplets. The laser-induced incandescent illumination (LII) technique obtains information on the concentration and size of the measured particles by detecting the radiant energy emitted by the particles over a very short period of time after the laser heating. Meyer et al. [17] demonstrated the feasibility of this method by combining PLIF and droplet Mie scattering with the LII technique to study the flame structure and soot formation process. Laser-induced fluorescence (LIF) has certain limitations when determining how to select the tracer and match the excitation light wavelength, both of which need to be evaluated according to the actual situation. Hiromasa et al. [18] used PIV and LIF techniques to evaluate the turbulence and the mixing of surrounding fluids to measure the velocity field and thermal field of two parallel planar jets, and the physical fluency was discussed. The laser absorption scattering (LAS) technique is more complex and requires calibration before use. Calculations need to assume that the measurement object is an axisymmetric rotating body. When there is a large error rate, the technique has the advantage of being able to obtain liquid and gas phase measurements simultaneously. Safiullah et al. [19] used LAS to investigate spray from the injector, and the results showed that the LAS method is helpful in visualising the gas phase. The PIV technique is more mature and can realise flow field combustion characterisation, and the measurement accuracy and resolution rates for this method are high, so in this study, the PIV technique is selected as the research basis used to carry out the experimental study.
Researchers have conducted a great deal of visualisation measurement research based on PIV technology, but at this stage, the research applying PIV technology to measure the flow field in combustion chambers is still limited to experiments on the cold flow field or simple structure of the combustion chamber. The use of PIV on the dynamic flow field and complex combustion chamber combustion measurements is decreasing, and traditional PIV equipment is expensive, cannot achieve universal use, and has poor experimental economy. Therefore, this study utilises the basic principles of PIV technology and builds a low-cost PIV experimental platform for a propane combustion flame based on the mutual correlation algorithm. By measuring the flow velocity and vorticity of the air flow field above the propane jet combustion flame, the motion law of the air flow field above it is analysed to achieve visualisation. In order to prove the accuracy of the PIV experimental platform designed in this study, the flow field characterisation of propane combustion was carried out, and the visualisation of flow velocity and vorticity during propane combustion was realised. This work provides an experimental basis for the study of the fire extinguishing mechanism and the development of fire extinguishing equipment, while also providing an experimental basis for effective fire management.

2. Experimental Setup and Methods

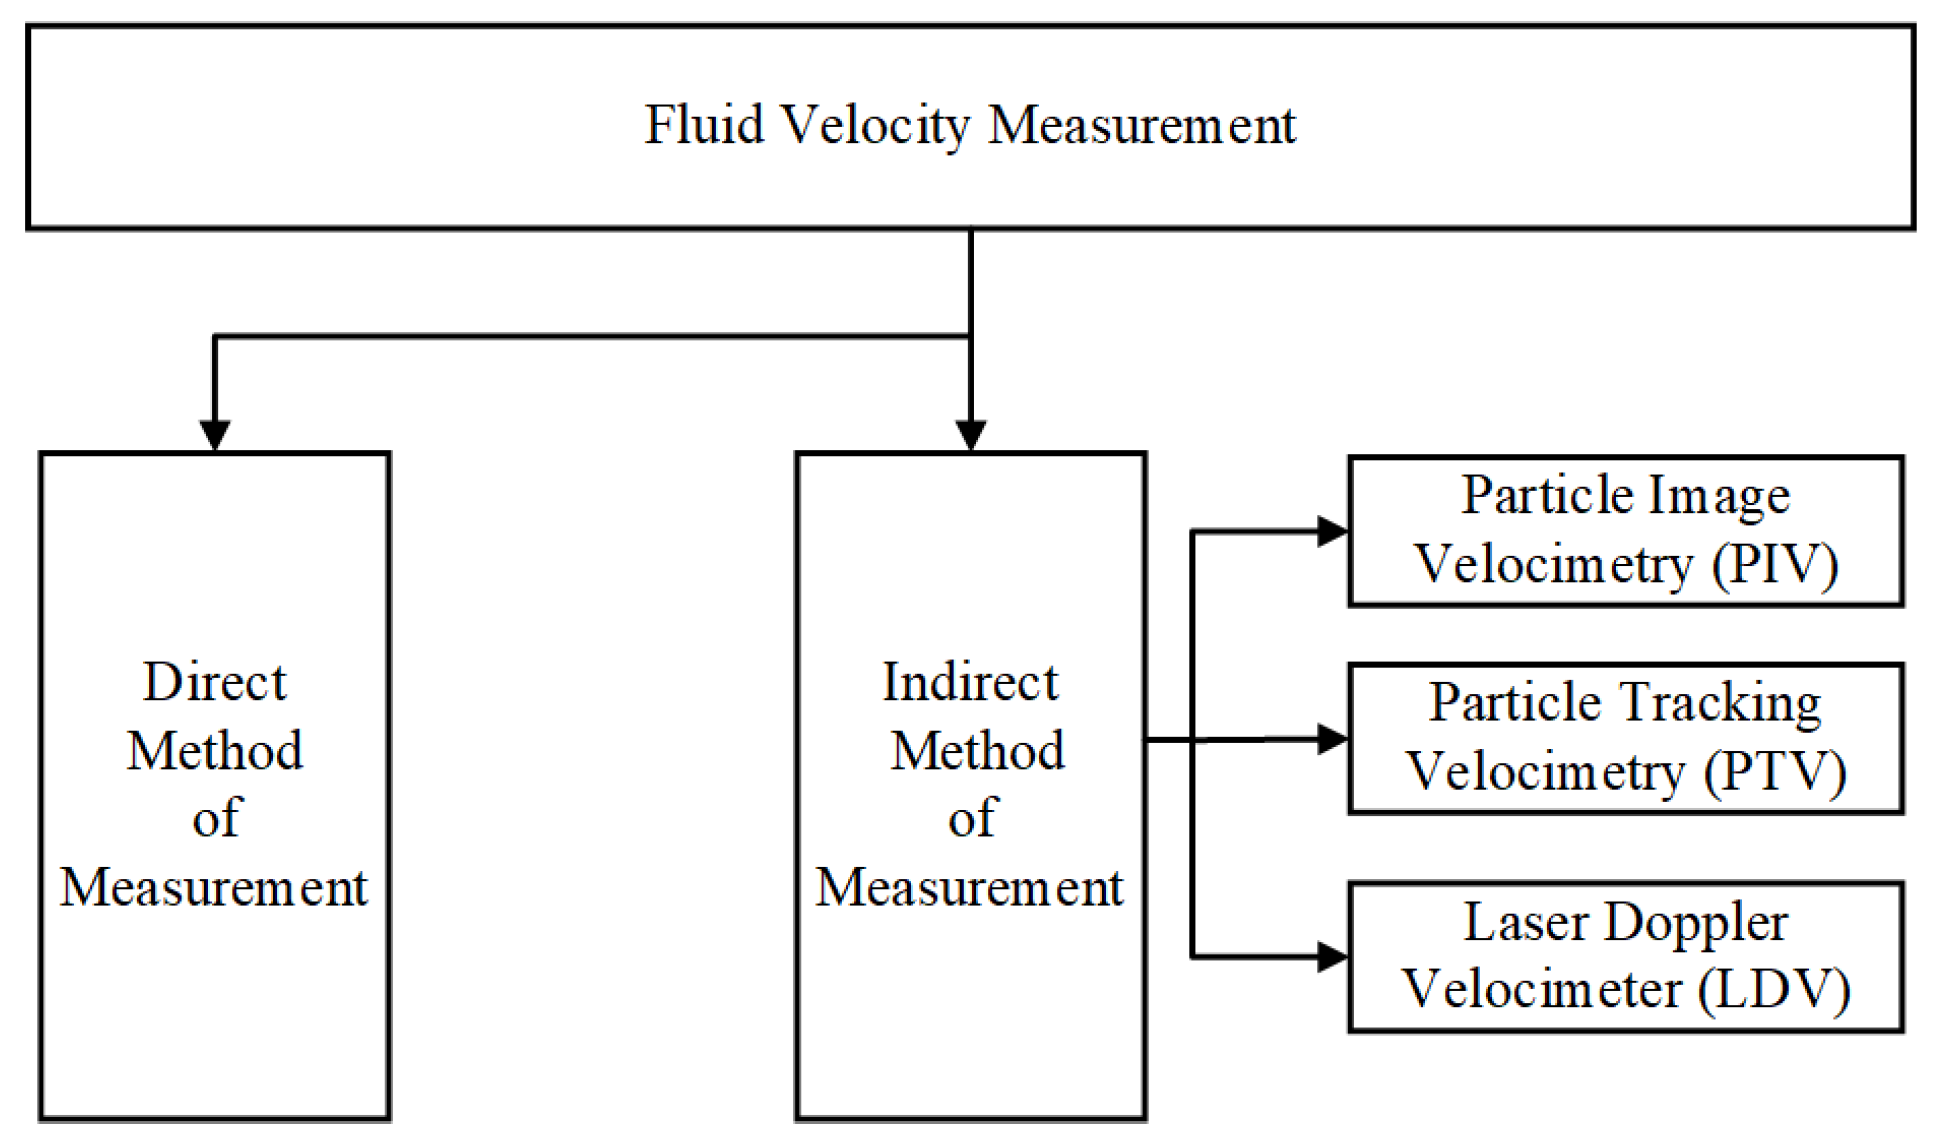
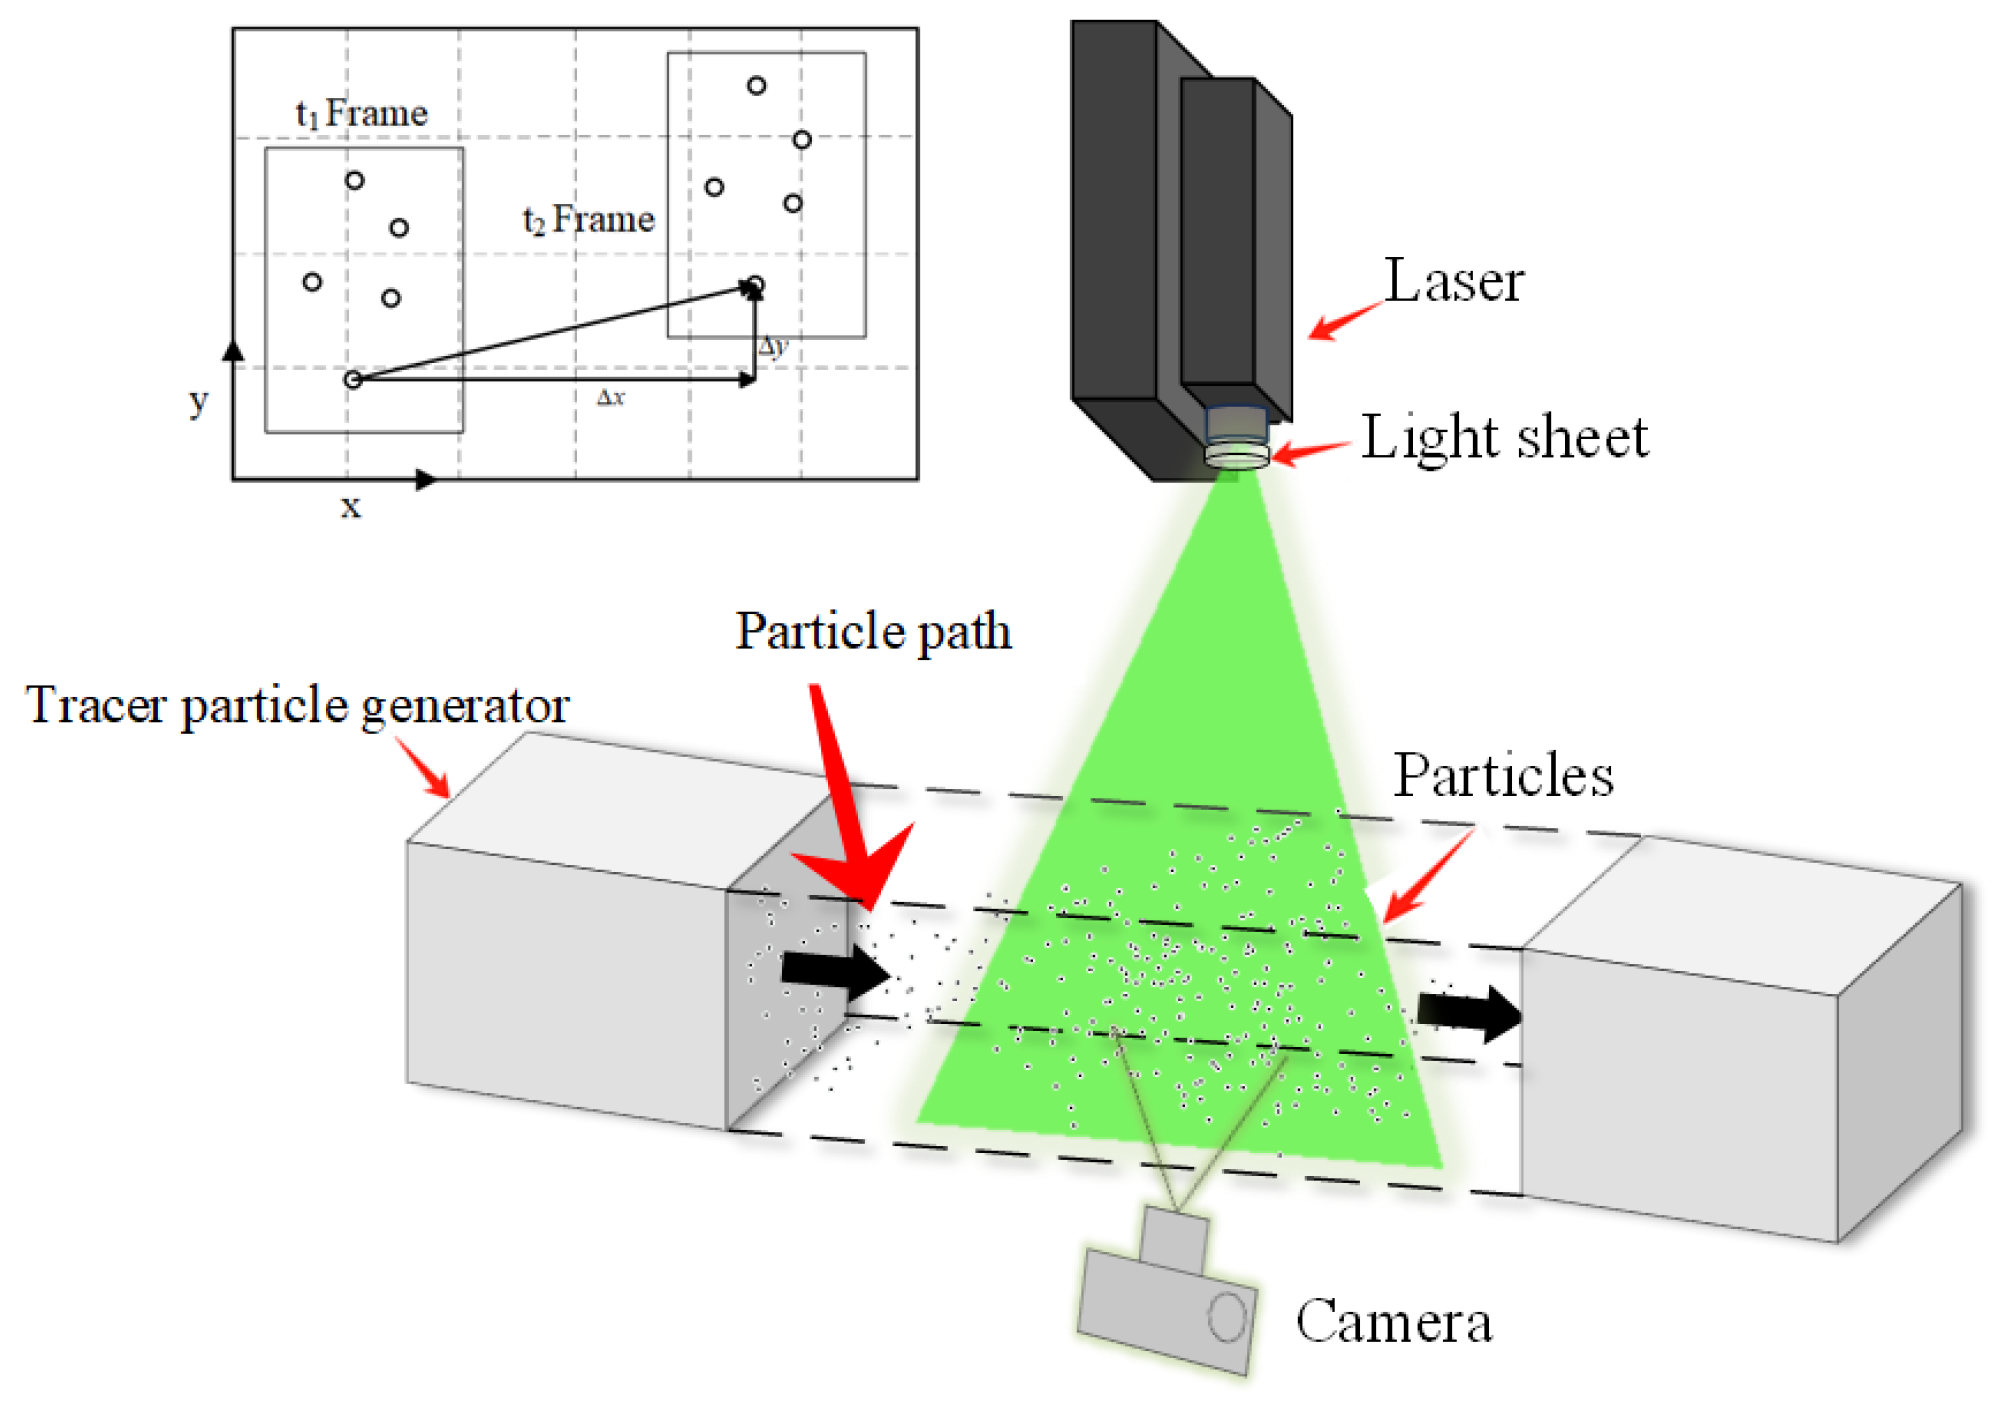
2.1. Basic Principles of PIV Technology

PIV is a method of measuring tracer particles that have been seeded in the flow field and estimating the flow field velocity by analysing the particles’ trajectory. Before measuring the velocity of the flow field, tracer particles with good followability and scattering should be evenly distributed in the flow field. When measuring the velocity of the flow field, the lamellar light source formed by the laser is used to illuminate the flow field, and the illuminated particles scatter the laser. At the same time, the CCD camera lens is placed perpendicular to the cross section of the flow field illuminated by the lamellar light source, and two frames of particle images are recorded over a very short time interval to obtain the global particle distribution map in the entire area at the two moments in time [20]. The flow field captured by the CCD camera is a two-dimensional plane. If the particle moves in the x o y coordinate plane, the displacement x ( t ) and y ( t ) are functions of time [21], and the particle’s velocity can be expressed as follows:
{ u x = d x d t x ( t 1 ) x ( t 2 ) Δ t = u x ¯ u y = d y d t y ( t 1 ) y ( t 2 ) Δ t = u y ¯
where t 2 = t 1 + Δ t , Δ t is the time interval between the two frames of the image, u x , u y is the instantaneous velocity of the particle in the plane, and u x ¯ , u y ¯ is the average velocity of the particle in the plane. When Δ t is small enough, the average velocity can be used to reflect the instantaneous velocity of the flow field through the instantaneous velocities of the tracer particles.
The laser shines vertically downward, emitting light rays, and the particle generator emits tracer particles from left to right. The camera is positioned perpendicular to the laser and in the centre of the particle generator. The schematic diagram of the PIV principle is shown in Figure 2.

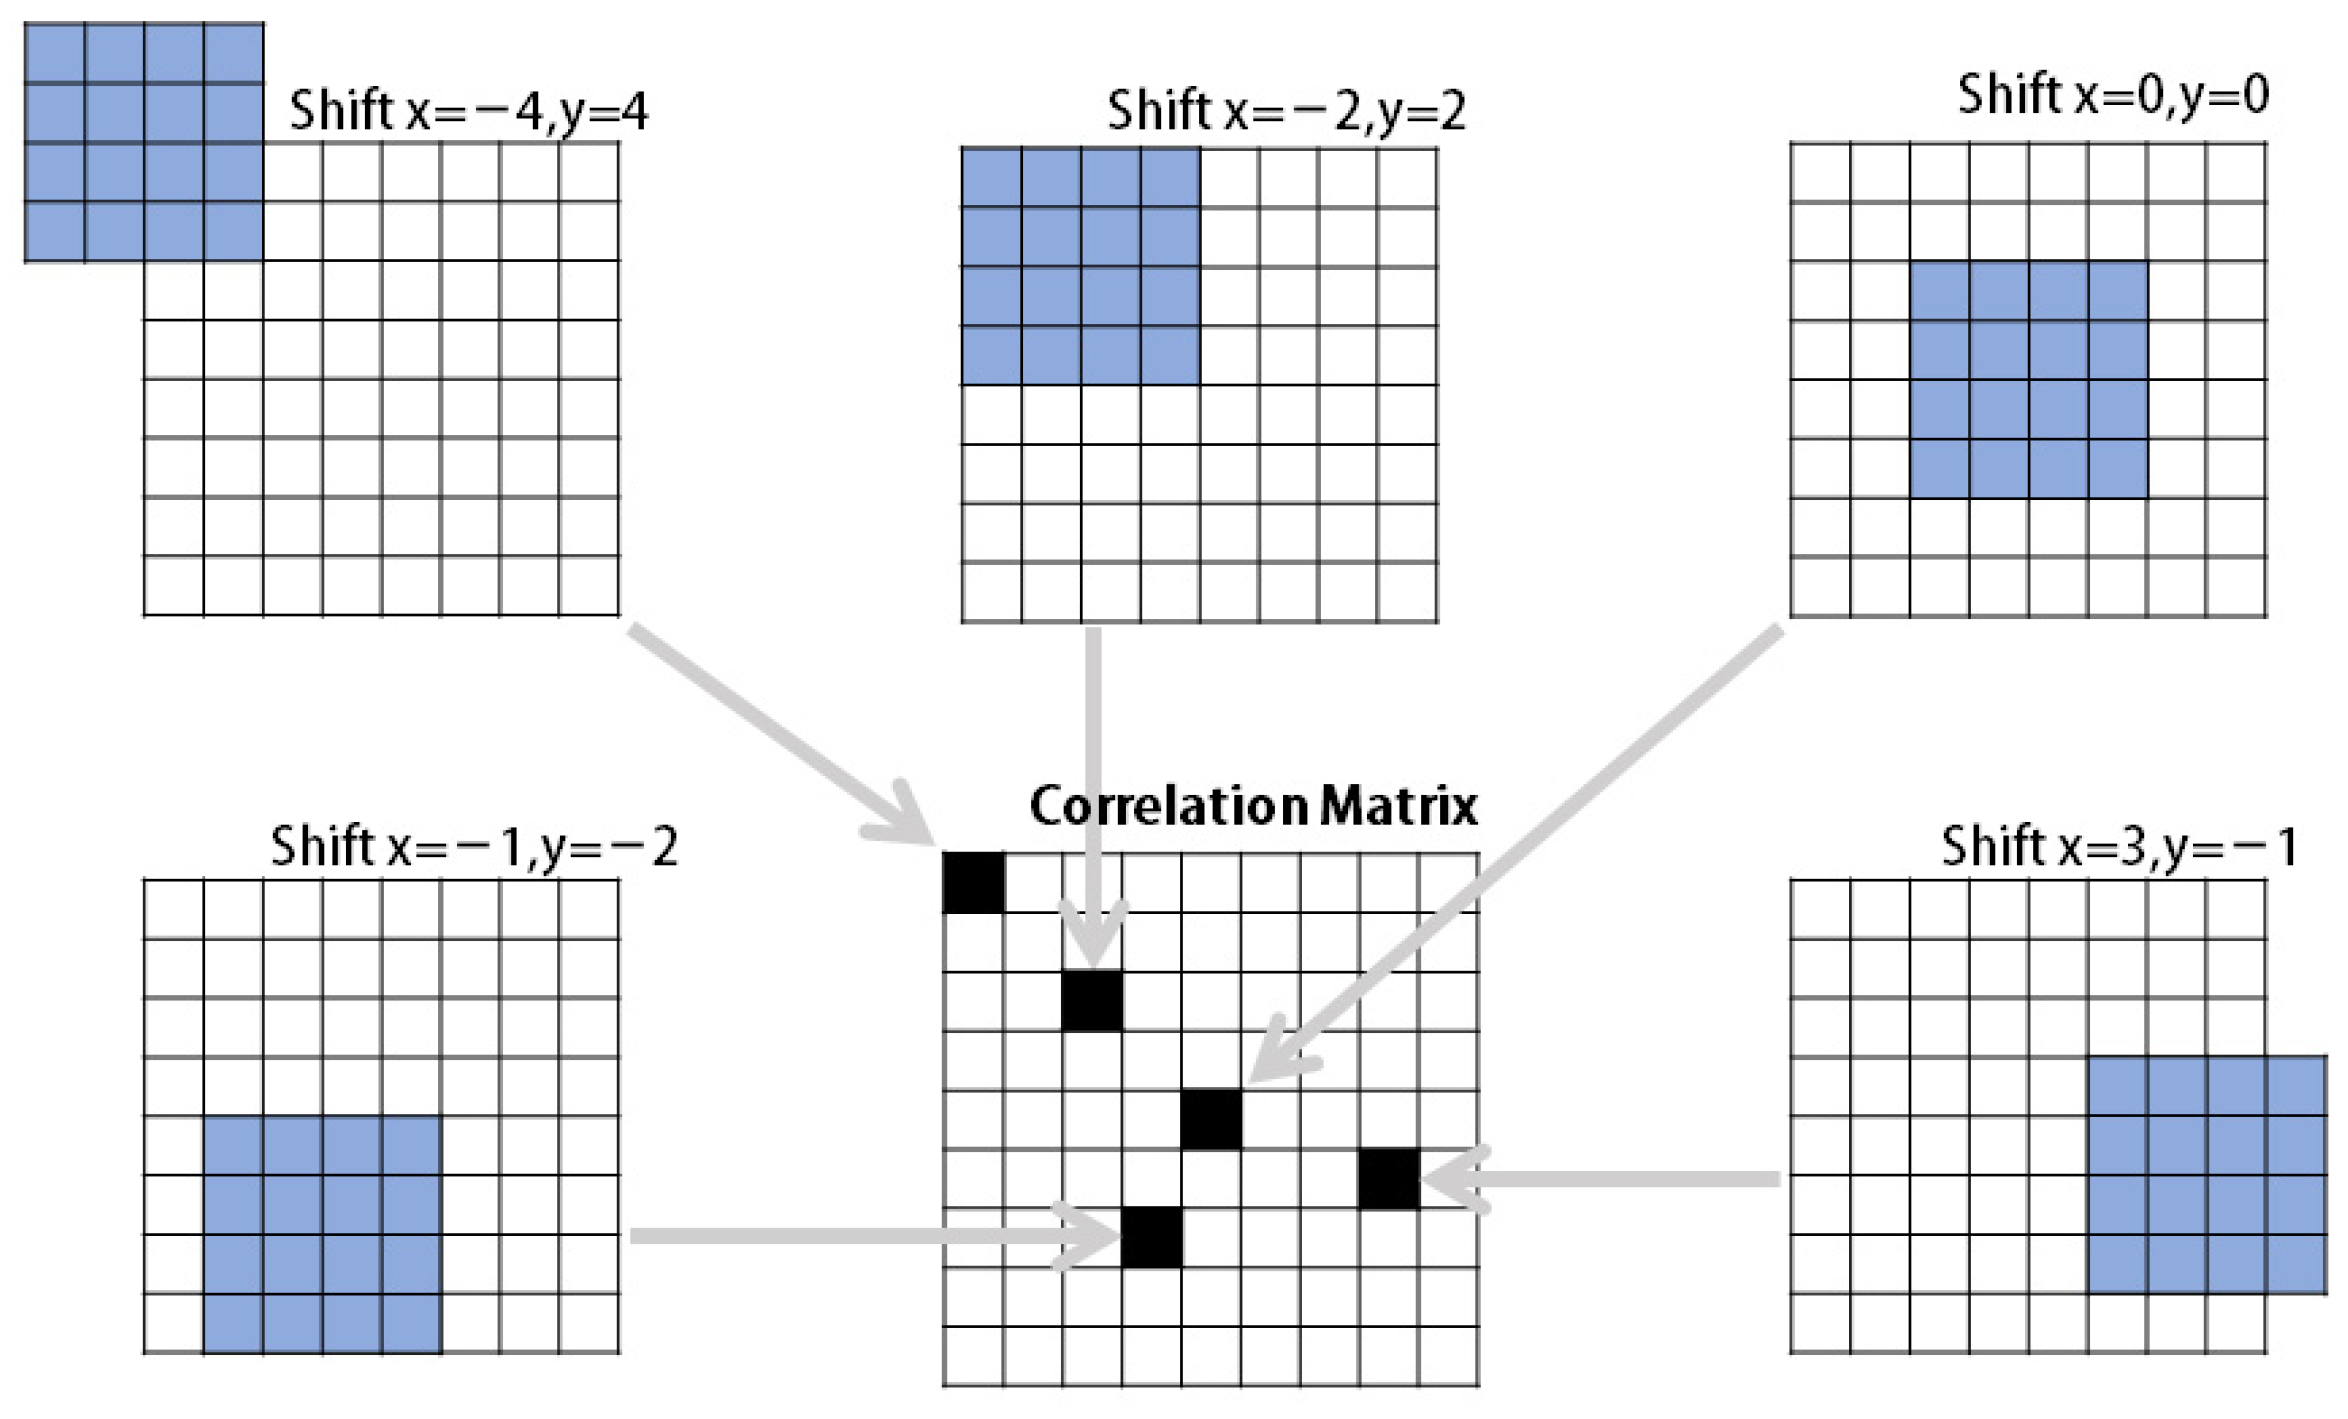
2.2. Cross-Correlation Theory

When the particle image is transformed into a grayscale image, the image can be regarded as a two-dimensional distribution pattern. In order to enable the collected images to have sufficient flow field information, the experiment requires that the tracer particles dispersed in the flow field have the characteristics of small particle size and high concentration. As a result, it is difficult to distinguish the movement of the same particle from the high-density particle pictures obtained in the image acquisition stage with the naked eye, and thus the relative displacement of particles between the pictures cannot be obtained. This problem can be easily solved [22,23]. This study adopts the method of single exposure/double frame to achieve the PIV measurement, and the particle displacement estimation is mainly based on the two-dimensional cross-correlation algorithm of numerical calculation. The schematic diagram of the workflow is shown in Figure 3.
In order to improve measurement accuracy, the cross-correlation algorithm [24,25] is adopted to expand the search area, doubling the size of the search area query window. Therefore, the particle displacement of half the size of the query window is also calculated, which prevents information loss and improves the reliability of the correlation matrix, as shown in Figure 4.
The autocorrelation function of a two-dimensional continuous signal f ( x , y ) in inter-correlation theory can be expressed as follows:
R f ( τ x , τ y ) = f ( x , y ) f ( x τ x , y τ y ) d x d y
For different two-dimensional continuous signals g ( x , y ) , the correlation function with f ( x , y ) is as follows:
R f g ( τ x , τ y ) = f ( x , y ) g ( x τ x , y τ y ) d x d y
The common properties of the two-dimensional autocorrelation function are as follows:
R f ( τ x , τ y ) R f ( 0 , 0 )
A signal g ( x , y ) = f ( x + Δ x , y + Δ y ) that lags behind Δ x and Δ y in phase is brought into Equation (3), using the nature of the cross-correlation function; then, A < B.
The phase difference between the two signals f and g can be found by searching for the maximum correlation peak in the two-dimensional plane space, so the following mathematical optimisation model can be outlined:
( Δ x ^ , Δ y ^ ) = a r g ( τ x , τ y ) m a x R f g ( τ x , τ y ) R f g ( τ x , τ y ) = f ( x , y ) g ( x τ x , y τ y ) d x d y
where R f g ( τ x , τ y ) is the mutual correlation function of two two-dimensional signals and ( Δ x ^ , Δ y ^ ) is the estimated value of the phase difference between the two signals. We can show that if two signals are similar, then the peak value of their mutual correlation function is the phase difference.
It is assumed that within the time interval Δ t = t 2 t 1 , the particle displacement corresponding to the query window area of the two frames before and after is ( Δ x , Δ y ) , the sampled signal of the first frame image query window is I 1 ( x , y ) = I ( x , y ) + n 1 ( x , y ) , and the sampled signal of the second frame image query window is I 2 ( x , y ) = I ( x + Δ x , y + Δ y ) + n 2 ( x , y ) , where n 1 ( x , y ) and n 2 ( x , y ) are errors caused by particle motion, camera, laser, and environmental interference, etc., resulting in attenuation of the real particle image signal. Assuming that the noise n 1 ( x , y ) and n 2 ( x , y ) are not statistically correlated with the real signal, the image correlation function can be expressed as follows:
R 12 ( τ x , τ y ) = I 1 ( x , y ) I 2 ( x τ x , y τ y ) d x d y = I ( x , y ) I [ x ( τ x Δ x ) , y ( τ y Δ y ) ] d x d y
Since the picture is a two-dimensional discrete signal, the cross-correlation function can be written in discrete form:
R 12 ( τ x , τ y ) = x = K K y = L L [ I ( x , y ) ] { I [ x ( τ x Δ x ) , y ( τ y Δ y ) ] }
And it can be converted to a two-dimensional autocorrelation function:
R 12 ( τ x , τ y ) = R ( τ x Δ x , τ y Δ y )
From the property of the autocorrelation function, we can see that the maximum value is obtained at the origin, which is R ( τ x Δ x , τ y Δ y ) R ( 0 , 0 ) , and is written in the form of a cross-correlation function as follows:
R 12 ( τ x , τ y ) R 12 ( Δ x , Δ y )
where ( τ x , τ y ) is the displacement that determines the relative position of the first frame query window and the second frame query, and R 12 ( τ x , τ y ) is a cross-correlation value formed by summing the products of the pixel signal intensities in the two query windows to determine this positional relationship. When the first frame of the query window appears in the part of the second frame of the particle image after panning, the value of the correlation function R 12 reaches the peak value, and its corresponding coordinate represents the displacement of the query window ( Δ x , Δ y ) , which can be obtained to represent the trajectory of the particles in the region of the query window. Then, according to the known time interval between the two frames of the image Δ t , the speed of these particles can be calculated, and the flow rate measurement can be completed.
As the interval time is determined, narrowing the query window will lead to the particle pair matching loss problem, which greatly limits the further narrowing of the query window. To solve this problem, a window deformation algorithm with multi-level grid iteration is used, which solves the problem of the particle in-plane to a certain extent and improves the accuracy and spatial resolution of the velocity field. Multiple mutual correlation iteration calculations are carried out during the displacement estimation, and each round of iterations narrows the query window size. The small-sized query window is brought into the next round of mutual correlation operations so as to refine the grid of the segmented image continuously. After each iteration, the accuracy and spatial resolution of the displacement field will be improved until the number of iterations is reached. In this study, the query window was set to three iteration sizes, and the measurement accuracy and spatial resolution of the original displacement field were significantly improved.
The operation flow chart of the algorithm is shown in Figure 5.

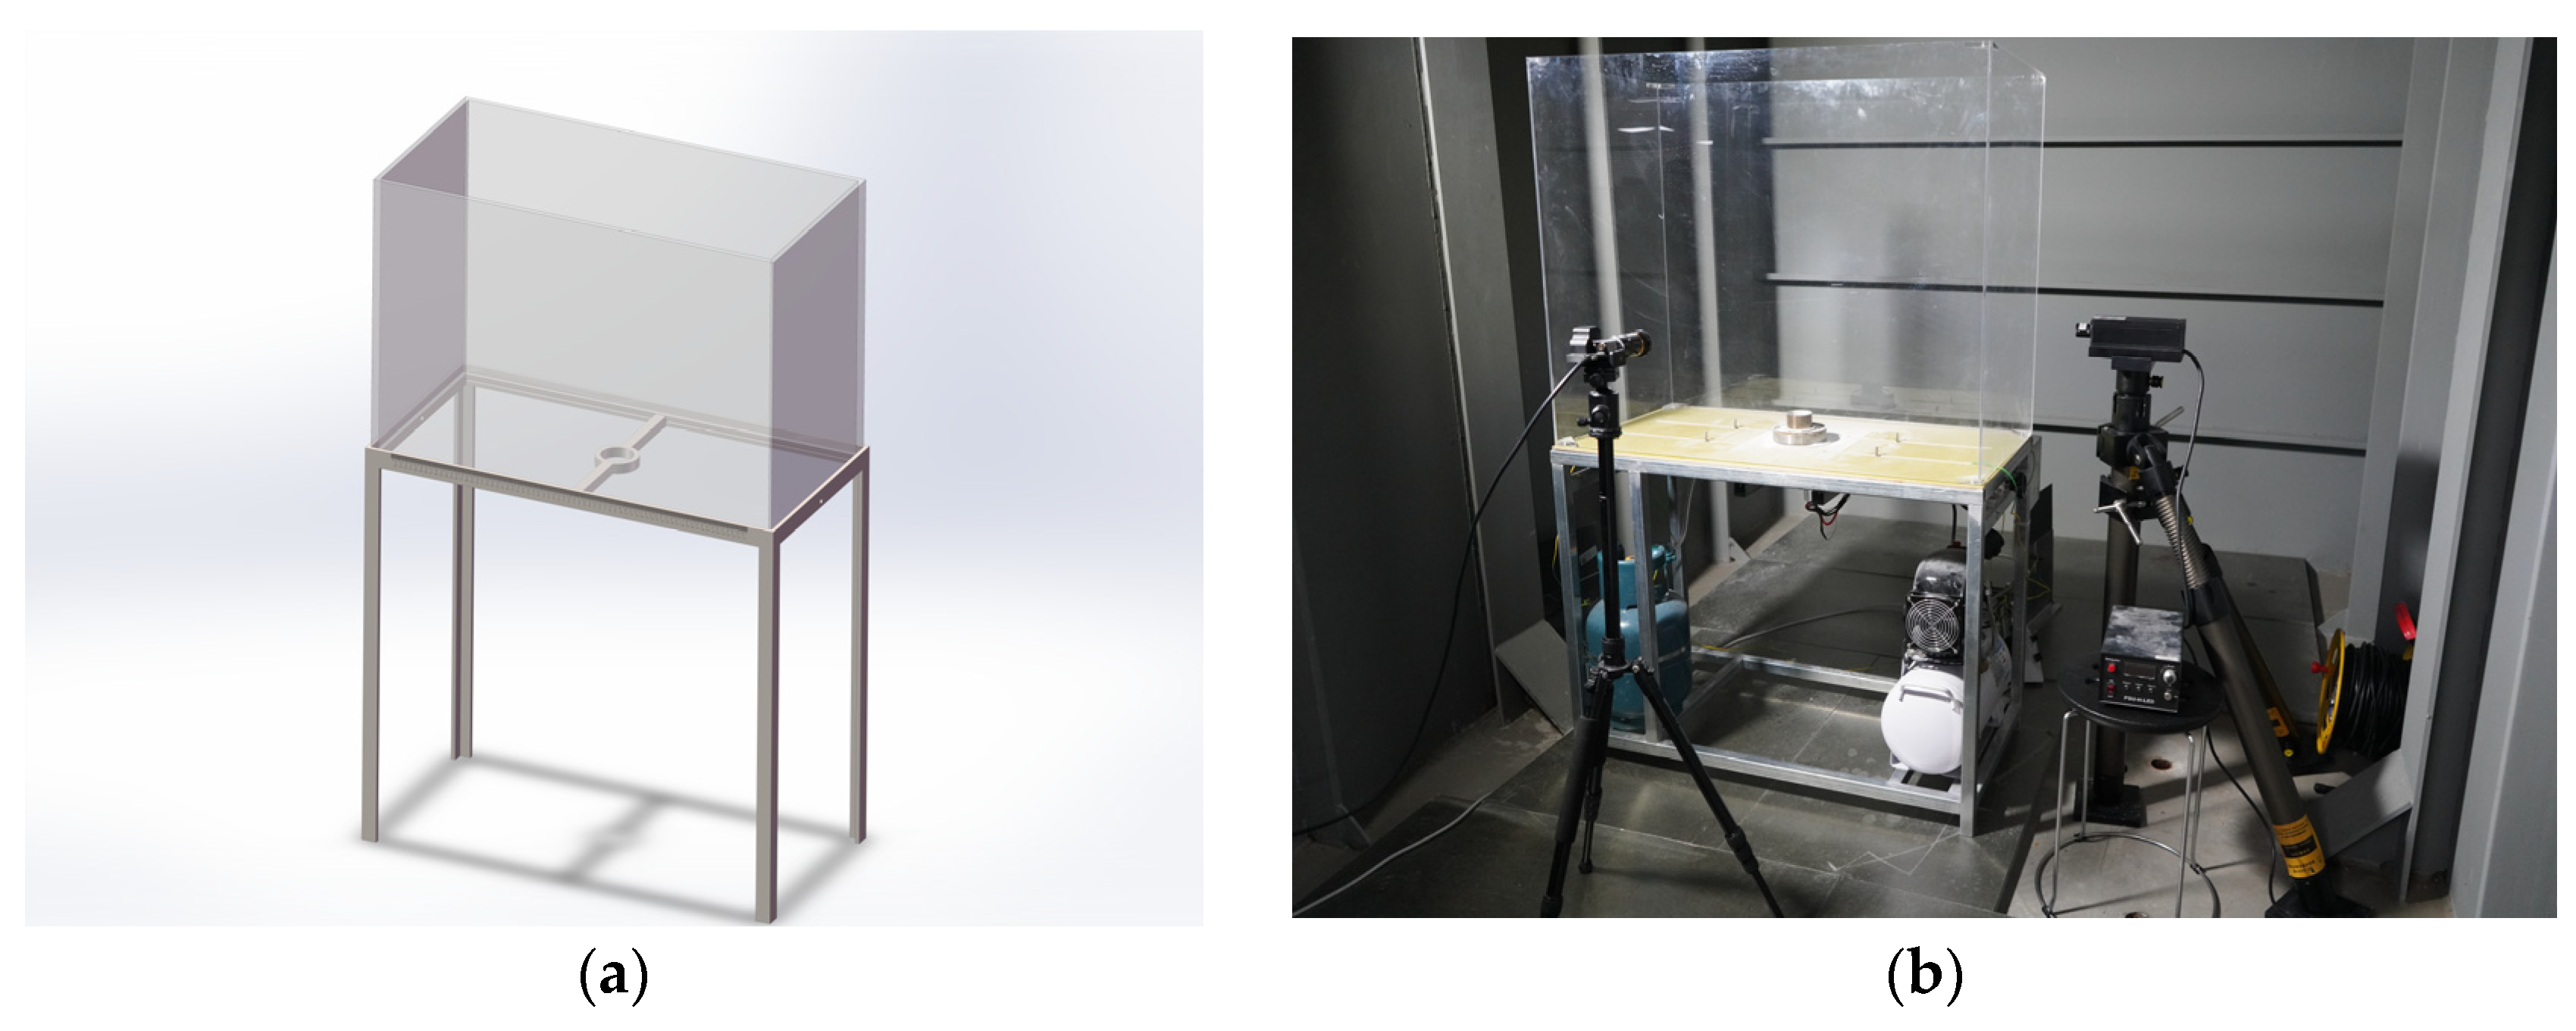
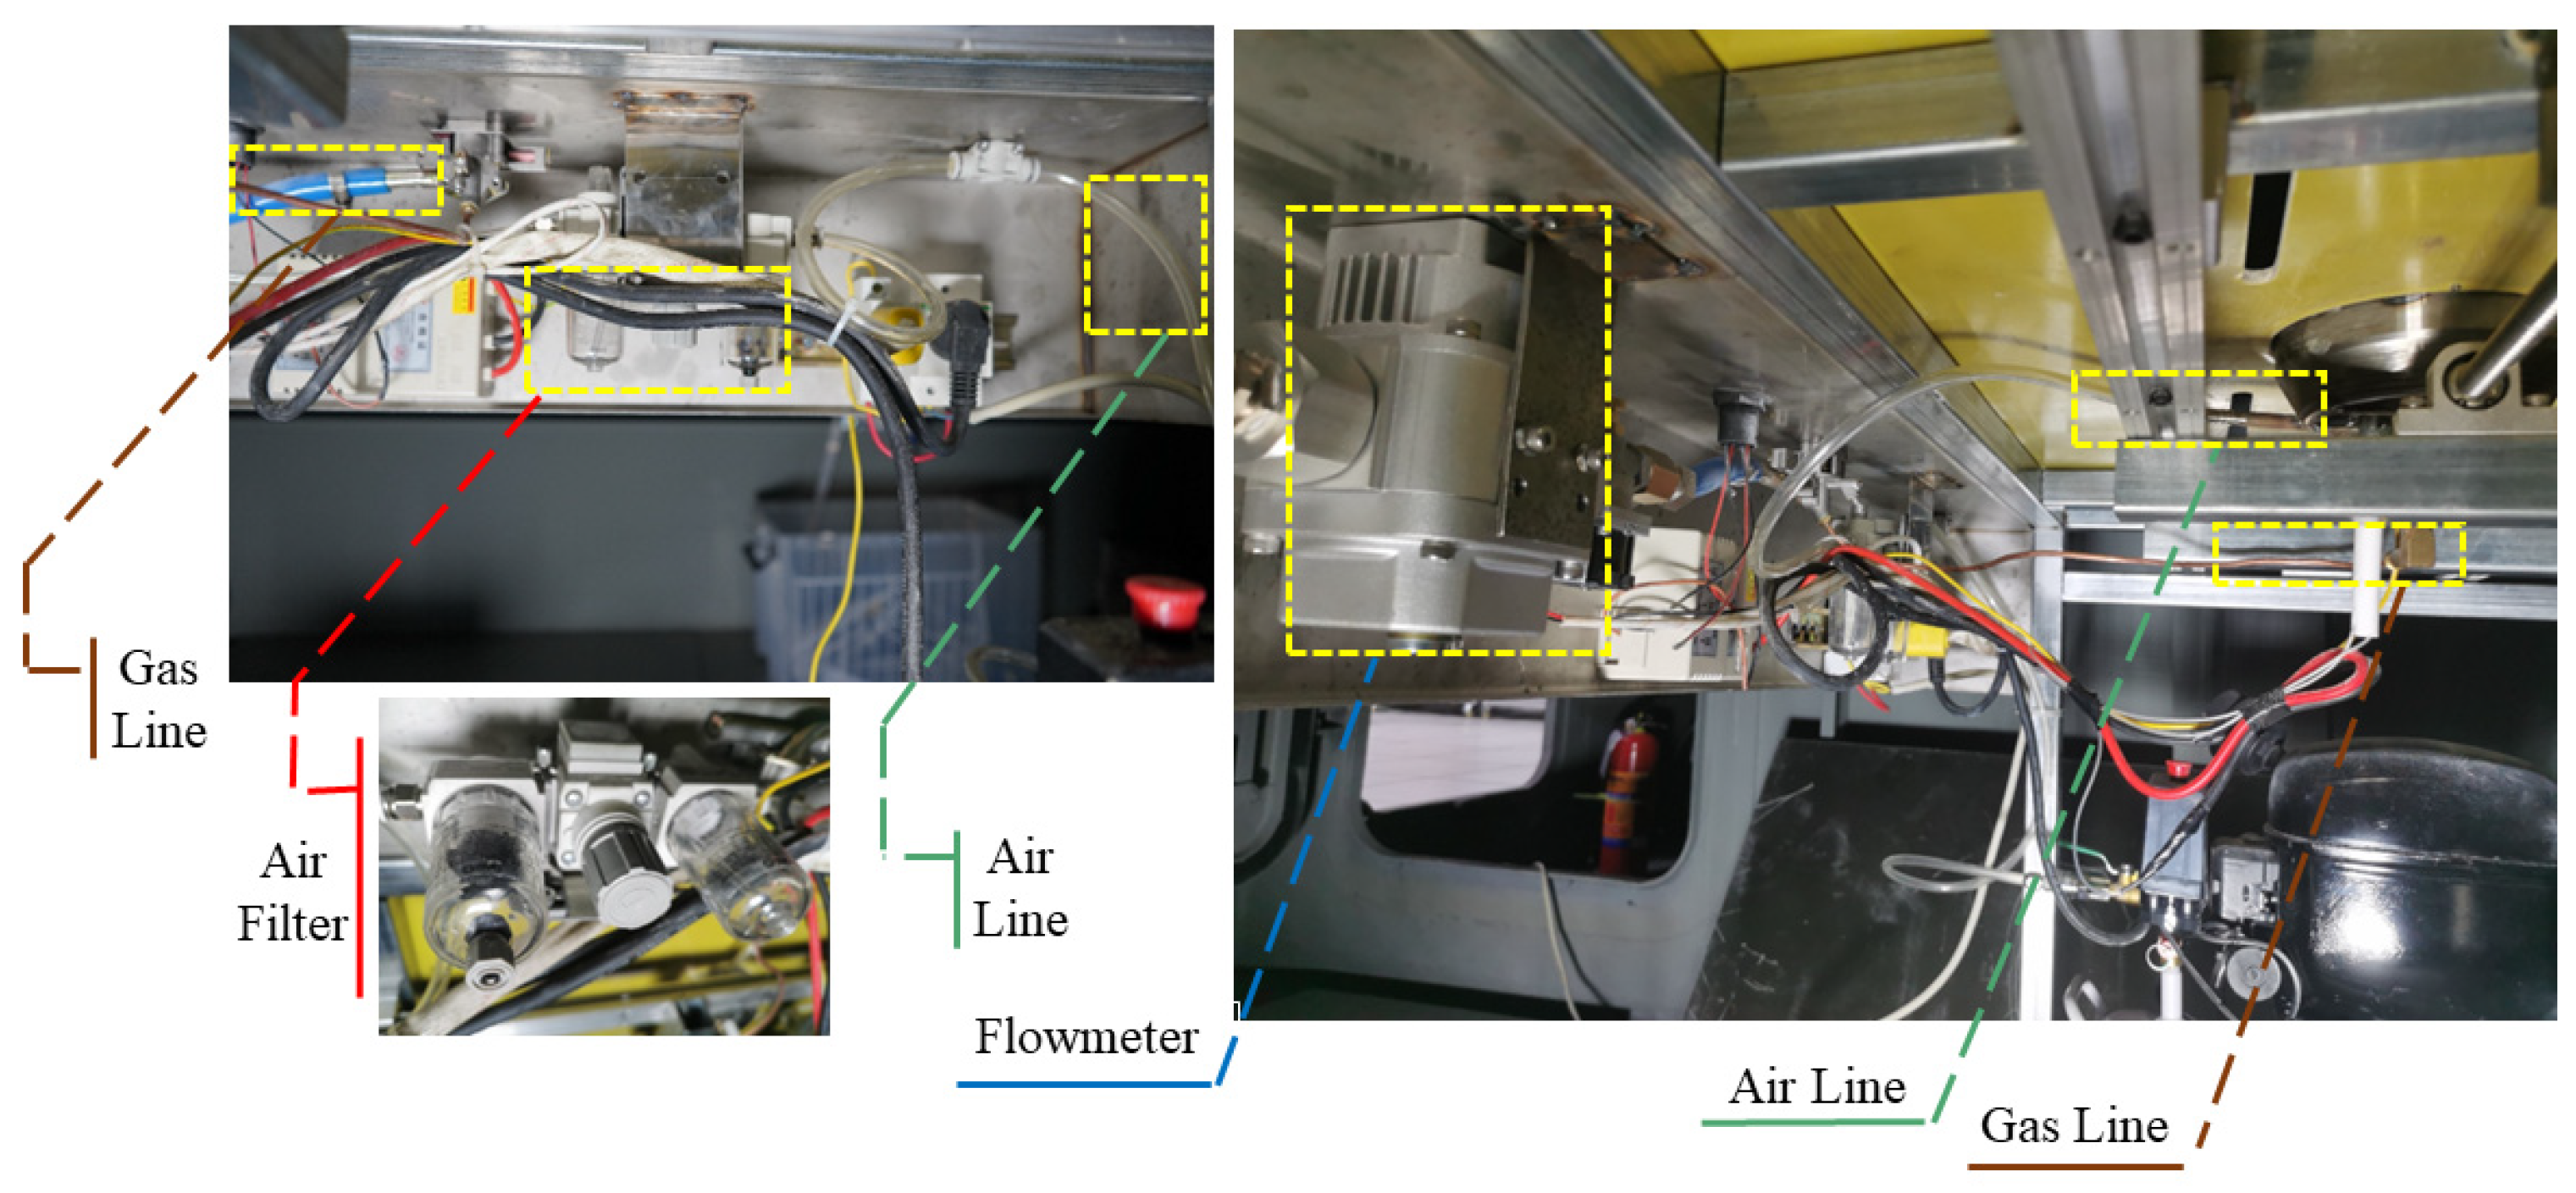
2.3. Design of an Autonomous PIV Experimental Speed Measuring Device

In order to study the flow pattern of propane jet flame combustion, this paper describes the build of a flame combustion test platform suitable for PIV measurements inside a fire simulation chamber. The temperature inside the chamber was room temperature (23 ± 2 °C) with no wind, and the humidity was 50 ± 5%. The interior of the chamber was a confined space equipped with smoke extraction devices and alarms, and the floor was paved with fireproof insulation boards. A list of the instruments of the autonomous PIV platform is given in Table 1. The flame combustion flow field was observed and photographed using this equipment to initially visualise the internal flow of the flame, and the propane combustion velocity field was calculated using the above algorithm.
The construction of this experimental platform was based on the PIV particle image velocimetry technology, which is mainly composed of a tracer particle generator, laser, industrial CCD high-speed camera, colour filter, and computer [3]. The combustion platform consisted of propane compressed gas and its supply piping, an air compressor, an air filtration device, a burner, an igniter, a flowmeter, an iron frame table, a copper pipe, and a hose. An air purification device was installed at the outlet of the air compressor to remove fine particles and oil and water droplets in order to avoid the introduction of impurities and humid air that make the tracer particles clump together and have other effects on the experimental results. In order to control and observe the flow of gas and the size of the flame, a gas roots flowmeter was installed in the compressed gas outlet pipeline. The flowmeter working range was 0.5 m3/h–16 m3/h, with an error value of ±1.5%. In order to prevent external air convection on the flame combustion effects, a 1000 mm × 500 mm × 800 mm transparent plexiglass cover was added to the outside burner to form an open airtight combustion chamber experimental bench model. The bench model is shown in Figure 6, and the piping and accessories are shown in Figure 7.
Propane was selected as the gas, and the pressure of the gas cylinder was kept within 0.3–0.9 MPa. In order to improve the adequacy of combustion and the rigidity of the flame, many small holes were opened around the gas nozzle to allow air to enter and mix with the gas. The mixed gas was then burned above the nozzle with the air containing tracer particles, so that the gas and air were mixed and burned. This type of combustion is called diffusion combustion, also known as non-premixed combustion. The diffusion-combustion mode was chosen to be more in line with the actual fire situation. The characteristics of diffusion combustion are relatively stable combustion, relatively low flame temperature, no movement of the diffusion flame, combustible gas and gas oxidiser mixture in the combustible gas nozzle, and no tempering phenomenon in the combustion process, which can ensure the stability and safety of the experiment [26]. The physical and chemical properties of propane gas [27] are shown in Table 2.
The burner consisted of a sleeve structure. The inner diameter of the outer sleeve was 100 mm, the diameter of the propane gas pipe was 5 mm, and the burner nozzle was a cross-shaped nozzle measuring 2.5 mm. The air generated by the air compressor flowed through the tracer particle powder supply system so that the tracer particles mixed with air were dispersed from the outer sleeve, which was equipped with glass beads, while the inner sleeve was connected to the atmosphere and also supplied with air [28]. Ignited by an electrode igniter, the air was diffusely combusted with the propane gas ejected from the nozzle in the area above. The burner structure is shown in Figure 8.
The particle powder supply system is the key to the visualisation of the reaction flow field, and the tracer particle powder supply system of the experimental platform built in this study consisted of a Scope SC21CL small air compressor, a pressure-regulating valve, tracer particles, and a particle generator. Tracer particles in the particle generator must meet the spectral requirements, motion response requirements, and physical and chemical property requirements [29]. They are also required to have sufficiently strong scattered light, a small enough particle size to meet the motion-following and temperature-following requirements, and high stability. Tracer particles must not participate in the chemical reaction; they must be easy to generate, non-corrosive, non-toxic, and non-volatile; and they should have clean and highly economical characteristics. Some of the parameters and following characteristics of tracer particles commonly used for gases [30] are shown in Table 3.
The following characteristics of particles will decrease with an increase in particle diameter [11,17]. Therefore, in order to meet the requirements for visualisation, tracer particles with a small particle size should be selected, as far as possible, to obtain better following characteristics. Because a small propane flame was used in this study, the blue flame was not reached, and the experimental environment was a heat dissipation environment rather than a heat isolation environment. Therefore, the propane could not reach its peak temperature during actual combustion. The uniformity and scattering were good, and the melting point was relatively high, which met the experimental requirements. In this study, TiO2 with 10 μm was selected as the tracer particle.
In this study, a particle generator was designed independently and adopted the upper and lower double-layer structure designs. The upper tray stored the replaceable glass beads, and the bottom plate was uniformly opened with many small holes. It was installed in the outer sleeve with a diameter of 100 mm and a height of 10 mm, and, using the Scope SC21CL small air compressor, a certain amount of compressed air was fed through the two air guide tubes installed in the lower device. The air compressor working pressure was 1.0 MPa, the displacement was 20.95 cm3, and the pressure and flow rate of the compressed air were controlled by a rotary air valve, which made the tracer particle powder stored in the lower device float in the air and form a fluidised bed [30]. The formed was sprayed by the porous bottom plate into the upper tray filled with glass beads with a diameter of 6 mm, which reduced the flow rate and enabled the air particles to be dispersed stably and evenly to the top of the nozzle. The air particles were then mixed with the incoming flow from the gas nozzle to carry out diffusion combustion. The flow field of diffusion combustion had the effects of diffusion and suction. Through the suction effect, the tracer particles were sucked into the combustion reaction, allowing us to visualise the combustion flow field. The physical diagram of the particle generator and the schematic diagram of the gas flow direction are shown in Figure 9.
An MGL-FN-532 solid-state continuous laser was used, and the output laser wavelength was 532 nm, the output power was 300~4000 mW, the instability was <1%, and the M2 factor was <1.2. The light source outgoing offset angle was 30°, forming a triangular laser plane, and a Huagul Power high-speed industrial CCD camera (WP-UT130) was used for image acquisition with the use of a telephoto lens (WP-VM0850-C). The resolution of the camera was 1280 × 1024, the highest frame rate was 210 frames per second, the manual zoom range was 8–50 mm, the aperture was F1.6, and the optical aberration was <3%. The TXLGPZD532 filter with a wavelength of 532 nm ± 10 nm was installed in the front of the lens in order to reduce the impact of the flame combustion luminescence of the shooting on the default exposure. The default exposure time was 16 μs, and the particles were identified on an 8-bit grey scale.

2.4. Experimental Analysis

2.4.1. Experimental Test

Before the experiment started, it was necessary to debug and proofread the test system to avoid system errors.
  • To ensure that the particles were dry and to avoid the surface of the glass beads being exposed to the air for a long time, the water was attached to the surface, which led to the agglomeration of the tracer particles. This was shown in the particle image as an uneven particle size. The ground glass beads in the particle generator were washed, and the tracer particles were placed into the drying box for drying.
  • Accessories, such as the transparent plexiglass cover, were cleaned to avoid impurities affecting the laser incidence effect and introducing noise in the particle image.
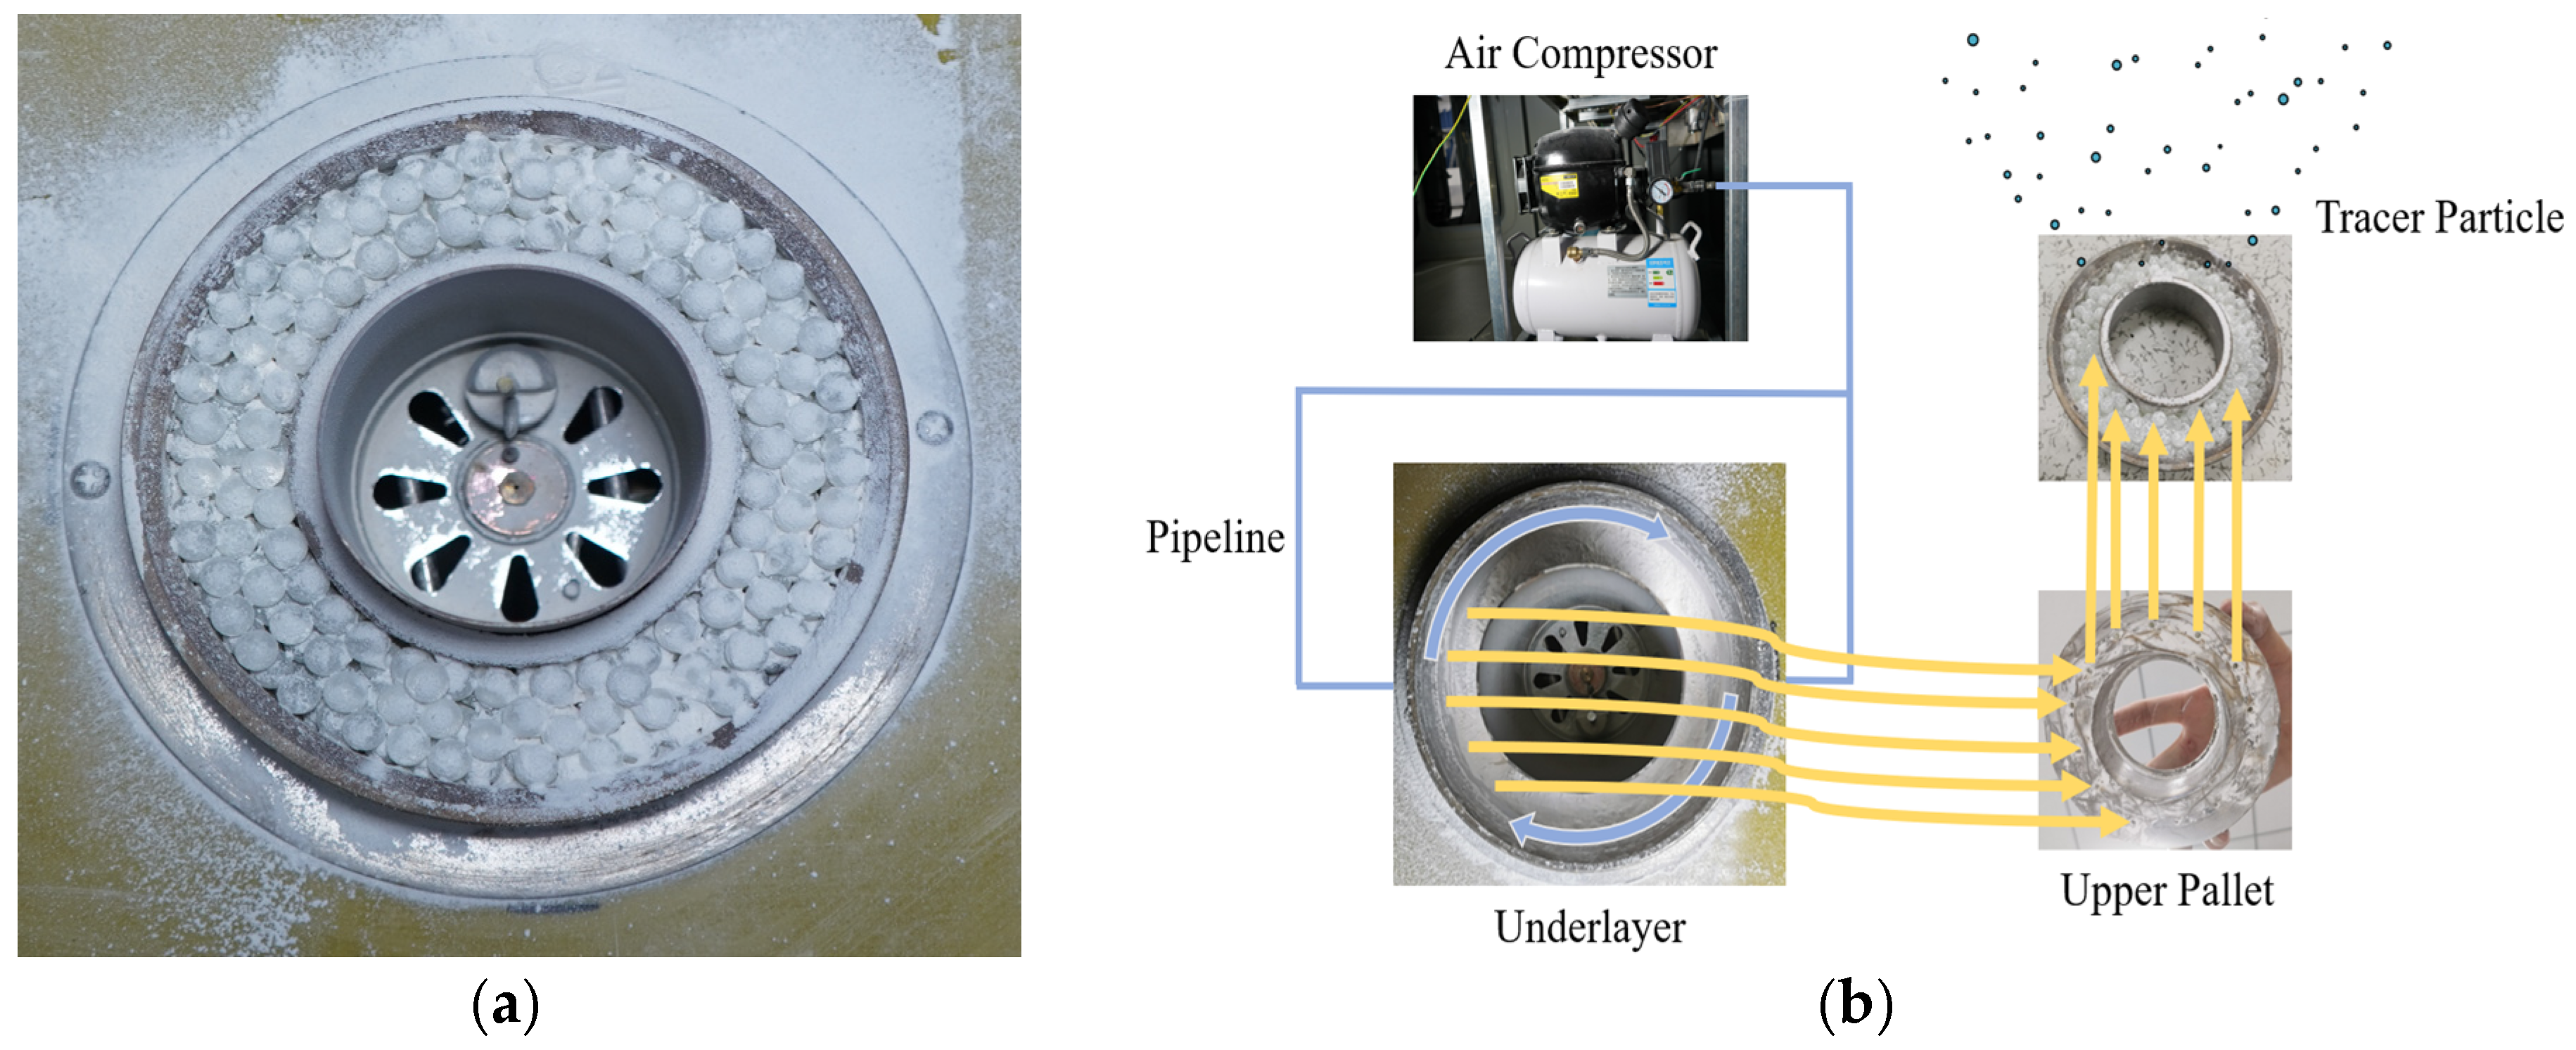
  • To provide oxygen conditions in advance, before the ignition of the propane burner, an appropriate amount of compressed air containing tracer particles was passed into the burner to increase the oxygen content above the burner and reduce the difficulty of ignition. At the same time, tracer particles were introduced to provide conditions for the initial ignition flow field.
  • A Deli DL332305 level was used to ensure that the CCD camera body was horizontal and perpendicular to the laser plane in order to ensure the shooting effect.
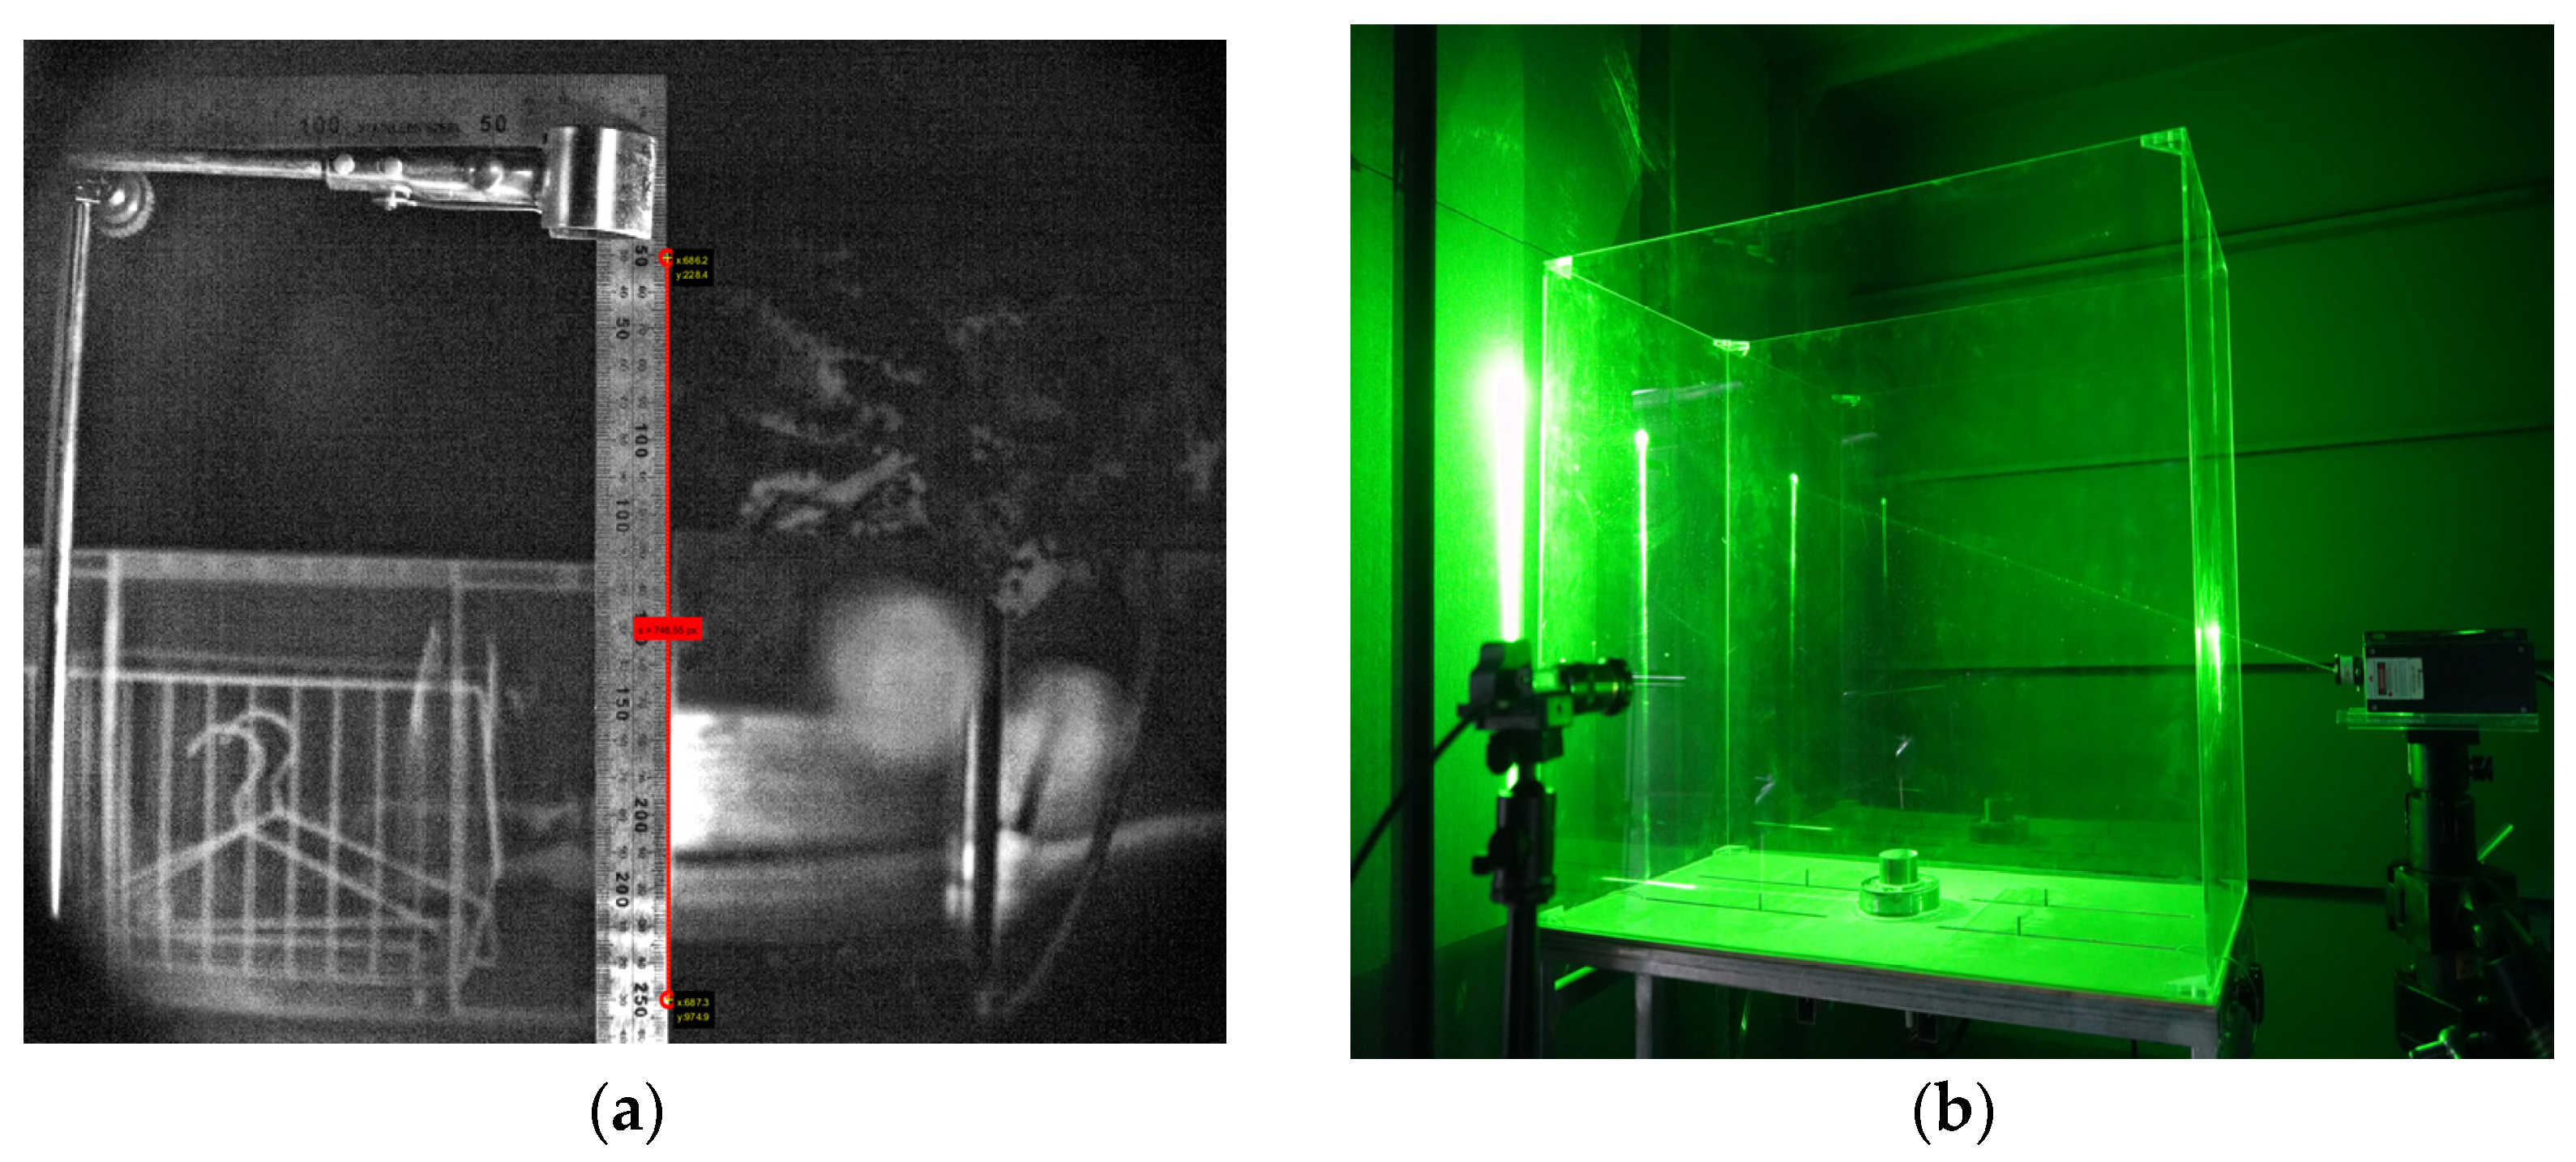
  • The focal plane was calibrated to make the laser plane coincide with the focal plane to prevent under-exposure or over-exposure. A calibration ruler was used to focus and change the image distance through repeated focusing until the ruler in the lens picture was clearly imaged, and the length calibration is shown in Figure 10a. At this time, the camera aperture had been adjusted to the maximum, the exposure time parameter was 10,000, and the G-channel gain was 5.0.
The appropriate picture size and PIV shooting area were selected. The shooting area of the test camera was the flame root and the rectangular space above it, with a width of 343 mm and a height of 274 mm. Before data analysis, the shooting area was scaled, and the pixel distance was converted into the international standard unit of length. According to the calculation, one pixel corresponded to 2.7 × 10⁻⁴ m. In order to avoid interference from external light sources, the experiment was conducted in a dark room, as shown in Figure 10b.
To ensure the WP-UT130 camera had a good image when shooting particles, the working power of the laser was adjusted to the maximum, the aperture of the camera was adjusted to the maximum, the exposure time parameter was adjusted to 10,000, and the G-channel gain was adjusted to 5.0.

2.4.2. Image Pre-Processing

There were some interference factors in the experimental environment that led to signals of different frequencies and strengths in the captured particle images, including noise, and were distributed according to a certain law, that covered the particle signal. Therefore, the particle image needed to eliminate noise to enhance the particle laser signal before entering the cross-correlation algorithm. Due to the inevitable diffuse reflection, the experimental image did not contain only the particle image information. In this study, background elimination was carried out by subtracting the mean pixel intensity j, and only the foreground information was retained. This greatly improved the signal-to-noise ratio of the particle image. Processing by CLAHE can significantly improve the reliability of cross-correlation [31,32], improve the overall quality of the image, describe the flow field information more accurately, and perform high-pass filtering on the image to suppress low-frequency noise, smooth the image, and improve the accuracy of cross-correlation.
After optimisation, many kinds of errors can still lead to the inevitable error vector of displacement, i.e., the bad points (outliers) can show obvious differences that do not conform to the flow field law. In order to restore the real flow field as much as possible, it is necessary to carry out PIV post-processing, including the identification and correction of the bad points. This study adopted the normalised median test method proposed by Westerweel and Scarano [33] for the identification of the bad points, i.e., the data validation. The implementation of the algorithm is simple and can be adapted to a wide range in the Reynolds number of the flow field when the number of bad points is less than 5%. Neighbourhood interpolation was used to correct the displacement field data, i.e., the correction of bad points. These two methods were directly applied to the window deformation method with multi-stage grid iteration, as described in the previous section. This can improve the accuracy and, at the same time, make up for the degradation of the performance of the nearest-neighbour interpolation method to a certain extent when the number of connecting bad points is large. Since the flame in this study was small and there were no ultra-high-speed particles, it was acceptable to have some particle loss, which had little effect on the experimental phenomenon. The comparison before and after post-processing is shown in Figure 11. A previous study [34] also verified and corrected the displacement field data, proving the correctness of the method adopted in this study.

3. Results and Discussion

3.1. Flow Rate Analysis

The image was enhanced and denoised using a pre-processing algorithm, as shown in Figure 12a,b. Then, the velocity field above the combustion flame of the propane jet was calculated based on the multilevel grid iteration algorithm, which has good accuracy and bad-point removal and repair ability when processing particle images [35], as shown in Figure 11a,b. After completing the particle image pre-processing and mutual correlation calculation, PIVlab was used to carry out post-processing and statistical analysis of the flow field, and 10 consecutive images were selected as samples from the captured time-series images to be analysed. The flow velocity in the upper off-centre high-velocity jet region of the propane combustion flame was calculated, and an analysis was conducted.
According to the selected area mentioned in Section 2.4.1, one pixel corresponded to 2.7 × 10⁻⁴ m. The sampling frequency of particle images that could be clearly captured after focusing was completed and kept at 48 frames/s. The sampling interval between the two frames was 20.83 ms, and the sub-pixel interpolation algorithm’s example of the unique uncertainty of 0.1 pixel was used. The calculation was made by using the following accuracy formula: ε = 0.1 M Δ t , where M = 1 for the magnification. The velocity accuracy was 4.8 × 10⁻⁴ m/s.
The left space of the flow field was selected as the ROI region to be measured, which was used as the input particle image of the PIV algorithm. The flow velocity vector field was computed, and the change process of the vector size distribution was observed. The maximum velocity is 0.23 m/s, the maximum relative error is ±5%, and the minimum is close to 0, as shown in Figure 13. Compared with the velocity accuracy, the relative uncertainty was 0.21%. Due to the selection of the left region of the propane combustion flame as the region to be measured, the upper right of the image is closer to the middle of the flame, so the velocity of the flow field close to the high-velocity jet region above the propane combustion flame gradually increases, and the left and right parts of the combustion field are symmetrical. It can be seen that the flow velocity shows Gaussian distribution characteristics, which is in line with the conclusions of another study on the characteristics of fire plume flow under different constrained forms conducted by Zhang Wei [36].
The distribution of the flow field average velocity size during the 10-frame time series is shown in Figure 14. The velocity of the flow field near the high-speed jet area above the flame gradually increased, and the maximum velocity could be up to 0.15 ± 0.027 m/s. The average velocity vector had an upward velocity component, which was caused by the flame jet created by the coil suction of the surrounding jet [29] and the transverse pulsation of the air molecular microclusters [37] that were wrapped around the jet. In the literature [29], fuel flow acceleration has been shown to cause vortex formation as the propane fuel swirls throughout the surrounding air, consistent with this paper’s statement that the flame receives lateral pulsations to produce an upward component. The literature [37] also shows that the flame morphology and length change when the flame is subjected to transverse pulsations.
The average transverse and longitudinal velocity magnitude distributions of the air flow field above the combustion flame of the propane jet are shown in Figure 15. The positive direction of transverse velocity was horizontally to the right, and the maximum speed is 0.15 ± 0.3 m/s; the positive direction of longitudinal velocity was vertically downward. The positive values are shown in blue, and the negative values are shown in red. In the central jet upward movement, most of the particles followed the jet upward movement; however, some of the particles were not completely involved in the jet and stayed in place or exhibited a natural downward movement. The particles were in the natural dispersion state; the size of the absolute value of the vector velocity was not more than 0.05 ± 0.0074 m/s; and, through a number of experimental measurements, the velocity value was still close to zero, confirming that the particles were in a state of dispersion. This is confirmed by the literature [38], which shows that in the area of the combustion flow field, the particles are in a state of dispersion and the particle concentration is not easily increased, and when the gas forms in the volume of the suction phenomenon, the tracer particles entering the combustion area are limited. The particles described in this study were in a diffuse state, and the velocity value was not high.
Figure 16 shows the velocity distribution curve of the transverse flow field for the horizontal height where propane combustion flame jet entrainment occurs. The flow field velocity reached its maximum value at 0.054 m from the centre of the jet, and the farther away from the centre, the smaller the flow’s velocity. The flow field velocity decreased sharply in the interval of 0.054–0.09 m. The velocity of the flow field decreased sharply in the interval of 0.05 m from the centre of the jet, which matches the trend described in the literature [39]. Due to the large variation at the boundary, external particles entered the inside of the selected ROI region, resulting in the existence of a non-identical part between the two frames of the image, which therefore could not be completely calculated using the cross-correlation algorithm. There was a certain impact, however, resulting in a tiny peak at the boundary.

3.2. Vorticity Analysis

PIVlab was used for vortex positioning, and the vortex distribution of the average velocity vector field is shown in Figure 17, where the brighter colour region is the vortex region, and the two main vortices are distributed on both sides of the horizontal line where jet enrolling occurred.
Figure 18 reflects the distribution of the mean pulsating vorticity. The red region is the forward counterclockwise vortex, and the central vorticity is about 13 s−1. The blue region is the reverse clockwise vortex; the central vorticity is about 10 s−1; the two vortices in opposite directions form a jet-rolled suction channel; and the particles between the two vortices are caught in a jet of the propane-burning flame at high speed. The average pulsating vorticity streamlines are plotted, which shows the flow field during the 10 frames of sample time. In a study of meteorological flames and solid surfaces, Zhang Wei [40] investigated the vorticity inside the fire plume under the condition of a smaller tilt angle of the flame, and the results showed that the vorticity was small and had good symmetry, which is consistent with the size of the central vorticity investigated in this study; however, the vorticity measured in this study was located in the left half of the flame, which also possesses symmetry.
From the above analysis, it can be seen that the velocity of the flow field gradually increases as the distance of the high-speed jet region above the propane combustion flame decreases. The visualisation of the flow field velocity is achieved via Gaussian distribution characteristics. Through the analysis of the longitudinal flow velocity, the flow field showed convolutional suction, forming a vortex, and vortex positioning and analysis of the image were used to achieve the vortex visualisation. Thus, PIV technology was applied in the dynamic flow field and complex combustion chamber to achieve the flame visualisation measurement.
The results show that this study establishes a more economical experimental platform for propane combustion in PIV based on the traditional interconnection algorithm. This study also analyses the motion law of the air flow field above the flame and realises the visualisation of the flow velocity and vorticity in the combustion process of a propane flame, which makes up for the problem of there being less research on the existing dynamic flow field technology and the flow field of complex combustion chambers. The platform constructed in this study is also more environmentally friendly and efficient. To study the fire extinguishing mechanism, the development of fire extinguishing equipment provides an experimental basis for effective fire management.

4. Conclusions

In this study, based on the traditional inter-correlation theory, an experimental platform for the particle image velocimetry (PIV) of propane jet combustion flame particles designed and tested inside a fire simulation laboratory chamber was able to measure dynamic and complex flow fields. The experimental platform reduces research costs while ensuring high efficiency of the measurements and meeting the demand for the generalised use of PIV technology. The main research results are as follows:
(1)
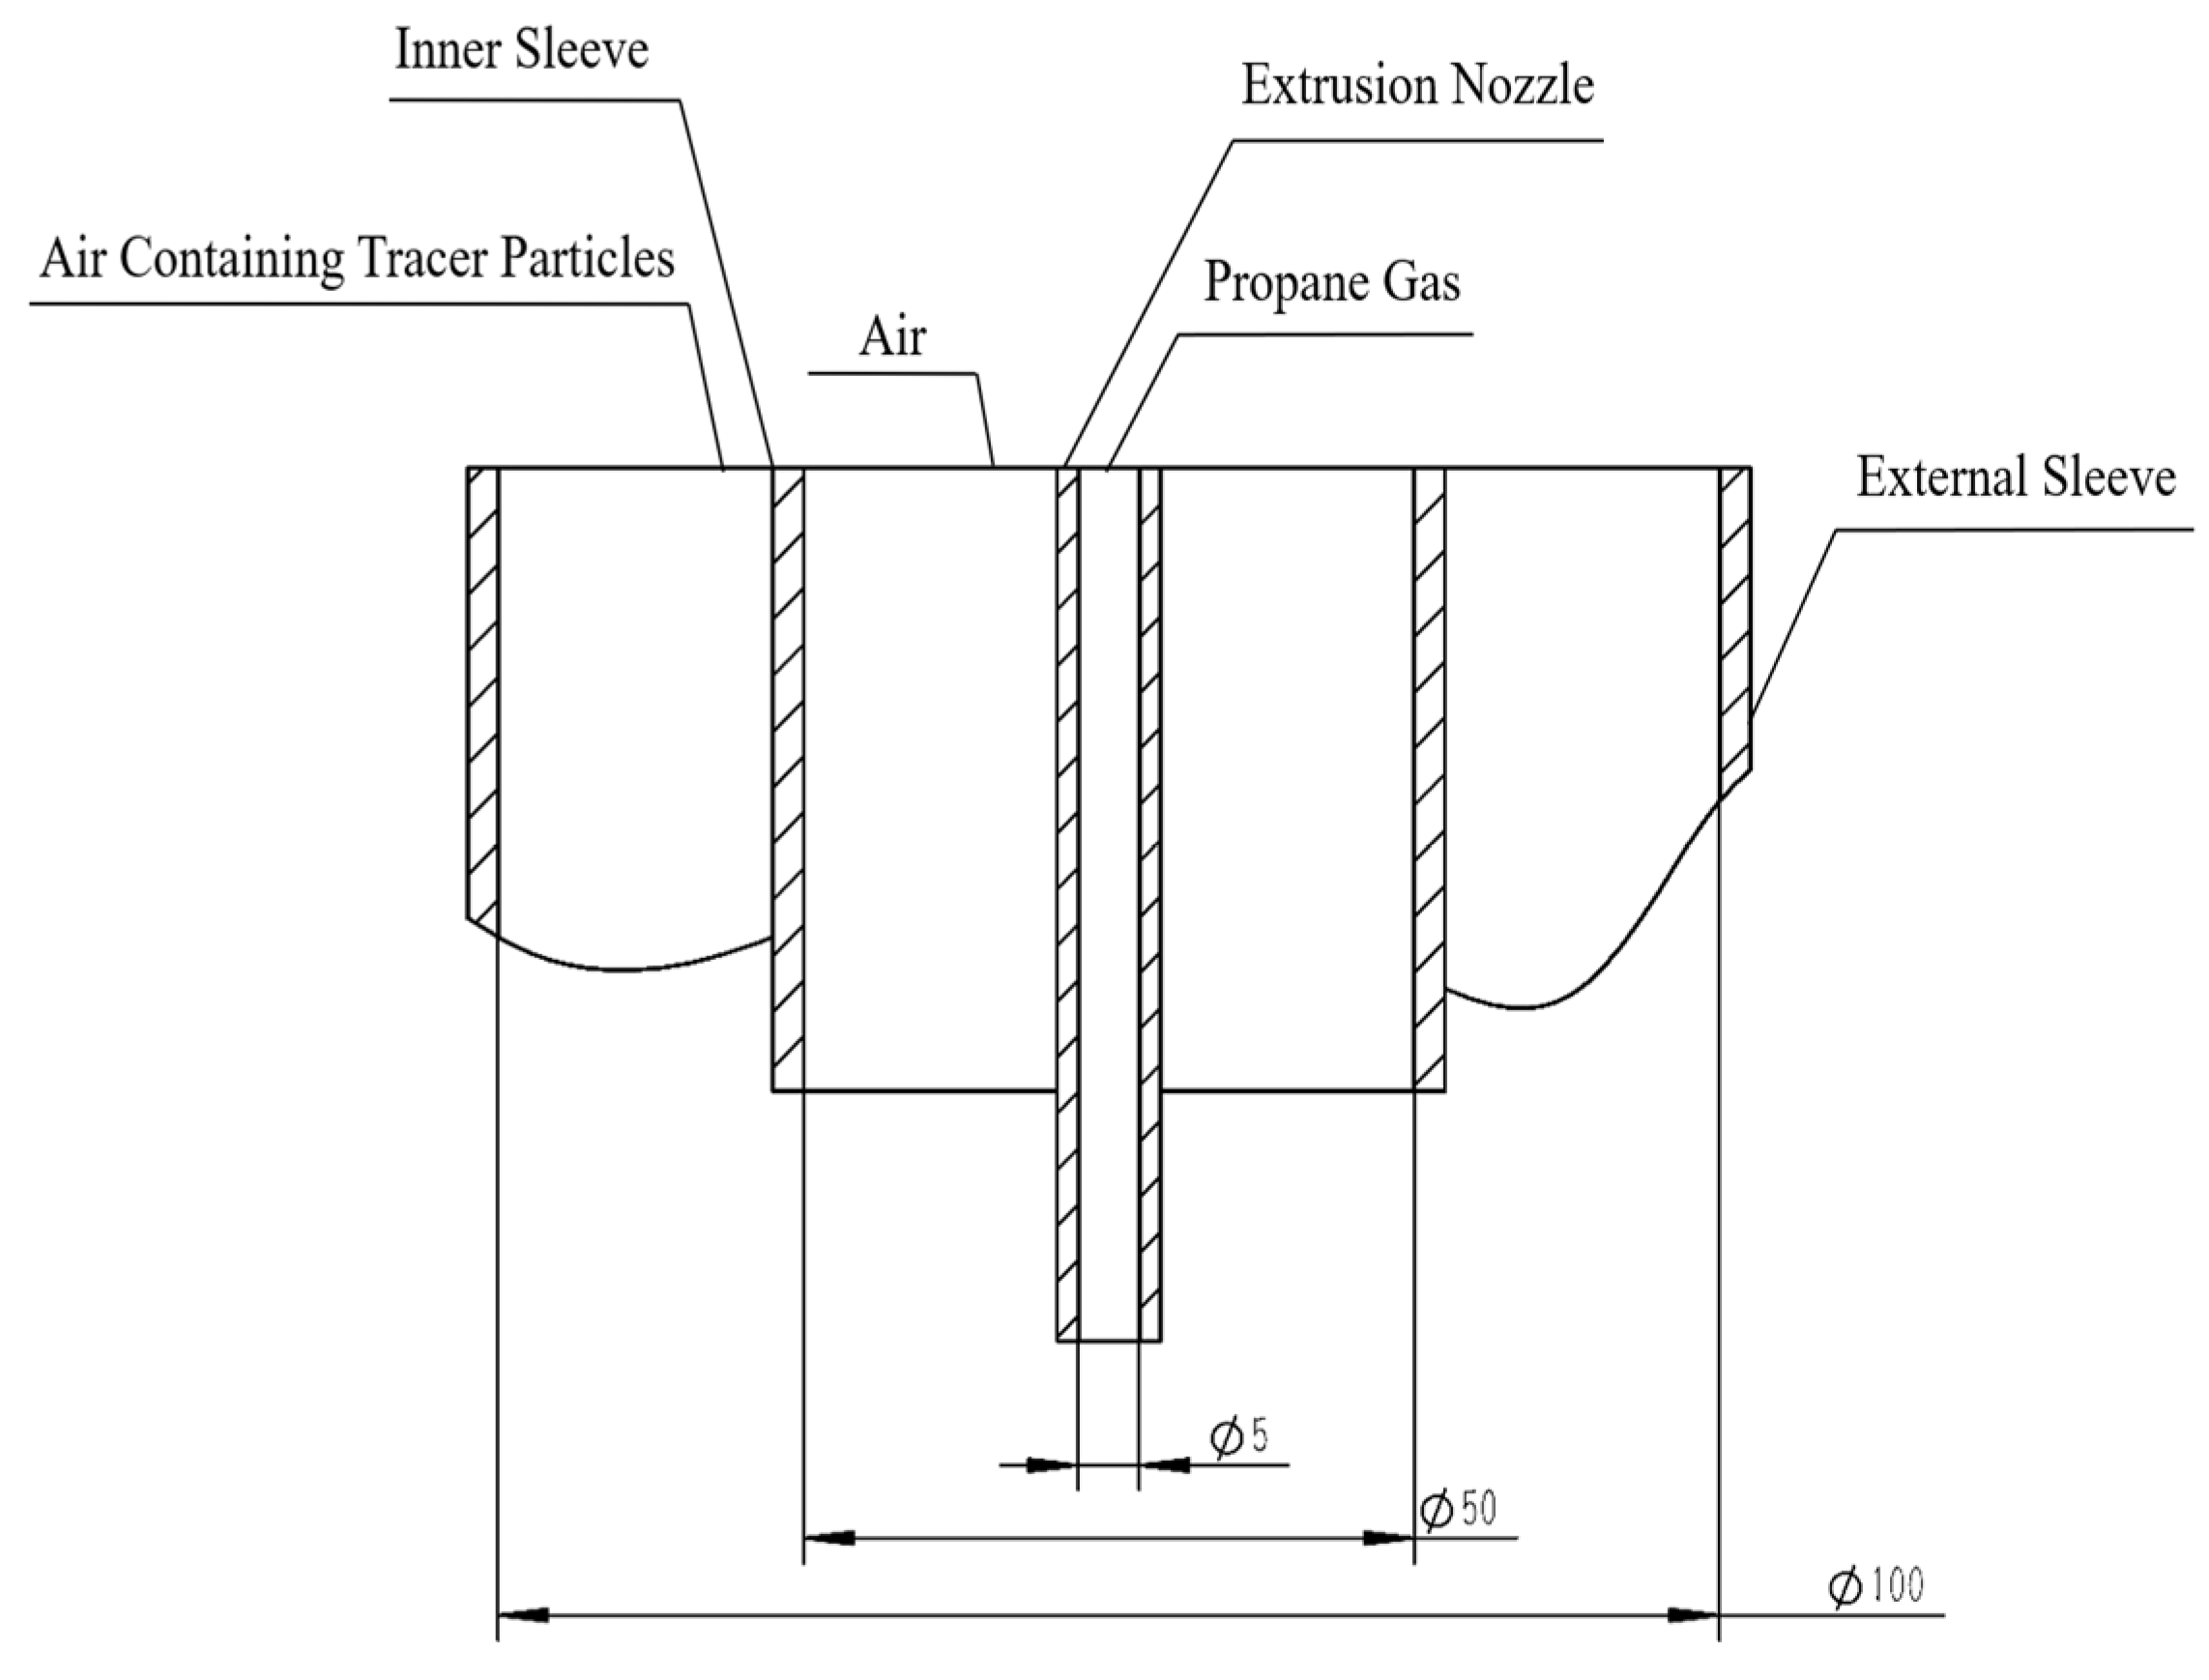
A particle generator was designed based on the fluidised bed principle and installed in the air pipeline. TiO2 powder with a 10 μm particle size was selected as the tracer particle, and the air and gas carrying the tracer particle were diffused and burned at the centre nozzle of the test bench to achieve stable combustion of the propane flame.
(2)
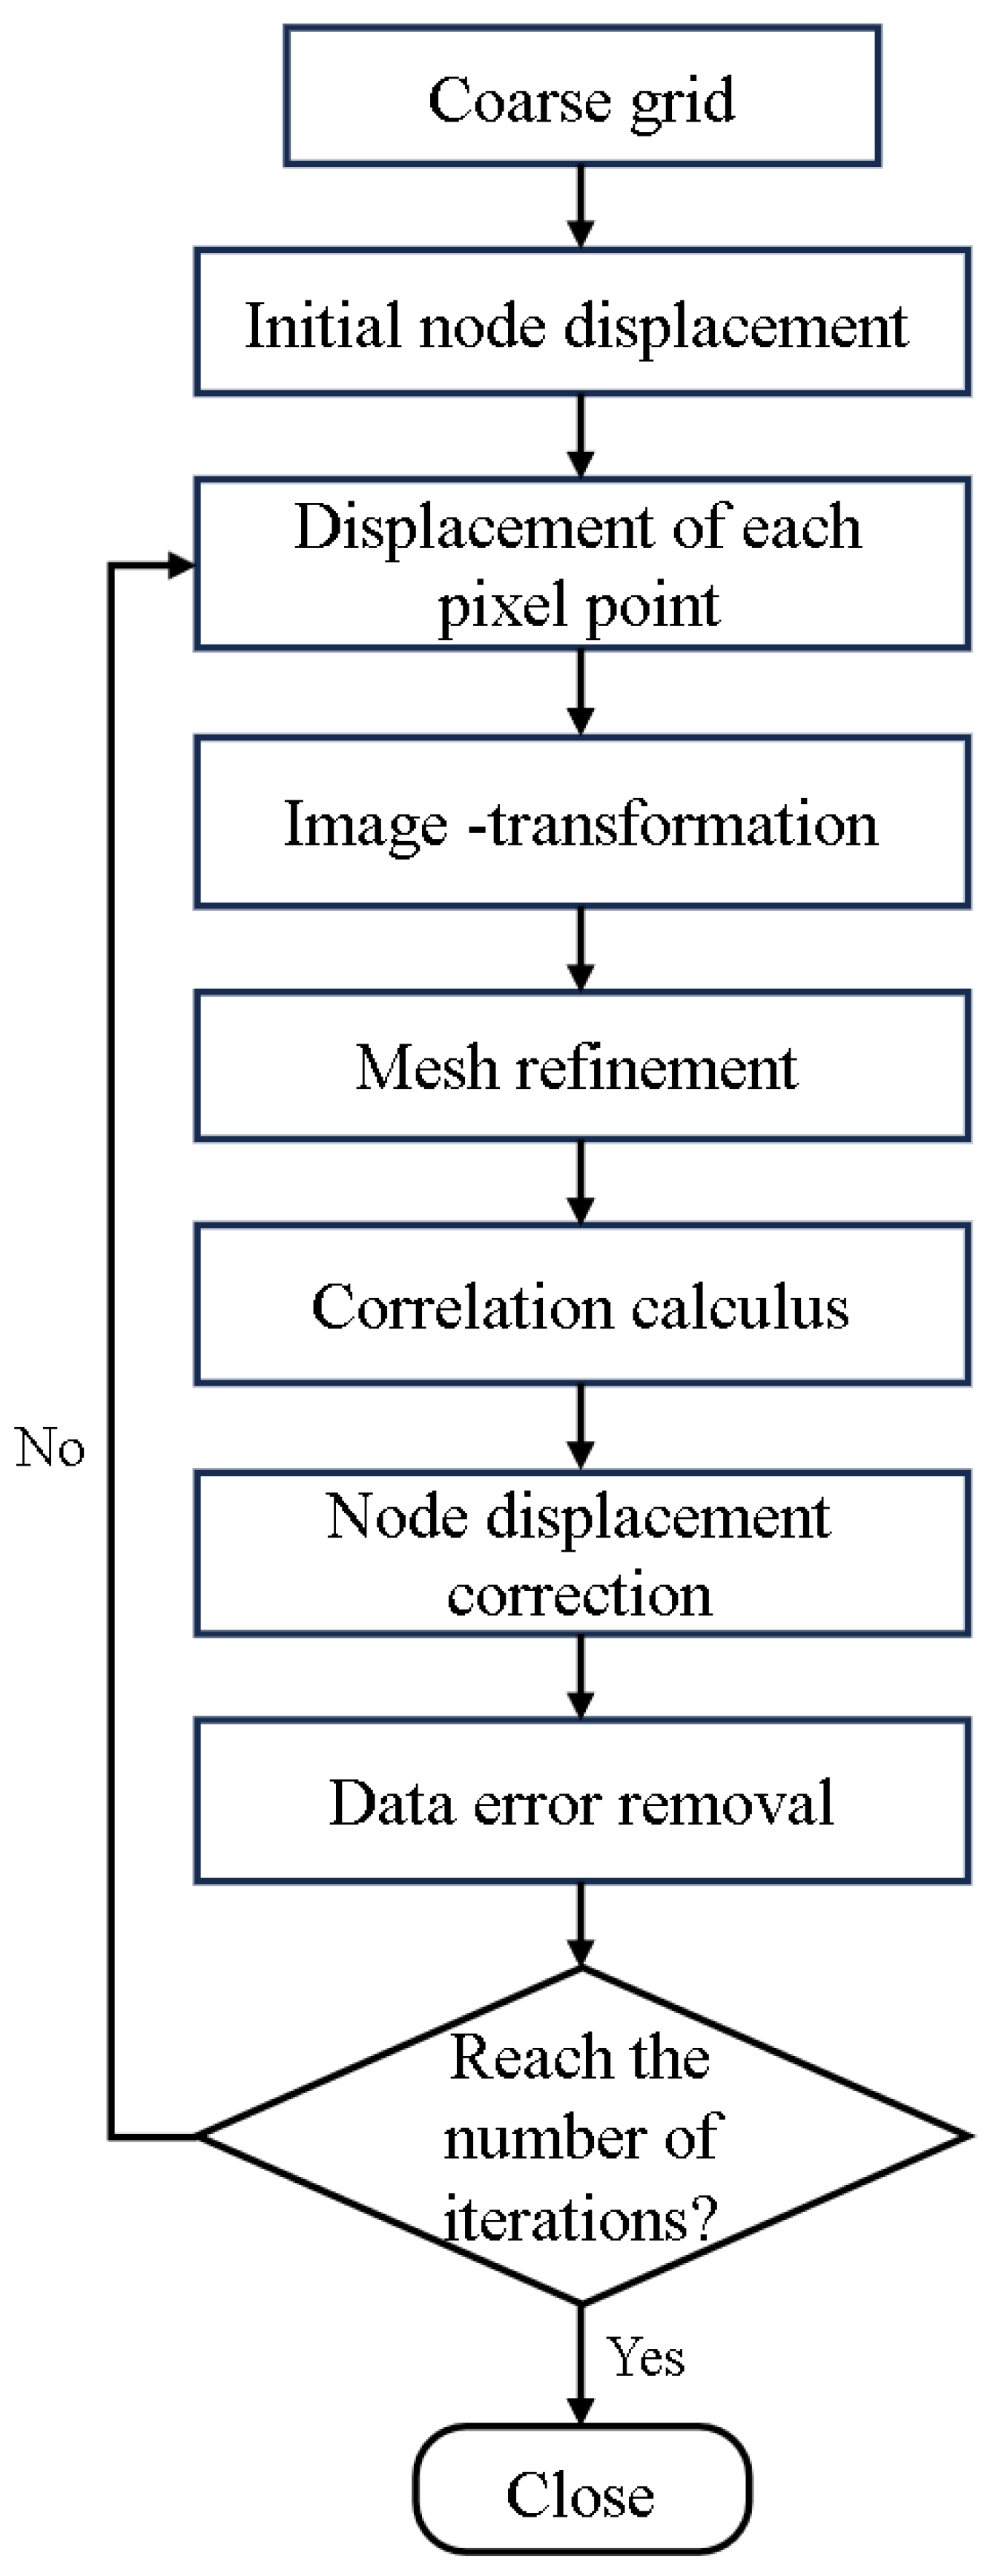
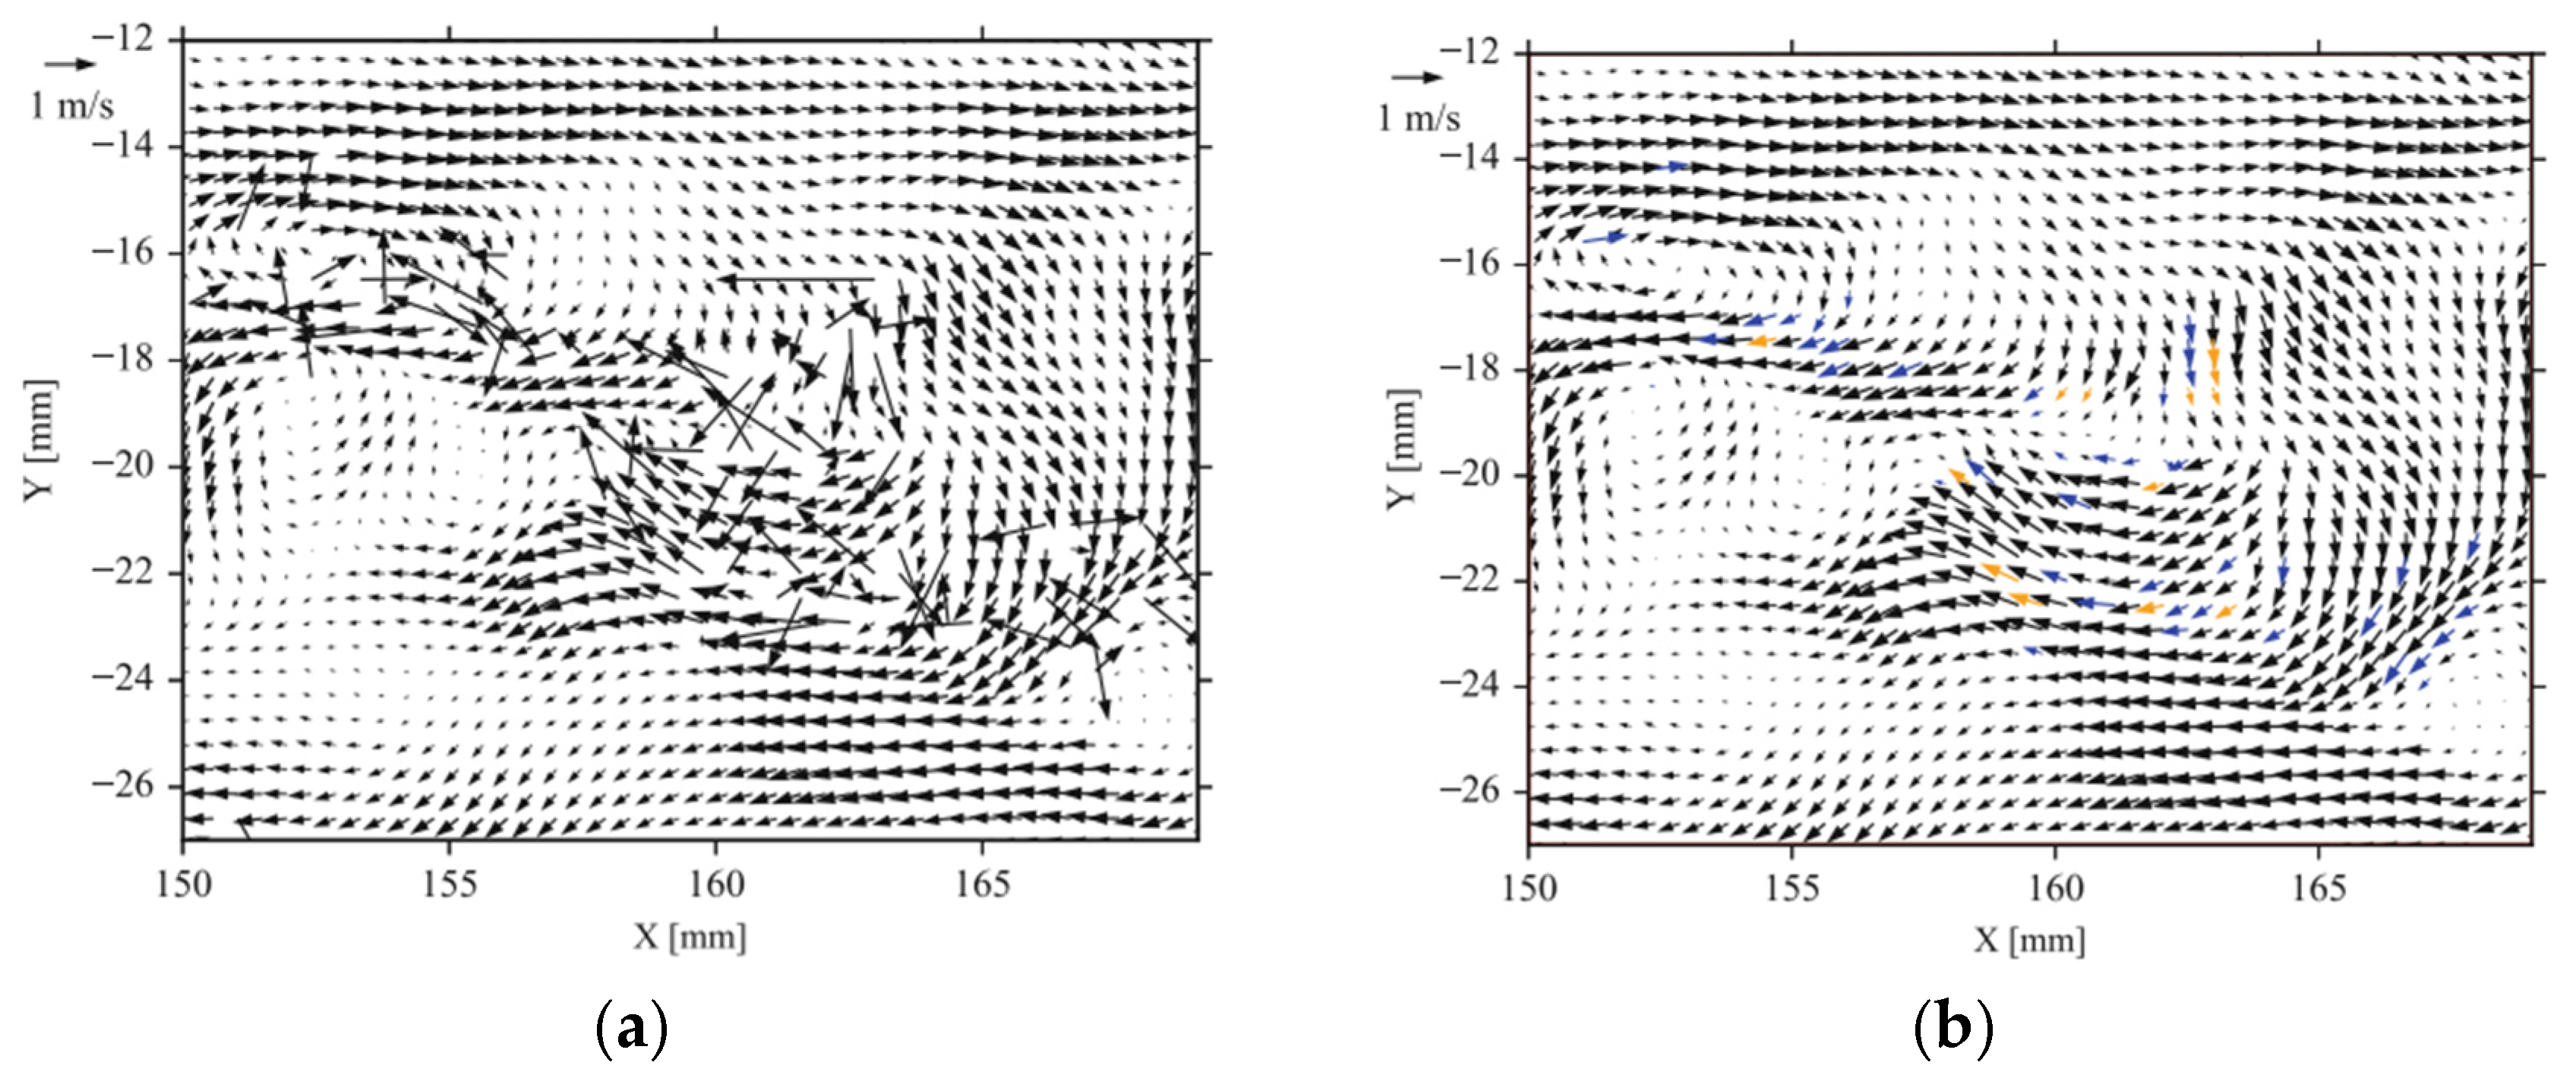
The PIV algorithm program to pre-process the image was prepared. The deformation interrelationship of multi-level grid windows was calculated, the median test was normalised, and the velocity of the air flow field above the flame was analysed with the help of the PIVlab post-processing algorithm.
(3)
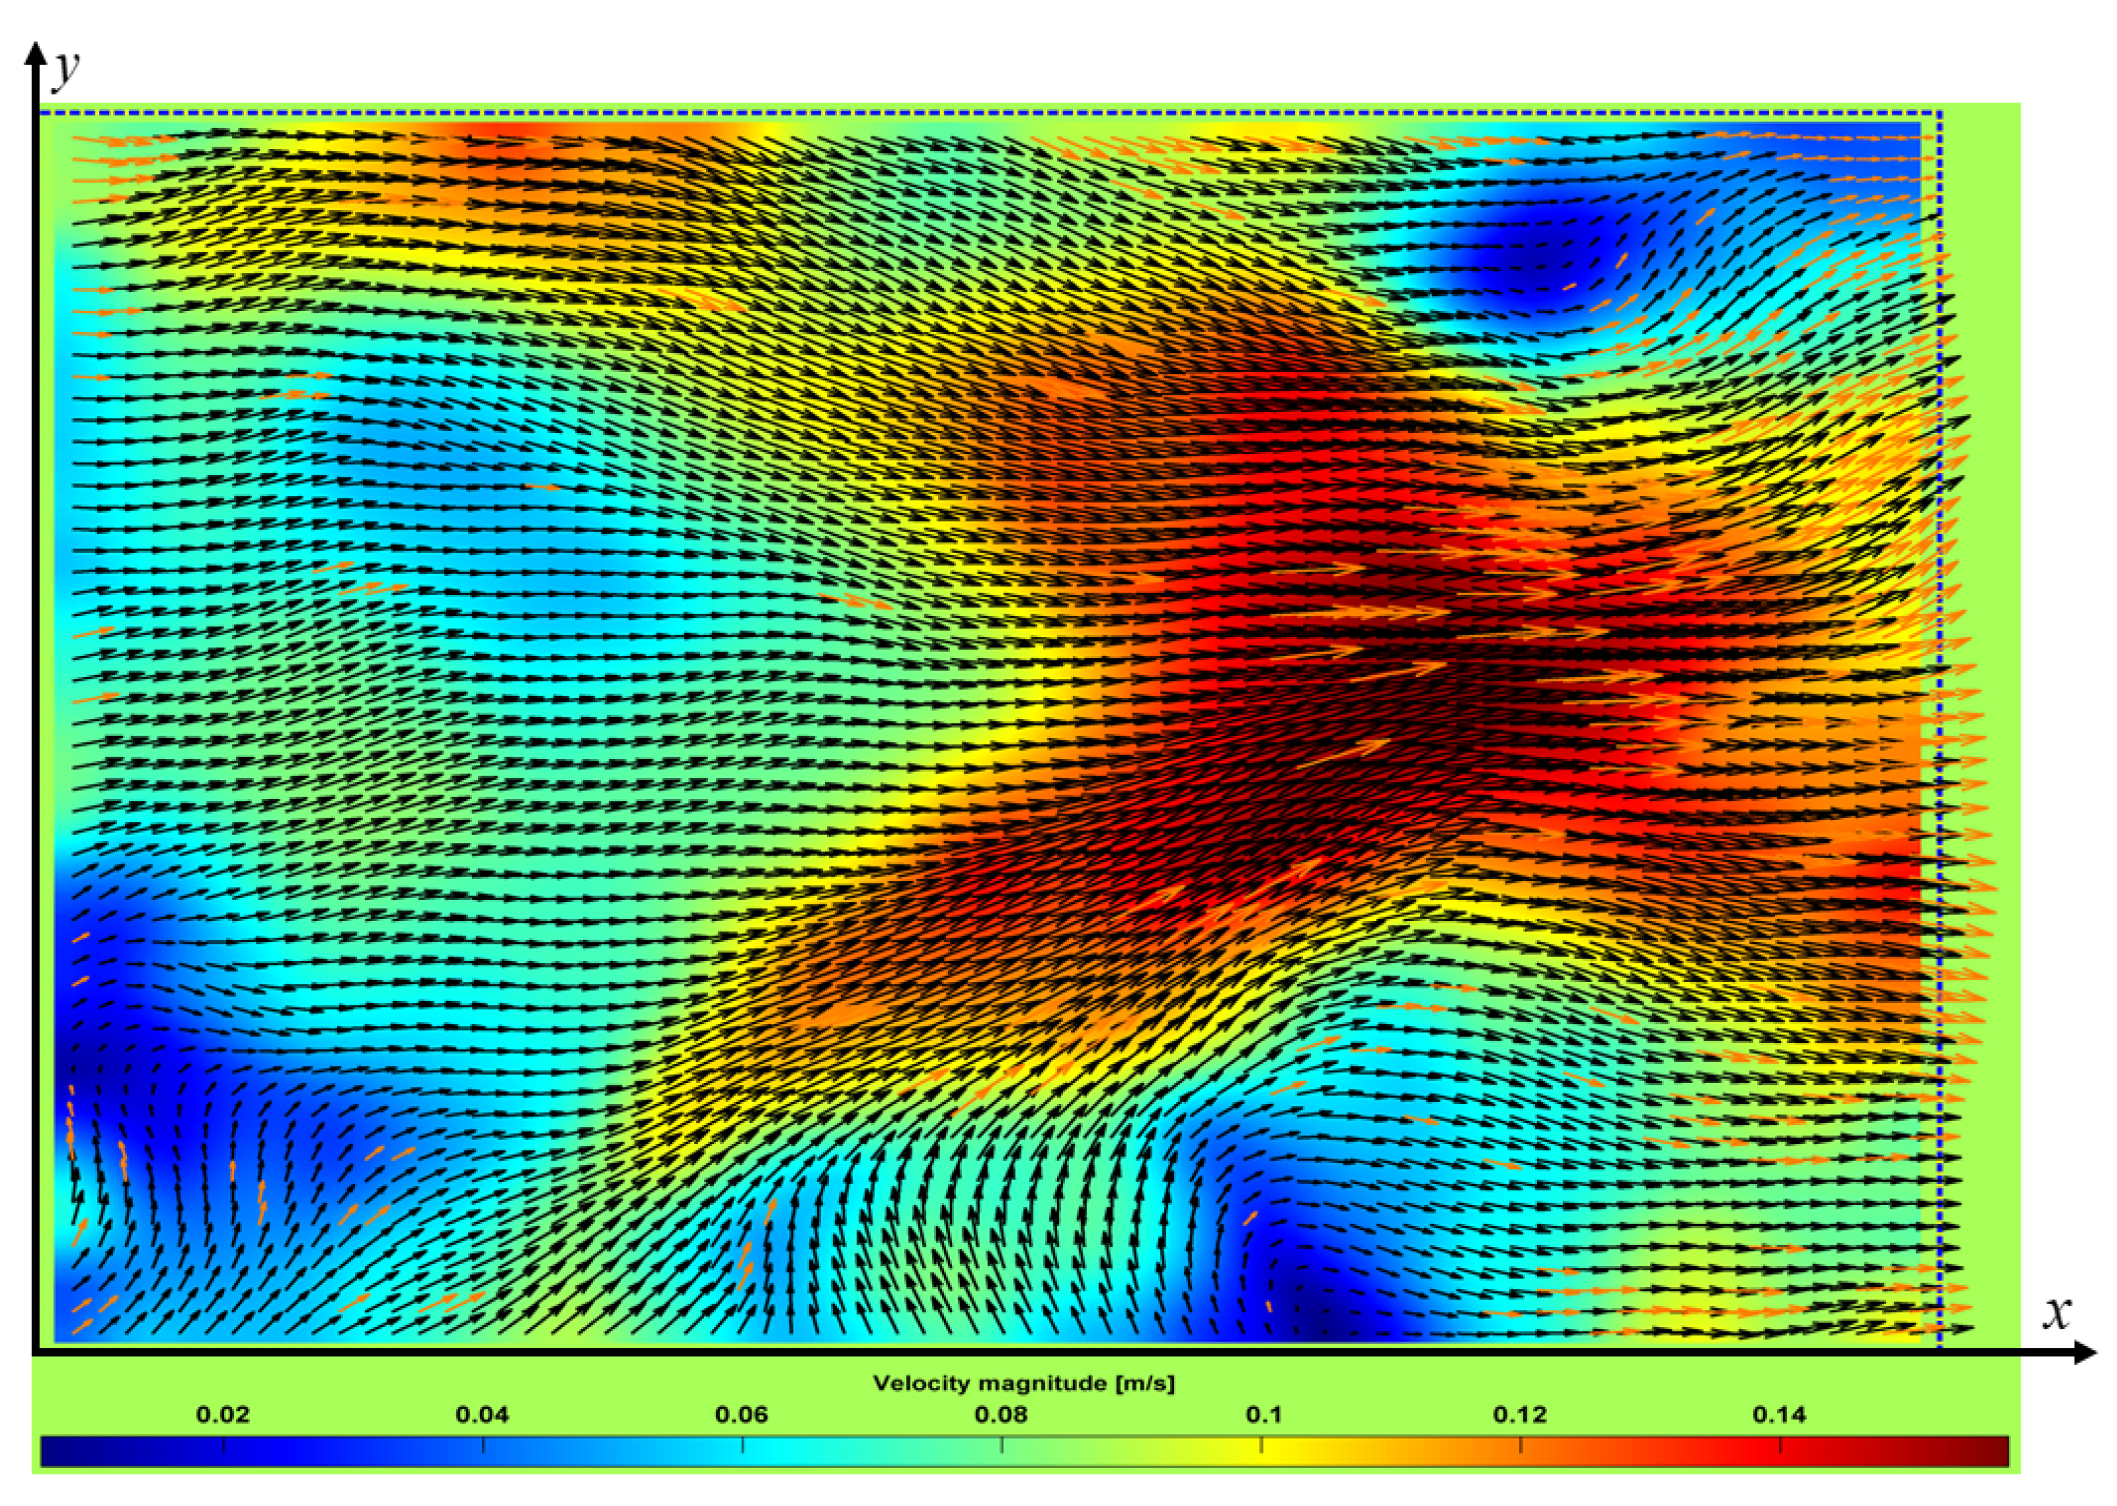
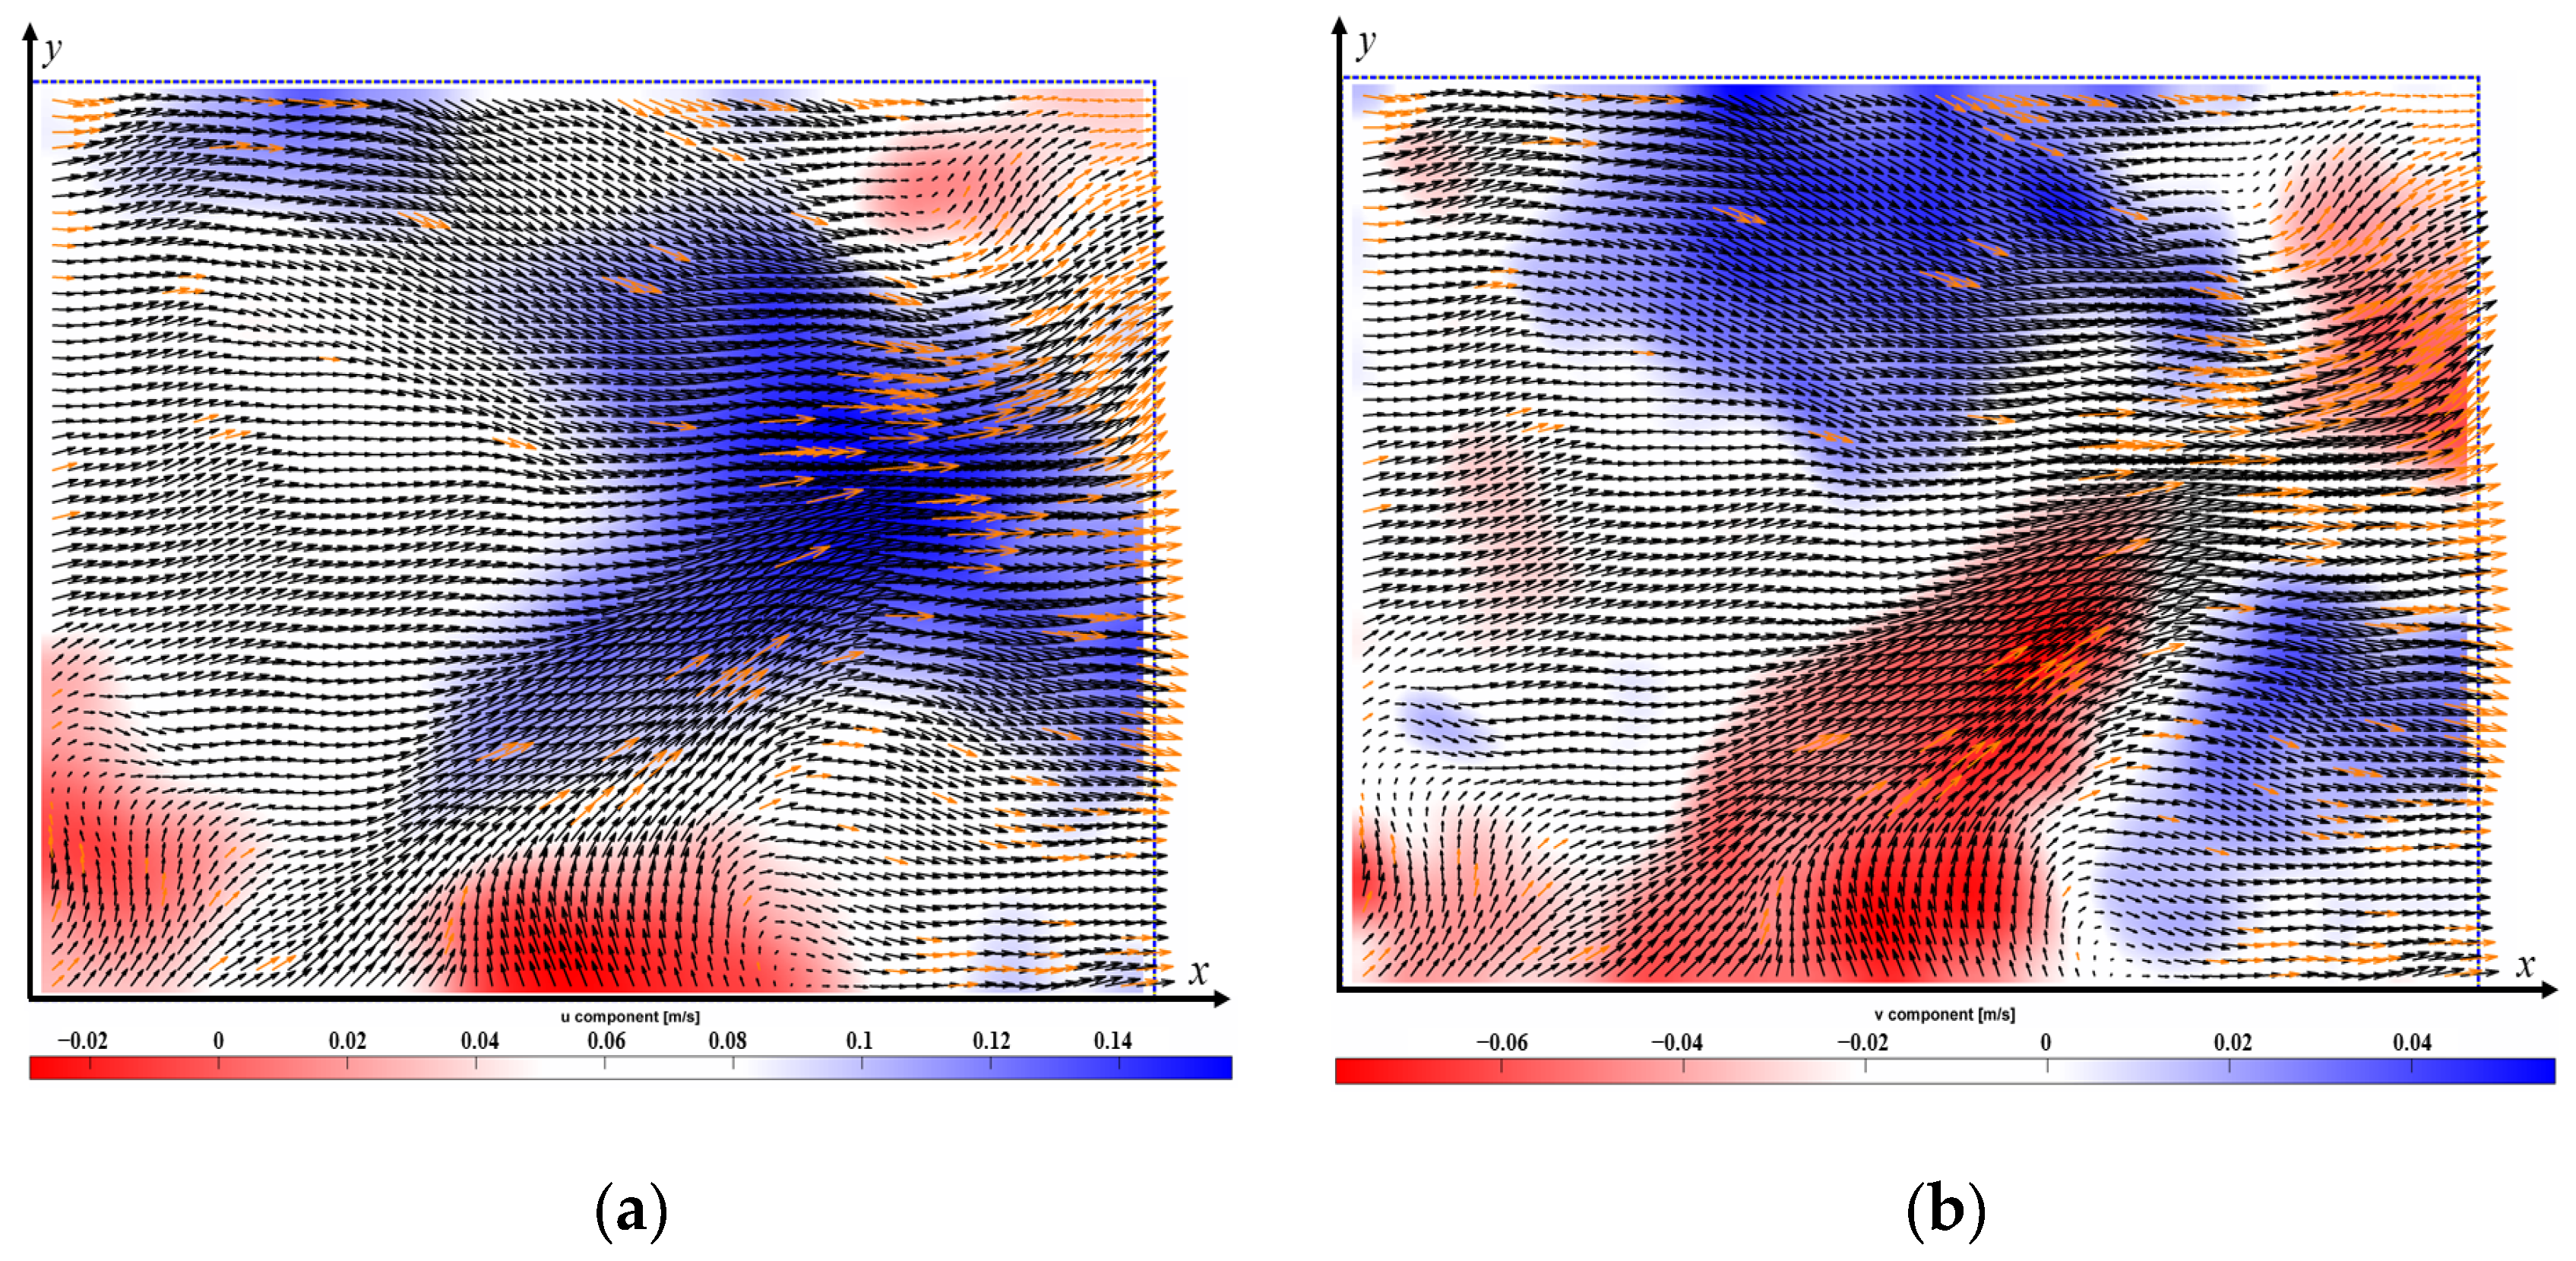
The visualisation of the flow velocity in the combustion process of a propane flame was realised. The velocity accuracy was 4.8 × 10⁻⁴ m/s, and the flow velocity was up to 0.23 m/s at the largest area, with a relative error of ±5%, presenting Gaussian distribution characteristics; the maximum average velocity of the transverse velocity of the flow field in this region was close to 0.15 ± 0.03 m/s; the upper and lower parts of the flow velocity in the longitudinal velocity are opposite to each other; and the phenomenon of convolutional suction is observed in the middle part of the flow field.
(4)
The visualisation of the vortex in the propane flame combustion process was realised, and it was found that there was a vortex in the flame jet. In the horizontal plane where the vortex occurred, the air velocity gradually increased as the distance from the centre of the jet was gradually narrowed, and vortices with opposite directions and a size of about 10 s−1 appeared in the upper and lower parts of the airflow at the same time.
(5)
The use of PIV technology, the visualisation of the propane flame combustion process, the application of PIV technology in dynamic flow fields and complex combustion chambers, and the analysis of the movement of the air flow field above the flame were used to achieve the visualisation of the flame measurements, providing the experimental basis for the study of fire extinguishing mechanisms and effective management of fires.
The low-budget PIV test platform built independently in this study is considered experimental equipment. Low-speed small flames were used to conduct the experiments, which proves the feasibility of the low-budget PIV test platform. Subsequent upgrading of the experimental equipment, such as upgrading the camera to the Fastcam sa1 double-exposure camera, overcoming the limitations of the traditional algorithms with the help of deep learning algorithms [35,41] applied to the PIV technology, and upgrading PIVlab to reconstruct the flow field [42,43] to improve the accuracy, etc., will allow the global high-speed flame motion law to be photographed. This will provide theoretical guidance for the subsequent study of the fire characteristics of different fuels. Additionally, an electrode plate can be added to the experimental platform to study the effect of an electric field on the flame, which will provide research ideas for future generations.

Author Contributions

S.L. conceived and designed the project. J.G. performed the experiments and analysed the data. Z.C. and B.Z. wrote and edited the manuscript. S.Z. reviewed and edited the manuscript. All authors have read and agreed to the published version of the manuscript.

Funding

National Key Research and Development Program of the Ministry of Science and Technology, “Research on the Construction of the Fire Safety Protection System”, No. 2021YFC3100202. Naval University OF Engineering, “Research on hot ignition mechanism and early fire dynamics of aviation kerosene” (2022502060).

Institutional Review Board Statement

Not applicable.

Informed Consent Statement

Not applicable.

Data Availability Statement

Data sharing does not apply to this article.

Conflicts of Interest

The authors declare no conflict of interest.

References

  1. Center for World Fire Statistics (CTIF). Center for World Fire Statistics Report No.28 [R/OL]. 2023. Available online: www.ctif.org (accessed on 21 October 2023).
  2. The State Bureau of Fire Rescue. In the First Half of 2023 Fire Statistics [EB/OL]. 2023. Available online: https://www.119.gov.cn/qmxfgk/sjtj/2023/38420.shtml (accessed on 25 October 2023).
  3. Dang, X.X. Experimental Research and Numerical Simulation of Double Swirl Annular Combustion Chamber. Ph.D. Thesis, Nanjing University of Aeronautics and Astronautics, Nanjing, China, 2009. [Google Scholar]
  4. Markus, R.; Jurgen, K.; Wereley, S.T.; Willert, C.E. Particle image velocimetry: A practical guide. Exp. Fluid Mech. 2017, 255, 160–162. [Google Scholar]
  5. Willert, C.E.; Gharib, M. Digital particle image velocity. Exp. Fluids 1991, 10, 181–193. [Google Scholar] [CrossRef]
  6. Cowen, E.A.; Monismith, S.G.; Cowen, E.A.; Monismith, S.G. A hybrid digital particle tracking velocimetry technique. Exp. Fluids 1997, 22, 199–211. [Google Scholar] [CrossRef]
  7. Yeh, Y.; Cummins, H.Z. Localized Fluid Flow Measurements with An He–Ne Laser Spectrometer. Appl. Phys. Lett. 1964, 4, 176–178. [Google Scholar] [CrossRef]
  8. Westerweel, J.; Elsinga, G.E.; Adrian, R.J. Particle image velocimetry for complex and turbulent flows. Annu. Rev. Fluid Mech. 2013, 45, 409–436. [Google Scholar] [CrossRef]
  9. Feng, H.; Meng, A.; Zhang, Y.; Gong, Y.; Li, Q. LDV measurements of particle fluctuation velocities in dilute gravity-driven gas-particle flows. Powder Technol. 2019, 360, 1368–1376. [Google Scholar] [CrossRef]
  10. Raiola, M.; Lopez-Nunez, E.; Cafiero, G.; Discetti, S. Adaptive ensemble PTV. Meas. Sci. Technol. 2020, 31, 085301. [Google Scholar] [CrossRef]
  11. Adrian, R.J. Scattering particle characteristics and their effect on pulsed laser measurements of fluid flow: Speckle velocimetry vs particle image velocimetry. Appl. Opt. 1984, 23, 1690. [Google Scholar] [CrossRef]
  12. Scharnowski, S.; Khler, C.J. Particle image velocimetry—Classical operating rules from today’s perspective. Opt. Lasers Eng. 2020, 135, 106185. [Google Scholar] [CrossRef]
  13. Chen, L.W.; Wang, Q.; Zhang, Y. Flow characterisation of diffusion flame under non-resonant acoustic excitation. Exp. Therm. Fluid Sci. 2013, 45, 227–233. [Google Scholar] [CrossRef]
  14. Wang, Y.Z. Measurement of Combustion Flow Field by Tracer Particle Imaging. Master’s Thesis, Shanghai Jiao Tong University, Shanghai, China, 2018. [Google Scholar]
  15. Wang, H.P.; Gao, Q.; Wang, S.Z.; Li, Y.H.; Wang, Z.Y.; Wang, J.J. Error reduction for time-resolved PIV data based on Navier–Stokes equations. Exp. Fluids 2018, 59, 149. [Google Scholar] [CrossRef]
  16. Verdier, A.; Santiago, J.M.; Vandel, A.; Saengkaew, S.; Cabot, G.; Grehan, G.; Renou, B. Experimental study of local flame structures and fuel droplet properties of a spray jet flame. Proc. Combust. Inst. 2017, 36, 2595–2602. [Google Scholar] [CrossRef]
  17. Meyer, T.R.; Roy, S.; Belovich, V.M.; Corporan, E.; Gord, J.R. Simultaneous planar laser-induced incandescence, OH planar laser-induced fluorescence, and droplet Mie scattering in swirl-stabilized spray flames. Appl. Opt. 2005, 44, 445–454. [Google Scholar] [CrossRef]
  18. Hiromasa, S.; Hara, S.; Inaoka, K. The velocity and thermal fields of two parallel plane jets using simultaneous PIV and two-color LIF measurements. Int. J. Heat Fluid Flow 2023, 103, 109192. [Google Scholar] [CrossRef]
  19. Ray, S.C.; Nishida, K.; McDonell, V.; Ogata, Y. Effects of full transient Injection Rate and Initial Spray Trajectory Angle profiles on the CFD simulation of evaporating diesel sprays-comparison between singlehole and multi hole injectors. Energy 2023, 263, 125796. [Google Scholar]
  20. Li, J.Q. Principle and application of PIV. Water Technol. Econ. 2015, 21, 40–42. [Google Scholar]
  21. Yang, X.; Yan, J. Principle and Application of PIV velocity measurement. J. Xihua Univ. (Nat. Sci. Ed.) 2005, 1, 19–20+36. [Google Scholar]
  22. Duan, L.; Kang, Q.; Shen, G.X. Particle image processing by PIV. J. Beijing Univ. Aeronaut. Astronaut. 2000, 26, 79–82. [Google Scholar]
  23. Duan, L.; Kang, Q.; Ding, H.Q.; Shen, G.X. Research on HPIV and its preliminary application. J. Beijing Univ. Aeronaut. Astronaut. 2000, 26, 83–86. [Google Scholar]
  24. Stamhuis, E.J. Basics and principles of particle image velocimetry (PIV) for mapping biogenic and biologically relevant flows. Aquat. Ecol. 2006, 40, 463–479. [Google Scholar] [CrossRef]
  25. Thielicke, W.; Stamhuis, E.J. PIVlab—Towards User-friendly, Affordable and Accurate Digital Particle Image Velocimetry in MATLAB. J. Open Res. Softw. 2014, 2, 30. [Google Scholar] [CrossRef]
  26. He, J.; Leng, C.; Liu, B.; Chen, Z.; Li, Z. Analysis of flame characteristics of low calorific value gas diffusion combustion under the action of thermal dynamics. Combust. Theory Model. 2020, 24, 965–982. [Google Scholar] [CrossRef]
  27. Hurley, M.J.; Gottuk, D.T.; Hall, J.R., Jr.; Harada, K.; Kuligowski, E.D.; Puchovsky, M.; Watts, J.M., Jr.; Wieczorek, C.J. SFPE Handbook of Fire Protection Engineering; Springer: Berlin/Heidelberg, Germany, 2016. [Google Scholar]
  28. Gu, X.; Zang, S.S.; Ge, B. Analysis of Velocity field Characteristics of Flame stability in turbulent combustion with humidification. Gas Turbine Technol. 2006, 2, 30–33. [Google Scholar]
  29. Zhang, J.H. Application Research of PIV Technology in Pulsating Flame Measurement. Master’s Thesis, Zhejiang University of Technology, Hangzhou, China, 2013. [Google Scholar]
  30. Wei, X. Study on flame morphology and flow field of lean premixed combustion. Master’s Thesis, Dalian University of Technology, Dalian, China, 2017. [Google Scholar]
  31. Shavit, U.; Lowe, R.J.; Steinbuck, J.V. Intensity Capping: A simple method to improve cross-correlation PIV results. Exp. Fluids 2007, 42, 225–240. [Google Scholar] [CrossRef]
  32. Karel, Z. Contrast Limited Adaptive Histogram Equalization. In Graphics Gems IV; Academic Press Professional, Inc.: Cambridge, MA, USA, 1994; pp. 474–485. [Google Scholar]
  33. Westerweel, J.; Scarano, F. Universal outlier detection for PIV data. Exp. Fluids 2005, 39, 1096–1100. [Google Scholar] [CrossRef]
  34. Zhang, Y.Z. Research on PIV Measurement of flat Flame combustion Velocity Field. Master’s Thesis, Inner Mongolia University of Science and Technology, Baotou, China, 2008. [Google Scholar]
  35. Cai, S.; Zhou, S.; Xu, C.; Gao, Q. Dense motion estimation of particle images via a convolutional neural network. Exp. Fluids 2019, 60, 1–16. [Google Scholar] [CrossRef]
  36. Zhang, W.; Zhang, Y.; Li, C.Q.; Fan, D.C. Study on flow field characteristics of fire plume based on different constrained forms of PIV. China Saf. Sci. J. 2020, 30, 135–141. [Google Scholar]
  37. Wang, Q.A.; Lu, A.Q.; Liang, X.; Li, J.X.; Palacios, A. Thermal radiation distribution of low-momentum jet diffusion flame under the effect of cross airflow. Fire Saf. J. 2023, 135, 103728. [Google Scholar] [CrossRef]
  38. Liu, Z.G. Research on Simultaneous Measurement of Temperature and Velocity Distribution in Combustion flow Field. Master’s Thesis, Qingdao University of Science and Technology, Qingdao, China, 2018. [Google Scholar]
  39. Xu, X.H.; Gong, Z.J.; Zhao, Z.W. PIV study of cold axial velocity Field in the main combustion zone of flat Flame combustion. J. Baotou Iron Steel Inst. 2006, 3, 218–221. [Google Scholar]
  40. Zhang, W. The Interaction between Gas Phase Flame and Solid Surface in Steady State and Accelerated Fire Propagation. Master’s Thesis, Wuhan University of Technology, Wuhan, China, 2023. [Google Scholar]
  41. Lagemann, C.; Lagemann, K.; Mukherjee, S.; Schrder, W. Deep recurrent optical flow learning for particle image velocimetry data. Nat. Mach. Intell. 2021, 3, 641–651. [Google Scholar] [CrossRef]
  42. Gao, Q.; Wang, H.P. Eigenorthogonal decomposition of bad vector of PIV Velocity Field. J. Exp. Mech. 2013, 28, 199–206. [Google Scholar]
  43. Wang, H.P.; Gao, Q.; Feng, L.H.; Wei, R.J.; Wang, J.J. Proper orthogonal decomposition based outlier correction for PIV data. Exp. Fluids 2015, 56, 1–15. [Google Scholar] [CrossRef]
Figure 1. Classification of fluid velocity measurement methods.
Fire 06 00464 g001
Figure 2. PIV principle schematic.
Fire 06 00464 g002
Figure 3. Single-exposure/double-frame workflow diagram.
Fire 06 00464 g003
Figure 4. Calculating the correlation matrix, query window A (pixel size), and query window B (pixel size) for cross-correlation calculation.
Fire 06 00464 g004
Figure 5. Algorithm flow chart.
Fire 06 00464 g005
Figure 6. (a) Experimental bench model. (b) Physical diagram of the experimental bench.
Fire 06 00464 g006
Figure 7. Experimental platform piping and accessories diagram.
Fire 06 00464 g007
Figure 8. Burner structural design.
Fire 06 00464 g008
Figure 9. (a) Particle generator and burner. (b) Gas flow diagram.
Fire 06 00464 g009
Figure 10. (a) Length calibration. (b) Experimental environment.
Fire 06 00464 g010
Figure 11. (a) Displacement field with many error vectors; (b) reduction in the displacement field.
Fire 06 00464 g011
Figure 12. (a) Captured image; (b) pre-processing results; (c) velocity field after multi-level grid iteration; and (d) velocity field after data validation and correction.
Fire 06 00464 g012
Figure 13. Velocity profiles of multiple flow fields.
Fire 06 00464 g013
Figure 14. Average velocity size distribution.
Fire 06 00464 g014
Figure 15. (a) Plot of transverse mean velocity u; (b) plot of longitudinal mean velocity v.
Fire 06 00464 g015
Figure 16. Horizontal distribution of speed magnitude. (a) Transverse sampling area; (b) velocity magnitude distribution.
Fire 06 00464 g016
Figure 17. Vortex positioning.
Fire 06 00464 g017
Figure 18. Mean pulsating vorticity distribution (left) and mean pulsating vorticity streamlines (right).
Fire 06 00464 g018
Table 1. Platform test equipment list.
Serial NumberNameSpecificationOperating Parameters
1Propane gas cylinder 40 LWorking pressure: 0.3–0.9 MPa
2TiO2 10 μm-
3Copper pipe Inner diameter: 20 mm -
4Sleeve Cylinder: h × d = 100 mm × 10 mm-
5Burner Plum blossom burner -
6Flowmeter Gas Roots flowmeter HK15-G10 0.5 m3/h–16 m3/hTolerance value: ±1.5%
7Air compressor SECOP SC21CL R404 104L2322 Working pressure: 0.9 MPa
8Air filter AC20A-B Pressure range: 0.06–0.85 MPaFiltration precision: 5 μm
9Ground glass bead Diameter: 6 mm-
10Plexiglass cover L × D × H = 1000 mm × 500 mm × 800 mm-
11Iron stand L × D × H = 1000 mm × 500 mm × 700 mm-
12laser MGL-FN-532Output wavelength: 532 nm
13CCD camera Huagu Power WP-UT130 Offset angle: 30°
14Colour filterTXLGPZD532Resolution: 1280 × 1024
Table 2. Propane parameters.
ItemPhysical and Chemical Properties
Molecular formulaC3H8
Molecular weight44.09
Density (kg/m3)1.83
Ignition temperature °C450
Heat of combustion MJ/kg46.36
PH value6.0–8.0
Table 3. Commonly used tracer particle parameters.
MaterialsMelting Point (°C)Density (g/cm3)Follow Characteristics
TiO218504.230.9992
Al2O320403.970.9993
MgO28523.580.9994
ZrO227005.890.9988
SiO216702.660.9998
Disclaimer/Publisher’s Note: The statements, opinions and data contained in all publications are solely those of the individual author(s) and contributor(s) and not of MDPI and/or the editor(s). MDPI and/or the editor(s) disclaim responsibility for any injury to people or property resulting from any ideas, methods, instructions or products referred to in the content.

