Article

Risk Assessment of Explosion Accidents in Hydrogen Fuel-Cell Rooms Using Experimental Investigations and Computational Fluid Dynamics Simulations

Hydrogen-Infrastructure Research Cluster, Korea Institute of Civil Engineering and Building Technology, Goyang-si 18544, Gyeonggi-do, Republic of Korea
*
Author to whom correspondence should be addressed.
Fire 2023, 6(10), 390; https://doi.org/10.3390/fire6100390
Submission received: 28 August 2023 / Revised: 22 September 2023 / Accepted: 26 September 2023 / Published: 11 October 2023
(This article belongs to the Special Issue Hydrogen Safety: Challenges and Opportunities)

Abstract

:
For the safe utilization and management of hydrogen energy within a fuel-cell room in a hydrogen-fueled house, an explosion test was conducted to evaluate the potential hazards associated with hydrogen accident scenarios. The overpressure and heat radiation were measured for an explosion accident at distances of 1, 2, 3, 5, and 10 m for hydrogen–air mixing ratios of 10%, 25%, 40%, and 60%. When the hydrogen–air mixture ratio was 40%, the greatest overpressure was 24.35 kPa at a distance of 1 m from the fuel-cell room. Additionally, the thermal radiation was more than 1.5 kW/m2, which could cause burns at a distance of 5 m from the hydrogen fuel-cell room. Moreover, a thermal radiation in excess of 1.5 kW/m2 was computed at a distance of 3 m from the hydrogen fuel-cell room when the hydrogen–air mixing ratio was 25% and 60%. Consequently, an explosion in the hydrogen fuel-cell room did not considerably affect fatality levels, but could affect the injury levels and temporary threshold shifts. Furthermore, the degree of physical damage did not reach major structural damage levels, causing only minor structural damage.

1. Introduction

As the world realized the necessity of environmental preservation, a new climate-change agreement framework, the Paris Agreement, was adopted in 2015. There, 196 countries committed themselves to increase their intended nationally determined contributions every five years to cut greenhouse gas (GHG) emissions by 37% from 2020 to 2030, reducing the global average temperature increase from 2 °C to less than 1.5 °C [1]. Consequently, hydrogen energy is being increasingly employed in a variety of areas, and considerable research and development—particularly in the housing sector—has been conducted in Europe, Japan, and the United States. In 2018, the first energy-self-sufficient residential complex in the world was built for 30 households in Vargarda, southern Sweden [2]. Moreover, the UK converted existing natural gas pipelines through the H21 Leeds City project to demonstrate that hydrogen could be safely transported [3], and 35 micro-hydrogen fuel cogeneration plants were installed in Vestenskov, Roland Island, Denmark [4]. Hydrogen was also supplied to houses and public buildings in the Kitakyushu region of Japan, with the power-supply system being operated using hydrogen fuel-cells, solar power generation, and battery storage [5]. For the first time in North America, hydrogen houses, which generate hydrogen through solar power generation and utilize it for living, were approved in the United States. Moreover, to enhance their efficiency and affordability, hydrogen houses are being developed in complexes and integrated with hydrogen fuel-cell technology [6].
Hydrogen is the smallest and lightest element on Earth, belonging to group 1, period 1 (atomic number 1) in the periodic table of elements. It is a flammable gas that rapidly ignites when exposed to air or oxygen. Among various potential accident scenarios, the most critical is the occurrence of an explosion due to hydrogen leakage within enclosed or semi-enclosed spaces, such as fuel-cell rooms. Evaluating this scenario is essential, particularly for determining separation distance calculations during construction planning.
Numerous studies have been undertaken to forecast blast loads within confined spaces, with the intent of integrating them into the architectural design phase to ensure adequate structural resistance. Given the established correlation between the initial mass of TNT and blast loads, the majority of structural explosion load investigations have employed the TNT equivalence method [7,8]. In tandem with these efforts, real-scale experiments have been conducted on a limited scale to support this methodology [9].
Recently, as explosive gas installations like hydrogen have been incorporated into buildings, investigations into gas explosions using the TNT equivalence method have emerged [10,11]. However, the TNT equivalence approach possesses inherent limitations in capturing the characteristics of gas explosions. Consequently, endeavors have been directed towards conducting genuine-scale explosion trials involving gases such as hydrogen to determine blast loads [12,13,14,15,16]. However, as a majority of these experiments are conducted in open spaces, describing explosions occurring within enclosed or semi-enclosed settings like houses and buildings remains challenging [17].
Hydrogen facilities are intricate conglomerates of various installations, often encountering opportunities for gas mixtures. For safety assurance, analyses have been performed on the risks posed by mixed gases like hydrogen–methane [18,19], hydrogen–ammonia [20,21], hydrogen–magnesium [22,23], and hydrogen–tungsten [24]. However, no research has directly quantified the blast loads resulting from the explosion of such mixed gases within buildings.
Conducting authentic-scale explosion trials on concrete structures holds pivotal importance. Such endeavors play a definitive role in assessing the potential damages to both buildings and individuals in their proximity, thereby aiding in establishing safe separation distances [25,26,27,28]. This significance becomes particularly pronounced with the growing number of buildings adopting hydrogen as a fuel source, necessitating a comprehensive analysis of the impacts of hydrogen–air explosions on structures and people, as well as the provision of fundamental data for incorporation into risk assessments [29,30,31,32].
Brock et al. [33] and Xirui et al. [34] analyzed the damage effects of hydrogen gas explosions and jet flame accidents using computational fluid dynamics (CFD).
In this study, the risk of a hydrogen explosion was evaluated by assuming the boiler room of Lauren House to be a hydrogen-housing fuel-cell room. The hydrogen-housing fuel-cell room (1.36 m2) is located on the first floor, without separate ventilation, and shares the outside wall of the house. A wooden stair landing exists at the top leading to the second story, and the entrance is accessible by a door separate from the front door [35]. The probability of an accident in a hydrogen-housing fuel-cell room depends on hydrogen release under accident scenarios. Hydrogen release depends on the leak diameter and pressure, resulting in various mass flow rates of leakage. Previously, a hydrogen explosion test was conducted in a hydrogen-housing fuel-cell room with a hydrogen concentration of 40% only, where the flame propagation speed was the quickest, and the explosion pressure was high, as the worst-case scenario [36]. Although accidents with hydrogen concentrations of 40% have to be considered seriously as the worst-case scenarios, it is important to investigate the effects of overpressure and impulse on the human body and construction under various hydrogen concentrations. In this study, an experiment was conducted with a hydrogen concentration of 40% in the air to observe the overpressure and impulse along the distance from the ignition source, resulting in a risk area caused by overpressure and impulse. Moreover, computational fluid dynamics (CFD) was used to compare and analyze previously produced experimental data, as well as to validate its reproducibility. Hydrogen concentrations of 10%, 25%, and 60% were simulated for accident scenarios beyond the scope of the experiment.

2. Materials and Methods

2.1. Experimental Setup and Materials

Explosions generate a large amount of energy and are accompanied by blast waves, fragments, debris, heat flux, and noise. The phenomenon of a vapor-cloud explosion occurs when a considerable volume of flammable vapor is discharged into the environment, mixes with air to form a vapor cloud, and explodes when it comes into contact with an ignition source at an explosive concentration [37]. Consequently, the extent of damage caused by deflagration in a fuel-cell room of a house employing hydrogen as an energy source was investigated in this study.
A reinforced concrete structure (internal volume: 2.13 m3) was constructed to the actual scale of the fuel-cell room, as shown in Figure 1 and Figure 2 (L: 1825, W: 745, H: 1570 mm). A hydrogen facility model (L: 600, W: 500, H: 1000 mm) was placed within it, assuming that a fuel-cell was installed. Consequently, the obstacle blockage ratio increased to approximately 14.05%. One reflected pressure measurement sensor was installed within the structure, as shown in Figure 3 (H: 1000 mm), and four incident pressure measurement sensors were mounted at various distances from the entrance of the structure (1, 2, 3, and 5 m).
A plastic sheet of thickness 2 mm was attached to the frame of the wooden door for this experiment. Three nozzles on the inside of the structure supplied hydrogen, designed to match the hydrogen–air mixing ratio (40%) within the structure by means of small fans. A hydrogen concentration sensor and an ignitor were positioned in the center of the structure, and when the hydrogen concentration was within the correct range (error rate ± 3%), the hydrogen supply was turned off and lit. The incident pressure and reflected pressure were measured at microseconds using a pressure sensor linked to a data logger. After supplying hydrogen for 170–230 s to match the hydrogen–air mixing ratio of 40%, ignition was performed after the flow had been stabilized for approximately 90 s.

2.2. Characterization of Materials

In an experiment using a plastic sheet, the length of the flame spreading from the ignition source was visualized, as shown in Figure 4. After a fire ball (Figure 4b) formed during the explosion, a jet fire (Figure 4c) occurred in the horizontal direction and a mushroom cloud (Figure 4d) formed. During the explosion, a part of the plastic sheet caught on the pressure gauge (P1) closest to the entrance of the structure. Thus, the P1 graph after 0.017 s exhibits a considerable difference in pressure unlike the other results, as shown in Figure 5. The peak pressure was measured to be 19.6 kPa (P1) at 1 m, 15 kPa (P2) at 2 m, 10.8 kPa (P3) at 3 m, and 6.7 kPa (P4) at 5 m from the entrance of the structure.
The plastic sheet only served to confine the hydrogen–air mixture gas inside but had an insignificant effect on the pressure. As a result, the difference between the reflected pressure inside (16.5 kPa (P6)) and the maximum incident pressure 1 m outside (19.7 kPa (P1)) was not large [13].
The impulse is the sum of the pressure values applied during the duration of the explosion. It can be obtained by the area under the curve in the overpressure–time graph using the integral function [38], as follows:
i s + = t 0 + t a + t 0 + P s t P 0 d t ,
where P 0 denotes the ambient pressure [Pa], P s is the incident overpressure [Pa], the arrival time denotes the duration of the positive phase [s], and t 0 + is the specific impulse of the positive phase [Pa·s].
The impulse value ( i s + ) was measured to be 59.54 Pa·s at P1, 40.25 Pa·s at P2, 28.75 Pa·s at P3, and 10.37 Pa·s at P4.

2.3. CFD Numerical Setup

The calculation grid for the numerical analysis of the hydrogen leak explosion in the hydrogen-housing fuel-cell room is as shown in Figure 6 and Figure 7. The external flow regions (L: 40 m, W: 40 m, H: 20 m) were set large enough so that the external flow field did not affect the calculation results. The inside of the fuel-cell room had the same internal volume as that in the experiment (L: 1825 mm, W: 745 mm, H: 1570 mm) and a hydrogen facility model (L: 600 mm, W: 500 mm, H: 1000 mm) was installed inside it.
In this study, the atmosphere conditions were set to be the same as the experiment—that is, a temperature of 8.4 °C, wind speed of 11.5 km/h, and northeast wind direction perpendicular to the door of fuel-cell room. For numerical analysis, the mass conservation equation, momentum conservation equation, k−ε turbulence model, species transport equation, and discrete ordinates radiation model were used. Here, k−ε turbulence models are used to model the Reynolds stress tensor term in the momentum equation because it shows reasonable validation results as compared to experimental results in time-dependent overpressure as shown in Figure 8. To simply simulate hydrogen combustion, four chemical species of H2, O2, H2O, and N2 were considered, and a one-step chemical reaction equation (2H2 + O2 → H2O) was applied.
Regarding the hydrogen volume fraction inside the office at the beginning of the calculation, four conditions of hydrogen concentrations of 10%, 25%, 40%, and 60% were considered. Time integration was performed by a first-order explicit Euler method incorporating a variable time-stepping method dependent on the local CFL condition. The discretization of the convective term was done using a second-order scheme, and the diffusive term in the equations was evaluated using a central-differencing scheme. The SIMPLE scheme was used for pressure–velocity coupling. PRESTO (the pressure staggering option) was used to interpolate the pressure at the face from the cell-center values. After convergence using external flow calculations in a steady state, an explosion analysis was performed for each hydrogen volume fraction. The results were obtained by performing transient analysis of a total of 10,000 steps up to the calculation time of 100 ms using a time-step size of 0.01 ms. ANSYS Fluent 2020 R2—a commercial thermal flow analysis program based on the finite volume method—was used for numerical analysis [39].
The mass conservation equation can be expressed as follows:
ρ t + · u = 0 ,
where ρ denotes the fluid density, and u denotes the velocity vector of the fluid.
Furthermore, the momentum conservation equation in vector form can be expressed as follows:
ρ t ρ u + · ρ u u = P ρ + · τ γ + ρ g ,
Γ τ = μ u + u T 2 3 · u I ,
where t denotes the time, ρ denotes the density, P denotes the pressure, g denotes gravity, γ τ denotes the stress tensor term, u μ denotes the viscosity, and I denotes the unit tensor.
The energy conservation equation can be expressed as follows:
ρ t ρ E + · u ( ρ E + P ρ ) = · ( k e f f T i j h j J j + ( τ γ e f f · u ) ) + S h ,
where k e f f denotes the conductivity (meaning k + k t ), k t denotes the turbulent thermal conductivity, J j denotes the diffusion rate of chemical species j , and S h denotes the source term by chemical reaction.
The Reynolds averaged Navier–Stokes (RANS) equation can be used to analyze the turbulence model numerically. The fluid velocity is split into an average component and a turbulent fluctuation component, the governing equation for the average component and the terms originating from the turbulent fluctuation component being calculated to simulate the turbulence model using the RANS equation. In this calculation, we used the standard k−ε turbulence model, which has been widely applied and verified for turbulent flow phenomena. The standard k−ε turbulence model based on the equations of turbulent kinetic energy (k) and dissipation rate (ε) can be expressed as follows:
t ρ k + x i ρ k u i = x i j μ + μ t σ k k x j + G k + G b ρ ϵ Y M ,
t ρ ϵ + x i ρ ϵ u i = x i j μ + μ t σ ϵ k x j + C 1 ϵ ϵ k G k + G b C 2 ϵ ρ ϵ 2 k ,
where G b denotes the buoyant turbulent kinetic energy, G k denotes the turbulent kinetic energy due to the mean velocity gradient, Y M denotes the source term for the dissipation rate of incompressible turbulence, C 1 ϵ and C 2 ϵ denote model constants, and σ k and σ ϵ denote the turbulent Prandtl numbers for k and ε, respectively. Additionally, μ t denotes the turbulent viscosity and can be expressed as follows:
μ t = ρ C μ k 2 ϵ ,
where C μ denotes the model constant. The five constants of the standard k−ε turbulence model are C 1 ϵ = 1.44, C 2 ϵ = 1.92, C μ = 0.09, σ k = 1.0, and σ ϵ = 1.3.
The species transport equation can be used to analyze the combustion reaction, expressed as follows:
t ρ Y j + · ρ u Y j = · J j + R j ,
where R j denotes the production rate of the chemical species j .
The mass diffusion rate J j of the chemical species j can be expressed as follows:
J j = ρ D j , m + μ t S c t Y j D T , j T T ,
where D j , m denotes the mass diffusion rate coefficient of the chemical species j , D T , j denotes the thermal diffusivity, and S C t denotes the turbulent Schmidt number.

3. Results and Discussion

3.1. Validation Results

The maximum overpressures of the measuring points when the hydrogen volume fraction was 40% were compared between the full-scale explosion test and the CFD analysis, as shown in Figure 8. The maximum overpressures obtained from CFD were overestimated as 19.5% at Point 1, 18.7% at Point 2, 25.5% at Point 3, and 32.0% at Point 4 compared to the actual explosion test values. It can be seen that overpressure was more accurately estimated close to the ignition source, whereas the accuracy was low at greater distances.
In terms of the duration, there was a 3 ms difference between the time of positive pressure and the time of negative pressure at Point 1, but a 1 ms difference occurred at Points 2, 3, and 4. Although the estimation accuracy of overpressure far away was less than 30% compared to the experiment, the overpressure was quite low at 6.7 kPa at Point 4. From a risk analysis perspective, the effect of low overpressure at far distances on the human body or construction can be neglected. Consequently, it was evident that the experimental process had been adequately validated.

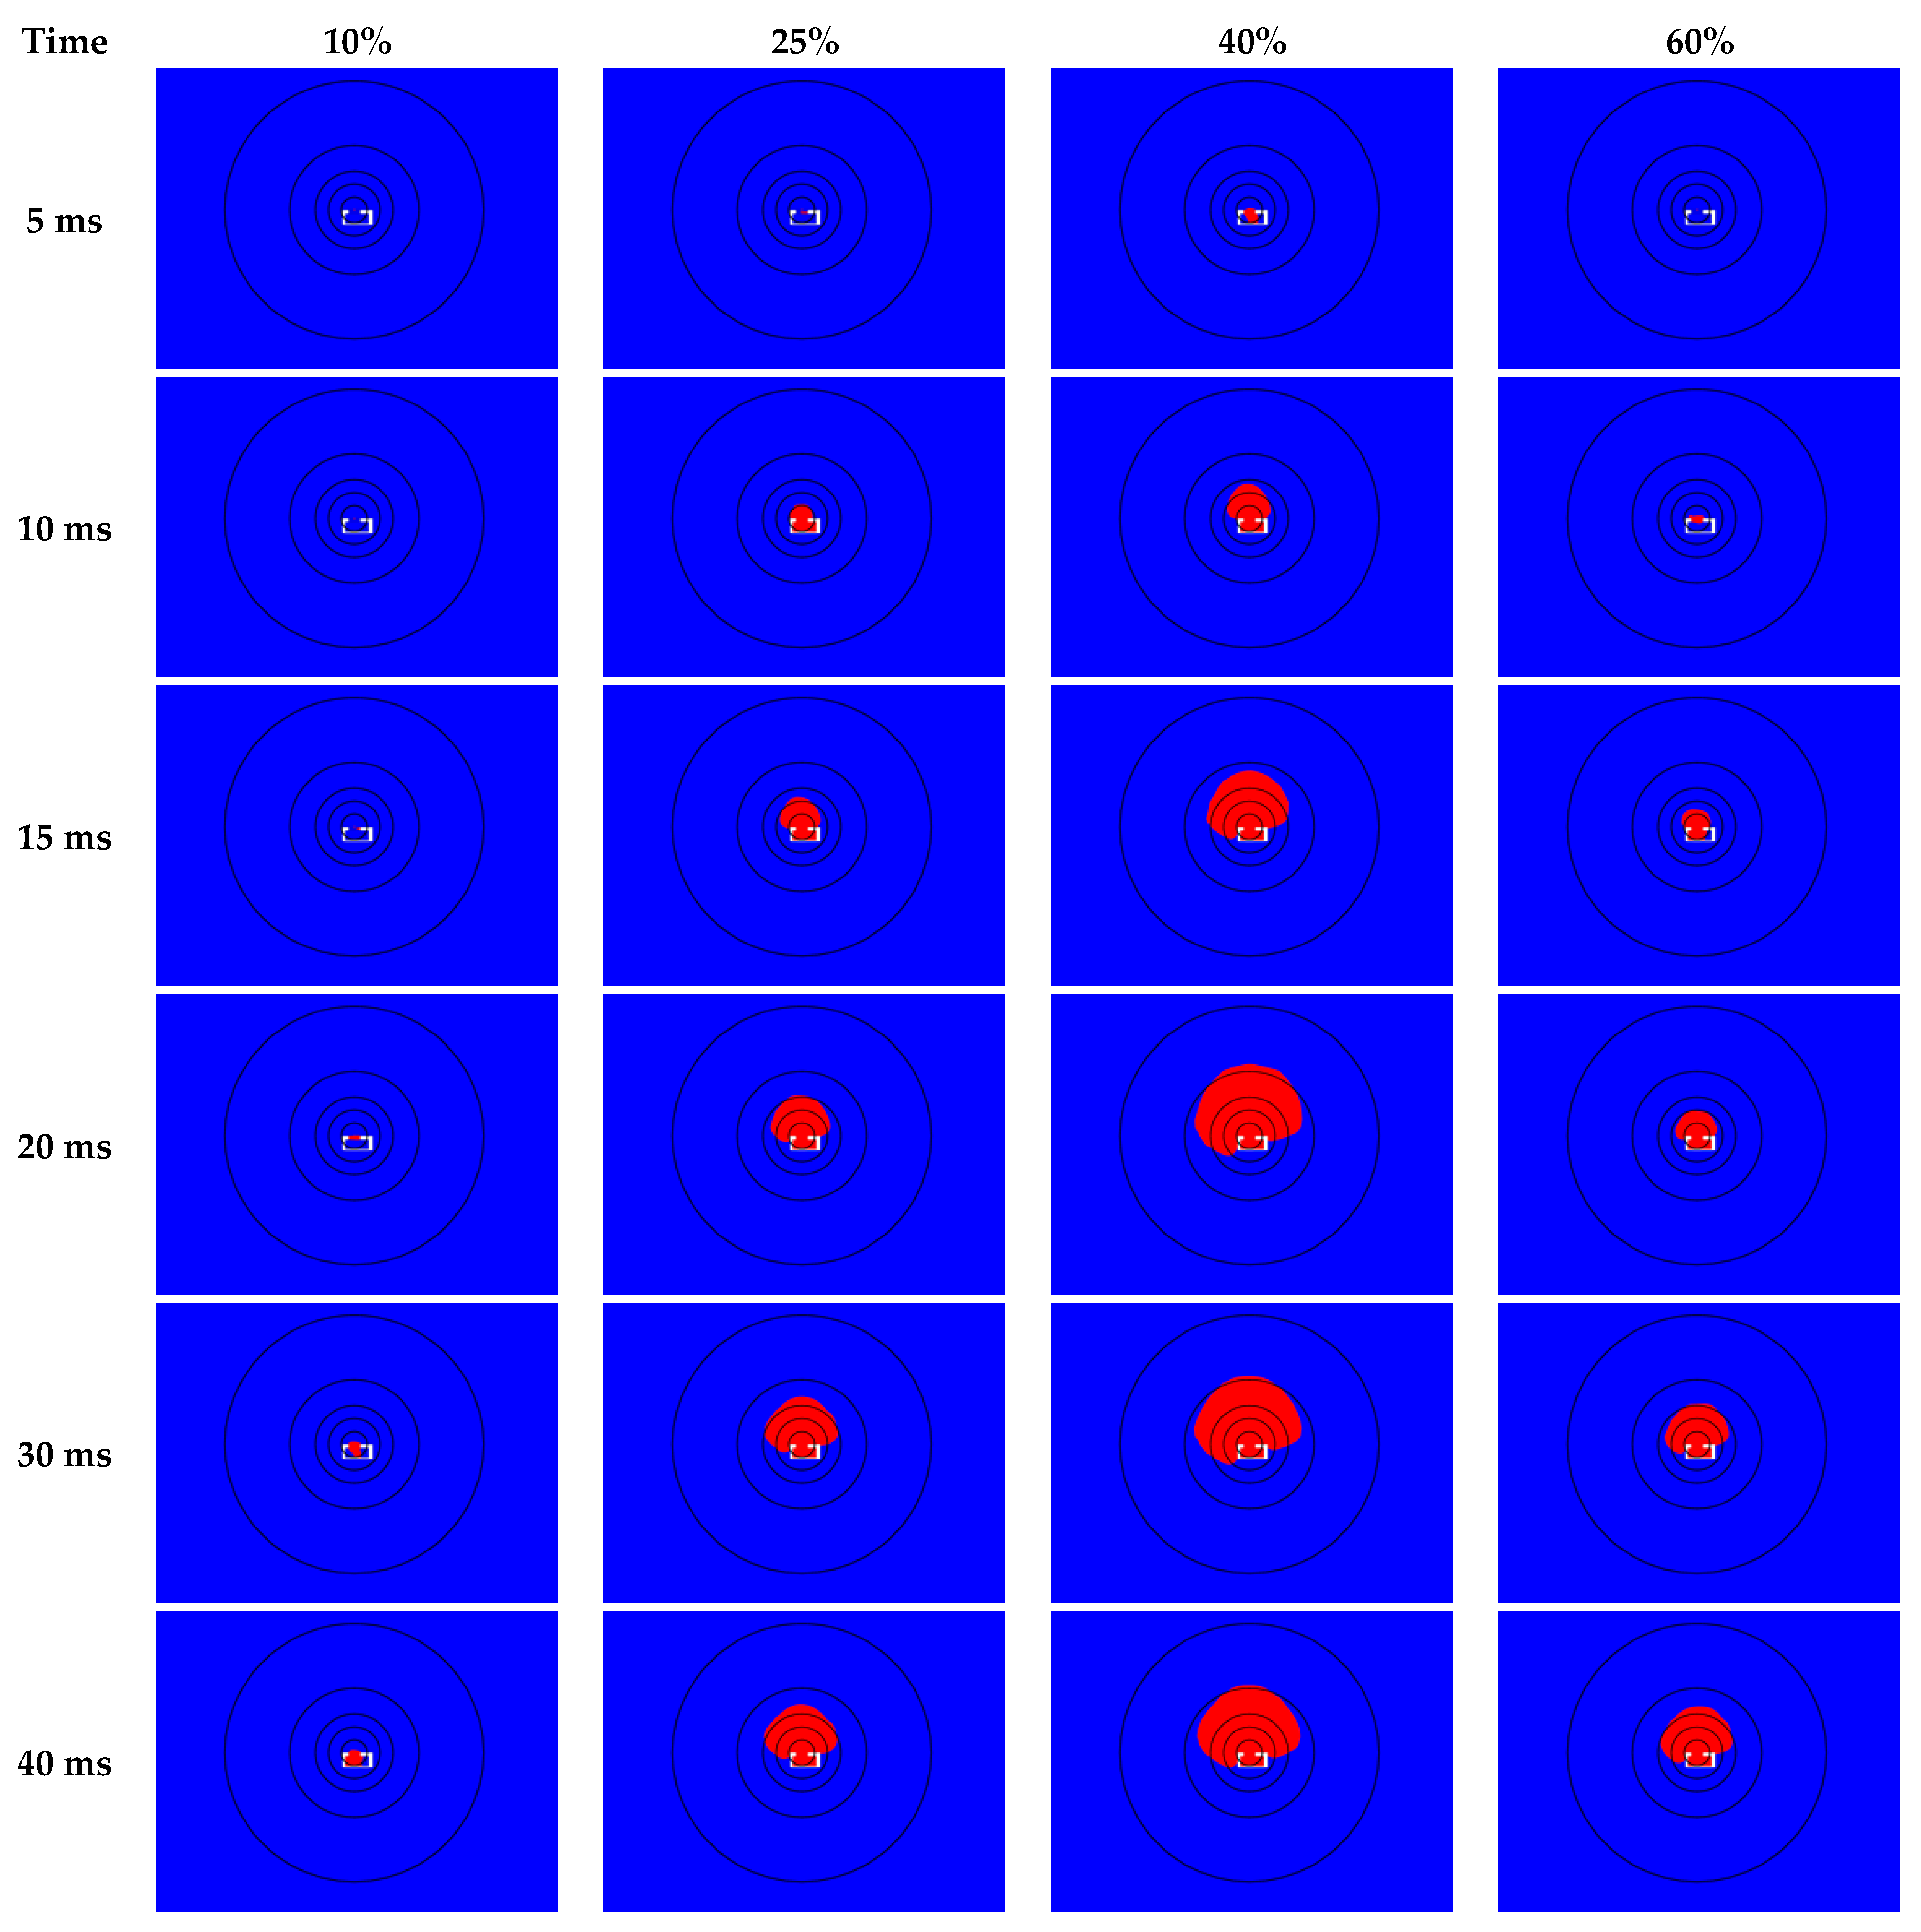
3.2. Validation CFD Modeling Results

The peak overpressure and impulse values at each measuring point for hydrogen volume fractions of 10%, 25%, 40%, and 60% are as shown in Figure 9, Figure 10 and Figure 11. The hydrogen volume fractions at which the high peak pressure and impulse occur are 40%, 25%, 60%, and 10%, in descending order (Figure 9).
It shows similar tendency of peak overpressure in accordance with hydrogen volume fraction as compared to results by Holtappels [40]. The peak overpressure under a hydrogen concentration of 40% was more than 16.5 kPa at the measuring points at 1 m and 2 m, whereas those under hydrogen concentrations of 10%, 25%, and 60% were less than 16.5 kPa at every measuring point. A similar tendency was found in the impulse (Figure 10 and Figure 11).
As shown in Figure 10, two peaks were observed in the overpressure over time with hydrogen volume fractions of 25%, 40%, and 60% at Point 1. The magnitude and duration of the second peak were less than those of the first peak. The second peak was caused by reflection of a pressure wave in fuel-cell room. As shown in Figure 12a–c, the main pressure wave emerged from the fuel-cell room after ignition, and it represents the first peak. At 13 ms after ignition, the second peak followed, caused by pressure reflection(see Figure 12d,e red circle). A similar peak overpressure pattern was found from vented deflagration [41].
In Figure 13, the black line represents the radial distance from the door of the fuel-cell room in order to illustrate the minimum separation distance. Figure 14 shows the overpressure ranges with different hydrogen concentrations.
Here, the impact range calculated based on 1.35 kPa (green) caused a temporary threshold shift (TTS) and that based on 16.5 kPa (yellow) caused an eardrum rupture with a 1% probability. At a hydrogen volume fraction of 10%, the impact range of an overpressure of 1.35 kPa was less than 2 m. At those of 25% and 40%, the pressure inside the hydrogen-housing fuel-cell room was more than 16.5 kPa. At 40 ms, an overpressure of 1.35 kPa was evident up to a distance of 10 m. The overpressure behind the wall opposite the door was similar to that in front of it. At a hydrogen volume fraction of 60%, an overpressure of 1.35 kPa was evident at 30 ms and at a distance of more than 5 m.
The thermal radiation range (red) of 1.5 kW/m2 or more was calculated through CFD modeling, as shown in Figure 15. In the CFD modeling of pressure change, the overpressure was calculated in an area opposite the door. However, in the CFD modeling of thermal radiation, the thermal radiation was calculated only towards the door and not in the area opposite it. It is evident that the thermal radiation range was the widest when the hydrogen volume fraction was 40%, with thermal radiation ranges of similar widths being calculated for the hydrogen volume fractions of 25% and 60%. When the hydrogen volume fraction was 10%, the thermal radiation range was 1.5 kW/m2 or more only inside the fuel-cell room. The thermal radiation range when the hydrogen volume fraction was 40% extended to its maximum range 20 ms after the explosion. Furthermore, 1.5 kW/m2 or more was evident up to a distance of 5 m in front of the door. At the hydrogen volume fractions of 25% and 60%, the thermal radiation extended to its full range 30 ms after the explosion, and 1.5 kW/m2 or more was measured up to a distance of 3 m in front of the door.

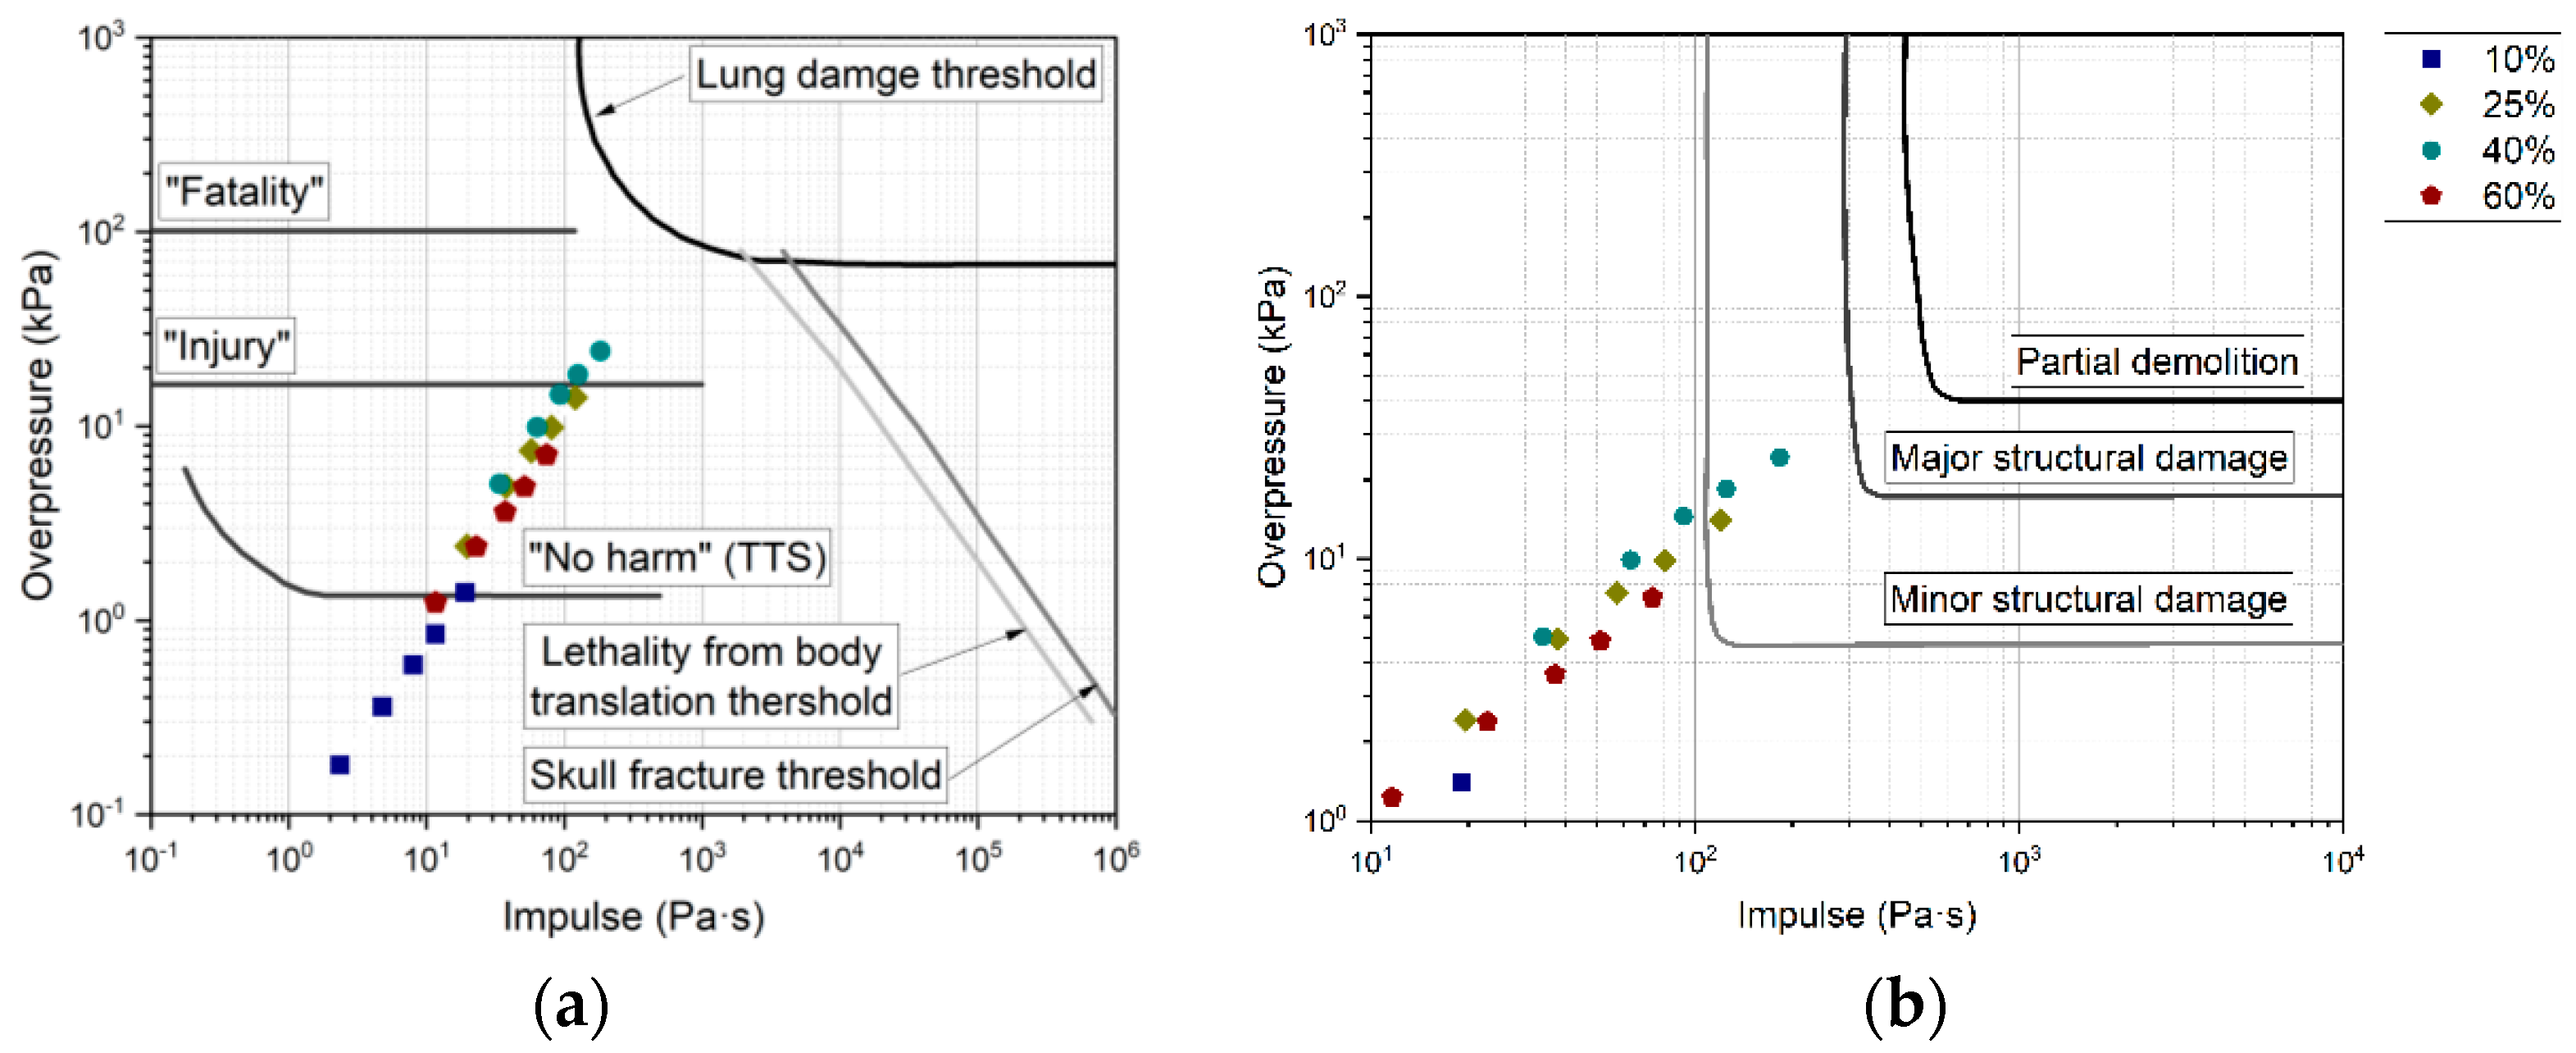
3.3. Risk Level Depending on Overpressure

Explosions generate blast waves and debris or fragments that can cause harm to people and damage buildings. As shown in Table 1, they can inflict direct harm to the human body, such as causing pulmonary hemorrhaging or eardrum ruptures, or indirect harm caused by the collision of hard objects due to displacement of the entire body by the blast wave [40,42]. The physical damage caused by the blast wave can be expressed in terms of peak pressure and impulse, the scaled overpressure and impulse being expressed as follows:
P ¯ = P p 0 ,
i ¯ = i p 0 1 / 2 × m 1 / 3 ,
where P ¯ denotes the scaled overpressure, P denotes the actual pressure acting on the body, p 0 denotes the atmospheric pressure, i ¯ denotes the scaled impulse, i denotes the impulse, and m denotes the mass of the body [38,43].
Moreover, explosions can cause TTS that temporarily harms the human body. Baker defined the value at the peak pressure of 1.35 kPa and the impulse of 1 Pa·s as the threshold [40,44]. A person hit by a blast wave higher than 16.5 kPa has a 1% chance of suffering an eardrum rupture, and a person hit by that of 100 kPa or more has a 1% chance of suffering a pulmonary hemorrhage [38,42]. The peak pressure and impulse results obtained in this study showed that an injury could be inflicted up to distances of 3 m when the hydrogen–air volume fraction was 40% and 1 m when the hydrogen–air volume fraction was 25%, as shown in Figure 16a.
Table 1. Effects on people from blast waves [45].
Incident Pressure (kPa)Harm Level
13.8Eardrum rupture threshold [46]
16.51% eardrum rupture probability [42]
231% eardrum rupture [47]
25~351% fatality probability [48]
As shown in Table 2, the level of damage to buildings and property corresponds to “total destruction” if the pressure exceeds 83 kPa, “severe damage” if it exceeds 35 kPa, “moderate damage” if it exceeds 17 kPa, and “light damage” if it exceeds 3.5 kPa [38,45]. Through the peak pressure and impulse results obtained in this study, the level of damage to building and property was predicted to be higher than the criterion for minor structural damage, which occurs up to a 2 m distance when the hydrogen–air volume fraction is 40% and up to a 1 m distance when the hydrogen–air volume fraction is 25%, as shown in Figure 16b. However, it was predicted to be lower than the criterion for major structural damage; that is, no major building damage was predicted.

3.4. Risk Level Depending on Heat Flux

The maximum wavelength of the hydrogen flame is approximately 311 nm, which corresponds to the ultraviolet region of the radiation spectrum. Since it does not emit visible light, it can be difficult for people to notice it and recognize any thermal hazard. Even people who do not come into direct contact with a hydrogen flame may suffer third-degree burns or worse, with the effects on the human body at various levels of heat flux being as listed in Table 3 [49]. Exposure to thermal radiation of 1.5 kW/m2 or higher can cause harm to the human body, and exposure to that of 9.5 kW/m2 or higher for 10–20 s is extremely dangerous as it can cause second-degree burns and fatal injuries. An explosion in a hydrogen fuel-cell room could generate 1.5 kW/m2 of thermal radiation, which could cause harm to the human body up to a distance of 5 m at a hydrogen volume fraction of 40%.

4. Conclusions

In this study, the degree of harm to people and damage to property caused by overpressure and thermal radiation in the event of an explosion in the fuel-cell room of a hydrogen-fueled house was predicted by experiment and numerical simulation. The accident scenario was the occurrence of an explosion inside a fuel-cell room in a wide range of hydrogen leaks. In this study, the hydrogen–air mixture ratios were 10%, 25%, 40%, and 60%. When the hydrogen gas exploded in the fuel-cell room, a blast wave was generated towards the door, generating a fire ball. The risk of the hydrogen–air mixture ratio in the fuel-cell room was determined to be high in the descending order of 40%, 25%, 60%, and 10% hydrogen–air mixture ratios. When the hydrogen–air mixture ratio was 40%, a blast wave causing harm to the human body could be generated up to a distance of 3 m, as well as thermal radiation heat causing burns up to a distance of 5 m. When the hydrogen–air mixture ratio was 25%, a blast wave causing harm to the human body could be generated up to a distance of 1 m, while thermal radiation could cause burns up to a distance of 3 m. When it was 60%, the thermal radiation causing burns could be generated up to a distance of 3 m. The harm when the hydrogen–air mixing ratio was 10% was found to be insignificant. Finally, the overpressure caused by the hydrogen gas explosion could cause a measure of harm to the human body, and damage to the building occurred at the level of minor structural damage. Furthermore, the harm to the human body caused by thermal radiation occurred at the level of burns with limited damage.
Residential spaces must provide absolute safety to residents, with safety being guaranteed for hydrogen-fueled houses as well. Until now, hydrogen energy has been used only in small-scale facilities. However, in the future it could be used in industrial and housing complexes in large cities. When these complexes are designed, it will be essential to prevent and prepare for hydrogen fires and explosions for the safe use of hydrogen energy. By reflecting the optimal ventilation conditions of the hydrogen fuel-cell room, the risks could be reduced by allowing hydrogen to escape to the outside even if there is a leak inside the room. Alternatively, the positions of openings—such as doors and windows—could be adjusted to minimize human harm caused by the blast wave and fragments generated in the event of an explosion. Consequently, further research is necessary to determine the safe distance for hydrogen accidents for the safe use and management of hydrogen energy by consumers and managers.

Author Contributions

Conceptualization, B.P. and Y.K.; methodology, Y.K. and I.-J.H.; validation, B.P.; formal analysis, B.P.; data curation, Y.K. and I.-J.H.; writing—original draft preparation, B.P.; writing—review and editing, Y.K. and I.-J.H.; visualization, B.P.; supervision, Y.K.; project administration, I.-J.H.; funding acquisition, I.-J.H. All authors have read and agreed to the published version of the manuscript.

Funding

This work was supported by a Korea Agency for Infrastructure Technology Advancement Title Page (with Author Details) (KAIA) grant funded by the Ministry of Land, Infrastructure, and Transport (Grant No. 22HSCTB157909-04).

Informed Consent Statement

Not applicable.

Data Availability Statement

The data presented in this study are available on request from the corresponding author.

Conflicts of Interest

The authors declare that they have no known competing financial interest or personal relationships that could have appeared to influence the work reported in this paper.

References

  1. Schleussner, C.F.; Rogelj, J.; Schaeffer, M.; Lissner, T.; Licker, R.; Fischer, E.M.; Kuetti, R.; Levermann, A.; Frieler, K.; Hare, W. Science and Policy Characteristics of the Paris Agreement Temperature Goal. Nat. Clim. Chang. 2016, 6, 827–835. [Google Scholar] [CrossRef]
  2. Jensen, M.; Swedish Public Housing Project Goes Off-Grid with Solar, Hydrogen, and Fuel Cells. LinkedIn. 2019. Available online: https://www.linkedin.com/pulse/swedish-public-housing-project-goes-off-grid-solar-h2-michael-jensen (accessed on 2 December 2019).
  3. Northern Gas Networks. H21 Leeds City Gate Project. 2016. Available online: https://h21.green/projects/h21-leeds-city-gate/ (accessed on 1 March 2016).
  4. IRD Fuel Cells. Vestenskov—The First Hydrogen Village in the World. 2011. Available online: https://stateofgreen.com/en/solutions/hydrogen-community-lolland/ (accessed on 1 March 2016).
  5. Japan for Sustainability. World’s First Community Level Hydrogen Town Project Starts in Kitakyushu. 2011. Available online: https://www.japanfs.org/en/news/archives/news_id030826.html (accessed on 17 October 2011).
  6. Hydrogen House. Welcome to the Hydrogen Future. 2022. Available online: https://www.hydrogenhouseproject.org/index.html (accessed on 1 January 2021).
  7. Abedini, M.; Mutalib, A.A.; Raman, S.N.; Alipour, R.; Akhlagh, E. Pressure–Impulse (P–I) Diagrams for Reinforced Concrete (RC) Structures. Arch. Comput. Methods Eng. 2019, 26, 733–767. [Google Scholar] [CrossRef]
  8. Wesevich, J.W.; Oswal, C.J. Empirical Based Concrete Masonry Pressure-Impulse Diagrams for Varying Degrees of Damage; Baker Engineering and Risk Consultants; ASCE Structures Congress: Reston, VA, USA, 2005. [Google Scholar]
  9. Syed, Z.I.; Mendis, P.; Lam, N.T.K.; Ngo, T. Concrete Damage Assessment for Blast Load Using Pressure-Impulse Diagrams. In Earthquake Engineering in Australia; ACT: Canberra, Australia, 2006. [Google Scholar]
  10. Lobato, J. A Comparison of Hydrogen Cloud Explosion Models and the Study of the Vulnerability of the Damage Caused by an Explosion of H2. Int. J. Hydrogen Energy 2006, 31, 1780–1790. [Google Scholar] [CrossRef]
  11. Goswami, R.; Biao, S. Study on Vapour Dispersion and Explosion from Compressed Hydrogen Spill: Risk Assessment on a Hydrogen Plant. Int. J. Hydrogen Energy 2022, 47, 41195–41207. [Google Scholar] [CrossRef]
  12. Groethe, M.; Merilo, E.; Colton, J.; Chiba, S.; Sato, Y.; Iwabuchi, H. Large-Scale Hydrogen Deflagrations and Detonations. Int. J. Hydrogen Energy 2007, 32, 2025–2133. [Google Scholar] [CrossRef]
  13. Sato, Y.; Iwabuchi, H.; Groethe, M.; Merilo, E.; Chiba, S. Experiments on Hydrogen Deflagration. J. Power Sources 2006, 159, 144–148. [Google Scholar] [CrossRef]
  14. Royle, M.; Shirvil, L.C.; Roberts, T.A. Vapour Cloud Explosions from the Ignition of Methane/Hydrogen/Air Mixtures in a Congested Region. In Proceedings of the 2nd ICHS Conference, San Sebastian, Spain, 11–13 September 2007. [Google Scholar]
  15. Kai, Z.; Saifeng, D.; Hao, C.; Jingui, W.; Jiaqing, Z.; Yi, G.; Jin, G. Effect of Hydrogen Concentration on the Vented Explosion of Hydrogen–Air Mixtures in a 5-m-Long Duct. Process Saf. Environ. Prot. 2022, 162, 978–986. [Google Scholar]
  16. Matthijs, W.; Trygve, S.; Dirk, R.; Antoine, D.; Andrzej, P. Chemical Inhibition of Hydrogen-Air Explosions: Literature Review, Simulations and Experiments. Process Saf. Environ. Prot. 2023, 176, 1120–1129. [Google Scholar]
  17. Tanaka, T.; Azuma, T.; Evans, J.A.; Cronin, P.M.; Johnson, D.M.; Cleaver, R.P. Experimental Study on Hydrogen Explosions in a Full-Scale Hydrogen Filling Station Model. Int. J. Hydrogen Energy 2007, 32, 2162–2170. [Google Scholar] [CrossRef]
  18. Lowesmith, B.J.; Hankinson, G.; Johnson, D.M. Vapour Cloud Explosions in a Long Congested Region Involving Methane/Hydrogen Mixtures. Process Saf. Environ. Prot. 2011, 89, 234–247. [Google Scholar] [CrossRef]
  19. Shuhao, Z.; Hongtao, M.; Xiaomei, H.; Shini, P. Numerical Simulation on Methane-Hydrogen Explosion in Gas Compartment in Utility Tunnel. Process Saf. Environ. Prot. 2020, 140, 100–110. [Google Scholar]
  20. Li, Y.; Bi, M.; Li, B.; Zhou, Y.; Huang, L.; Gao, W. Explosion Hazard Evaluation of Renewable Hydrogen/Ammonia/Air Fuels. Energy 2018, 159, 252–263. [Google Scholar] [CrossRef]
  21. Li, Y.; Bi, M.; Zhou, Y.; Zhang, Z.; Zhang, K.; Zhang, C.; Gao, W. Characteristics of Hydrogen-Ammonia-Air Cloud Explosion. Process Saf. Environ. Prot. 2021, 148, 1207–1216. [Google Scholar] [CrossRef]
  22. Ji, W.; Wang, Y.; Yang, J.; He, J.; Lu, C.; Wen, X.; Wang, Y. Explosion Overpressure Behavior and Flame Propagation Characteristics in Hybrid Explosions of Hydrogen and Magnesium Dust. Fuel 2023, 332, 125801. [Google Scholar] [CrossRef]
  23. Xiong, X.; Gao, K.; Mu, J.; Ji, C.; Li, B.; Zhang, D.; Xu, Y.; Xie, L. Experimental Study on the Explosion Destructive Ability of Magnesium Powder/Hydrogen Hybrids in Large Space. Process Saf. Environ. Prot. 2023, 173, 237–248. [Google Scholar] [CrossRef]
  24. Yu, X.; Zhang, Z.; Yan, X.; Wang, Z.; Yu, J.; Gao, W. Explosion Characteristics and Combustion Mechanism of Hydrogen/Tungsten Dust Hybrid Mixtures. Fuel 2023, 332, 126017. [Google Scholar] [CrossRef]
  25. Kim, Y.G.; Park, B.J. Experimental and Analytical Study on Hydrogen-Air Deflagrations in Open Atmosphere. J. Korean Soc. Saf. 2021, 36, 64–71. [Google Scholar]
  26. Park, B.J.; Kim, Y.G.; Paik, P.W.; Kang, C.K. Numerical and Experimental Analysis of Jet Release and Jet Flame Length for Qualitative Risk Analysis at Hydrogen Refueling Station. Process Saf. Environ. Prot. 2021, 155, 145–154. [Google Scholar] [CrossRef]
  27. Park, B.J.; Kim, Y.G.; Lee, K.W.; Paik, P.W.; Kang, C.K. Risk Assessment Method Combining Independent Protection Layers (IPL) of Layer of Protection Analysis (LOPA) and RISKCURVES Software. Energies 2021, 14, 4043. [Google Scholar] [CrossRef]
  28. Piotr, M.; Eugeniusz, M. CFD Analysis of Large-Scale Hydrogen Detonation and Blast Wave Overpressure in Partially Confined Spaces. Process Saf. Environ. Prot. 2022, 158, 537–546. [Google Scholar]
  29. Hansen, O.R. Hydrogen Infrastructure—Efficient Risk Assessment and Design Optimization Approach to Ensure Safe and Practical Solutions. Process Saf. Environ. Prot. 2020, 143, 164–176. [Google Scholar] [CrossRef]
  30. Liu, Y.; Liu, Z.; Wei, J.; Lan, Y.; Yang, S.; Jin, T. Evaluation and Prediction of the Safe Distance in Liquid Hydrogen Spill Accident. Process Saf. Environ. Prot. 2021, 146, 1–8. [Google Scholar] [CrossRef]
  31. Kashkarov, S.; Li, Z.; Molkov, V. Blast Wave from a Hydrogen Tank Rupture in a Fire in the Open: Hazard Distance Nomograms. Int. J. Hydrogen Energy 2020, 45, 2429–2446. [Google Scholar] [CrossRef]
  32. Molkov, V.; Kashkarov, S. Blast Wave from a High-Pressure Gas Tank in a Fire: Stand-Alone and Under-Vehicle Hydrogen Tanks. Int. J. Hydrogen Energy 2015, 40, 12581–12603. [Google Scholar] [CrossRef]
  33. Brock, V.; Javad, M.; Fatemeh, S.; Rouzbeh, A. Safety Assessment of Hydrogen Jet Fire Scenarios within Semi-Confined Spaces. Fire 2023, 6, 29. [Google Scholar]
  34. Xirui, Y.; Depeng, K.; Xu, H.; Ping, P. Risk Analysis of Fire and Explosion of Hydrogen-Gasoline Hybrid Refueling Station Based on Accident Risk Assessment Method for Industrial System. Fire 2023, 6, 181. [Google Scholar]
  35. Korea Land & Housing Corporation. 2023. Available online: www.rorenhouse.co.kr (accessed on 1 January 2023).
  36. Park, B.J.; Kim, Y.G.; Hwang, I.J. An Experimental Study on the Explosion Hazards in the Fuel Cell Room of Residential House. J. Korean Soc. Saf. 2021, 36, 71–79. [Google Scholar]
  37. Center for Chemical Process Safety at the American Institute of Chemical Engineers. Guidelines for Chemical Process Quantitative Risk Analysis, 2nd ed.; John Wiley & Sons Inc.: Hoboken, NJ, USA, 2000; pp. 157–179. [Google Scholar]
  38. Center for Chemical Process Safety at the American Institute of Chemical Engineers. Guidelines for Evaluating the Characteristics of Vapor Cloud Explosions, Flash Fires, and BLEVEs; American Institute of Chemical Engineers: New York, NY, USA, 1994; pp. 347–357. [Google Scholar]
  39. ANSYS Inc. ANSYS Fluent Theory Guide Release 2020 R2. 2020. Available online: https://www.ansys.com (accessed on 1 January 2023).
  40. Holtappels, K. Report on the Experimentally Determined Explosion Limits, Explosion Pressures and Rates of Explosion Pressure Rise—Part 1: Methane, Hydrogen, and Propylene. Available online: https://www.morechemistry.com/SAFEKINEX/deliverables/44.Del.%20No.%208.pdf (accessed on 1 January 2002).
  41. Kuznetsov, M.; Friedrich, A.; Stern, G.; Kotchourko, N.; Jallais, S.; L’Hostis, B. Medium-Scale Experiments on Vented Hydrogen Deflagration. J. Loss Prev. Process Ind. 2015, 36, 416–428. [Google Scholar] [CrossRef]
  42. Solomos, G.; Larcher, M.; Valsamos, G.; Karlos, V.; Casadei, F. A Survey of Computational Models for Blast Induced Human Injuries for Security and Defence Applications; Joint Research Centre Technical Reports; Publications office of the European Union, EU: Luxembourg, 2020. [Google Scholar]
  43. Crowl, D.A.; Louvar, J.F. Chemical Process Safety Fundamentals with Applications, 4th ed.; Pearson Education Inc.: London, UK, 2019; pp. 264–282. [Google Scholar]
  44. Li, B.; Han, B.; Li, Q.; Gao, W.; Guo, C.; Lv, H.; Liu, Y.; Jin, X.; Bi, M. Study on Hazards from High-Pressure On-Board Type III Hydrogen Tank in Fire Scenario: Consequences and Response Behaviours. Int. J. Hydrogen Energy 2022, 47, 2759–2770. [Google Scholar] [CrossRef]
  45. Debroey, J. Probit Function Analysis of Blast Effects on Human Beings; Royal Military Academy: Leuven, Bergium, 2016. [Google Scholar]
  46. Jeffries, R.M.; Hunt, S.J.; Gould, L. Derivation of Fatality Probability Function for Occupants’ Buildings Subject to Blast Loads; WS Atkins Sci Technol 1997; Contract Research Report for HSE 147; HSE Books: Norwich, UK, 1997. [Google Scholar]
  47. NFPA. NFPA 2 Hydrogen Technologies Code; NFPA: Quincy, MA, USA, 2020; pp. 2169–7471. [Google Scholar]
  48. Health and Safety Executive. Methods of Approximation and Determination of Human Vulnerability for Offshore Major Accident Hazard Assessment. Supporting Document to SPC 30. 2010. Available online: https://www.hse.gov.uk/foi/internalops/hid_circs/technical_osd/spc_tech_osd_30/spctecosd30.pdf (accessed on 1 January 2023).
  49. LaChance, J.; Tchouvelev, A.; Engebo, A. Development of Uniform Harm Criteria for Use in Quantitative Risk Analysis of the Hydrogen Infrastructure. Int. J. Hydrogen Energy 2011, 36, 2381–2388. [Google Scholar] [CrossRef]
Figure 1. Schematical description of the test specimen (floor plan, unit: mm).
Fire 06 00390 g001
Figure 2. Installation of the pressure sensors: (a) Structure; (b) Incident pressure sensor; (c) Reflected pressure sensor.
Fire 06 00390 g002
Figure 3. Fuel-cell room and hydrogen-housing pressure sensors.
Fire 06 00390 g003
Figure 4. Ignition image (side): (a) Before explosion; (b) During explosion (formation of a fire ball); (c) During explosion (formation of a jet fire); (d) During explosion (formation of a mushroom cloud).
Fire 06 00390 g004aFire 06 00390 g004b
Figure 5. Overpressure and impulse in accordance with time: (a) Incident overpressure; (b) Impulse.
Fire 06 00390 g005
Figure 6. CFD modeling environment and measuring points (Points 1–5 stands for the measuring point of overpressure along the distance from ignition source).
Fire 06 00390 g006
Figure 7. Calculation grid of the fuel−cell room.
Fire 06 00390 g007
Figure 8. Comparison of pressure between the full−scale explosions.
Fire 06 00390 g008
Figure 9. Peak pressure and impulse at each measuring point.
Fire 06 00390 g009
Figure 10. Pressure at each hydrogen volume fraction: (a) Hydrogen volume fraction: 10%; (b) Hydrogen volume fraction: 25%; (c) Hydrogen volume fraction: 40%; (d) Hydrogen volume fraction: 60%.
Fire 06 00390 g010
Figure 11. Impulse at each hydrogen volume fraction: (a) Hydrogen volume fraction: 10%; (b) Hydrogen volume fraction: 25%; (c) Hydrogen volume fraction: 40%; (d) Hydrogen volume fraction: 60%.
Fire 06 00390 g011
Figure 12. The 3D shape of pressure over time (hydrogen volume fraction 40%, Point 1): (a) 11.5 ms; (b) 12.0 ms; (c) 12.5 ms; (d) 13.0 ms; (e) 13.5 ms; (f) 14.0 ms.
Fire 06 00390 g012
Figure 13. Schematic diagram of the fuel-cell room (floor plan).
Fire 06 00390 g013
Figure 14. CFD modeling of pressure change by hydrogen volume fraction.
Fire 06 00390 g014
Figure 15. CFD modeling of thermal radiation by hydrogen volume fraction.
Fire 06 00390 g015aFire 06 00390 g015b
Figure 16. Overpressure−mpulse thresholds: (a) Harm criteria for humans [31]; (b) Damage for buildings [45].
Fire 06 00390 g016
Table 2. Effects on buildings and structures from blast waves [38,45].
Incident Pressure (kPa)Damage Level
0.15Annoying noise
0.2Occasional breaking of large windowpanes already under strain
0.3Loud noise; sonic boom glass failure
0.7Breakage of small windows under strain
1Threshold for glass breakage
2“Safe distance”, probability of 0.95 of no serious damage beyond this value; some damage to house ceilings; 10% window glass broken
3Limited minor structural damage
3.5–7Large and small windows usually shattered; occasional damage to window frames
5Minor damage to house structures
8Partial demolition of houses, made uninhabitable
9.5Second-degree burns after 20 s
12.5~15First-degree burns after 10 s, 1% fatality within 1 min
25Significant injury in 10 s, 100% fatality within 1 min
35~37.51% fatality within 10 s
Table 3. The impact of radiant heat flux on people [49].
Radiant Heat Flux Intensity (kW/m2)Effects on People
1.5No harm; safe for the general public and for stationery personnel
2.5Intensity tolerable for five min; severe pain above this exposure time
3Intensity tolerable for non-frequent emergency situations for 30 min
5Pain for 20 s exposure, first-degree burns. Intensity tolerable for those performing emergency operations
6Intensity tolerable for escaping emergency personnel
9.5Second-degree burns after 20 s
12.5~15First-degree burns after 10 s, 1% fatality within 1 min
25Significant injury in 10 s, 100% fatality within 1 min
35~37.51% fatality within 10 s
Disclaimer/Publisher’s Note: The statements, opinions and data contained in all publications are solely those of the individual author(s) and contributor(s) and not of MDPI and/or the editor(s). MDPI and/or the editor(s) disclaim responsibility for any injury to people or property resulting from any ideas, methods, instructions or products referred to in the content.

