
FDS-Based Study of the Fire Performance of Huizhou Fire Seal Walls in Traditional Residential Buildings in Southern China


Abstract
1. Introduction
1.1. Fire Prevention in Traditional Chinese Buildings
1.2. Fire Research in Traditional Buildings
1.3. Huizhou Fire Seal Walls
- Wall;
- Plucked leaves, pallets, and pallet heads, for which the primary function is to prevent the wall from being directly impacted and soaked by rain;
- The ridge of the Matou wall is the closing part of the sealed firewall.
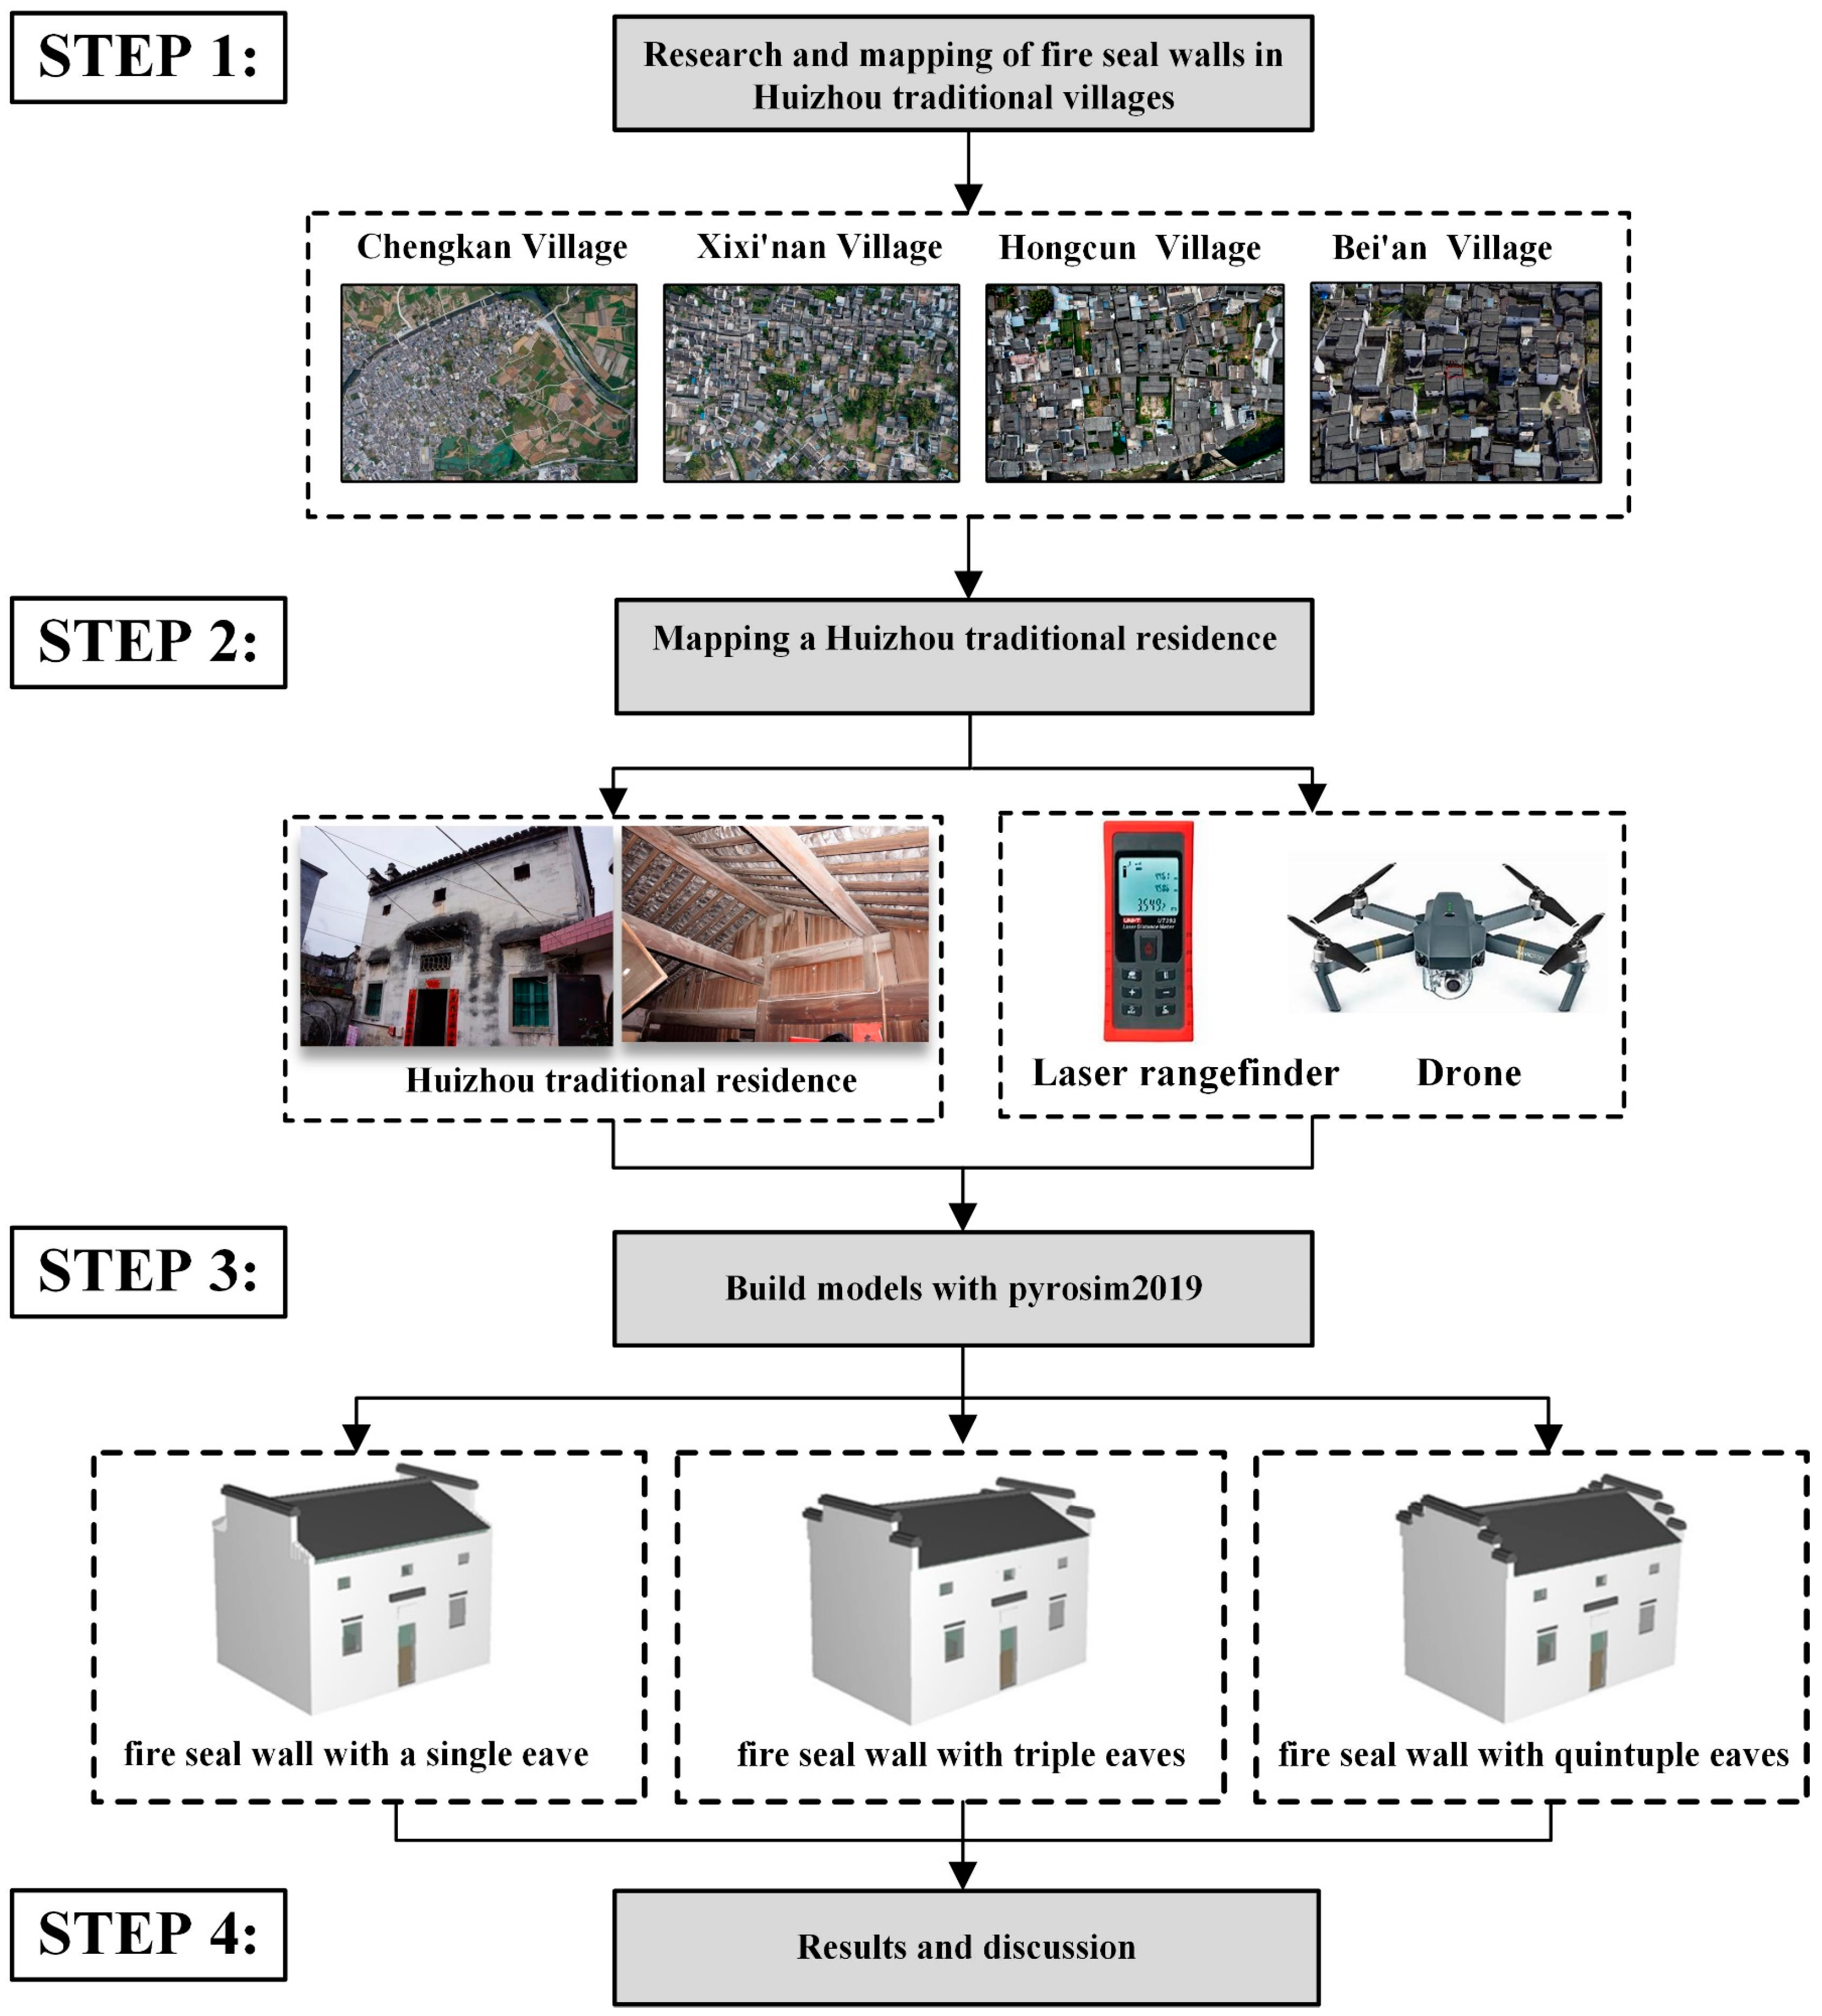
2. Materials and Methods
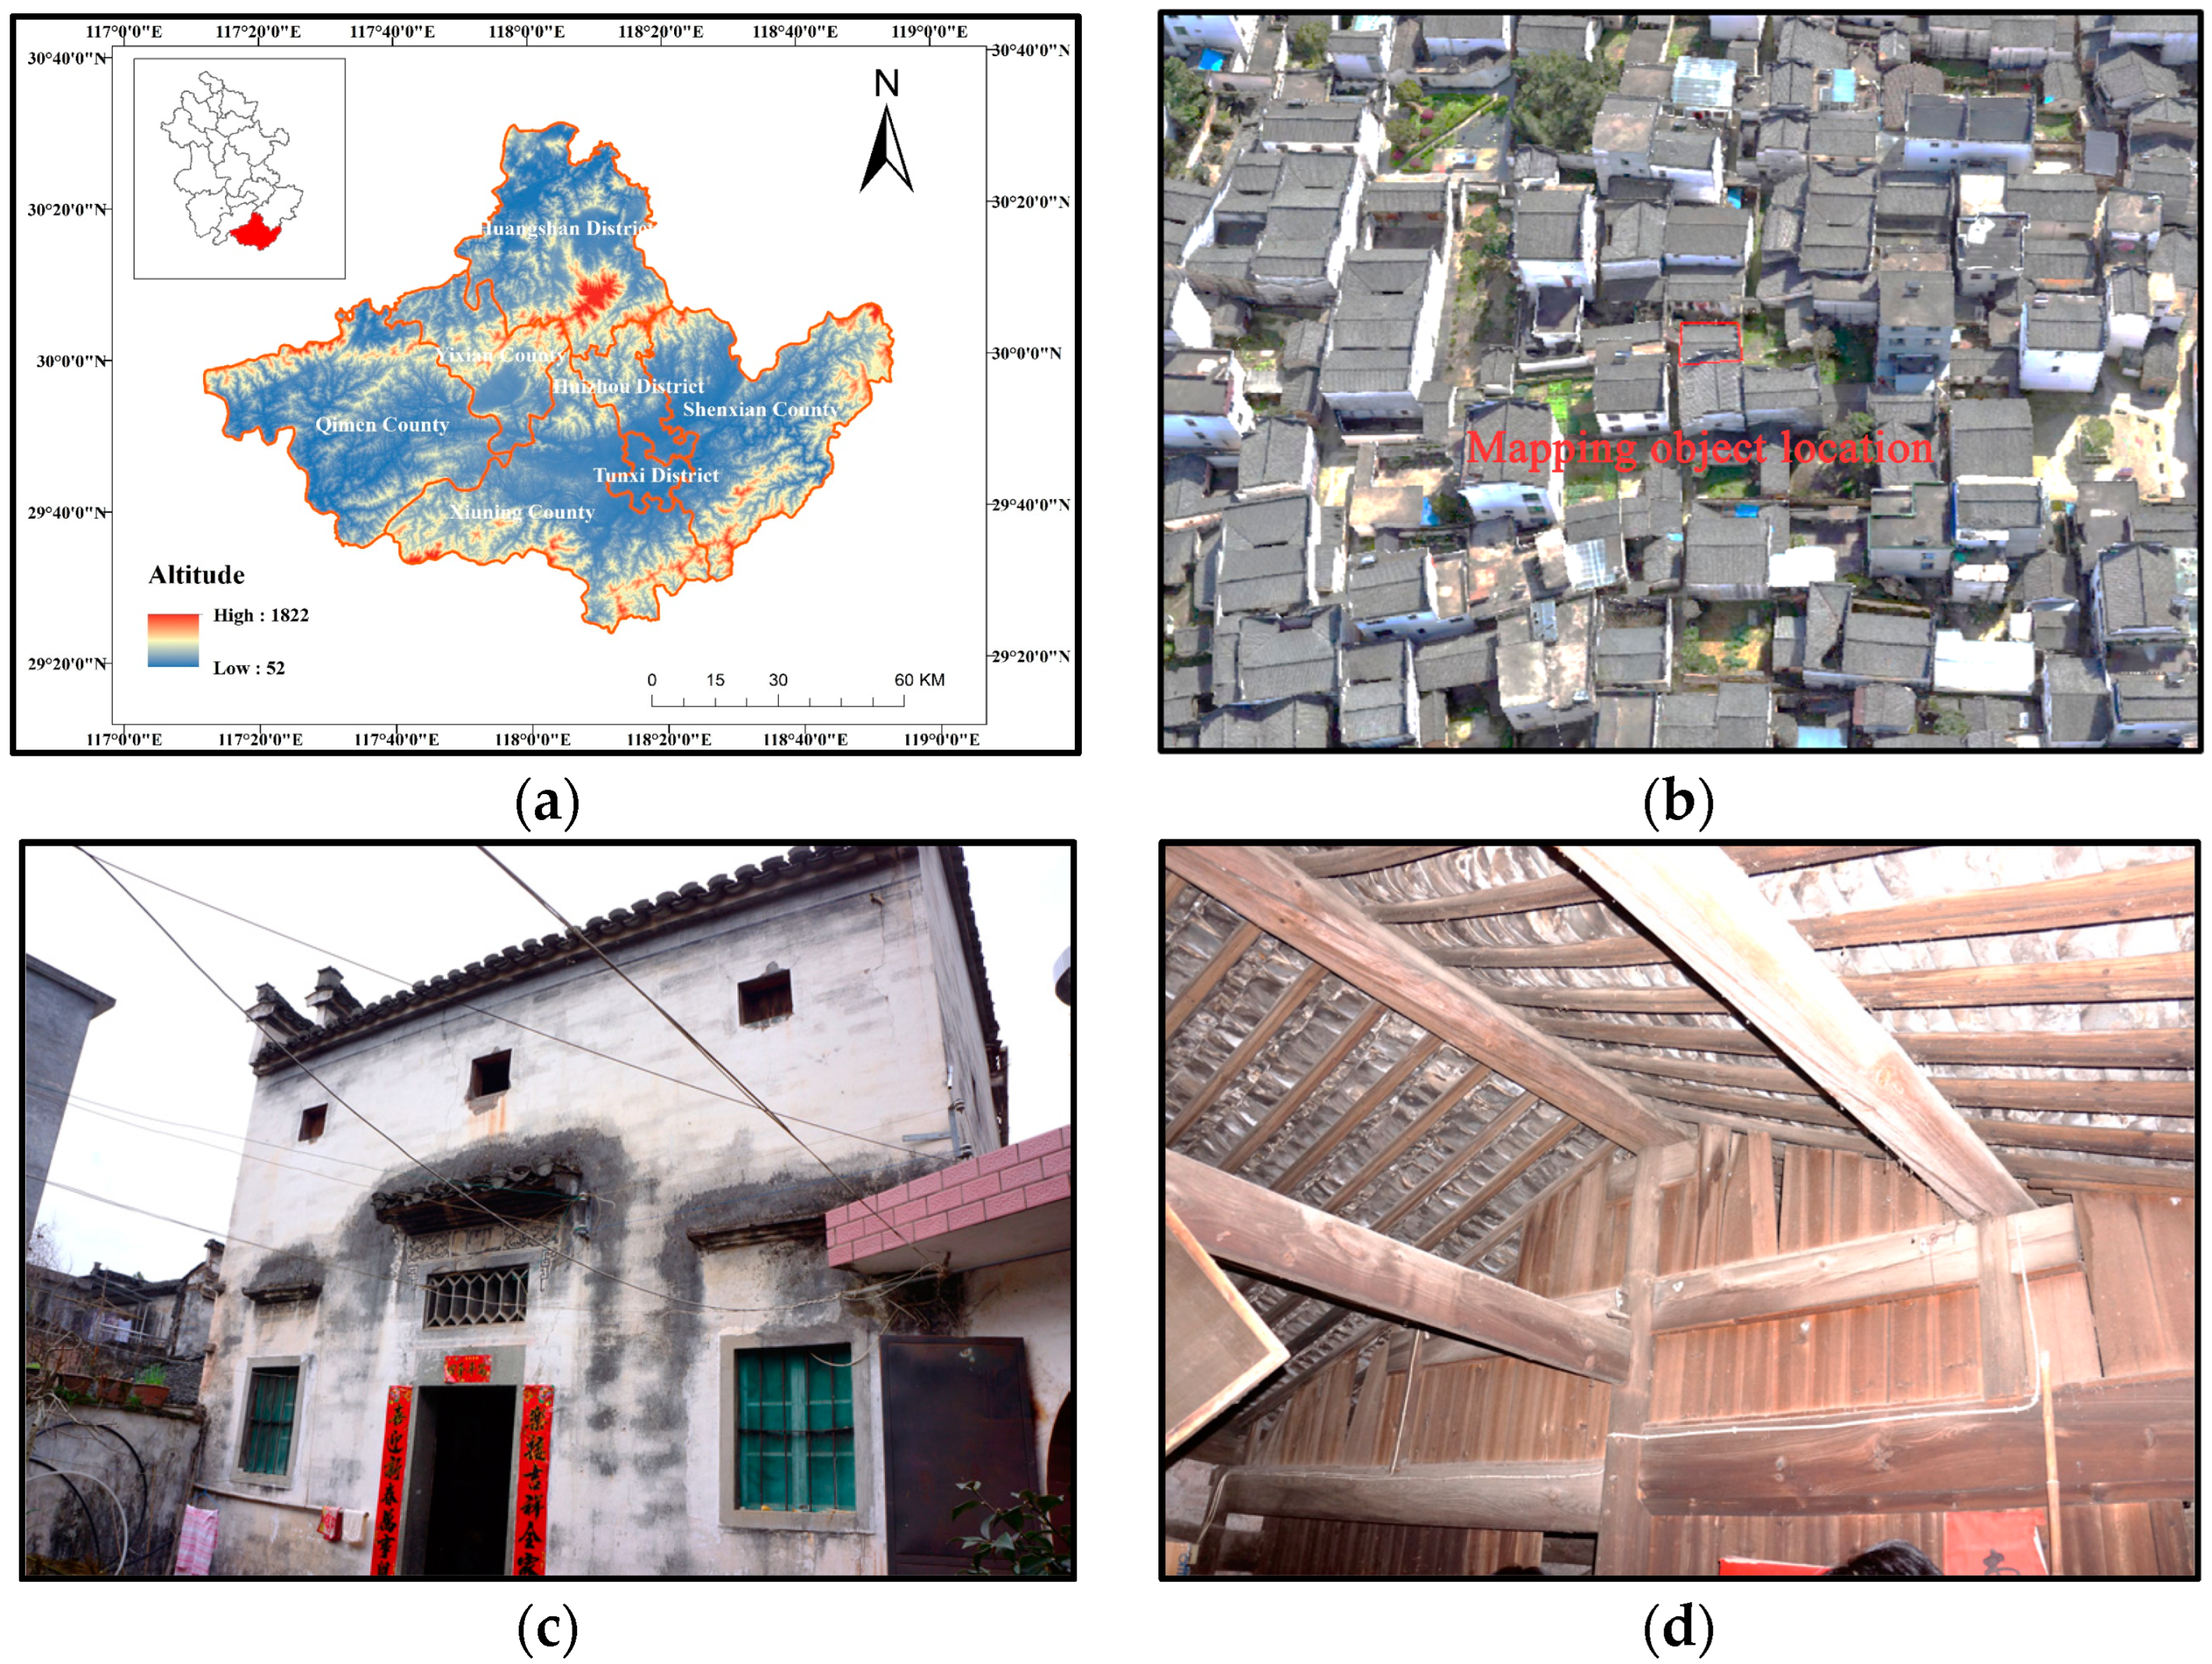
2.1. Study Area and Data Sources
2.1.1. Study Area
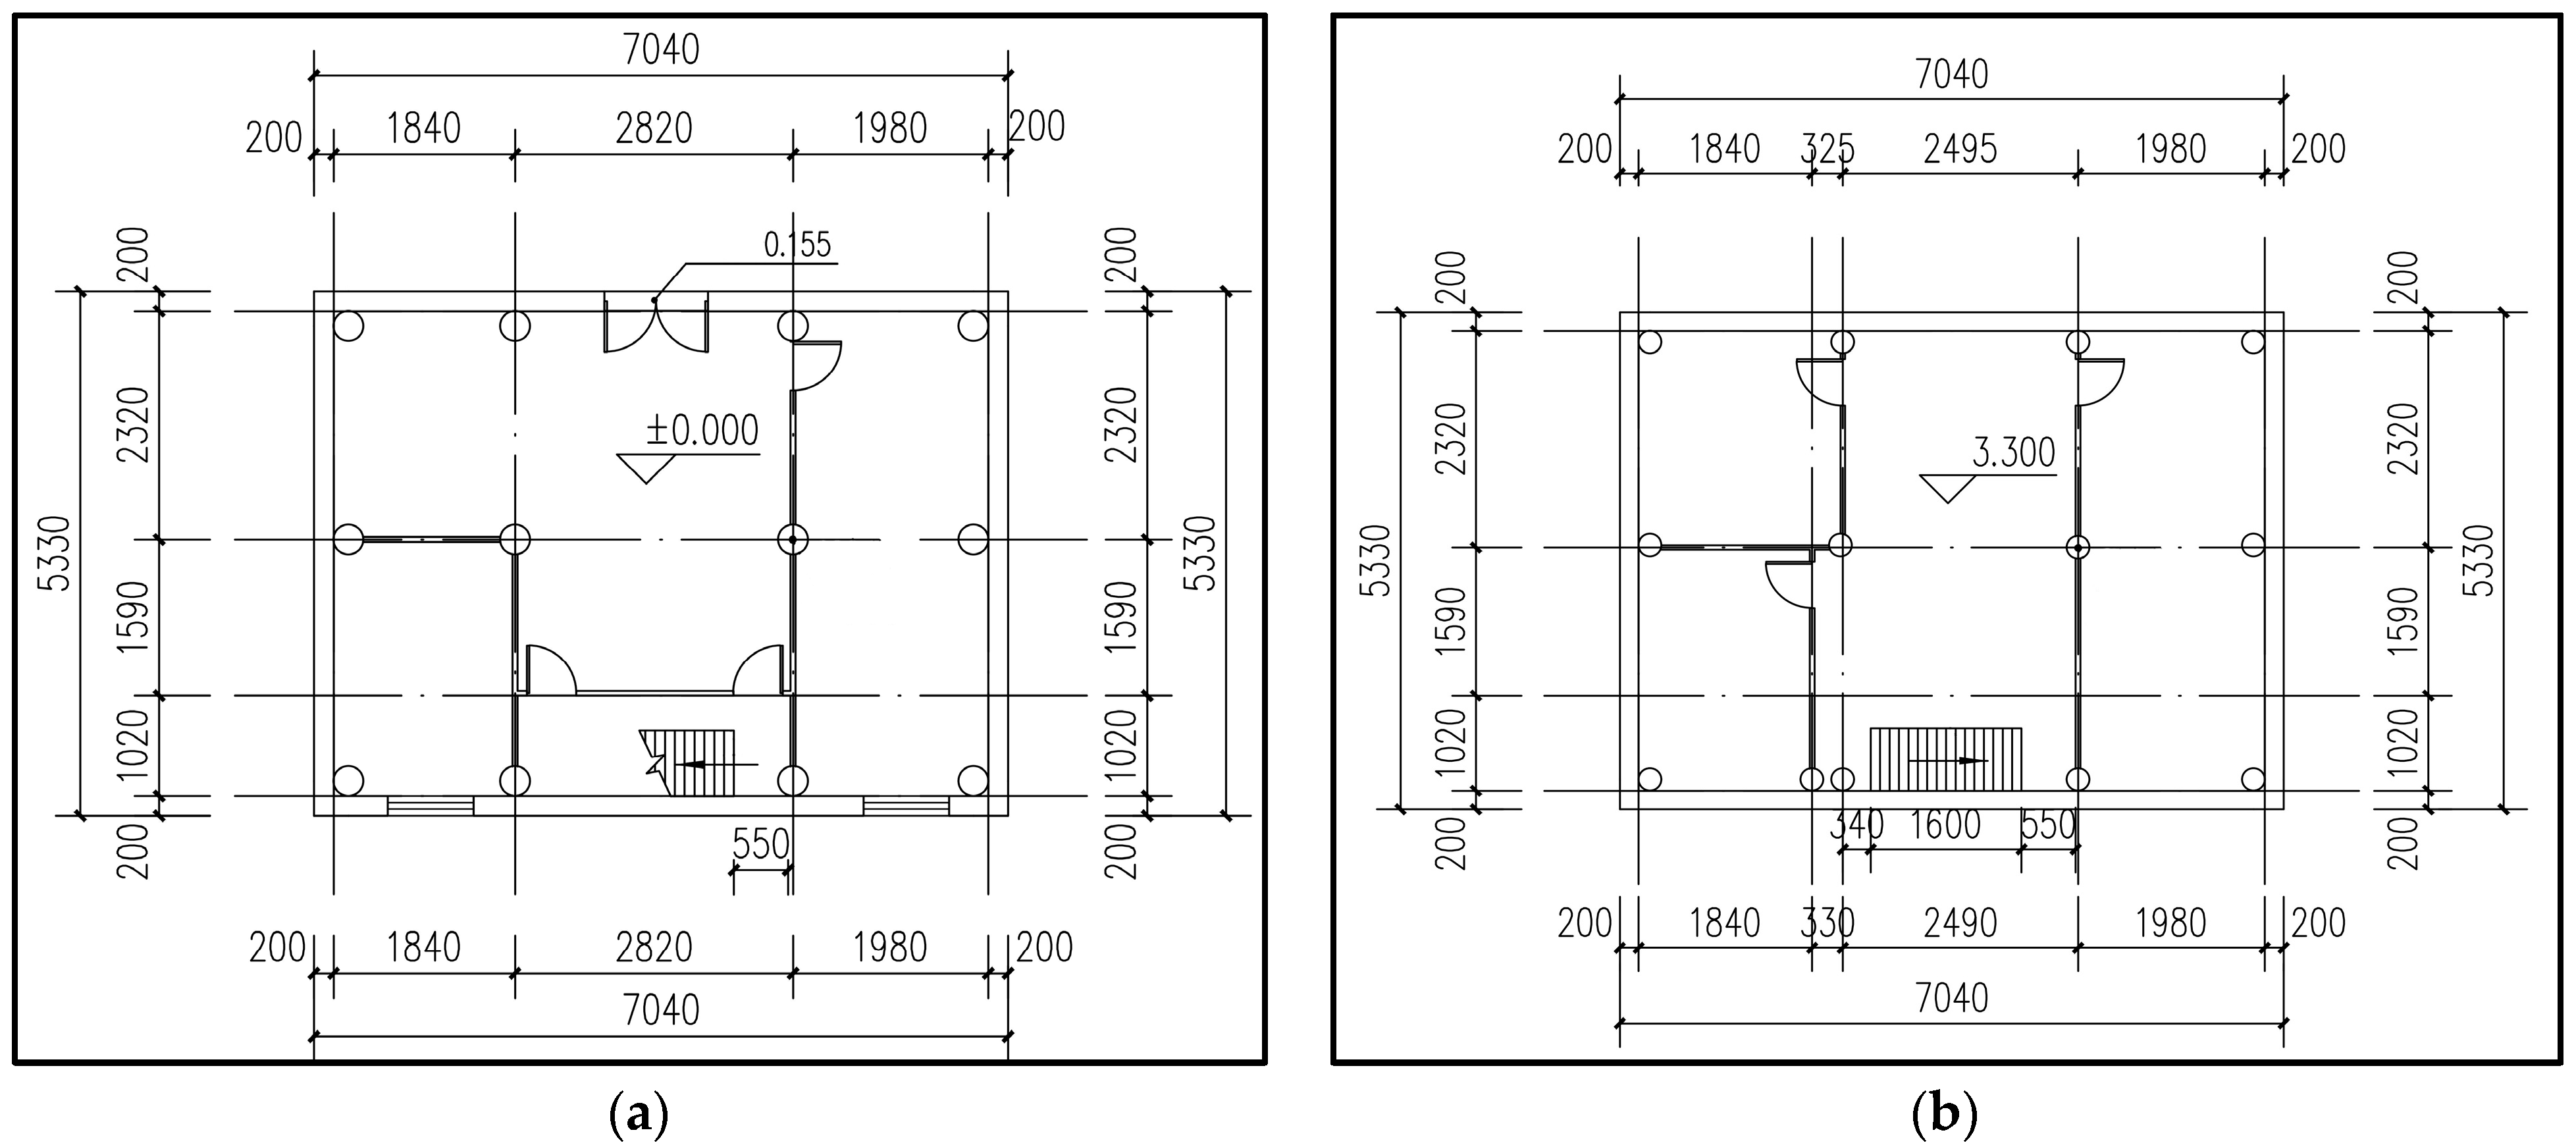
2.1.2. Data Sources
2.2. Experimental Design and Boundary Condition
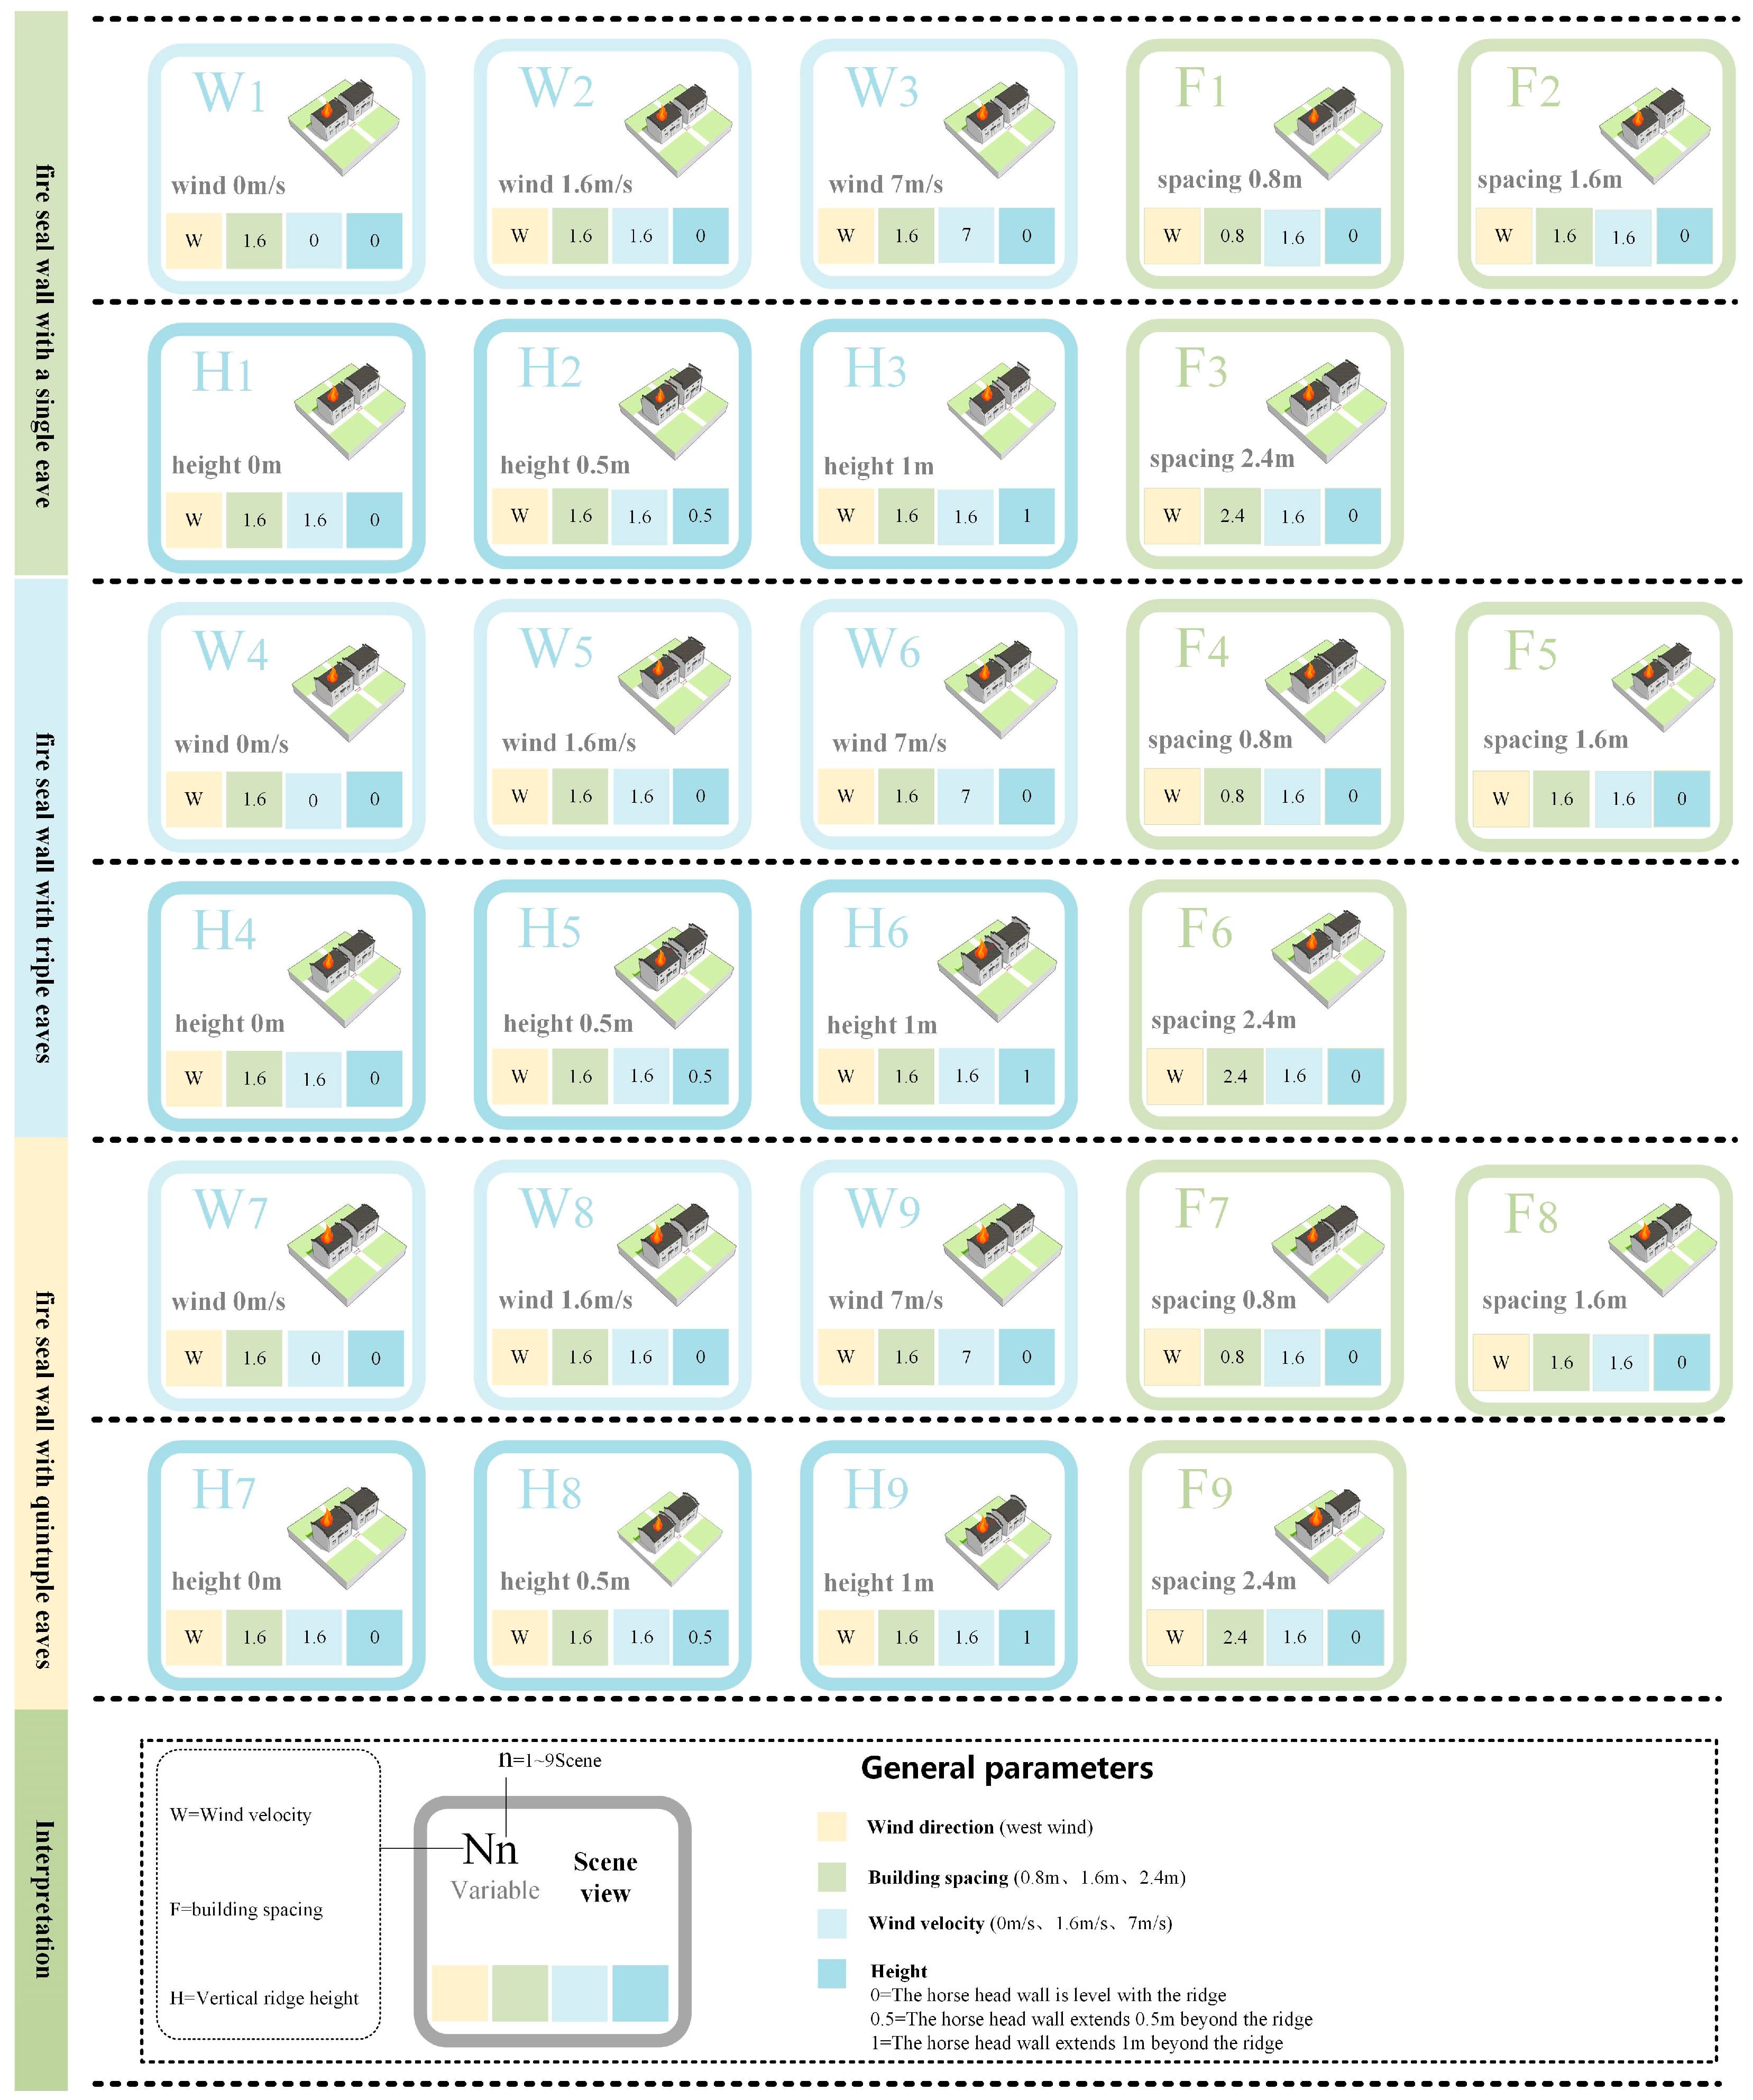
2.2.1. Experimental Design
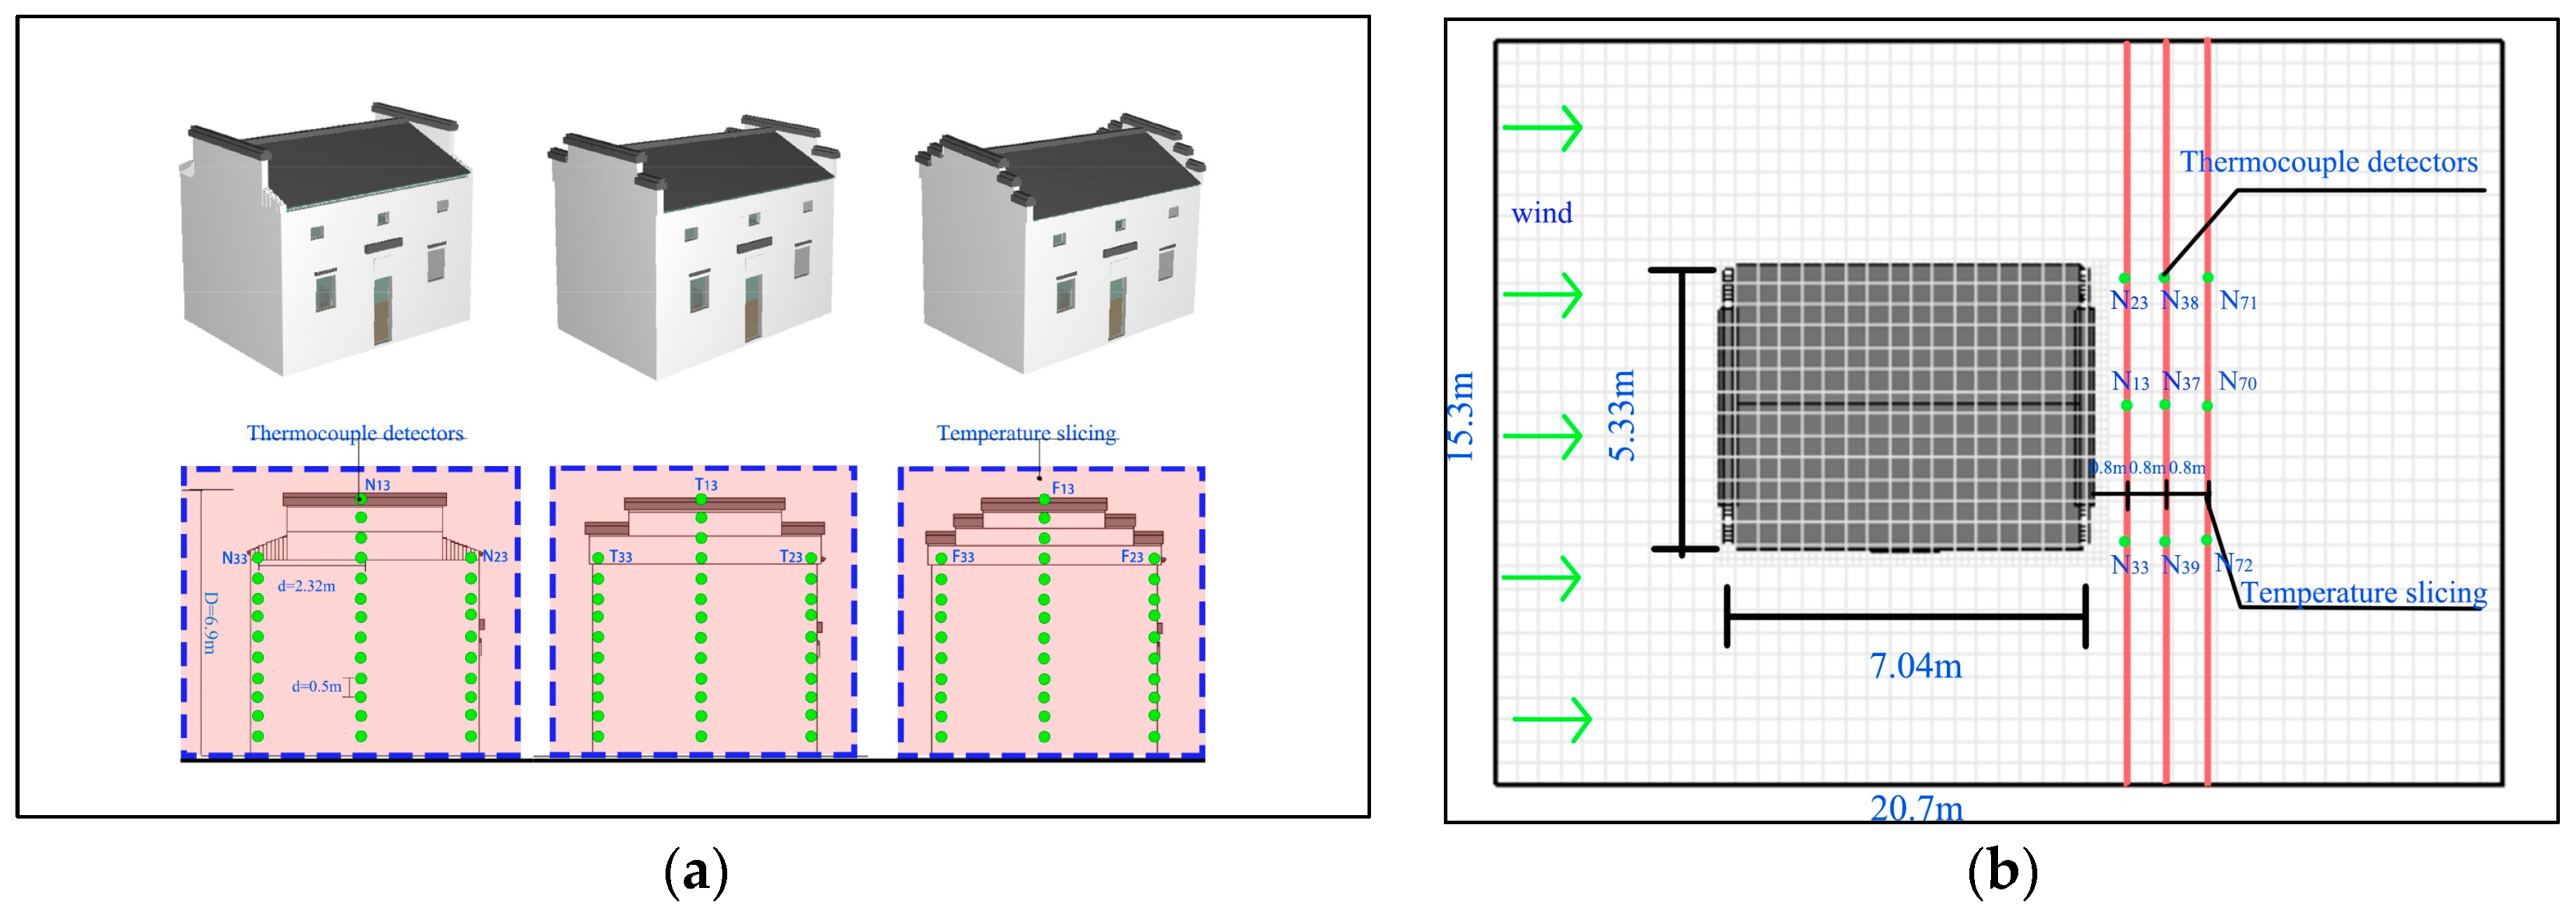
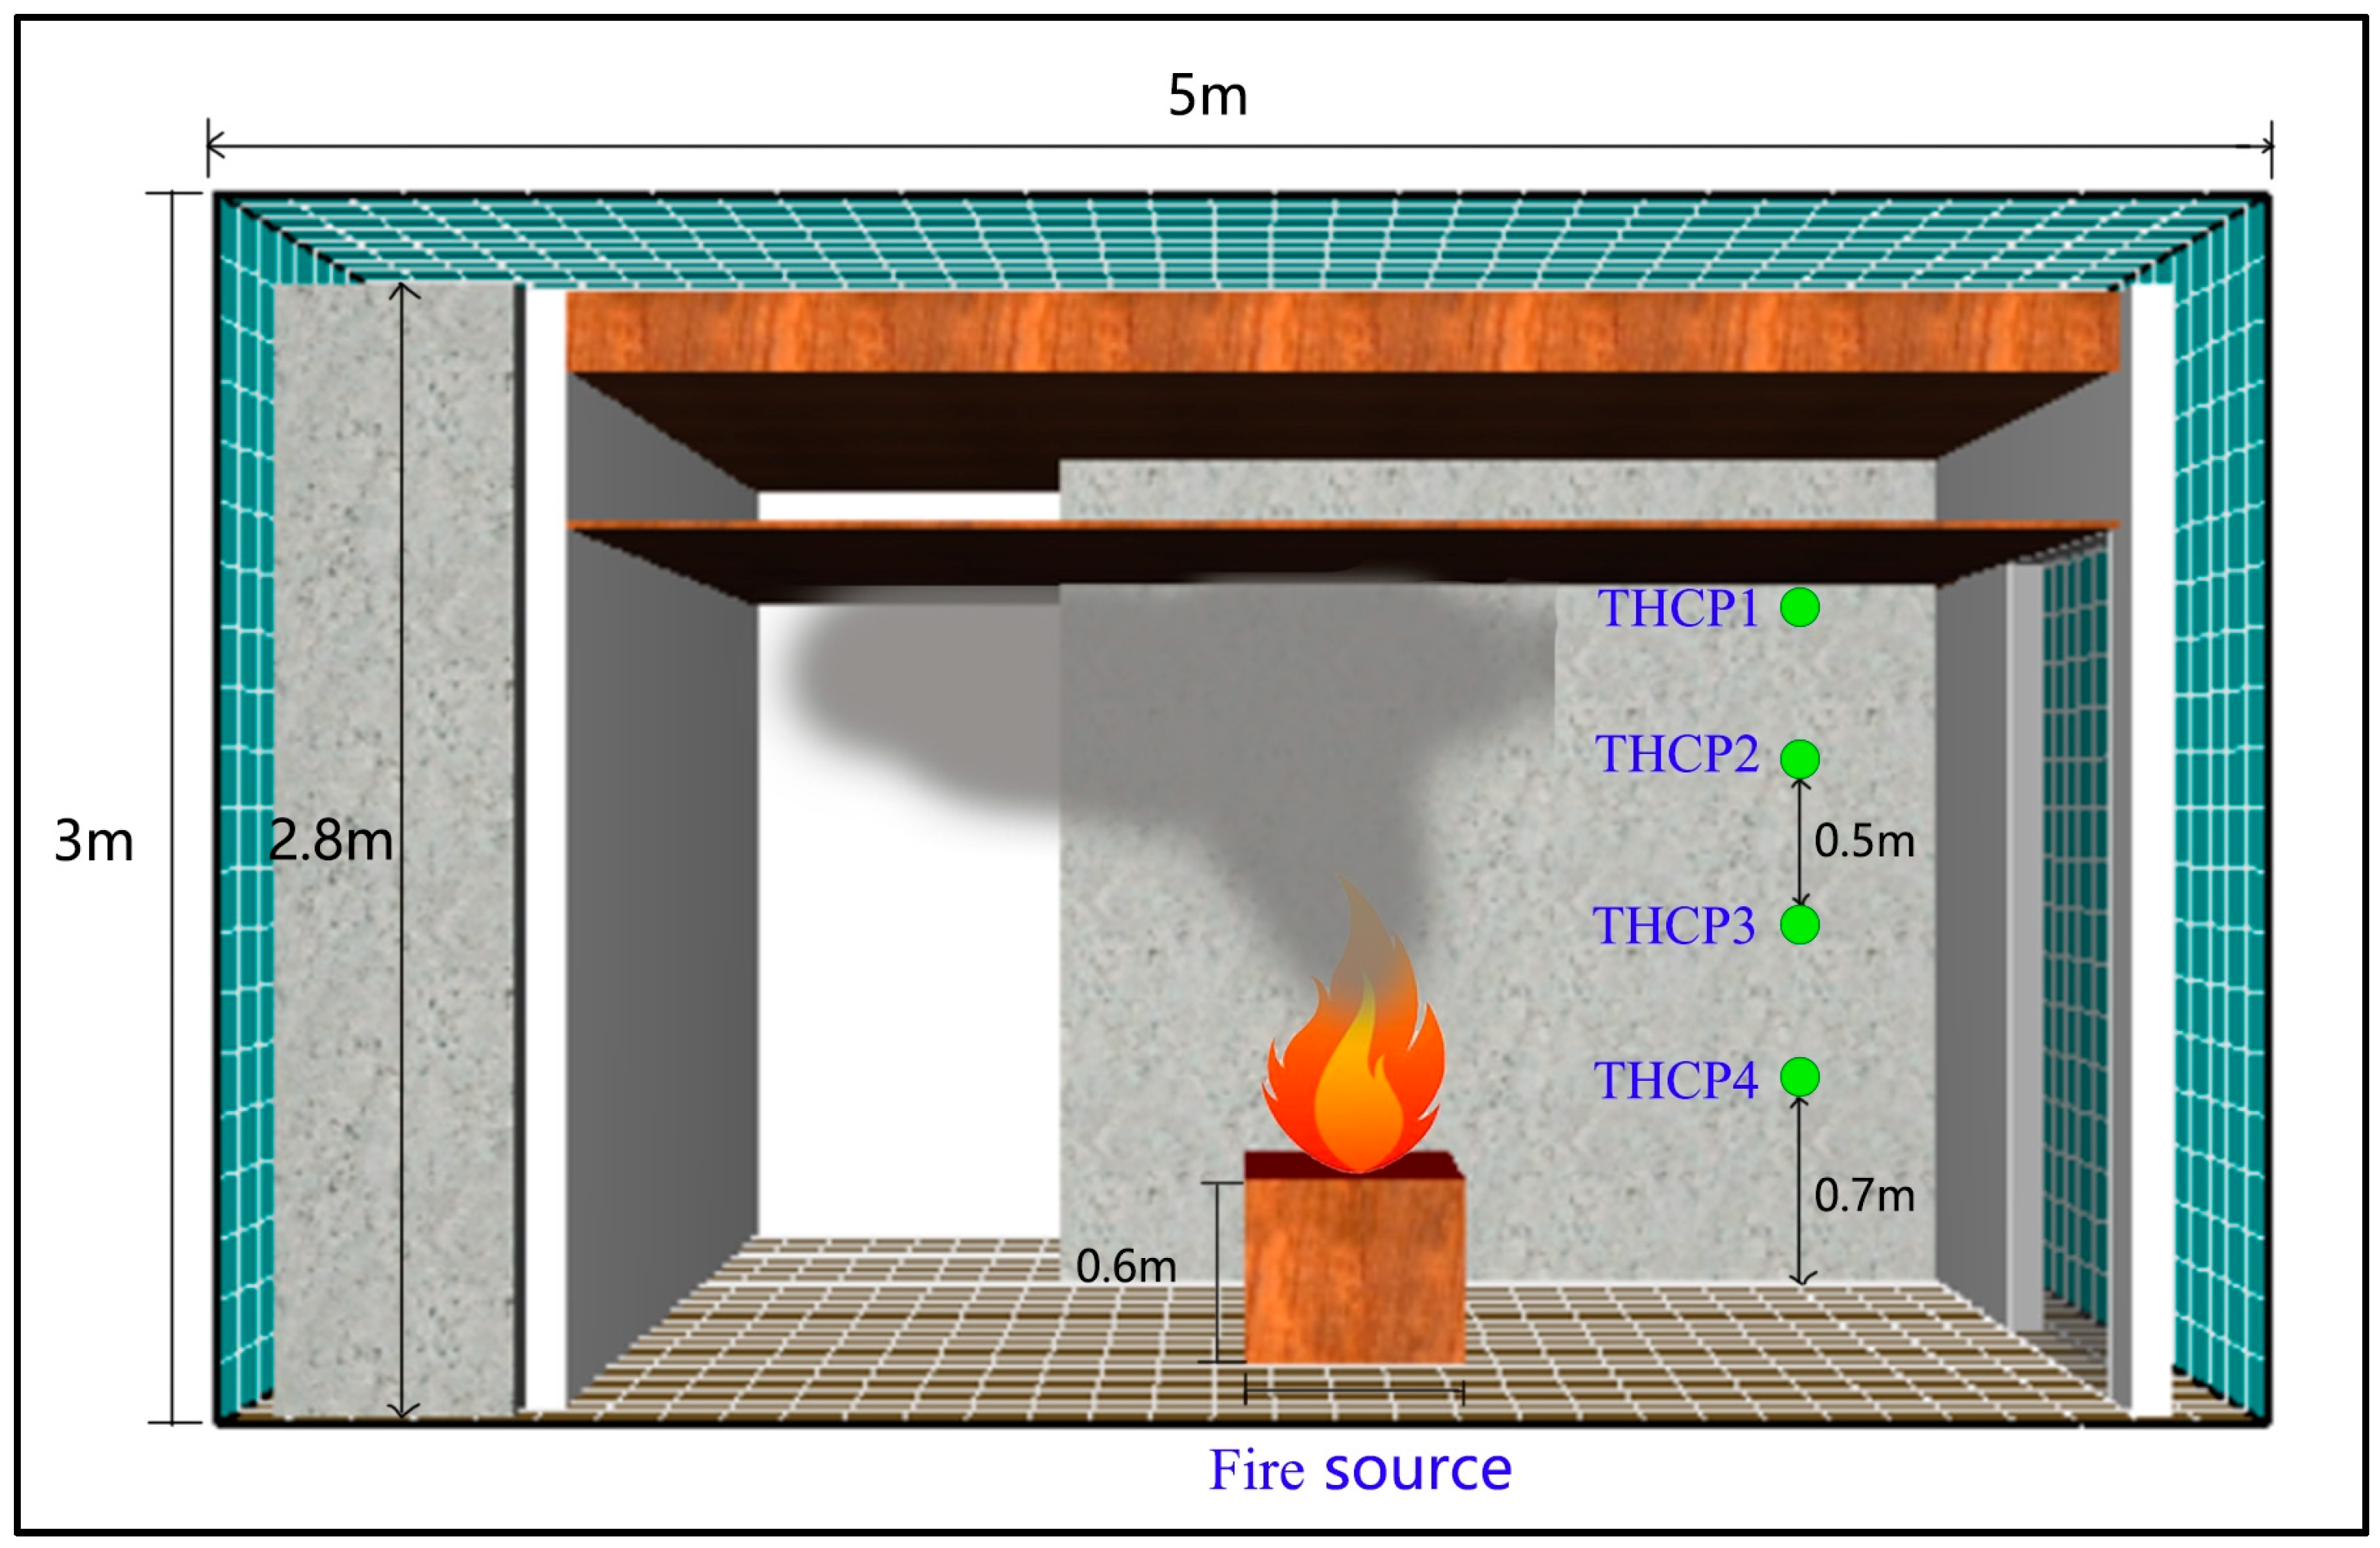
2.2.2. Equipment Arrangement
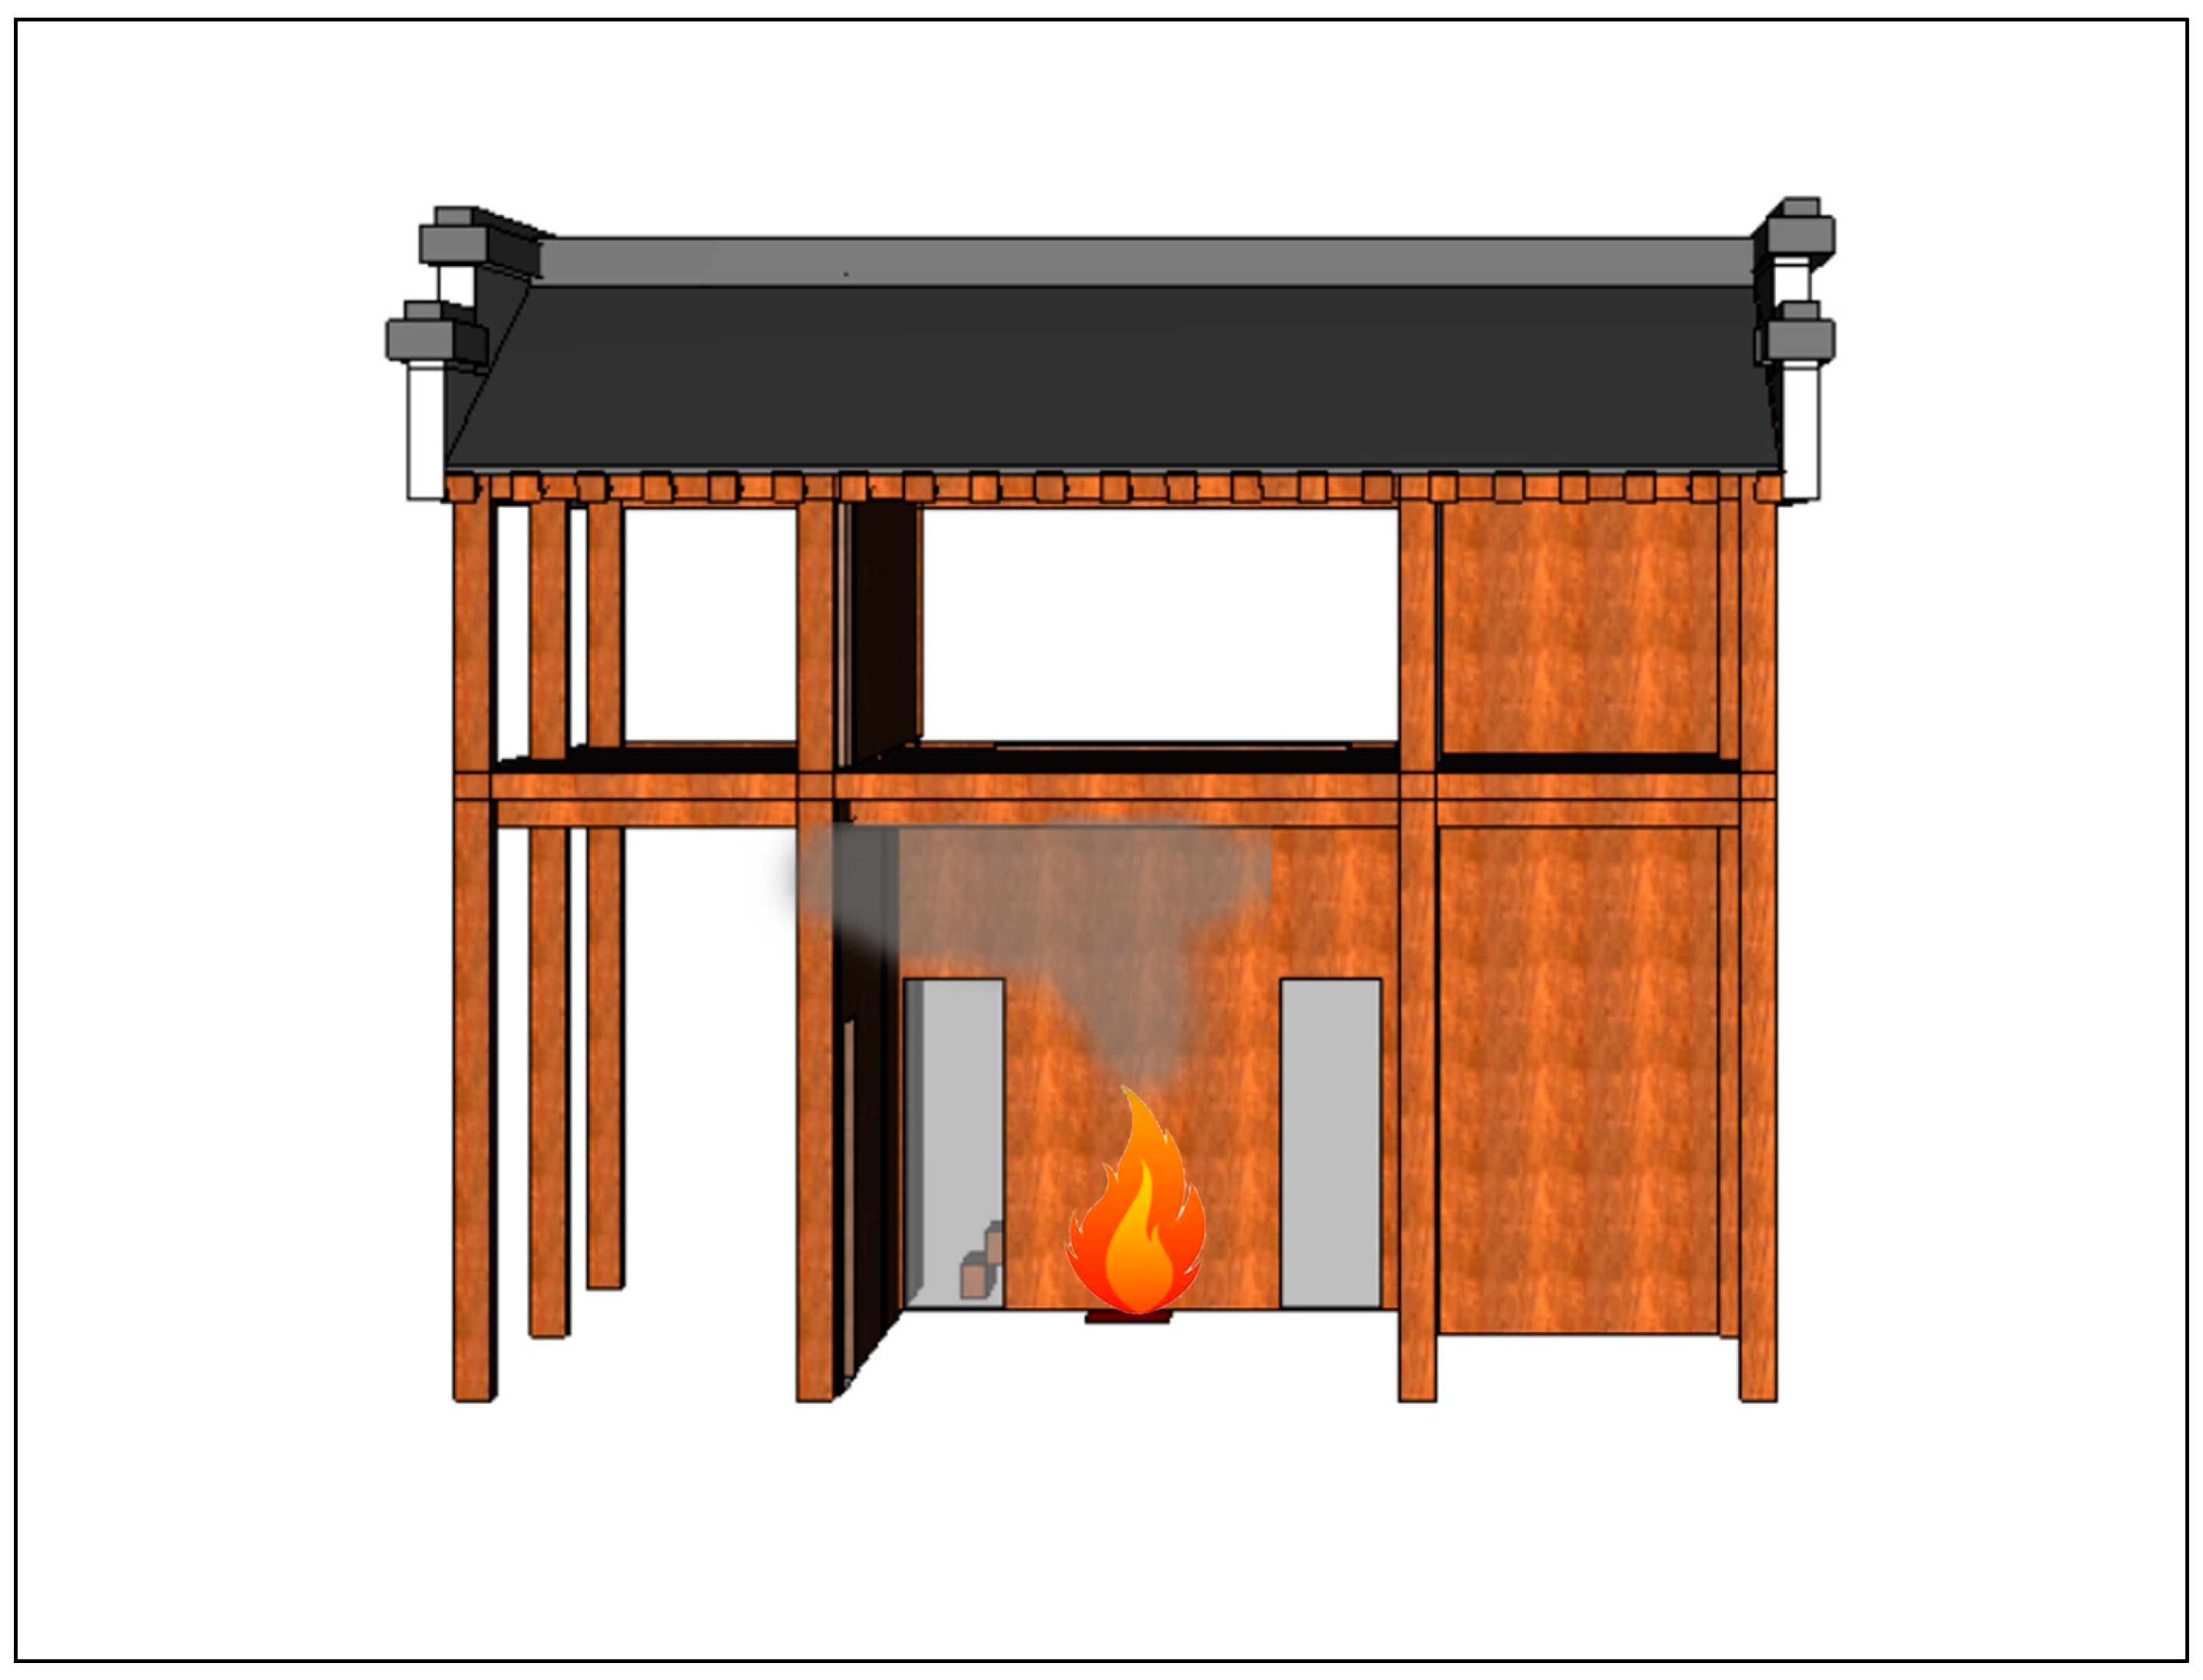
2.2.3. Fire Source Setting
2.3. Grid Settings
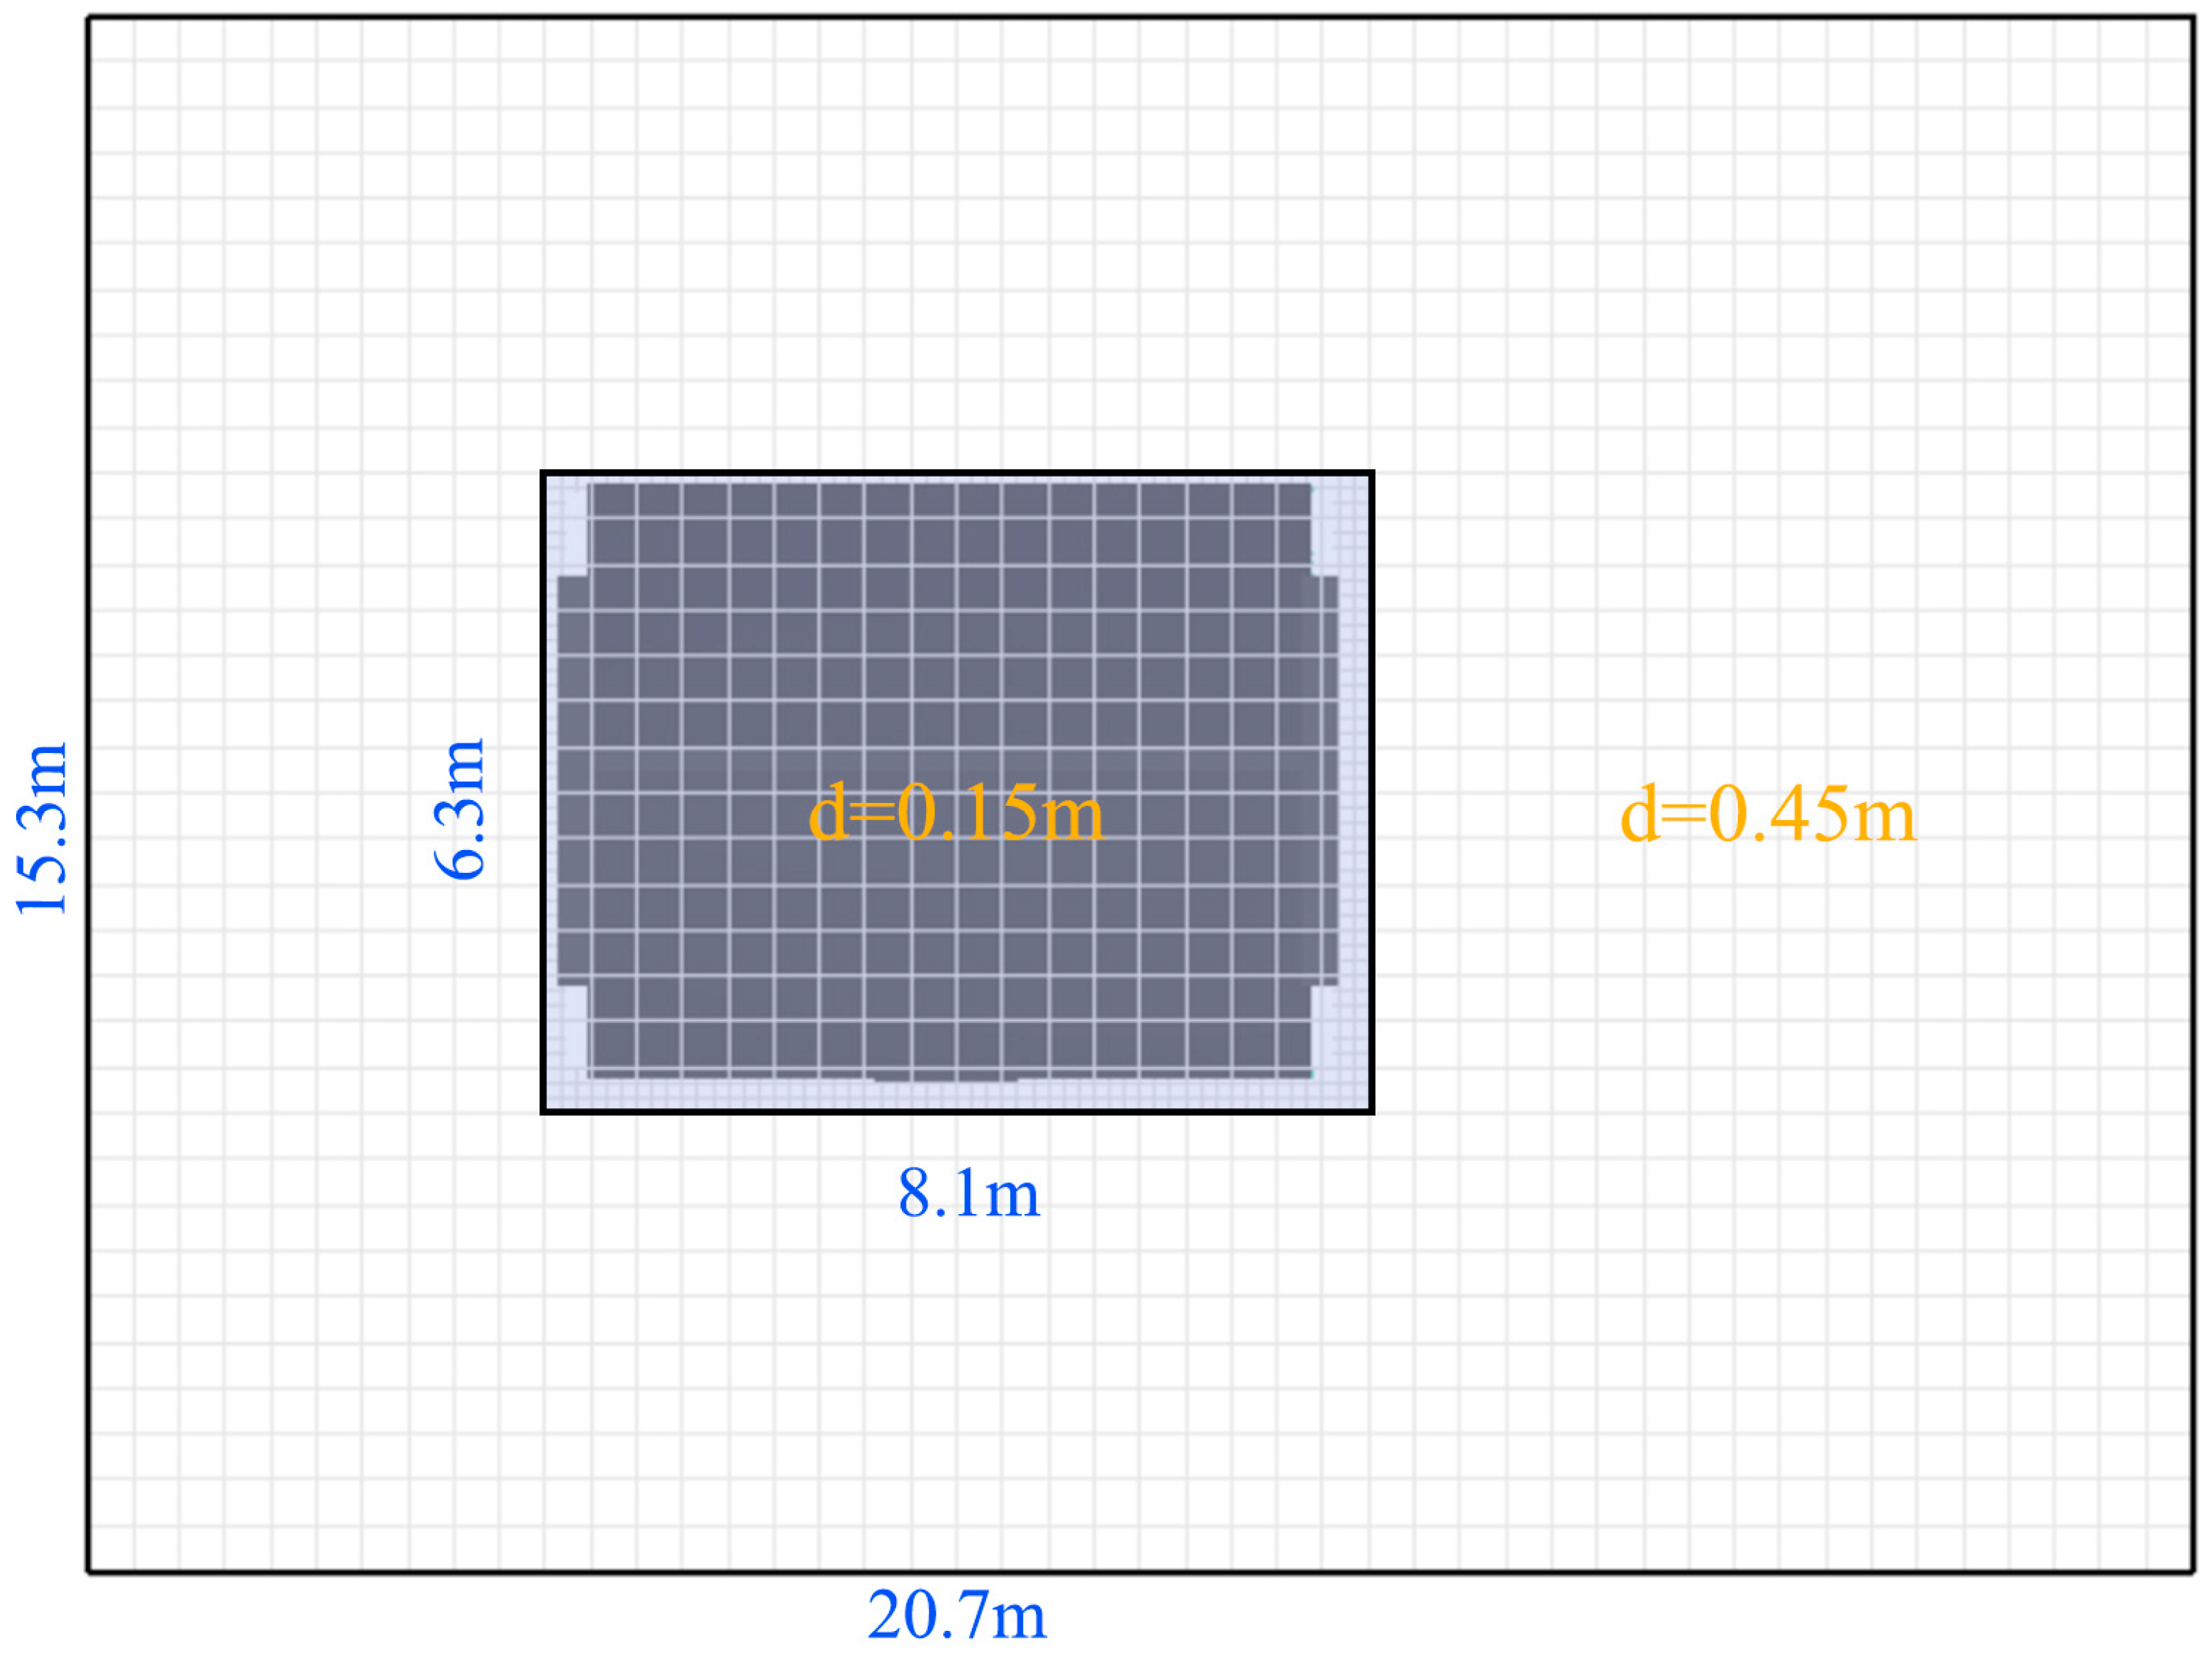
2.3.1. Grid Division
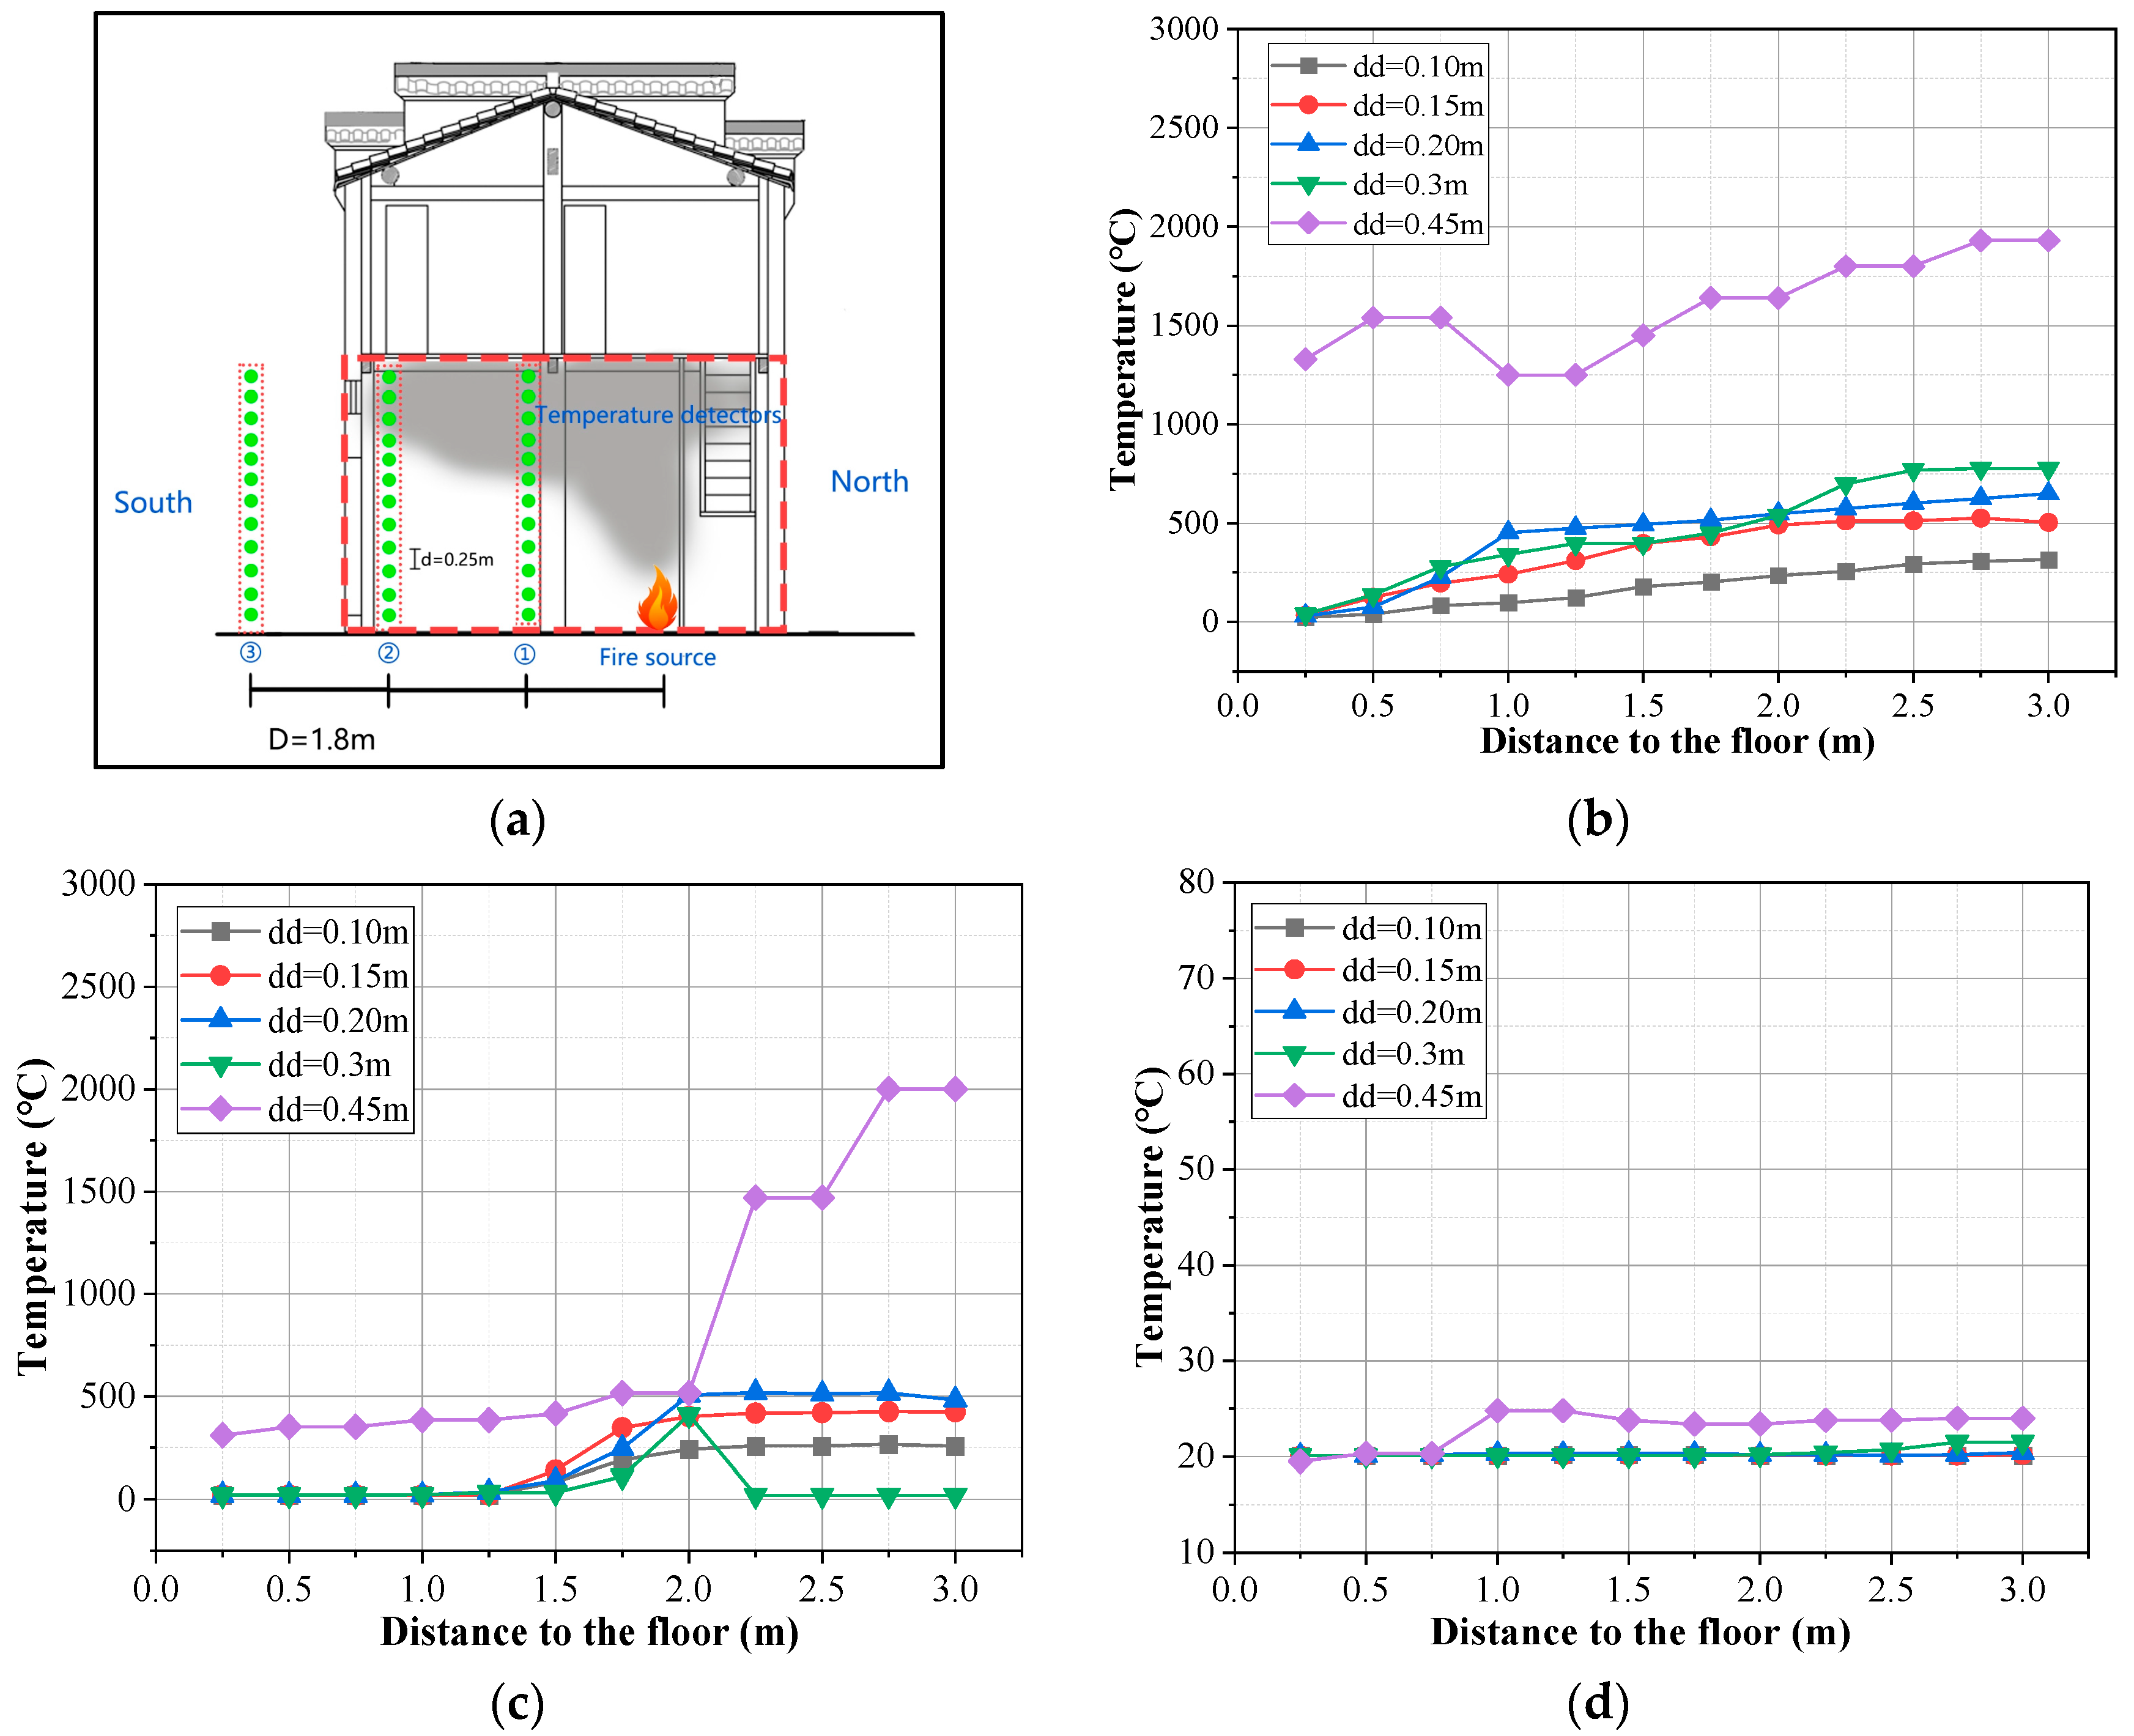
2.3.2. Grid Independence Verification
2.4. Simulation Verification
3. Results and Discussion
3.1. Comparative Analysis of the Fire Performance of Different Fire Seal Walls
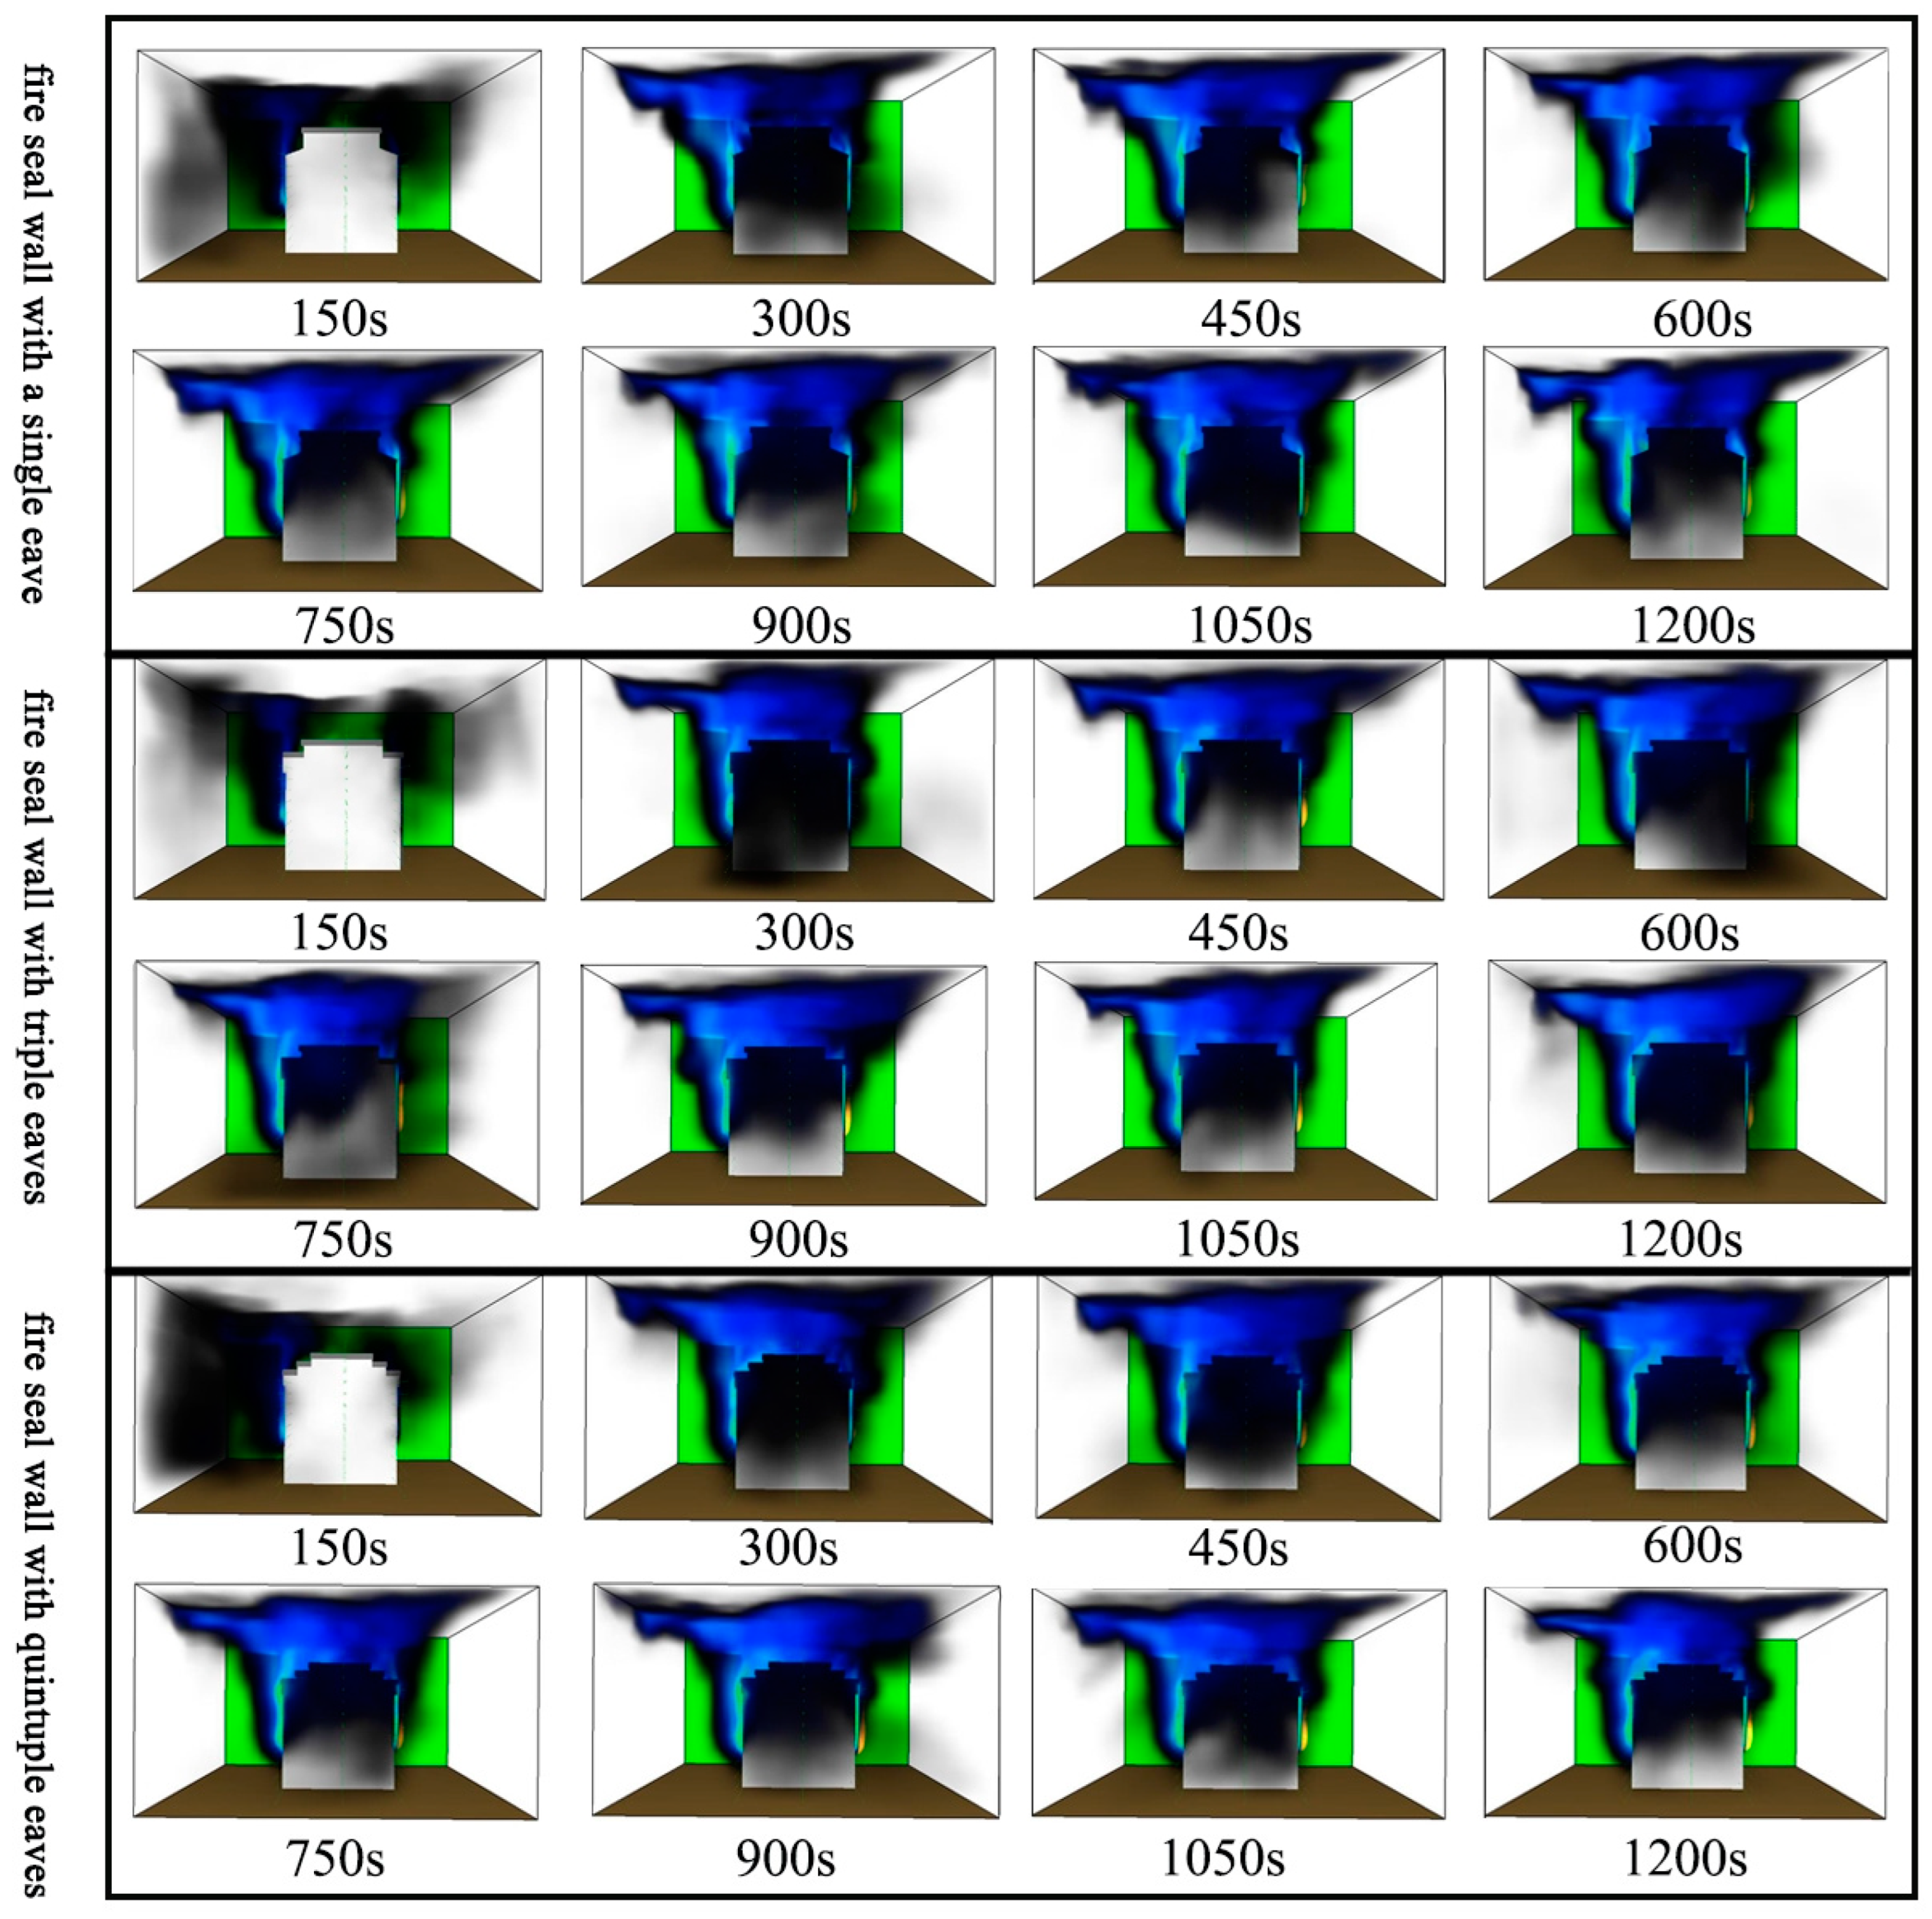
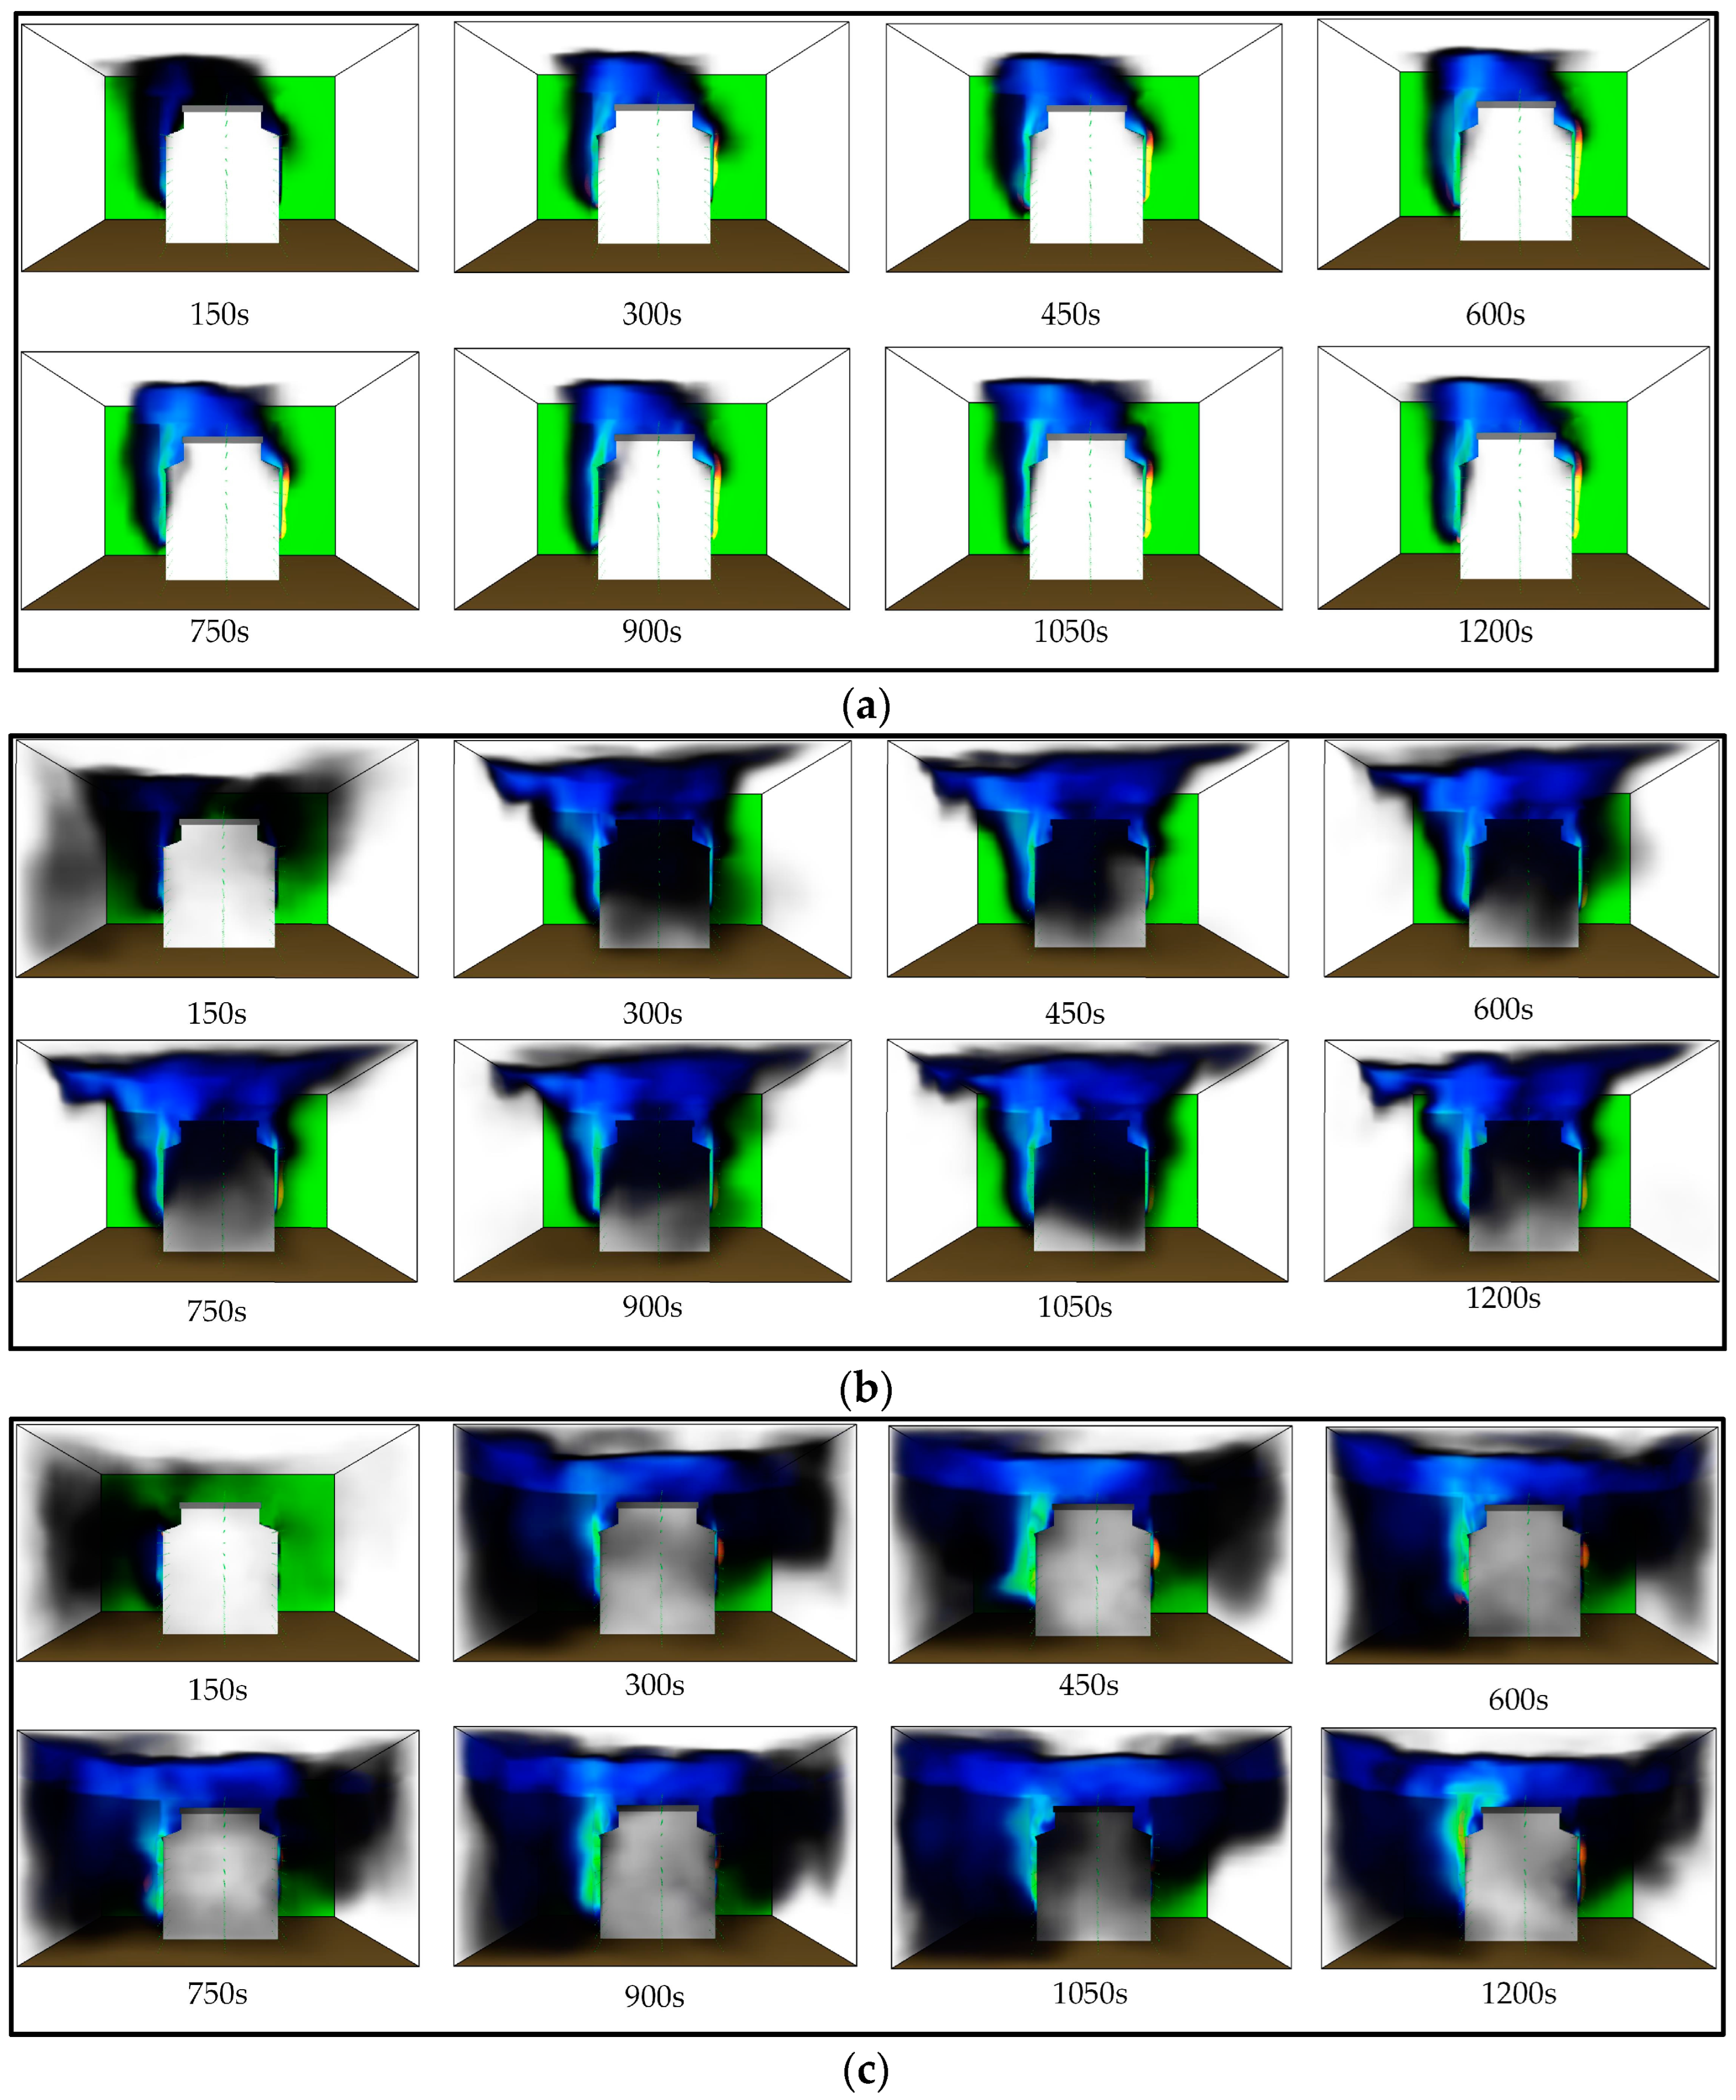
3.1.1. Analysis of Smoke Spread
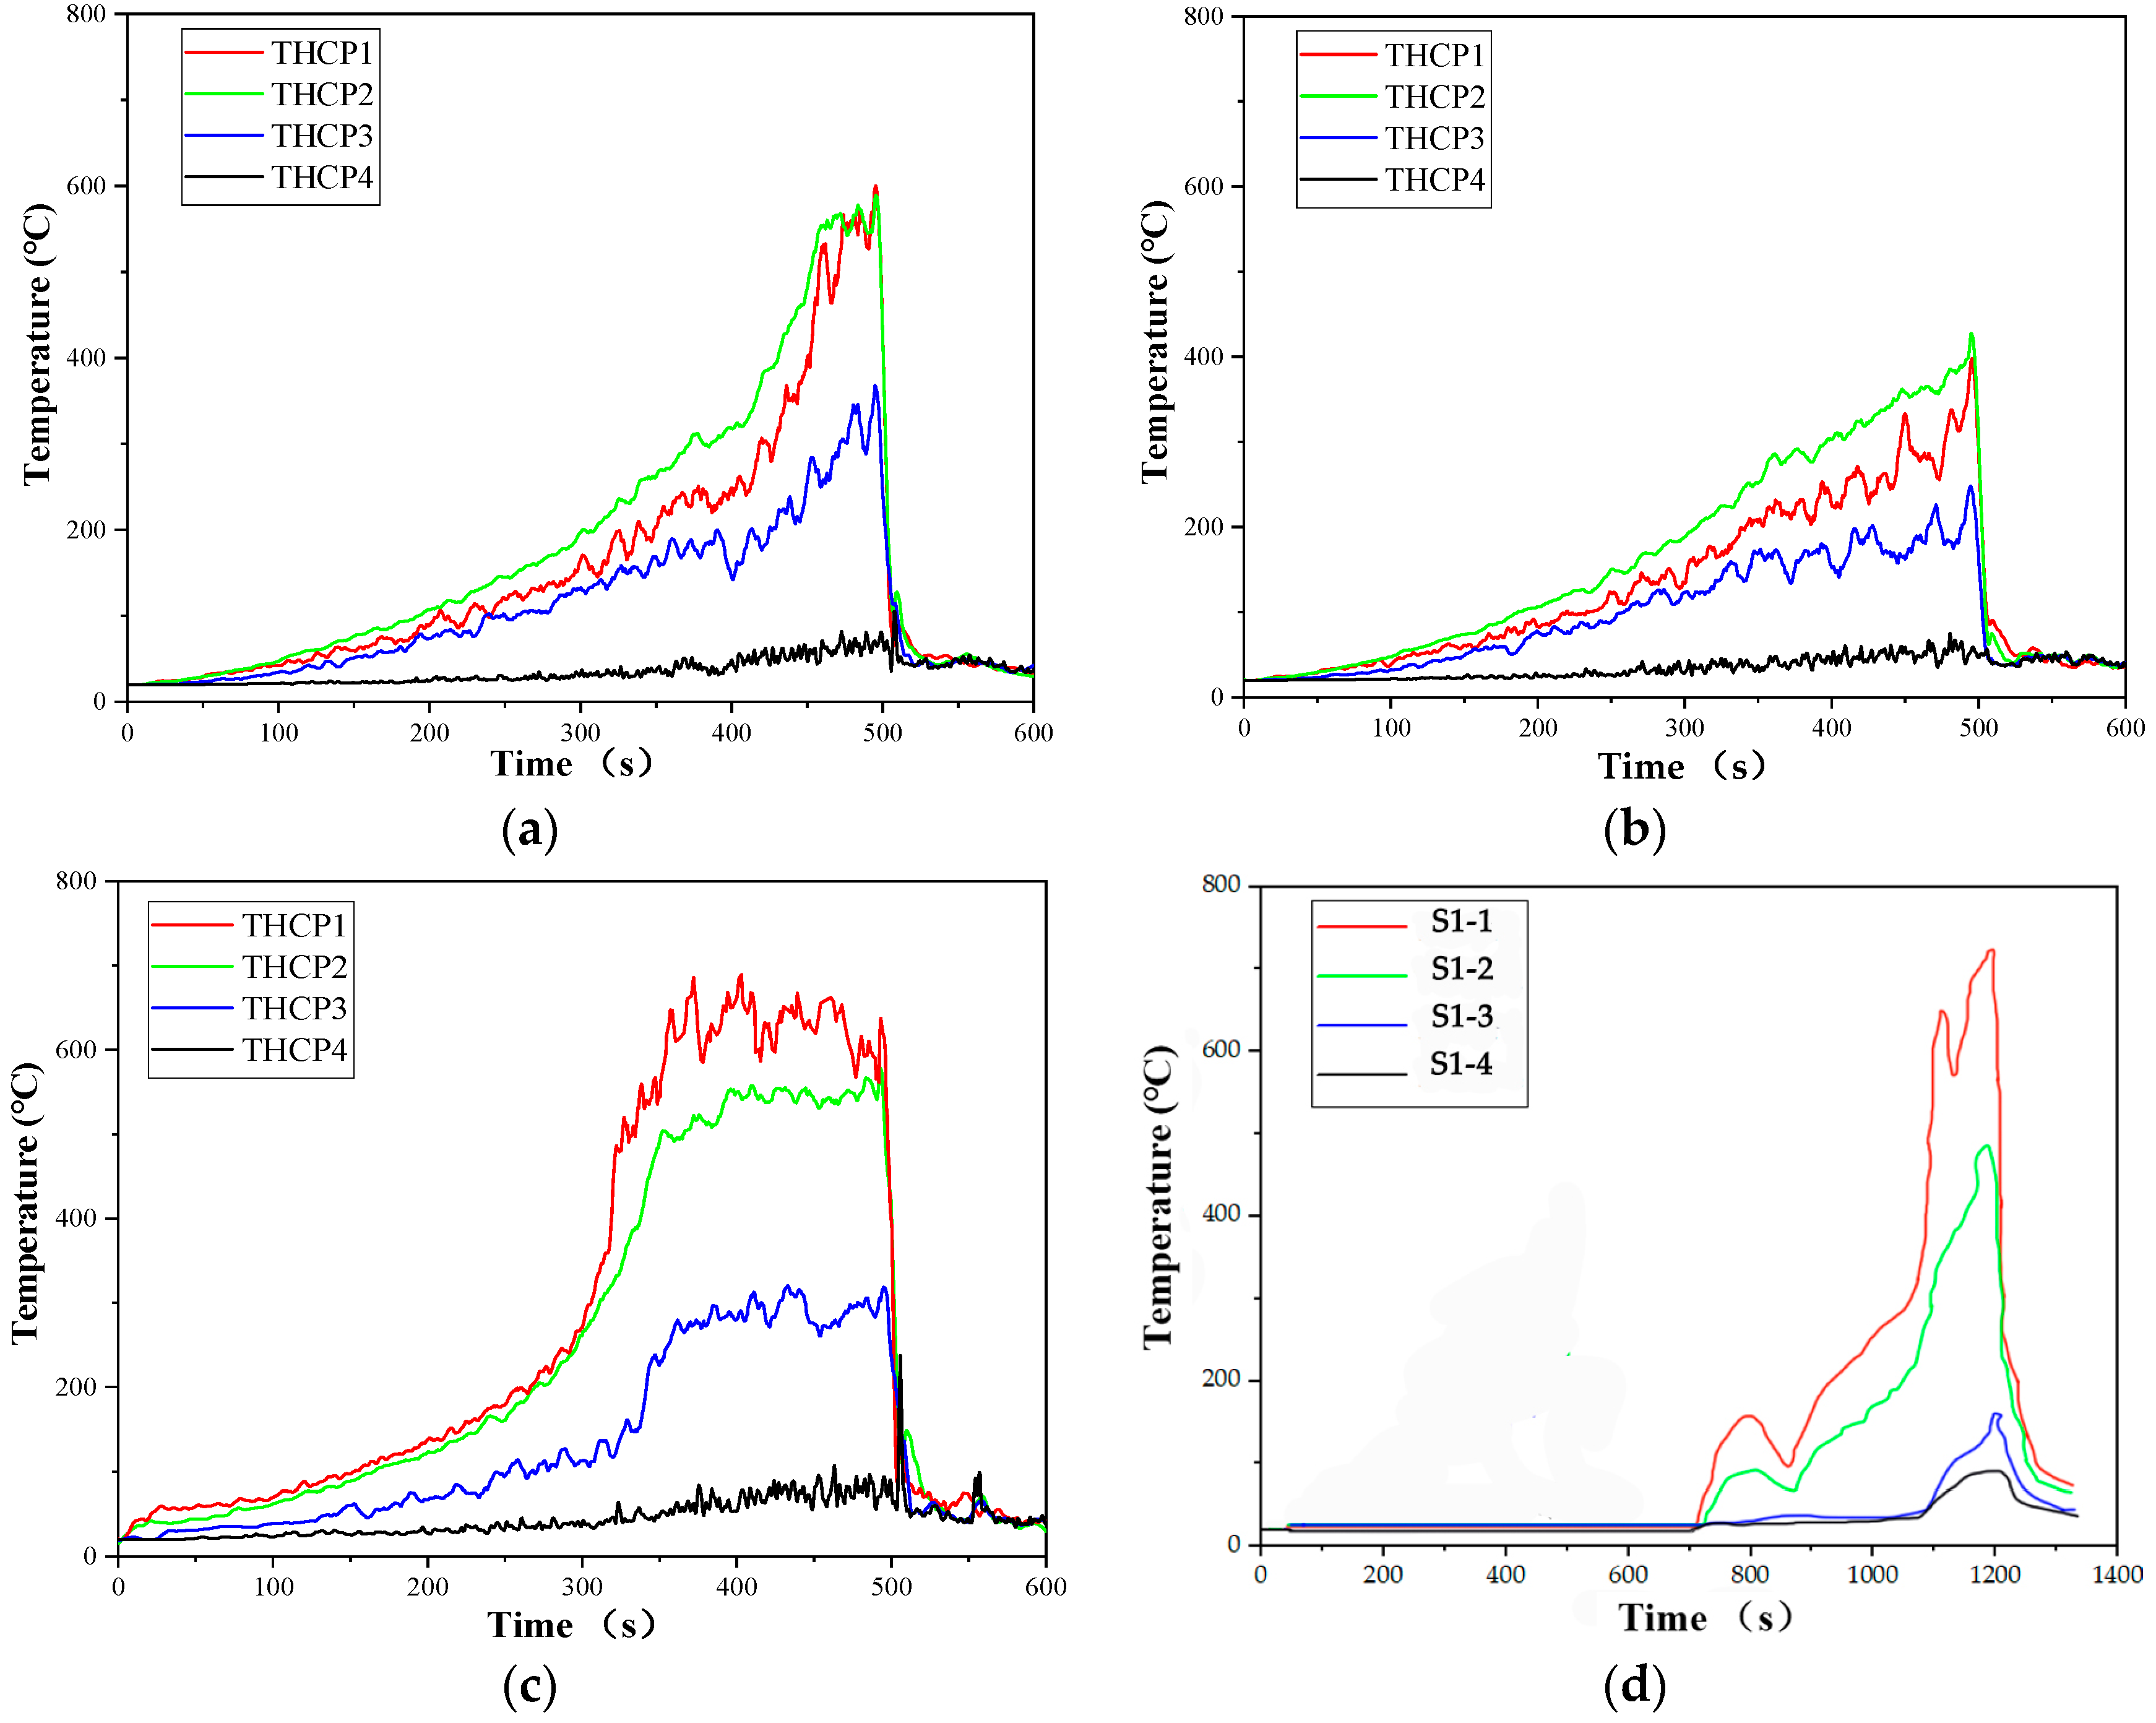
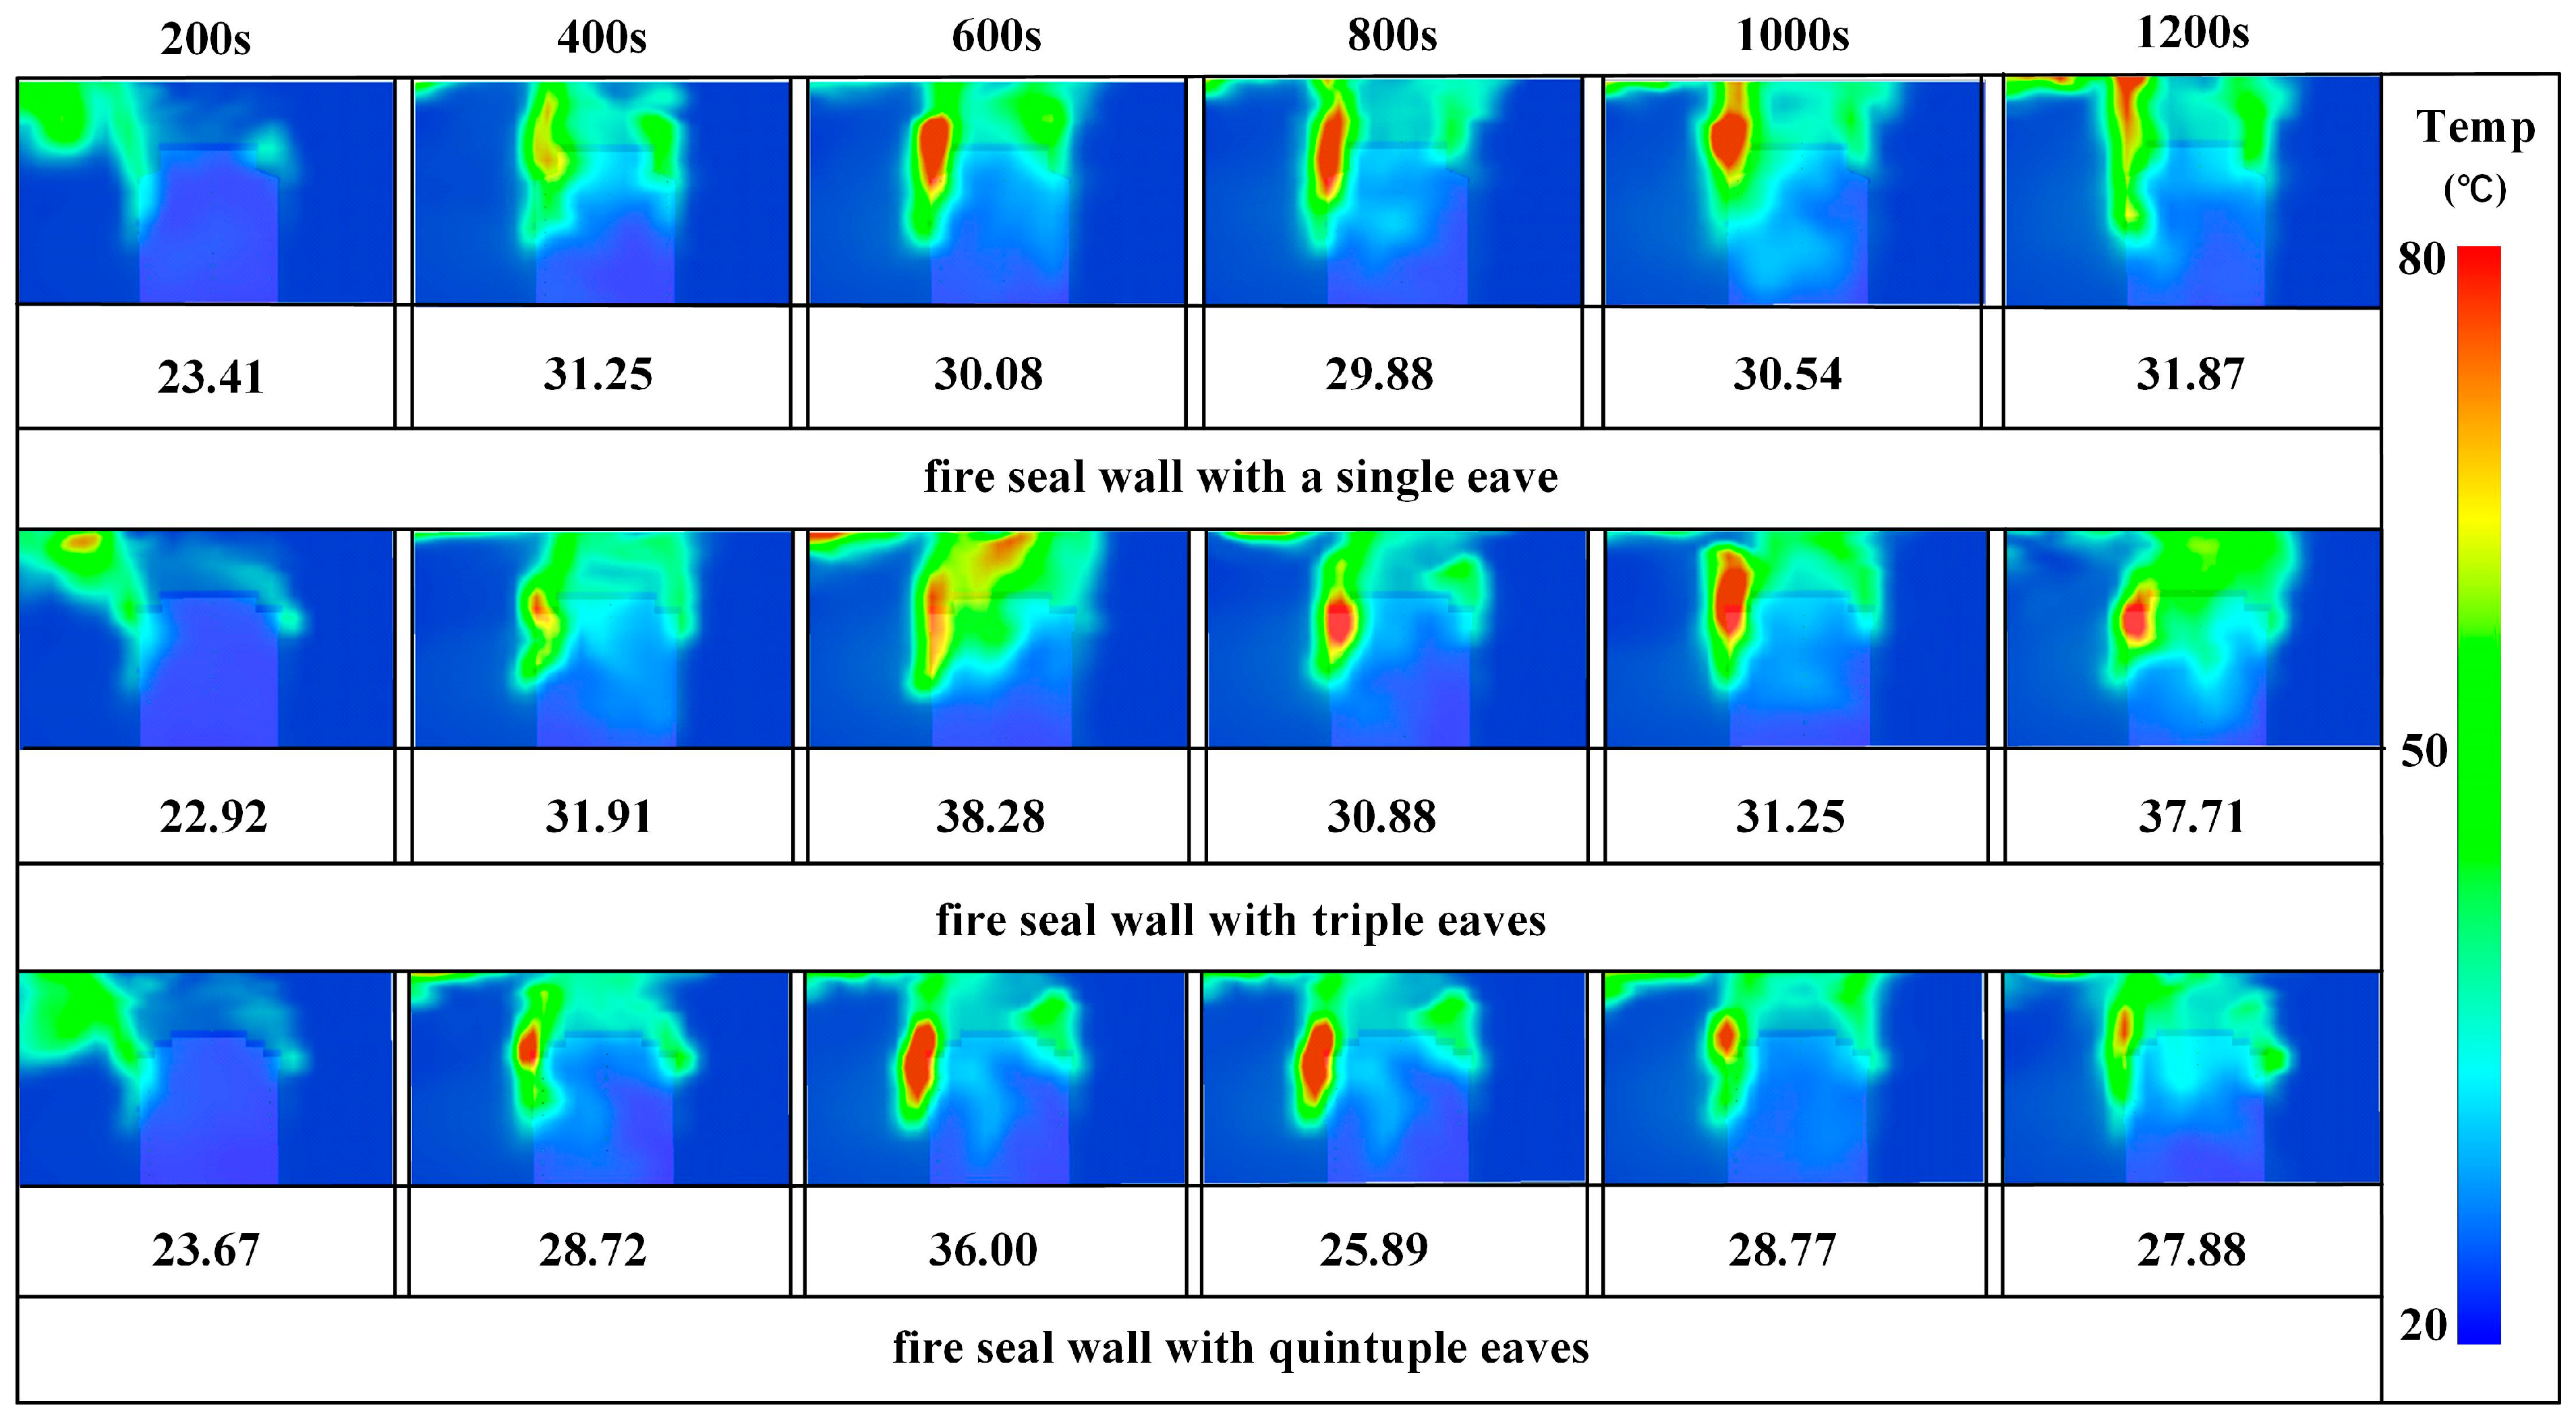
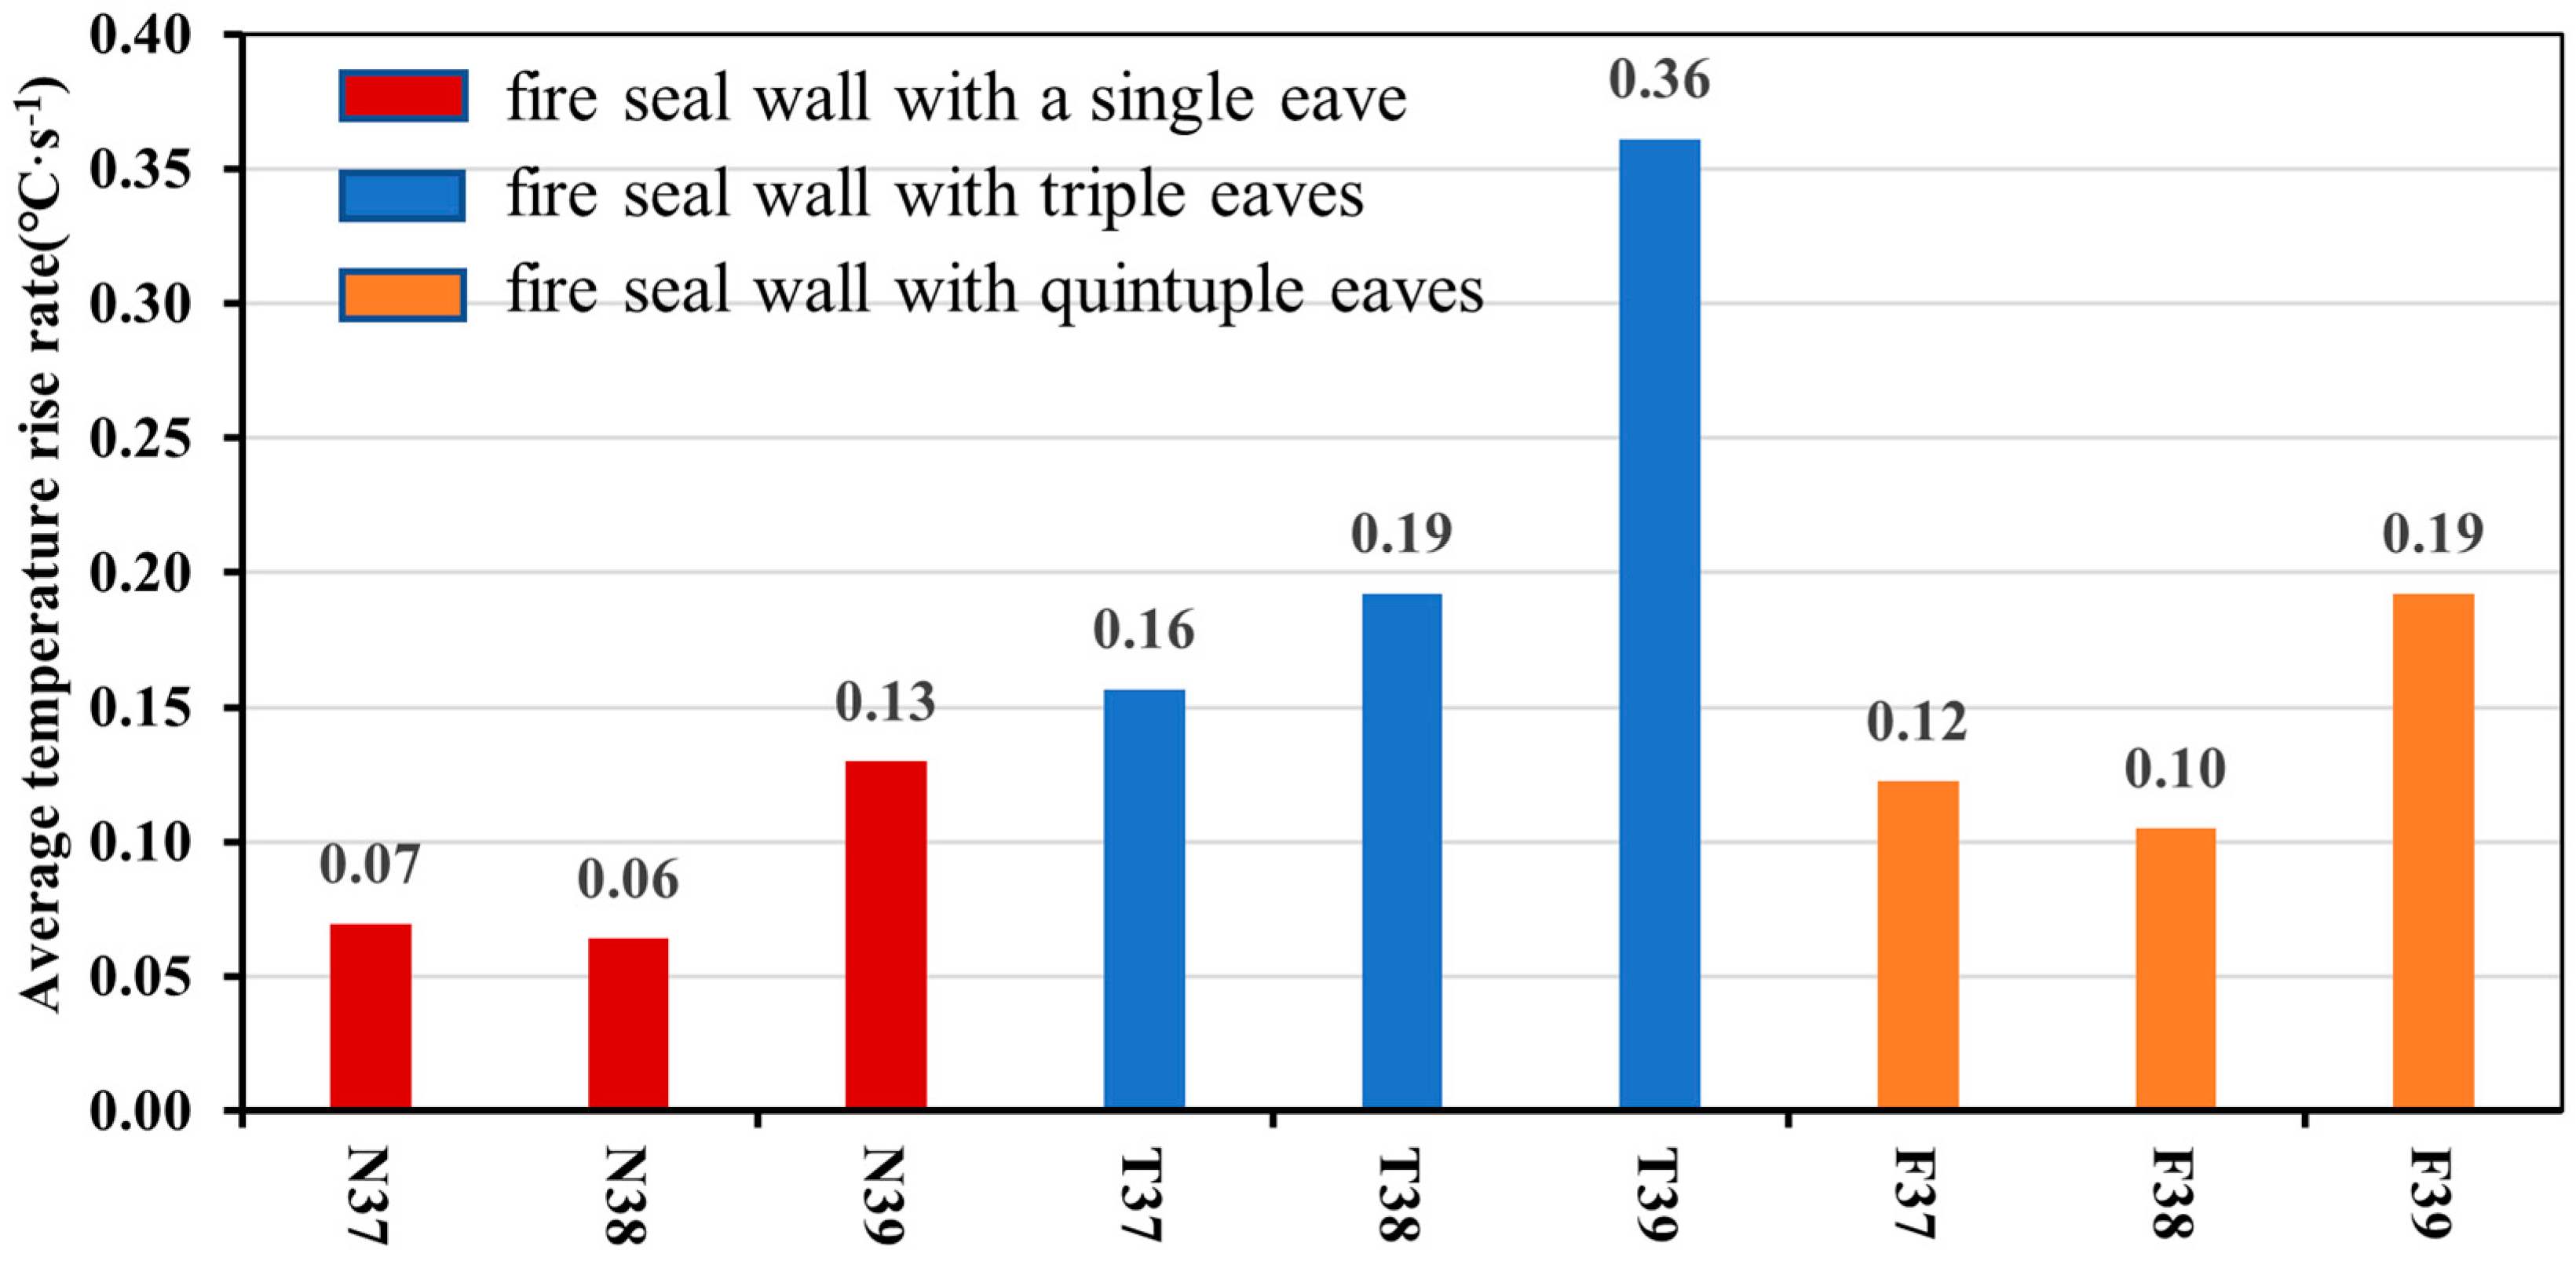
3.1.2. Analysis of Temperature Transfer
3.2. Analysis of the Impacts of Different Factors on the Fire Performance of Fire Seal Walls
3.2.1. Analysis of the Effect of Different Wind Speeds on Smoke Spread
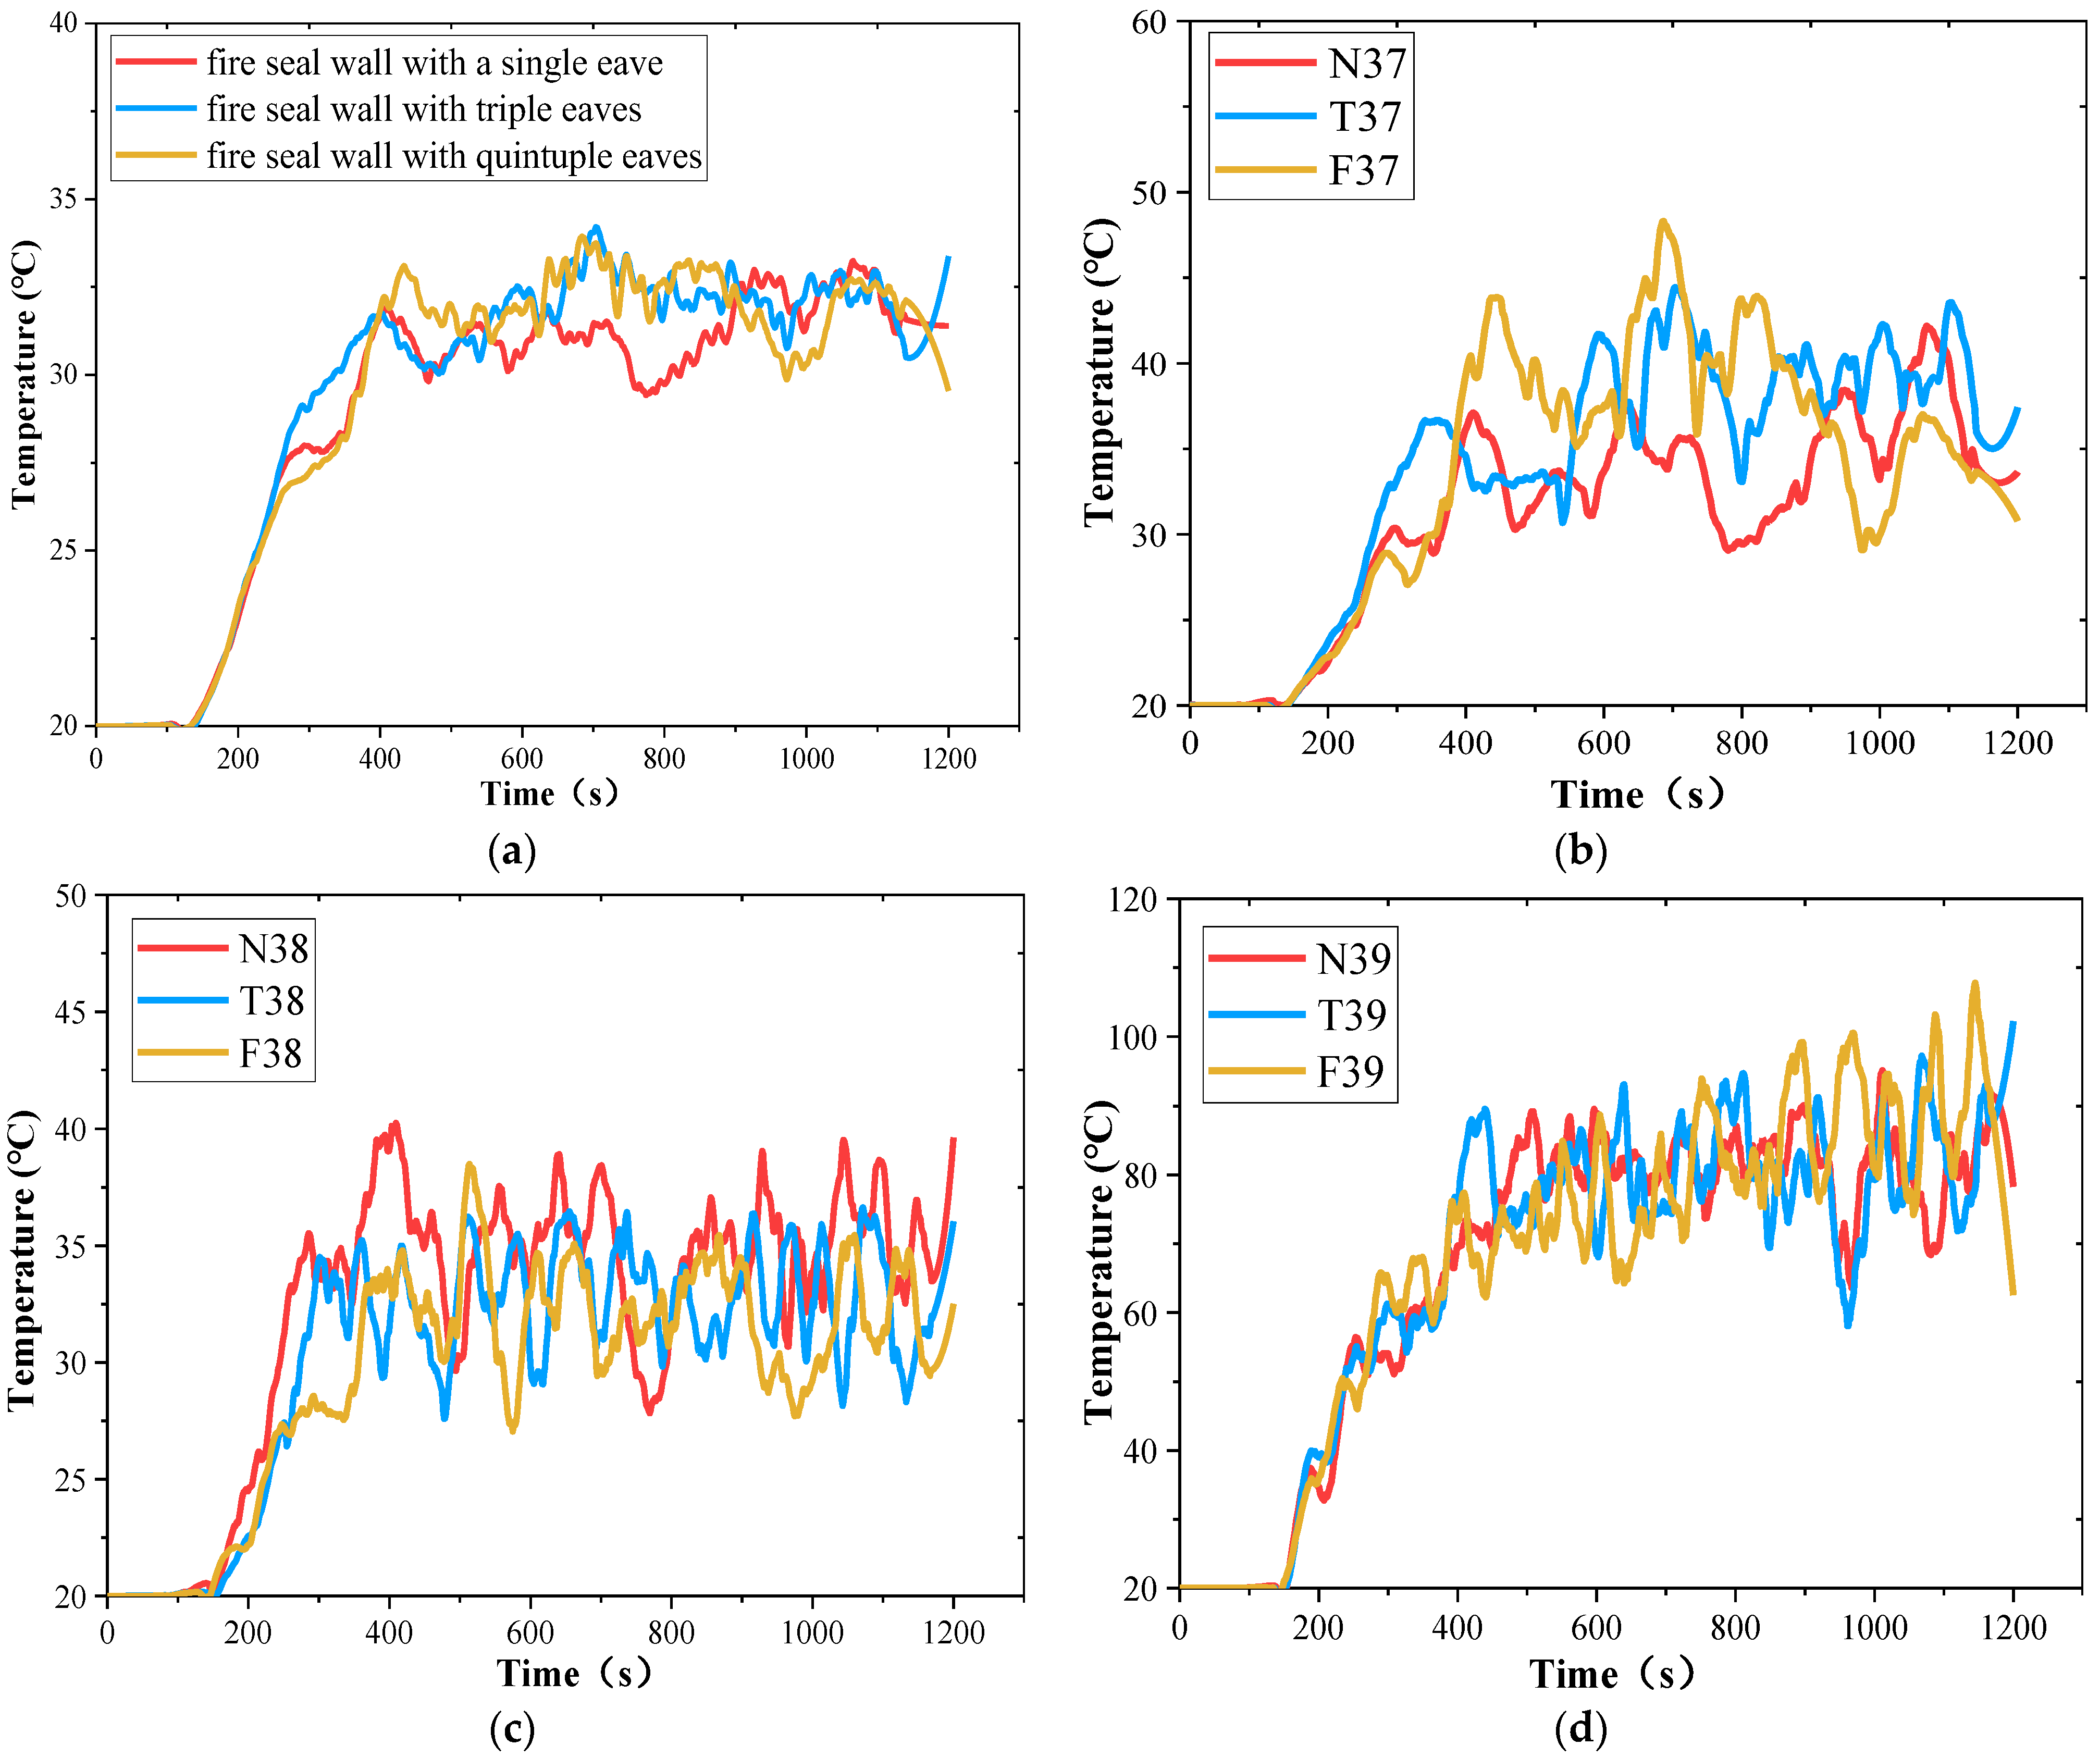
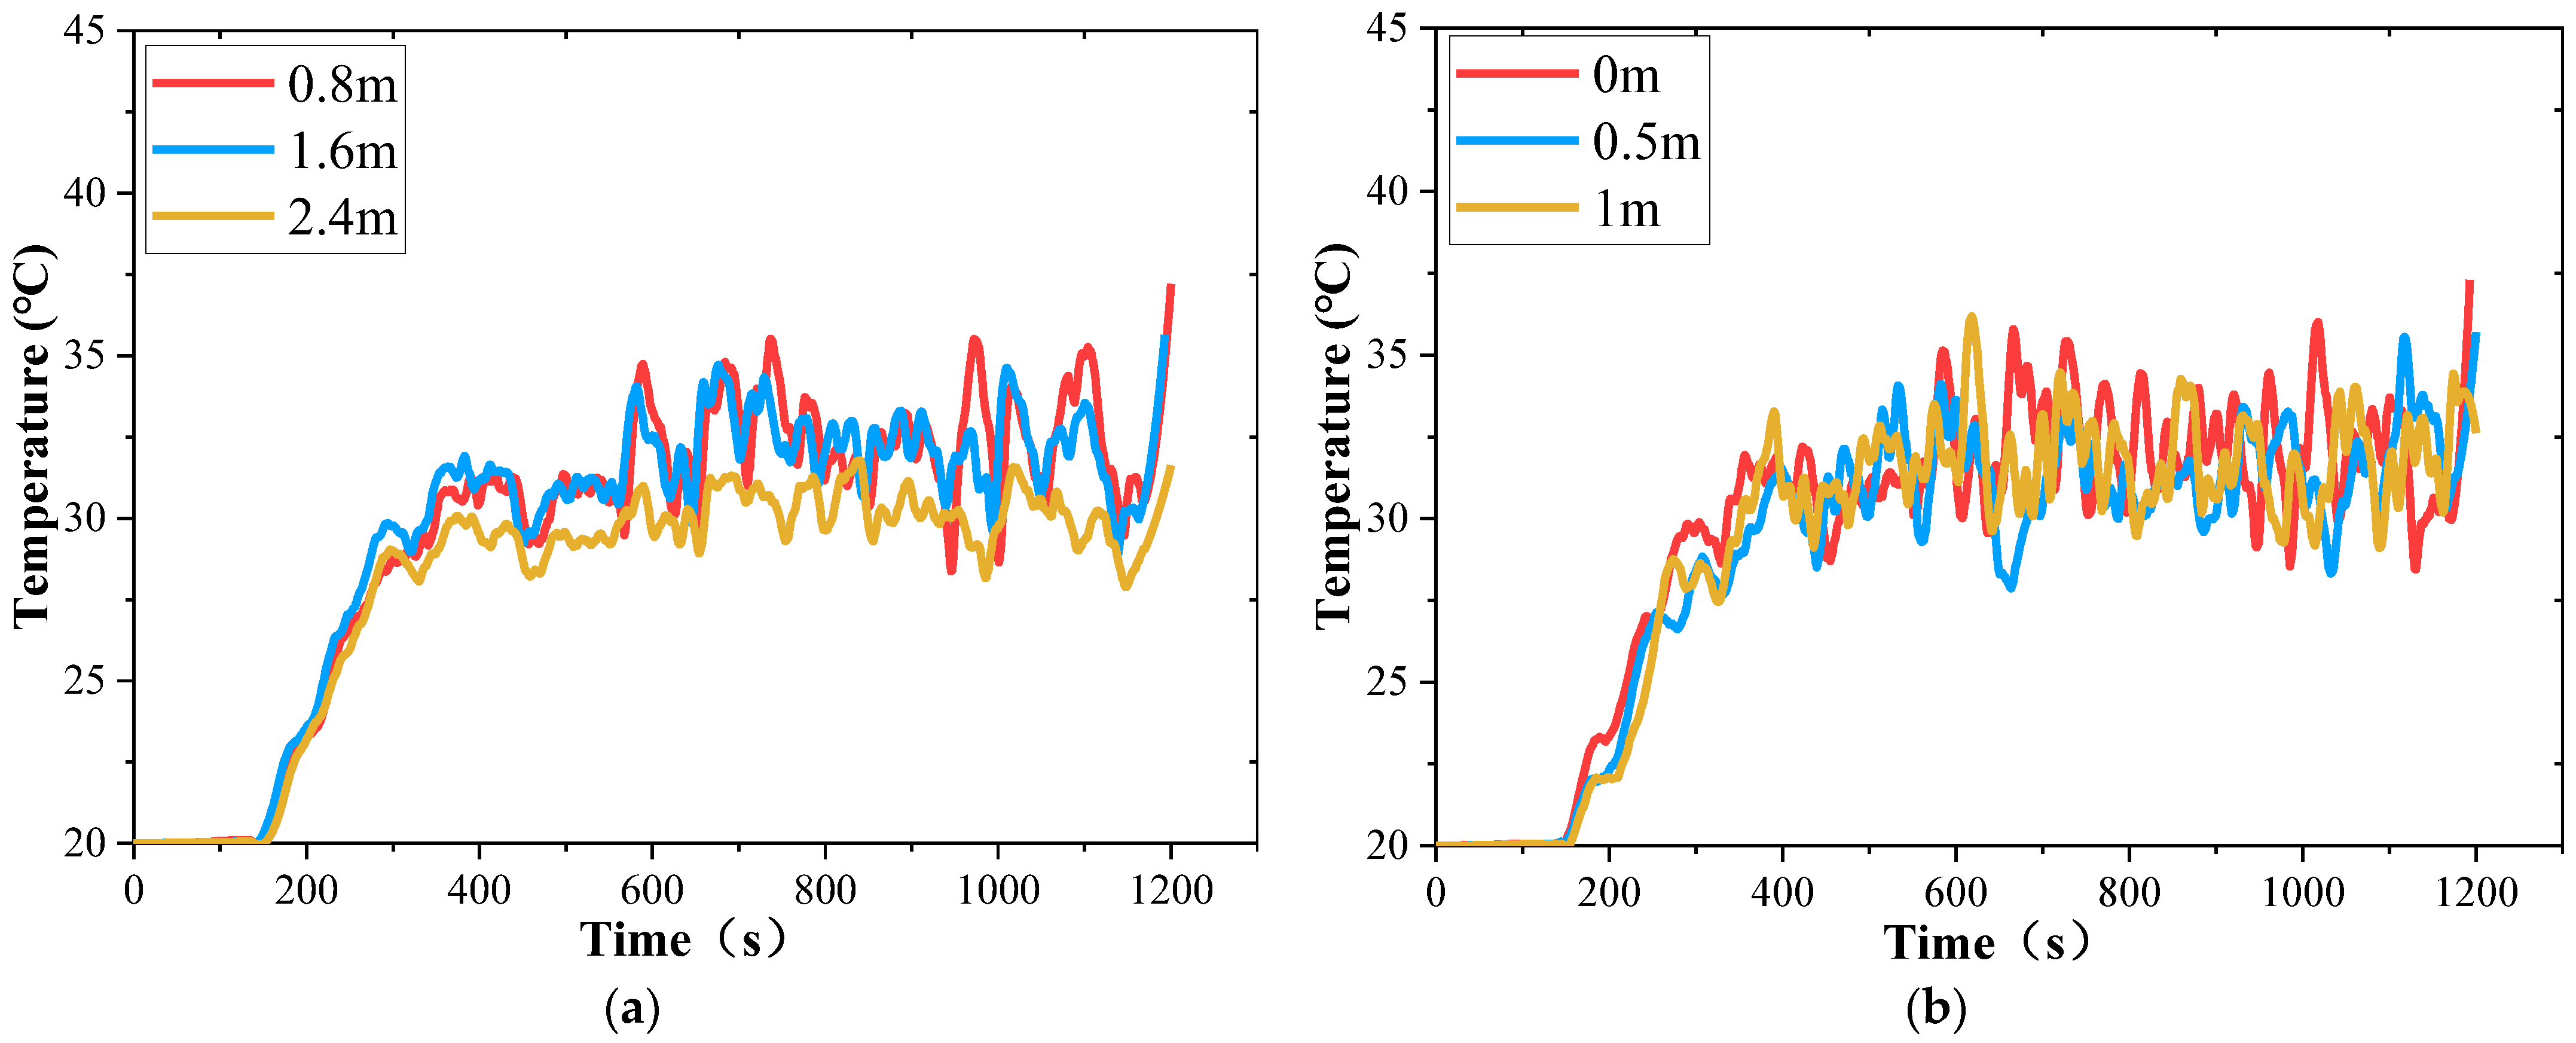
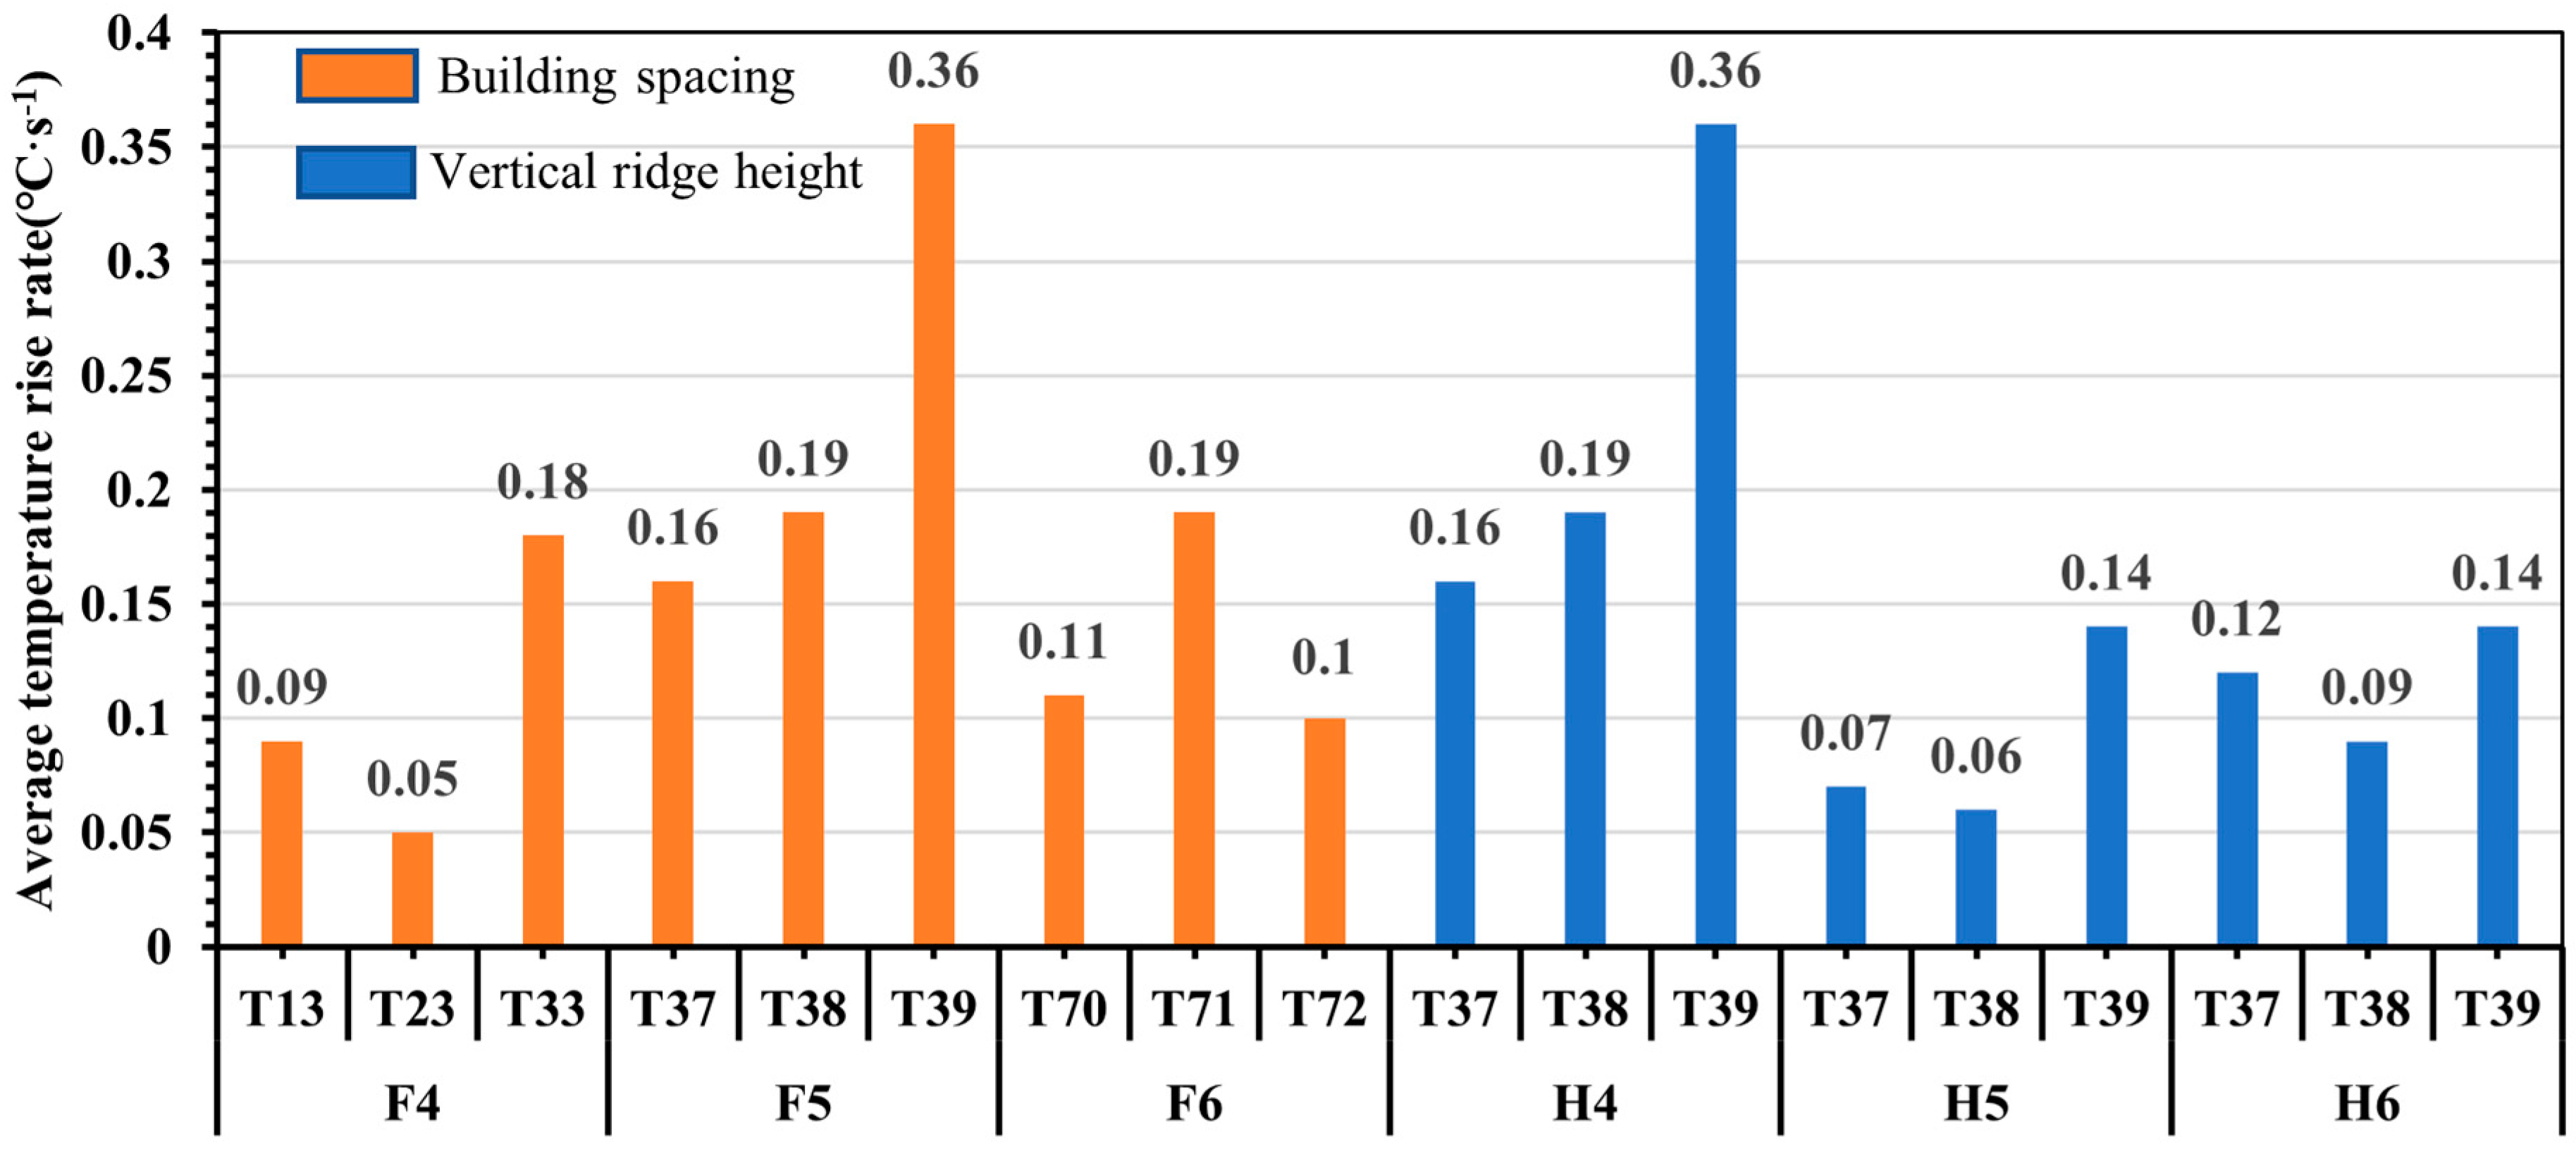
3.2.2. Analysis of the Effect of the Different Building Spacings and Vertical Ridge Heights on Temperature Transfer
4. Conclusions
- The results of the fire simulation scenarios at different fire seal walls show that, under the same conditions, the fire seal wall with single eaves is superior to that of the fire seal walls with quintuple eaves in terms of performance, and the fire seal walls with quintuple eaves are superior to the fire seal wall with triple eaves in the middle and late stages of a fire. Furthermore, the fire performance at the highest point on the left side of the three fire seal walls is weaker than that at the highest point in the middle and on the right side.
- The results of fire simulation scenarios at different wind speeds show that the windless scenario and the higher wind speed scenario have less impact on the fire performance of the fire seal wall. Moreover, the lower wind speed scenario has a greater impact on the fire performance of the fire seal wall, which can promote the spread of fire to neighboring buildings.
- The results of the fire simulation scenarios at different building spacings and vertical ridge heights show that, with increasing building spacing and vertical ridge height, overall, the fire seal wall provided better fire performance during the fire increase and stabilization phase. In addition, the highest points in the middle and on the left and right of the fire seal wall had the worst fire performance with respect to the 1.6 m building spacing and 0 m vertical ridge height scenarios.
- When performing the fire retrofitting of emblematic fire seal walls, the focus should be on repairing the top of the fire seal wall with triple eaves and near areas with many windows and doors. When performing the fire retrofitting of emblematic fire seal walls for areas with low wind speeds year-round, the focus should be on fire protection between neighboring buildings.
- An increase in the height of the vertical ridge and the fire separation distance can be used as a fire protection retrofitting measure for future fire seal walls. Moreover, for fire seal walls with a vertical ridge height of 0 m and a fire separation distance of 1.6 m, measures such as brushing fireproof paint can be adopted to strengthen the fire protection performance of the weak points at the top of the wall.
Author Contributions
Funding
Institutional Review Board Statement
Informed Consent Statement
Data Availability Statement
Conflicts of Interest
References
- Romão, X.; Bertolin, C. Risk protection for cultural heritage and historic centres: Current knowledge and further research needs. Int. J. Disaster Risk Reduct. 2022, 67, 102652. [Google Scholar]
- Xue, L.; Pan, X.; Wang, X. Introduction: Diversity of Cultures, Villages, and Architecture. In Traditional Chinese Villages, 1st ed.; Springer: Singapore, 2021; pp. 1–12. [Google Scholar]
- Yang, N.; Zang, X.; Chen, C. Inheritance Patterns under Cultural Ecology Theory for the Sustainable Development of Traditional Handicrafts. Sustainability 2022, 14, 4719. [Google Scholar]
- Chen, J.; Zhang, H.; Cao, Y. Improvement of Traditional Village Protection Infrastructure Management System. In Proceedings of the 5th International Conference on Social Sciences and Economic Development (ICSSED 2020), Xi’an, China, 6–8 March 2020; pp. 368–370. [Google Scholar]
- Li, Y.; Fan, P.; Liu, Y. What makes better village development in traditional agricultural areas of China? Evidence from long-term observation of typical villages. Habitat Int. 2019, 83, 111–124. [Google Scholar] [CrossRef]
- Chorlton, B.; Gales, J. Fire performance of cultural heritage and contemporary timbers. Eng. Struct. 2019, 201, 109739. [Google Scholar] [CrossRef]
- Ministry of Housing and Urban-Rural Development of the People’s Republic of China. Announcement on the List of Villages to be Included in the Sixth Batch of Chinese Traditional Village List. Available online: https://www.mohurd.gov.cn/gongkai/fdzdgknr/tzgg/202210/20221025768248.html (accessed on 26 October 2022).
- Lu, J.; An, Y.; Zhang, L. Study on the Correlation Between Spatial Distribution of Chinese Traditional Villages and Tourism Development Elements Based on GIS. J. Northeast. Agric. Univ. Soc. Sci. Ed. 2022, 20, 83–96. [Google Scholar]
- Huang, Y.; Li, E.; Xiao, D. Conservation Key points and management strategies of historic villages: 10 cases in the Guangzhou and Foshan Area, Guangdong Province, China. J. Asian Archit. Build. Eng. 2022, 21, 1320–1331. [Google Scholar] [CrossRef]
- Johnson, M.C.; Kennedy, M.C.; Harrison, S.C.; Churchill, D.; Pass, J.; Fischer, P.W. Effects of post-fire management on dead woody fuel dynamics and stand structure in a severely burned mixed-conifer forest, in northeastern Washington State, USA. For. Ecol. Manag. 2020, 470, 118190. [Google Scholar]
- Wang, K. Current Situation and Countermeasures of fire safety of cultural relics and ancient buildings. Fire Prot. Ind. 2017, 101–103. [Google Scholar]
- Zheng, Y. Analysis of the application and technology of the five elements in ancient Chinese buildings. For. Chem. Rev. 2022, 1260–1268. [Google Scholar]
- Yuan, C.; He, Y.; Feng, Y.; Wang, P. Fire hazards in heritage villages: A case study on Dangjia Village in China. Int. J. Disaster Risk Reduct. 2018, 28, 748–757. [Google Scholar] [CrossRef]
- Wu, Y.; Chen, S.; Wang, D.; Zhang, Q. Fire Risk Assessment of Heritage Villages: A Case Study on Chengkan Village in China. Fire 2023, 6, 47. [Google Scholar] [CrossRef]
- Sivrikaya, F.; Küçük, Ö. Modeling Forest fire risk based on GIS-based analytical hierarchy process and statistical analysis in the Mediterranean region. Ecol. Inf. 2022, 68, 101537. [Google Scholar]
- Zhang, F.; Shi, L.; Liu, S.; Zhang, C.; Liu, Z. CFD-Based Validation Study on the Fire Prevention Wisdom of Ancient Village Houses in Western Hunan. Fire 2023, 6, 144. [Google Scholar] [CrossRef]
- Ma, J.; Xiao, C. Large-scale fire spread model for traditional Chinese building communities. J. Build. Eng. 2023, 67, 105899. [Google Scholar]
- Xiaobo, S.; Zhaoyang, C.; Haifeng, L.; Beihua, C.; Feng, Z.; Yunsheng, M.; Xiong, Z.; Shengke, W. Inverse tracing of fire source in a single room based on CFD simulation and deep learning. J. Build. Eng. 2023, 107069, 2352–7102. [Google Scholar]
- Hashemi, Y. Full-Scale Burn Test of Wooden Three-Story Apartment Building. Fire Sci. Technol. 1997, 17, 78–92. [Google Scholar] [CrossRef][Green Version]
- Zhang, J.; Wang, Y.; Li, L.; Xu, Q. Thermo-mechanical behavior of dovetail timber joints under fire exposure. Fire Saf. J. 2019, 107, 75–88. [Google Scholar] [CrossRef]
- Schulz, J.; Kent, D.; Crimi, T.; Glockling, J.L.D.; Hull, T.R. A Critical Appraisal of the UK’s Regulatory Regime for Combustible Façades. Fire Technol. 2021, 57, 261–290. [Google Scholar] [CrossRef]
- Okubo, T. Traditional wisdom for disaster mitigation in history of Japanese Architectures and historic cities. J. Cult. Herit. 2016, 20, 715–724. [Google Scholar] [CrossRef]
- Li, J. Investigation of The Passive Energy-saving Technology Alteration of Southern Anhui Traditional Dwellings. J. Hefei Univ. 2015, 25, 69–72. [Google Scholar]
- Jing, H. A Brief Discussion on Passive Energy Saving Technology in Traditional Dwellings in Southern Anhui: Take Dalikeng Village in Wuyuan, Jiangxi Province, as an Example. Zhejiang Constr. 2014, 31, 49–52. [Google Scholar]
- Yu, H. Research on Fire Protection Systems in Traditional Dense Residential Blocks in Developed Areas. Master’s Thesis, Southeast University, Jiangsu, China, 2019. (In Chinese). [Google Scholar]
- Xiong, X.Y.; Su, Z.Y. Features and Current Damaged Situation of Hui-Style Architecture. Adv. Mater. Res. 2014, 838, 2905–2909. [Google Scholar] [CrossRef]
- Li, J. Chengkan Village of the ancient Fire Museum. In Exploration of Huizhou Ancient Folk Houses, 1st ed.; Shanghai Science and Technology Press: Shanghai, China, 2003; pp. 45–59. (In Chinese) [Google Scholar]
- Sun, G.; Wang, L. Analysis of ancient building fire spreading law based on PyroSim. Fire Sci. Technol. 2016, 35, 214–218. (In Chinese) [Google Scholar]
- McGrattan, K.; Hostikka, S.; McDermott, R.; Floyd, J.; Weinschenk, C.; Overholt, K. Fire dynamics simulator technical reference guide volume 1: A mathematical model. NIST Spec. Publ. 2013, 1018, 175. [Google Scholar]
- Zhou, Q. Influence of meshing on fire simulating based on FDS. Safety 2011, 32, 8–11. (In Chinese) [Google Scholar]
- Gao, X. Timber Structures Building Fire Spreading Research in Yunnan Province. Master’s Thesis, Kunming University of Science & Technology, Kunming, China, 2019. (In Chinese). [Google Scholar]
- Lan, Z. Chinese Traditional Buildings: FDS Simulation for Regions South of The Yangtze River. Master’s Thesis, Southeast University, Jiangsu, China, 2021. (In Chinese). [Google Scholar]
- Abu-Zidan, Y.; Rathnayaka, S.; Mendis, P.; Nguyen, K. Effect of wind speed and direction on facade fire spread in an isolated rectangular building. Fire Saf. J. 2022, 129, 103570. [Google Scholar] [CrossRef]
- Yi, X.; Zheng, L. Performance-based fire protection assessment of ancestral temple in canton based on fire dynamics simulator. Build. Sci. 2021, 37, 1002–8528. (In Chinese) [Google Scholar]


| Type | Number of Eaves | Example Photos | Schematic | ||
|---|---|---|---|---|---|
| fire seal wall with a single eave | 1 |  |  |  |  |
| fire seal wall with triple eaves | 3 |  |  |  |  |
| fire seal wall with quintuple eaves | 5 |  |  |  |  |
| Name of Material | Specific Heat Capacity (kJ/kg∙K) | Density (kg/m3) | Conductivity (W/m∙K) | Calorific Value (kJ/kg) |
|---|---|---|---|---|
| Yellow pine Fire seal wall Tile | 2.3 | 570 | 0.2 | 18,000 |
| 1.05 | 1700 | 1.89 | ||
| 1.24 | 1200 | 0. 43 |
| Category | Building Spacing (m) | Highest Point in the Middle | Highest Point on the Left | Highest Point on the Right |
|---|---|---|---|---|
| fire seal wall with a single eave | 0.8 | N13 | N33 | N23 |
| 1.6 | N37 | N39 | N38 | |
| 2.4 | N70 | N72 | N71 | |
| fire seal wall with triple eaves | 0.8 | T13 | T33 | T23 |
| 1.6 | T37 | T39 | T38 | |
| 2.4 | T70 | T72 | T71 | |
| fire seal wall with quintuple eaves | 0.8 | F13 | F33 | N23 |
| 1.6 | F37 | F39 | F38 | |
| 2.4 | F70 | F72 | F71 |
| Growth Type | A(kW/s2) | Typical Combustible Materials |
|---|---|---|
| superhigh speed | 0.1878 | Oil pool fire, flammable decorative home |
| high speed | 0.04689 | Wooden shelf pallets, foam |
| medium speed | 0.01172 | Cotton and polyester items, wooden offices |
| low speed | 0.00293 | Heavy wood products |
| Typical Fire Locations | Maximum Heat Release Rate/MW |
|---|---|
| Shopping malls with sprinklers | 5.0 |
| Offices and guest rooms with sprinklers | 1.5 |
| Public places with sprinklers | 2.5 |
| Supermarkets and warehouses with sprinklers | 4.0 |
| Offices and rooms without sprinklers | 6.0 |
| Public places without sprinklers | 8.0 |
| Supermarkets and warehouses without sprinklers | 20.0 |
| Group | Reference Temperature/°C | Heat of Reaction/(kJ/kg) |
|---|---|---|
| 1 | 150 | 5000 |
| 2 | 150 | 6000 |
| 3 | 100 | 6000 |
| Schematic | Scenes | Detector | Peak point Temperature (°C) | Time to the Peak (s) | Average Temperature Rise Rate (°C·s−1) |
|---|---|---|---|---|---|
 | F2 | N37 | 74.27 | 1070.41 | 0.07 |
| N38 | 59.81 | 936.01 | 0.06 | ||
| N39 | 128.72 | 992.40 | 0.13 | ||
 | F5 | T37 | 93.21 | 595.20 | 0.16 |
| T38 | 54.65 | 284.40 | 0.19 | ||
| T39 | 154.70 | 428.41 | 0.36 | ||
 | F8 | F37 | 83.22 | 680.41 | 0.12 |
| F38 | 55.00 | 524.41 | 0.10 | ||
| F39 | 155.61 | 810.01 | 0.19 |
| Scenes | Time | 200 s | 400 s | 600 s | 800 s | 1000 s | 1200 s | |
|---|---|---|---|---|---|---|---|---|
| F4 | Building spacing | 0.8 m | 22.84 | 32.90 | 31.98 | 32.82 | 29.54 | 35.88 |
| F5 | 1.6 m | 22.92 | 31.91 | 38.28 | 30.88 | 31.25 | 37.71 | |
| F6 | 2.4 m | 22.90 | 30.27 | 30.47 | 26.65 | 30.09 | 28.99 | |
| H4 | Vertical ridge height | 0 m | 22.92 | 31.91 | 38.28 | 30.88 | 31.25 | 37.71 |
| H5 | 0.5 m | 22.38 | 32.51 | 29.53 | 30.34 | 28.93 | 34.33 | |
| H6 | 1 m | 22.36 | 31.35 | 28.74 | 26.64 | 29.83 | 35.47 | |
| Schematic | Scenen | Detector | Peak Point Temperature (°C) | Time to the Peak (s) | Average Temperature Rise Rate (°C·s−1) |
|---|---|---|---|---|---|
 | F4 | T13 | 90.72 | 975.6 | 0.09 |
| T23 | 56.45 | 1105.2 | 0.05 | ||
| T33 | 210.63 | 1196.4 | 0.18 | ||
 | F5 | T37 | 93.21 | 595.2 | 0.16 |
| T38 | 54.65 | 284.4 | 0.19 | ||
| T39 | 154.7 | 428.41 | 0.36 | ||
 | F6 | T70 | 77.4 | 681.6 | 0.11 |
| T71 | 53.78 | 284.4 | 0.19 | ||
| T72 | 103.51 | 1015.2 | 0.1 | ||
 | H4 | T37 | 93.21 | 595.2 | 0.16 |
| T38 | 54.65 | 284.4 | 0.19 | ||
| T39 | 154.7 | 428.41 | 0.36 | ||
 | H5 | T37 | 76.17 | 1149.61 | 0.07 |
| T38 | 61.98 | 1118.4 | 0.06 | ||
| T39 | 138.87 | 984.01 | 0.14 | ||
 | H6 | T37 | 88.84 | 728.41 | 0.12 |
| T38 | 55.89 | 614.41 | 0.09 | ||
| T39 | 124.07 | 877.21 | 0.14 |
Disclaimer/Publisher’s Note: The statements, opinions and data contained in all publications are solely those of the individual author(s) and contributor(s) and not of MDPI and/or the editor(s). MDPI and/or the editor(s) disclaim responsibility for any injury to people or property resulting from any ideas, methods, instructions or products referred to in the content. |
© 2023 by the authors. Licensee MDPI, Basel, Switzerland. This article is an open access article distributed under the terms and conditions of the Creative Commons Attribution (CC BY) license (https://creativecommons.org/licenses/by/4.0/).
Share and Cite
Wu, Y.; Hua, B.; Chen, S.; Yang, J. FDS-Based Study of the Fire Performance of Huizhou Fire Seal Walls in Traditional Residential Buildings in Southern China. Fire 2023, 6, 388. https://doi.org/10.3390/fire6100388
Wu Y, Hua B, Chen S, Yang J. FDS-Based Study of the Fire Performance of Huizhou Fire Seal Walls in Traditional Residential Buildings in Southern China. Fire. 2023; 6(10):388. https://doi.org/10.3390/fire6100388
Chicago/Turabian StyleWu, Yunfa, Bin Hua, Sarula Chen, and Jimo Yang. 2023. "FDS-Based Study of the Fire Performance of Huizhou Fire Seal Walls in Traditional Residential Buildings in Southern China" Fire 6, no. 10: 388. https://doi.org/10.3390/fire6100388
APA StyleWu, Y., Hua, B., Chen, S., & Yang, J. (2023). FDS-Based Study of the Fire Performance of Huizhou Fire Seal Walls in Traditional Residential Buildings in Southern China. Fire, 6(10), 388. https://doi.org/10.3390/fire6100388