1. Introduction
Due to production, transportation, and other reasons, a mine roadway inevitably has a diagonal structure. The confluence and shunt of the airflow occur in the diagonal structure, which makes the heat transfer law between the smoke flow and the environment complex and changeable [
1]. This leads to different temperature attenuation laws of smoke flow at branches and cross structures [
2]. This non-uniform temperature attenuation phenomenon leads to significant differences in buoyancy and throttling effects in different regions, which makes it difficult to quantitatively calculate the disordered form of the ventilation system, resulting in severe consequences in engineering practice [
3]. Therefore, it is necessary to study the smoke temperature distribution and attenuation law in the diagonal pipe network during the fire period to provide a theoretical basis for the calculation of buoyancy, throttling, and other thermal forces during the fire period.
The law of temperature distribution during a fire in long and narrow spaces has been extensively studied, including highway tunnels, subway tunnels, mine roadways, and so on. Hu [
4] and others, through several groups of full-scale tunnel fire experiments, show that the fire smoke temperature attenuates exponentially along the tunnel direction, which further verifies the exponential model of fire smoke temperature attenuation. Gong [
5] et al. established the temperature attenuation model of flue gas in a longitudinal ventilation tunnel by a double exponential function and attributed the heat loss of flue gas to radiative heat transfer, convective heat transfer of forced airflow, and heat conduction of the inner wall. Chow [
6] et al. analyzed the chimney effect in the tunnel, turned the horizontal tunnel into a sloping tunnel, and finally determined that the buoyancy of smoke in the sloping tunnel is asymmetrical. Under buoyancy, the smoke moves more upward, while the flue gas flowing in the downhill direction decreases, and its temperature attenuation rate is more rapid. Gao [
7] and others have studied the temperature distribution characteristics of the tunnel with a circular arch section, compared it with Gong′s model, and found some differences between them, which are attributed to the difference in the shape of the model section. According to the characteristics of the circular arch shape, the transverse temperature distribution of the arch is studied, and it is considered that the temperature distribution in different positions is mainly affected by convection and radiation. Huang [
8] studied the characteristics of roof temperature distribution under the bifurcation structure of highway tunnels through shrinking experiments. The maximum ceiling temperature varies as 2/5 power of the heat release rate when the dimensionless ventilation velocity is lower than 0.19. The cross angle strongly influences the maximum ceiling temperature under forced ventilation. Liu [
9] set the fire source at the intersection of the main tunnel and the connecting tunnel, changed the slope of the tunnel through small-scale experiments and numerical simulation, and determined that the dimensionless temperature distribution along the smoke temperature depends on the slope of the current tunnel itself and is little affected by the slope of the other connecting tunnel.
The phenomenon of smoke backflow is often inseparable from temperature distribution and attenuation in fire accidents. Previous studies have shown that the relationship between the static pressure difference caused by high temperature and the longitudinal aerodynamic pressure is the key to smoke backflow [
10]. Thomas [
11,
12] first studied the critical wind speed of fire smoke backflow in the 1960s. He believed that smoke backflow is affected by buoyancy and inertia force, and the critical wind speed is related to the ratio of buoyancy and inertia force, the Froude number. When the Froude number is 1, the critical wind speed is the critical wind speed, the buoyancy is equal to the inertia force, and the smoke does not regress. The study of horizontal tunnel fire by Hinkley and Heselden [
13] shows that the critical wind speed is proportional to the third power of the heat release rate of the fire source, and the corresponding prediction formula of the critical wind speed of smoke retrogression is given. Oka and Atkinson [
14] studied the critical wind speed of fire smoke retrogression in a sloping tunnel through small-scale experiments, and the corresponding prediction formula was obtained by fitting. Wu Y. and Barker [
15] further summarized the definition of a long and narrow space. They introduced the tunnel hydraulic diameter as the characteristic size for studying tunnel fire, which can better study the tunnel with various cross-section shapes. Finally, the expression of critical wind speed is obtained through experiments and compared with the numerical simulation results. The results show that the two are consistent.
It can be seen that the previous studies on temperature attenuation in narrow spaces are mainly focused on a single roadway. The structure of a single roadway is uniform, the forced ventilation is constant, and the heat transfer between smoke flow, sidewall, and the air is stable, so the movement form and temperature attenuation of high-temperature smoke flow during a fire can be described more accurately by the theoretical model [
16]. The structure of the diagonal pipe network is more complex, and the airflow direction of the diagonal branches will be reversed with the change in the ventilation resistance of the associated branches, which is unstable. In addition, at the cross of the roadway, the local disorder of the airflow and the complex wall structure of the roadway will cause the heat transfer instability of the smoke flow, which makes the temperature attenuation of the smoke flow challenging to predict [
17]. It can be seen that the temperature attenuation law of smoke flow in the diagonal pipe network is more complex than that in the single roadway, so it is necessary to explore the temperature distribution in the diagonal pipe network based on the temperature attenuation model in the single roadway. Based on the theoretical model of temperature attenuation in a single roadway, this paper uses the numerical simulation method to explore the temperature characteristics of diagonal branches and left and right paths using numerical simulation data. The parameters of the attenuation model are optimized in the diagonal branch, the temperature attenuation process in the left and right path is described in segments, and the attenuation models of different stages are established. The temperature characteristics of the smoke retrogression front in the left and right passageway are analyzed, which provides a theoretical reference for thermal power calculation and ventilation control during a complex pipe network fire.
2. A Theoretical Model of Smoke Temperature Attenuation in the Single Roadway
In this paper, the temperature analysis is based on the fire smoke temperature attenuation model established by Li under longitudinal ventilation in the tunnel [
18].
For the one-dimensional smoke plume propagation stage in the tunnel, the control body shown in the box in the picture can be described as follows:
To simplify the derivation, the following assumptions are made:
- (1)
The physical properties, such as density and specific heat of fire smoke, are constant.
- (2)
About the convective heat transfer coefficient between the fire smoke and the tunnel, the same assumption as Delichatsios (1981) is adopted, that is, the convective heat transfer coefficient of the smoke to the tunnel roof and sidewall is proportional to the propagation velocity of the smoke [
19].
- (3)
Ignore the mass entrainment of fire smoke to the surrounding air, namely We = 0, so that the thickness and mass flow rate of the fire smoke layer remain unchanged during its propagation along the tunnel.
- (4)
The ceiling temperature of the tunnel is similar to the ambient temperature.
According to the above assumptions, the equation is simplified as follows:
Substituting Equation (4) into Equation (3):
The Stanton number can be described as
; select a reference position to Equation (5):
According to the second assumption, the Stanton number in the right integral of the equation is a constant. Sort up and get:
The approximate value of the Stanton number in the above formula can be obtained by numerical simulation after fitting. The reference point in the formula can be any point downstream of the fire source, if the hydraulic diameter is defined as the formula is converted to:
For tunnels with rectangular cross-sections, the hydraulic diameter is shown in Equation (9).
In forced ventilation, the reference position
and the reference position temperature rise
are replaced by the maximum temperature rise position
and the maximum temperature rise
, and the smoke temperature attenuation model of tunnel fire under longitudinal wind is given:
The meanings of the symbols in the above derivation are as follows:
is smoke mass flow rate, kg/s;
is the air entrainment velocity, m/s;
W is the tunnel width, m;
h is the tunnel height, m;
is the convective heat loss rate;
L is the contact perimeter between the smoke and the roadway, m;
is the maximum temperature rise in the diagonal branch, °C;
is the maximum temperature rise position;
for downstream of the highest temperature point;
d is the hydraulic diameter, m;
is the convective heat transfer coefficient, W/(m
2K);
is the density of the fluid, kg/m
3;
is the specific heat of the fluid, J/(kg
°C); V is the velocity of the fluid, m/s;
Pr is the Pelant number;
is the friction coefficient; and St is the Stanton number [
20].
3. Numerical Simulation Model and Working Condition Design
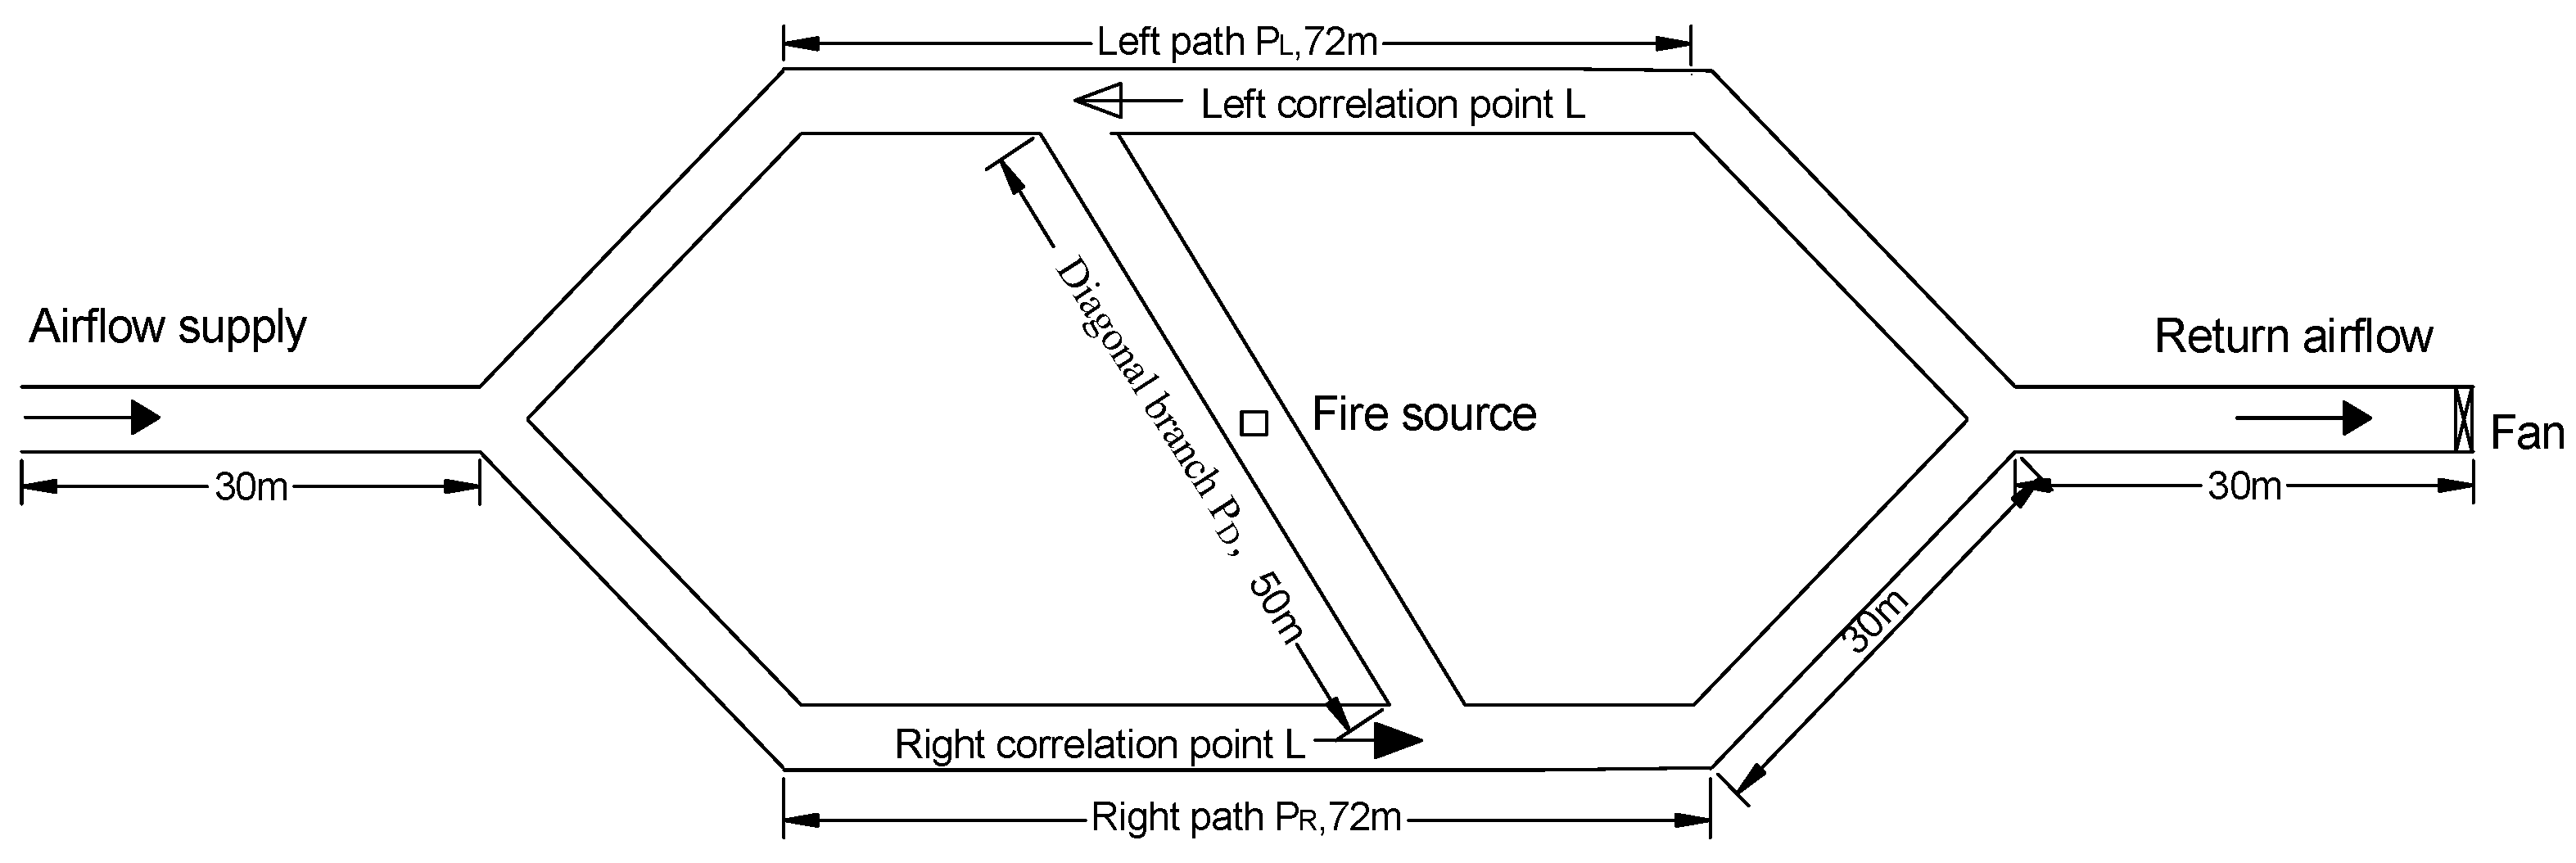
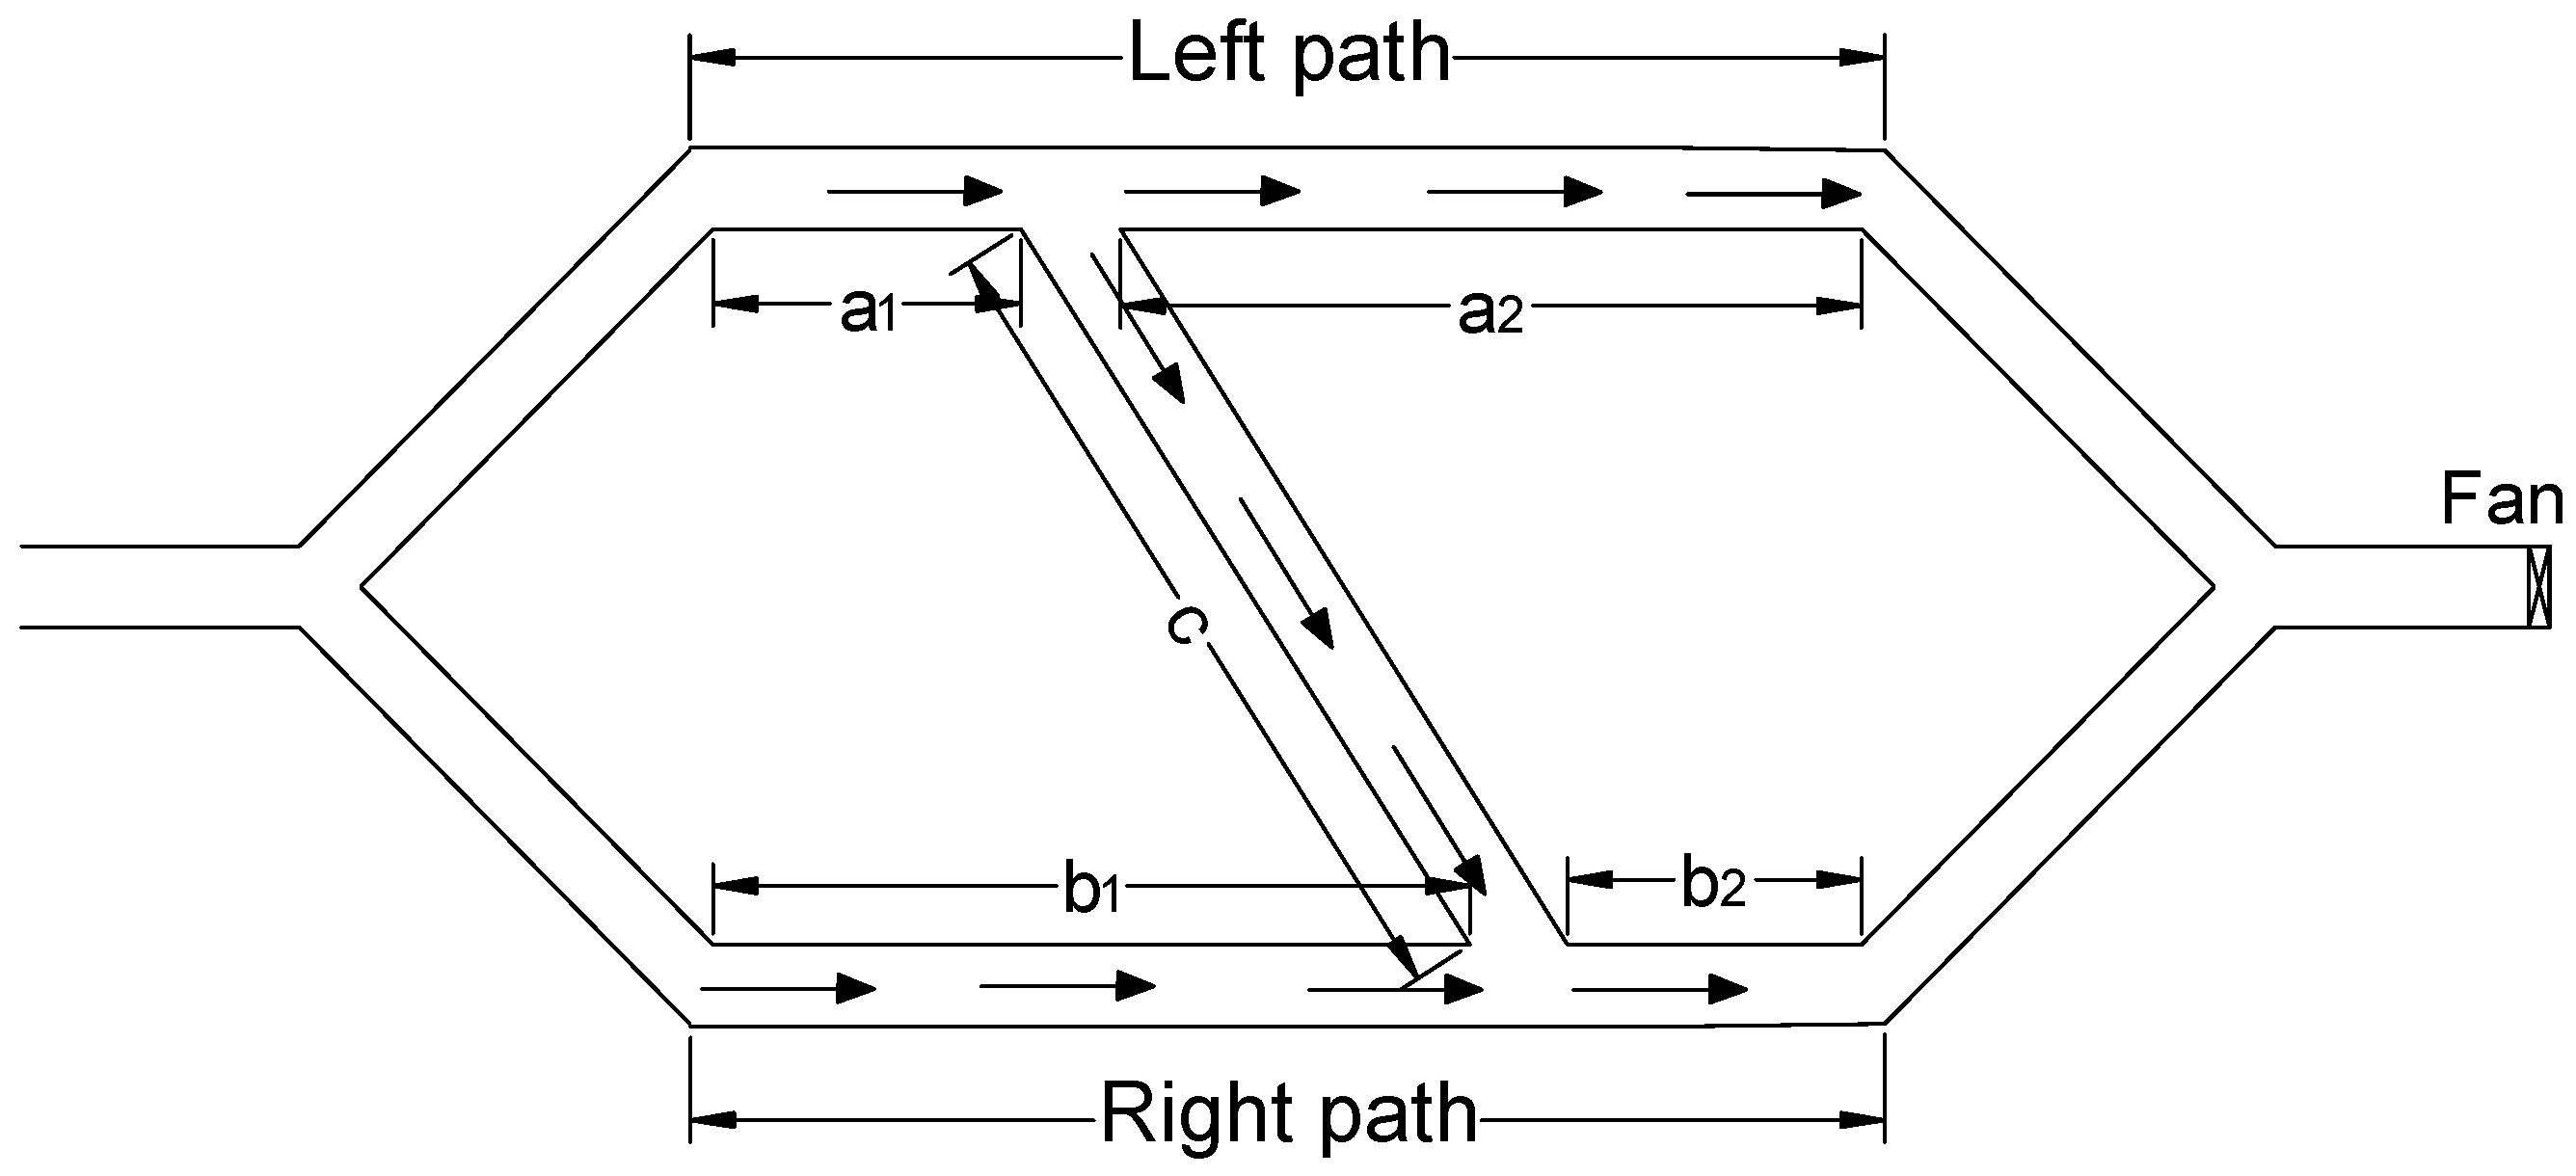
The diagonal pipe network model is shown in
Figure 1; the cross-section of the roadway is 3.0 m × 3.0 m. The inner wall of the roadway is made of concrete. The density is 2280.0 kg/m
3. The specific heat is set to a constant of 1.04 kJ/(kg K), and the thermal conductivity is 1.8 W/(m K). Most of the mines in China use extraction ventilation, so the outlet airflow is set on the model’s right side. Combustible debris, such as wood, is often stacked in the diagonal branch, and the ventilation is poor, so the fire source is set in the center of the diagonal branch P
D. The whole model is placed horizontally without an inclination angle, composed of left path P
L, right path P
R, diagonal branch P
D, left correlation point L, and right correlation point R.
As shown in
Figure 2, the measuring points are arranged successively on the ceiling of the roadway along the direction of fresh air flow, and the distance between measuring points is 1.25 m. The height of the measuring point is 2.9 m. There were 47 measuring points in left path P
L and right path P
R and 40 measuring points in diagonal branch P
D. As shown in
Figure 3, thermocouples and layer zone monitoring points are placed at each measuring point to monitor the changes in ceiling temperature and smoke layer height, respectively.
FDS (Fire Dynamic Simulator) numerical simulation software was used to explore the related laws of smoke spread and ceiling temperature attenuation in diagonal branches and left and right channels under different wind speed conditions. The FDS version is 5.5.3. The research shows that when the characteristic diameter of the fire source is 4–16 times the grid size, the simulation results′ accuracy can meet the research needs [
21]. The calculation of fire source diameter can be expressed as:
Q is the heat release rate, kW; is the density of incoming air, kg/m3; is the constant pressure-specific heat capacity of the incoming air, J/(kgK); is the ambient temperature, K; and g is gravity acceleration, m/s2. Since the model is large and the structure is complex, the grid size is set to 0.2 × 0.2 × 0.2 m3, considering the calculation speed and accuracy.
According to GB 51251-2017 “Technical Standard for Building smoke Prevention and exhaust system”, the fire scale in the aisle is about 1.5 MW, so the heat source is set to increase to 1.5 MW in 60 s. The combustion reaction is polyurethane, and the smoke generation coefficient is 0.1. According to the requirements of “Coal mine safety regulations”, the wind speed of a rock roadway is within the range of 0.15~4 m/s, and the intake and return air roadway in the mining area is less than 6 m/s. As shown in
Table 1, The wind speed at the return air is set as an independent variable, and the actual working conditions of the mine are simulated as 1 m/s, 1.5 m/s, 2 m/s, 3 m/s, 4 m/s, and 5 m/s, respectively. When calculating the backflow distance, the outlet wind speed is set to 2.8 m/s, and the heat release rate is set to 1 MW, 1.5 MW, 2 MW, 2.5 MW, and 3 MW. The large eddy simulation (LES) calculates the model [
22].
4. Results
This section may be divided into subheadings. It should provide a concise and precise description of the experimental results, their interpretation, and the experimental conclusions that can be drawn.
4.1. Analysis of the Attenuation Law of Smoke Temperature in Diagonal Branch
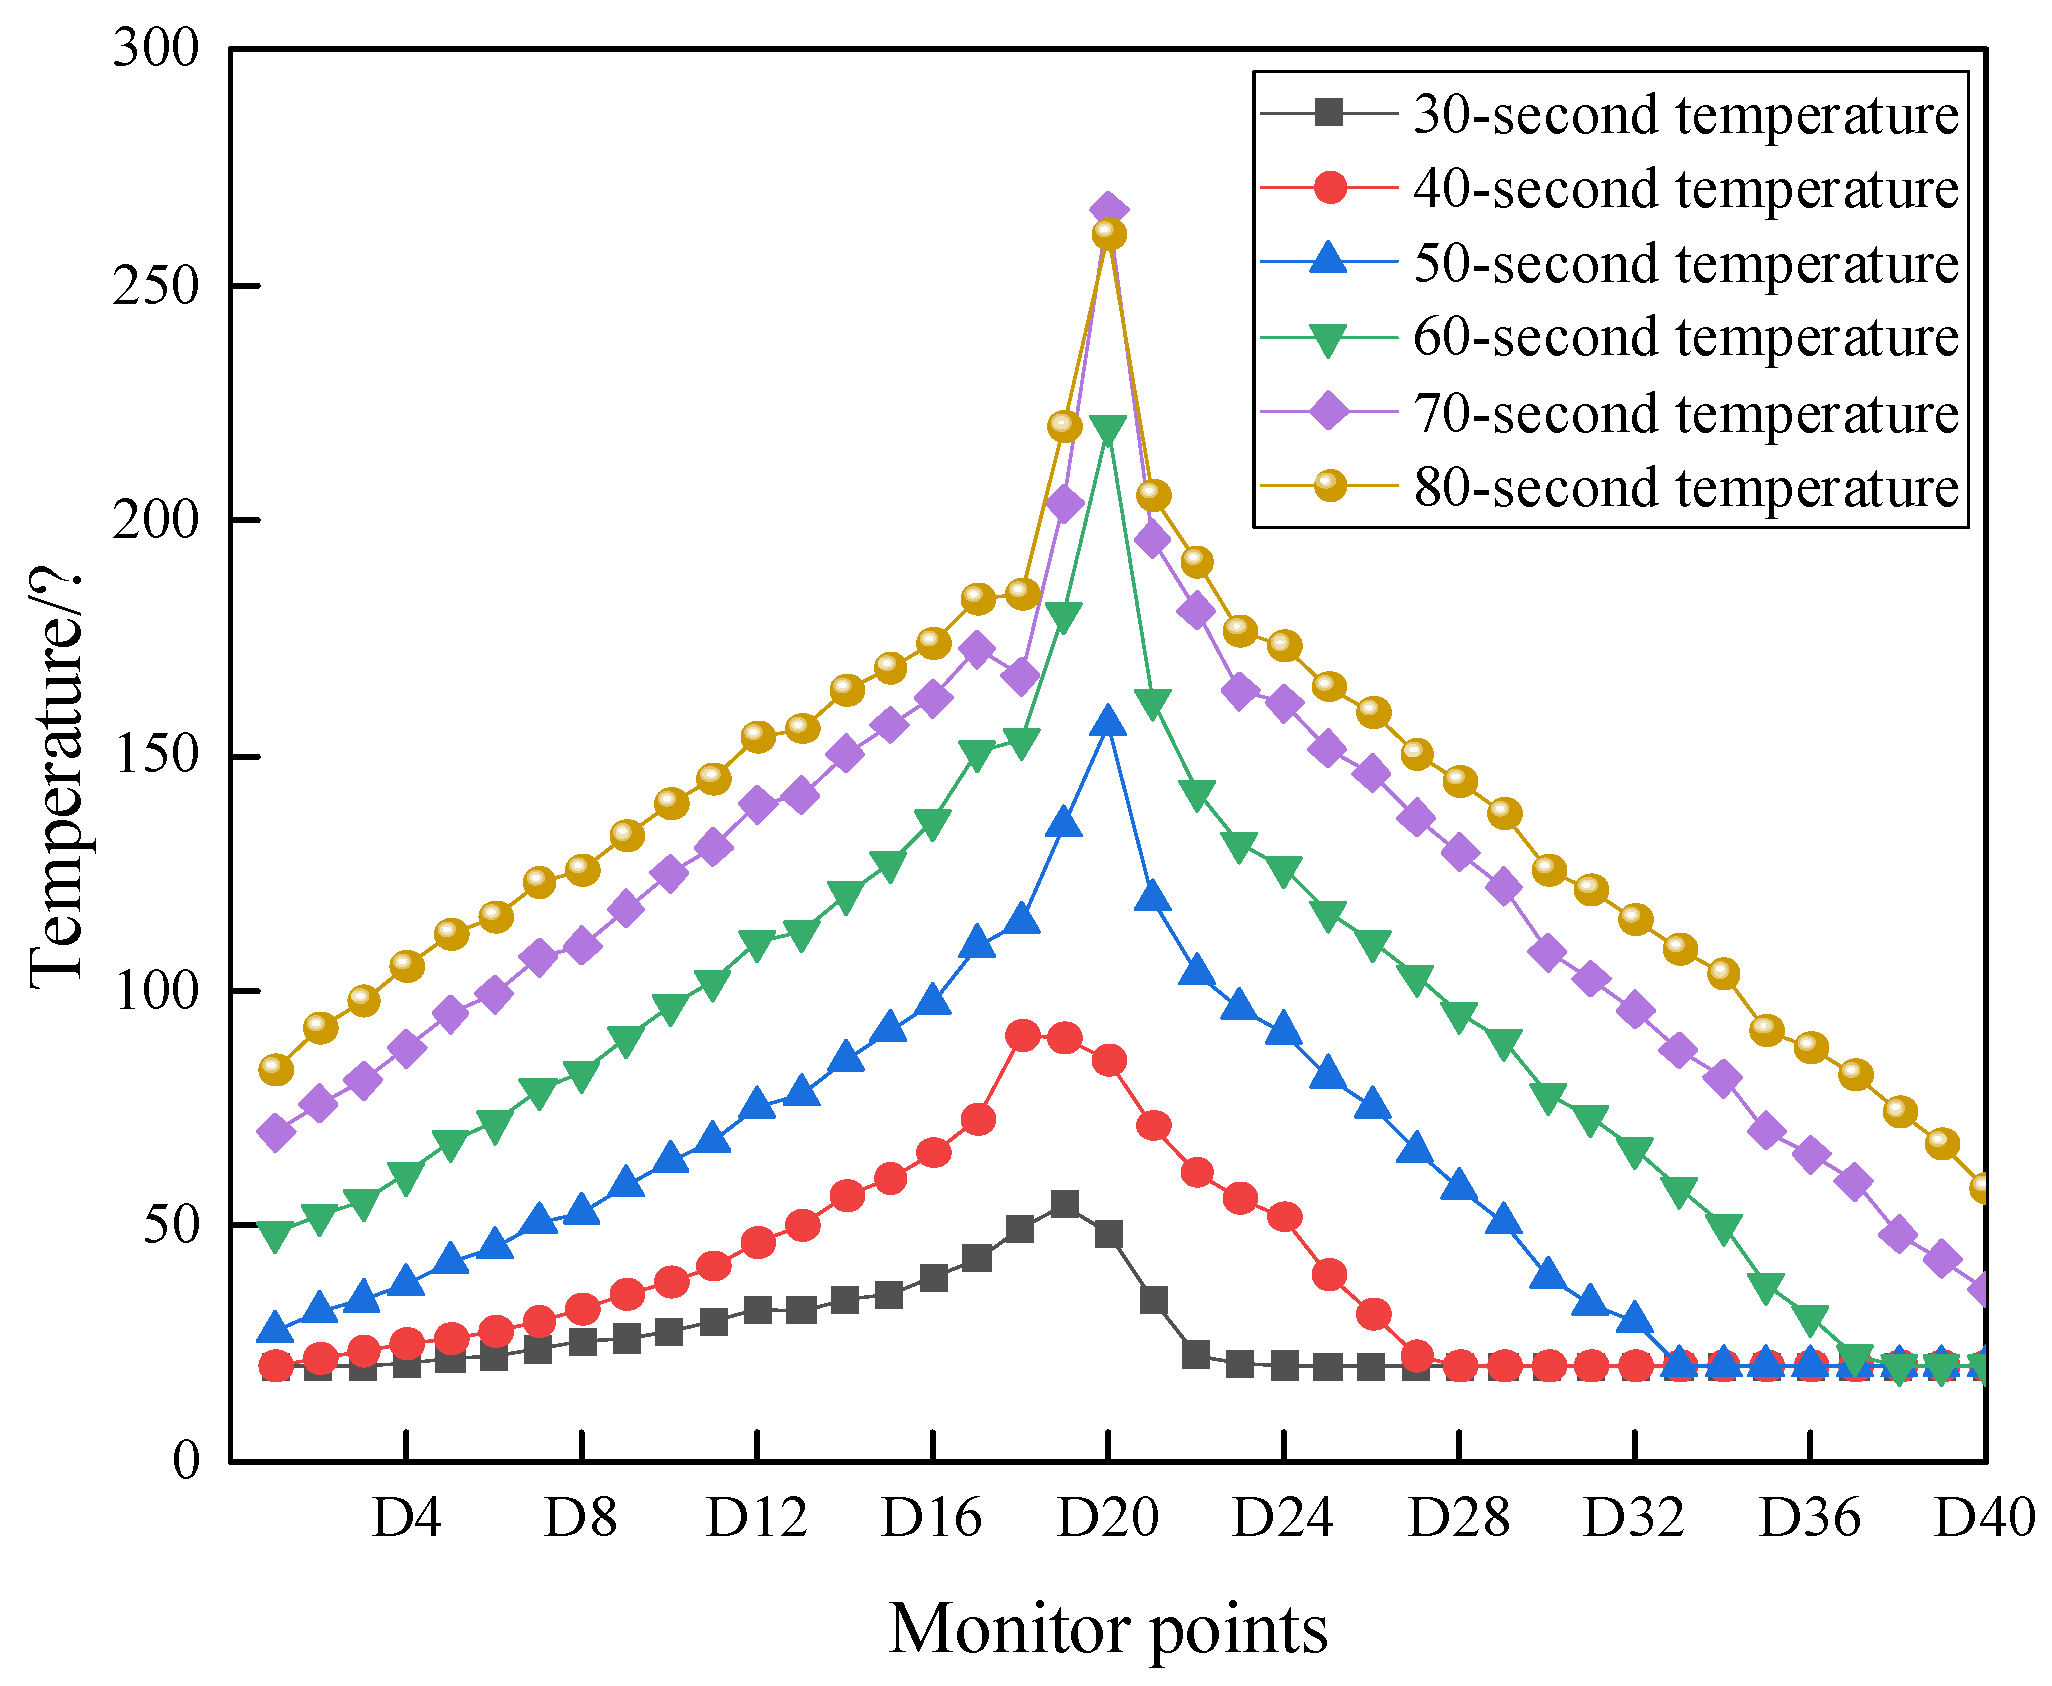
As shown in
Figure 4 and
Figure 5, at different stages of fire development, the ceiling temperature distribution in the diagonal branch shows a trend of “high in the center and low on both sides”, and the area of “low on both sides” shows an exponential trend with the increase in the distance from the fire source.
At 30 s, the fire is in the early stage, the heat release rate is low, and there is mechanical ventilation in the diagonal branch, which tilts the flame and speeds up the diffusion of smoke downstream, so the highest temperature point of the roadway ceiling appears in the downstream of the fire source. Specifically, the temperature at the 19th measuring point is the highest, which is 0.5 m downstream of the fire source, the temperature at the 20th and 21st measuring points is the second, and the temperature upstream of the fire source is the lowest, which remains the same at room temperature. At 40 s, the heat release rate and the smoke concentration increase, the smoke continues to spread downstream because of forced ventilation, and the highest point shifts from 19 to 18. The heat release rate of the fire source reaches the maximum during 50~60 s, the heat balance has not been formed among the inner wall of the roadway, and high-temperature smoke, cold air, and a large amount of heat accumulate, which makes the temperature of the roadway roof rise rapidly. At the same time, smoke retrogression occurred in the diagonal branch, the ventilation power was weakened, and the highest temperature returned to point 20 directly above the fire source.
At 70 s and 80 s, the maximum temperature point and the overall temperature trend clearly did not change. At this time, the temperature attenuation trend in the diagonal branch shows a better exponential attenuation trend because the thermal radiation loss of smoke flow is related to its temperature; the higher the temperature, the greater the thermal radiation loss, and the faster the temperature attenuation rate.
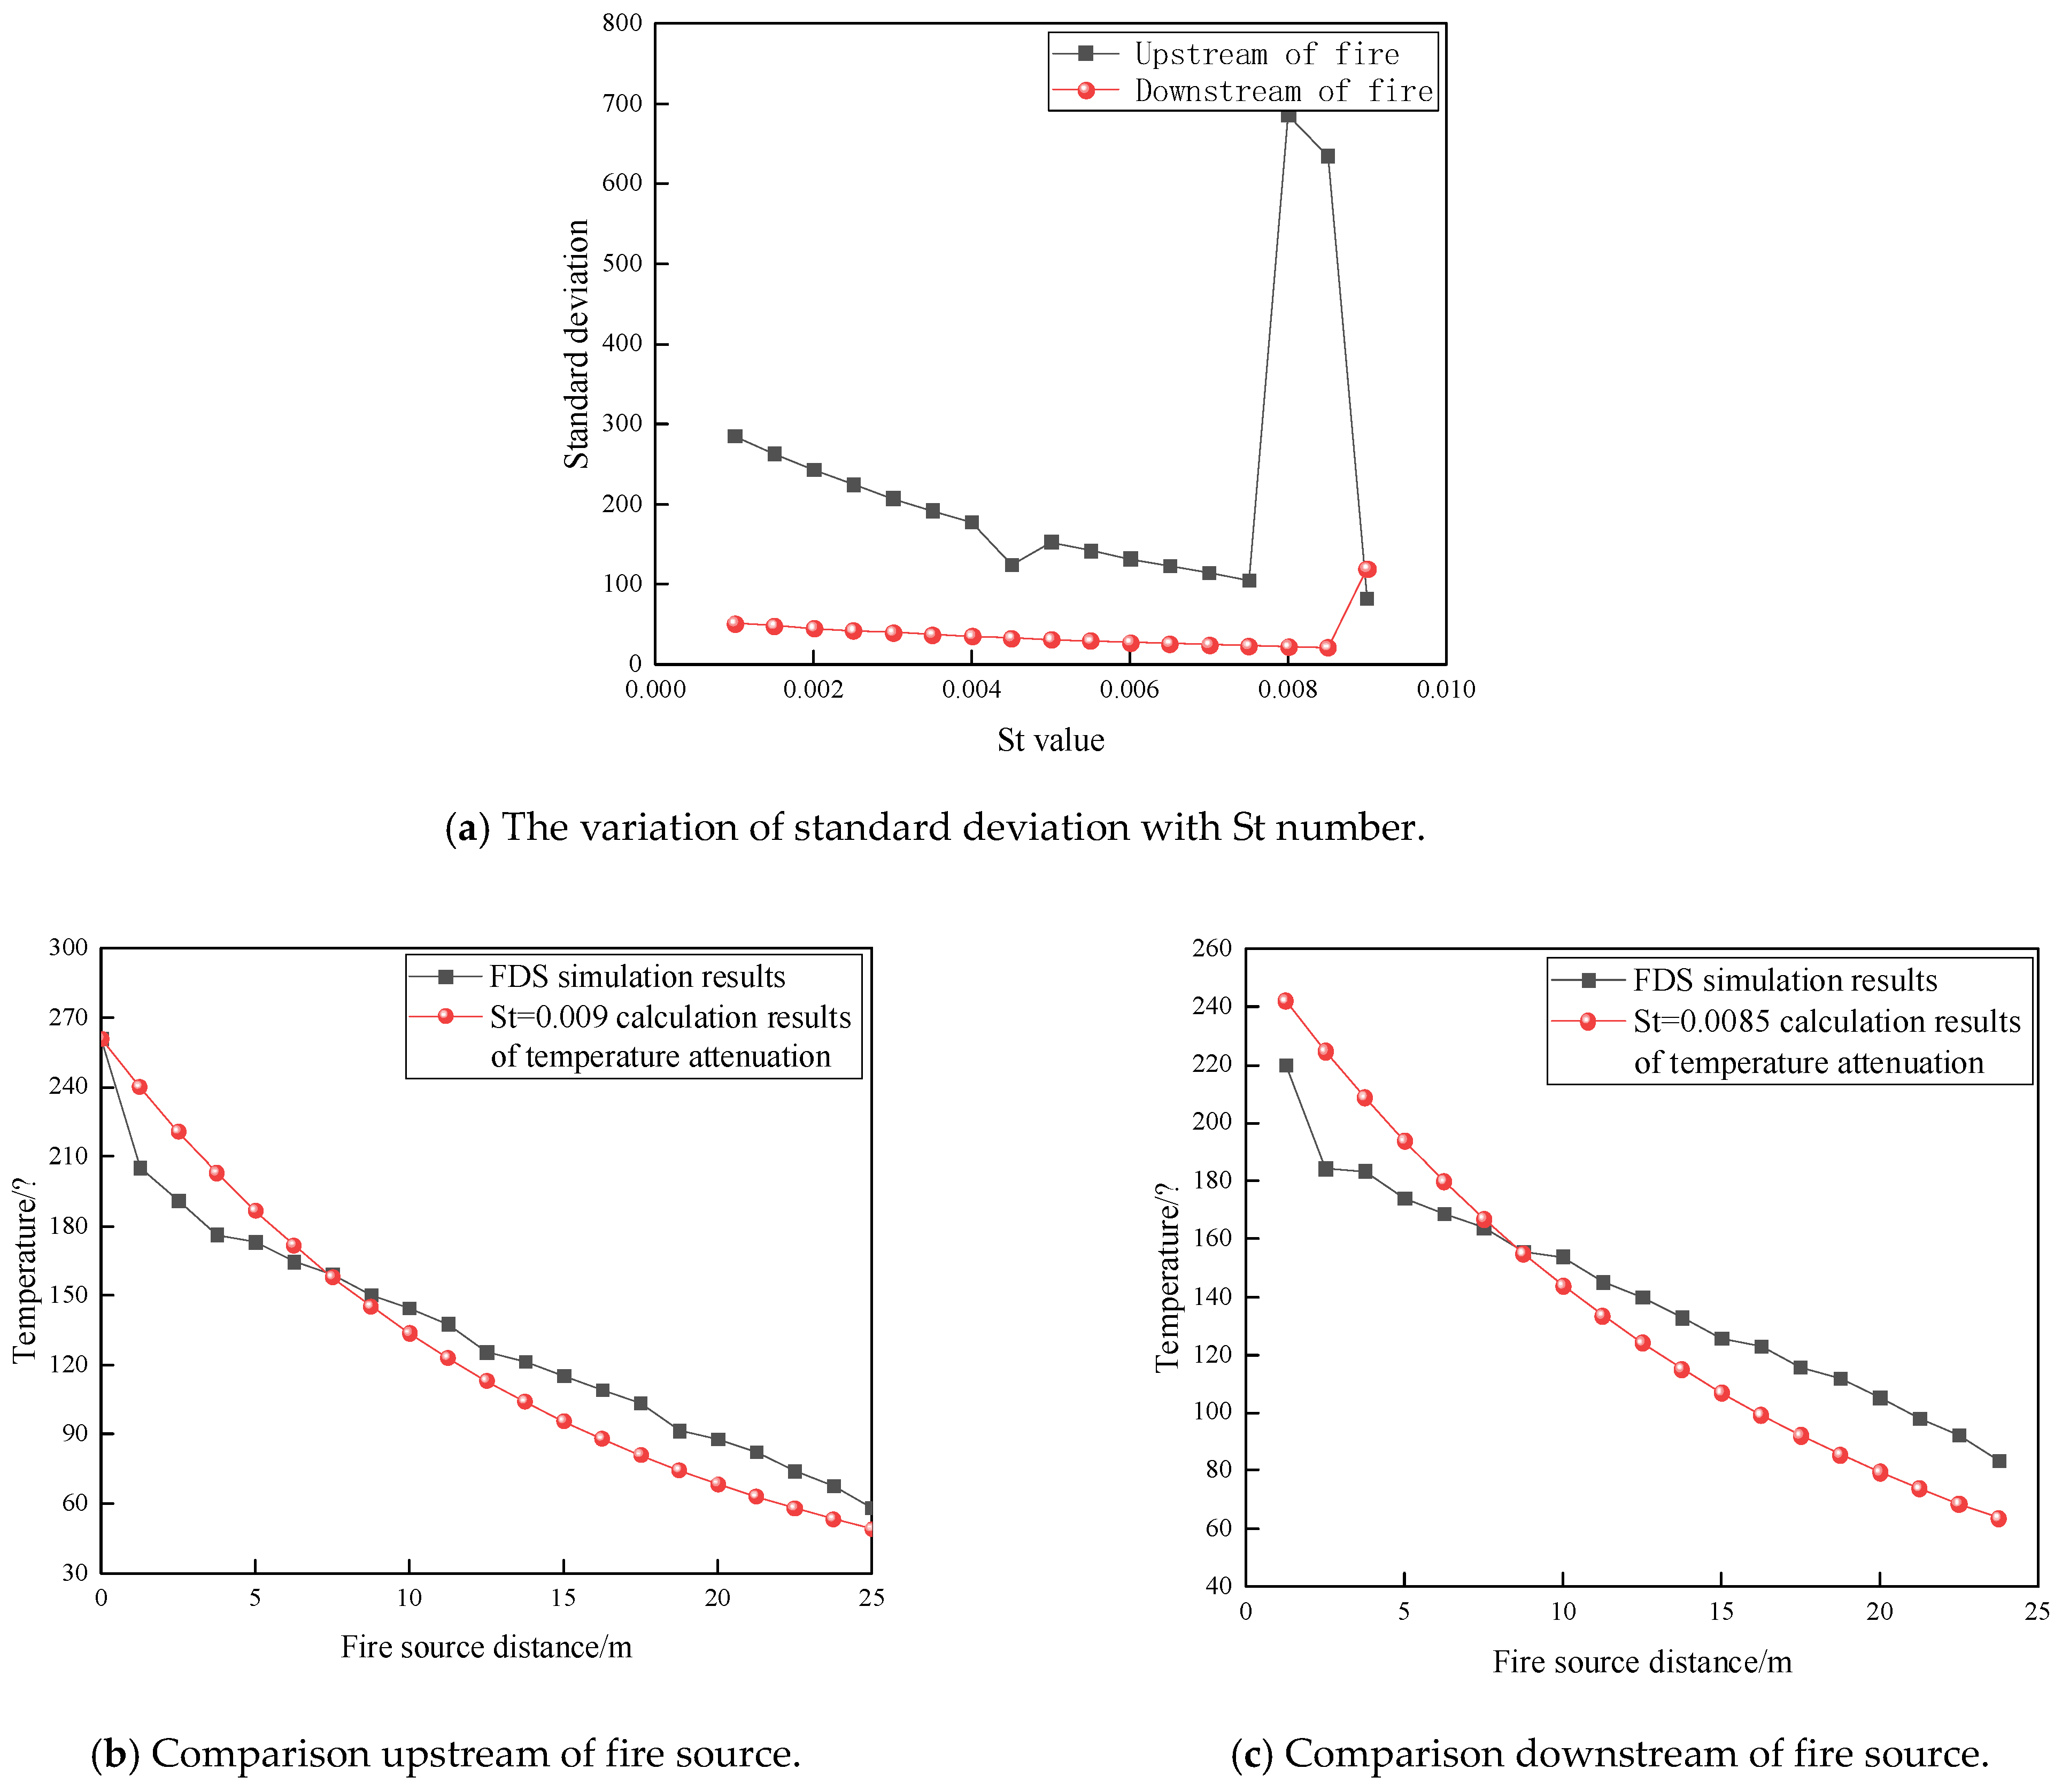
Now the temperature attenuation trend in the diagonal branch is analyzed based on Equation (10). As shown in
Figure 6, according to the previous research, the St value is optimized in the range of 0.001–0.009, based on the standard deviation between the temperature values obtained by numerical simulation and the values calculated by the mode [
23]. The smaller the standard deviation, the more consistent the attenuation model. The similarity between the simulated value and the calculated value is the highest in the St = 0.009 upstream of the fire source, and the standard deviation is 82.3 in the St = 0.0085 downstream of the fire source. It can be considered that the upstream and downstream temperature attenuation trends of the highest temperature rise point are well in line with the temperature attenuation model given by previous research. In the diagonal branch, it can be considered that the characteristics of the convective heat transfer coefficient, fluid density, and specific heat of the fluid are the same upstream and downstream of the fire source. In contrast, the velocity of smoke upstream of the fire source is lower than that in the downstream, so the St value in the upstream of the fire source is more significant than that downstream.
4.2. Analysis of the Attenuation Law of Smoke Temperature in the Left and Right Paths
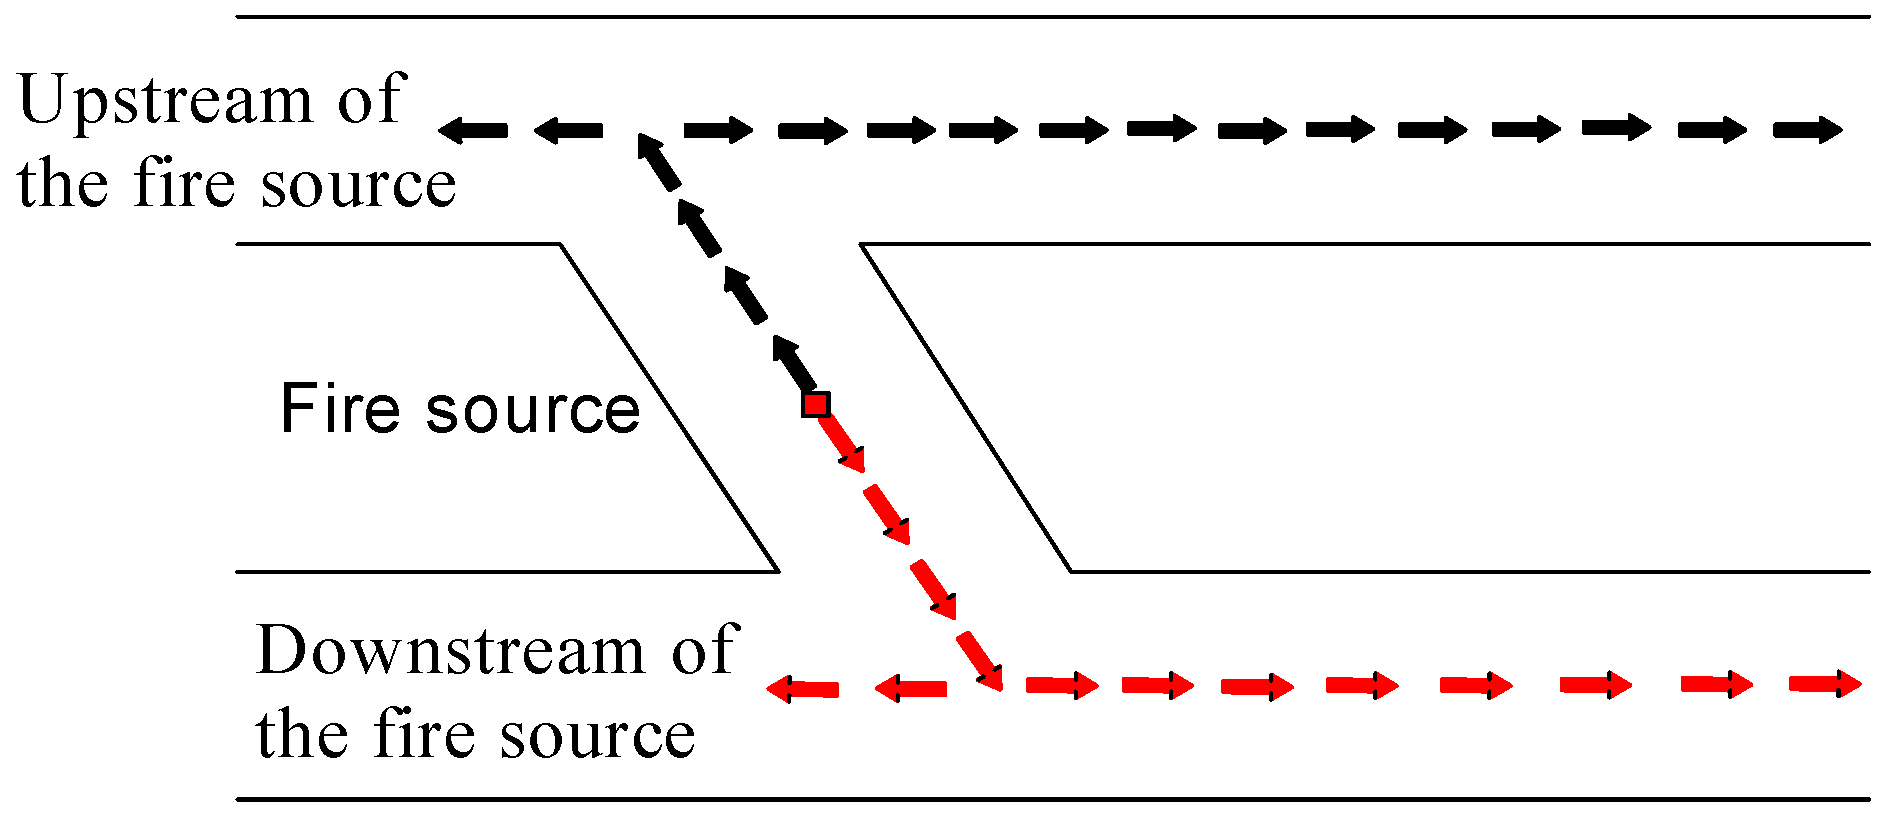
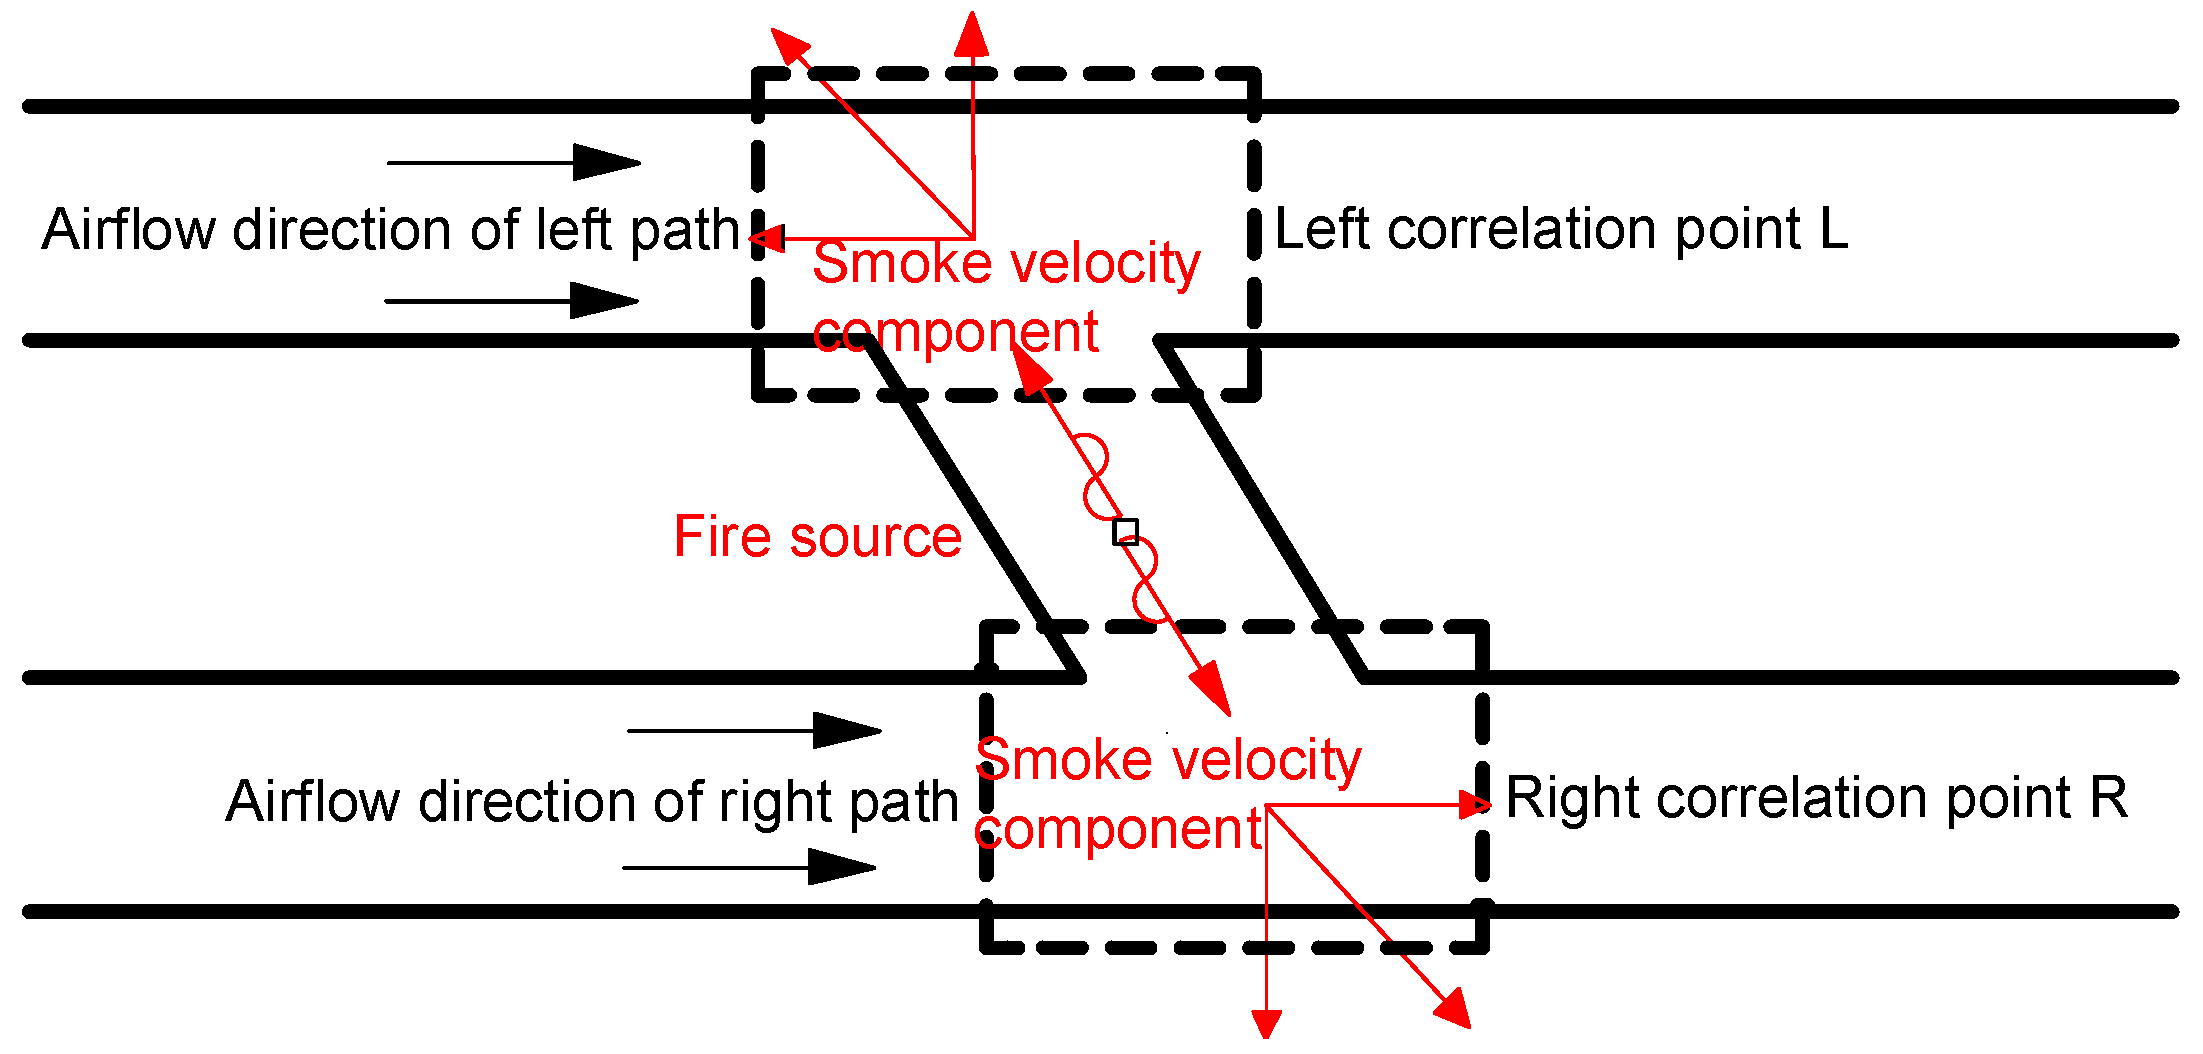
The trend of temperature attenuation in the passageway at about 120 s is analyzed, and the research position is shown in
Figure 7. It is divided into two research lines: the upstream of the fire source and the downstream of the fire source. The first line is shown by the black arrow upstream of the fire source, and the second is shown by the red arrow downstream of the fire source.
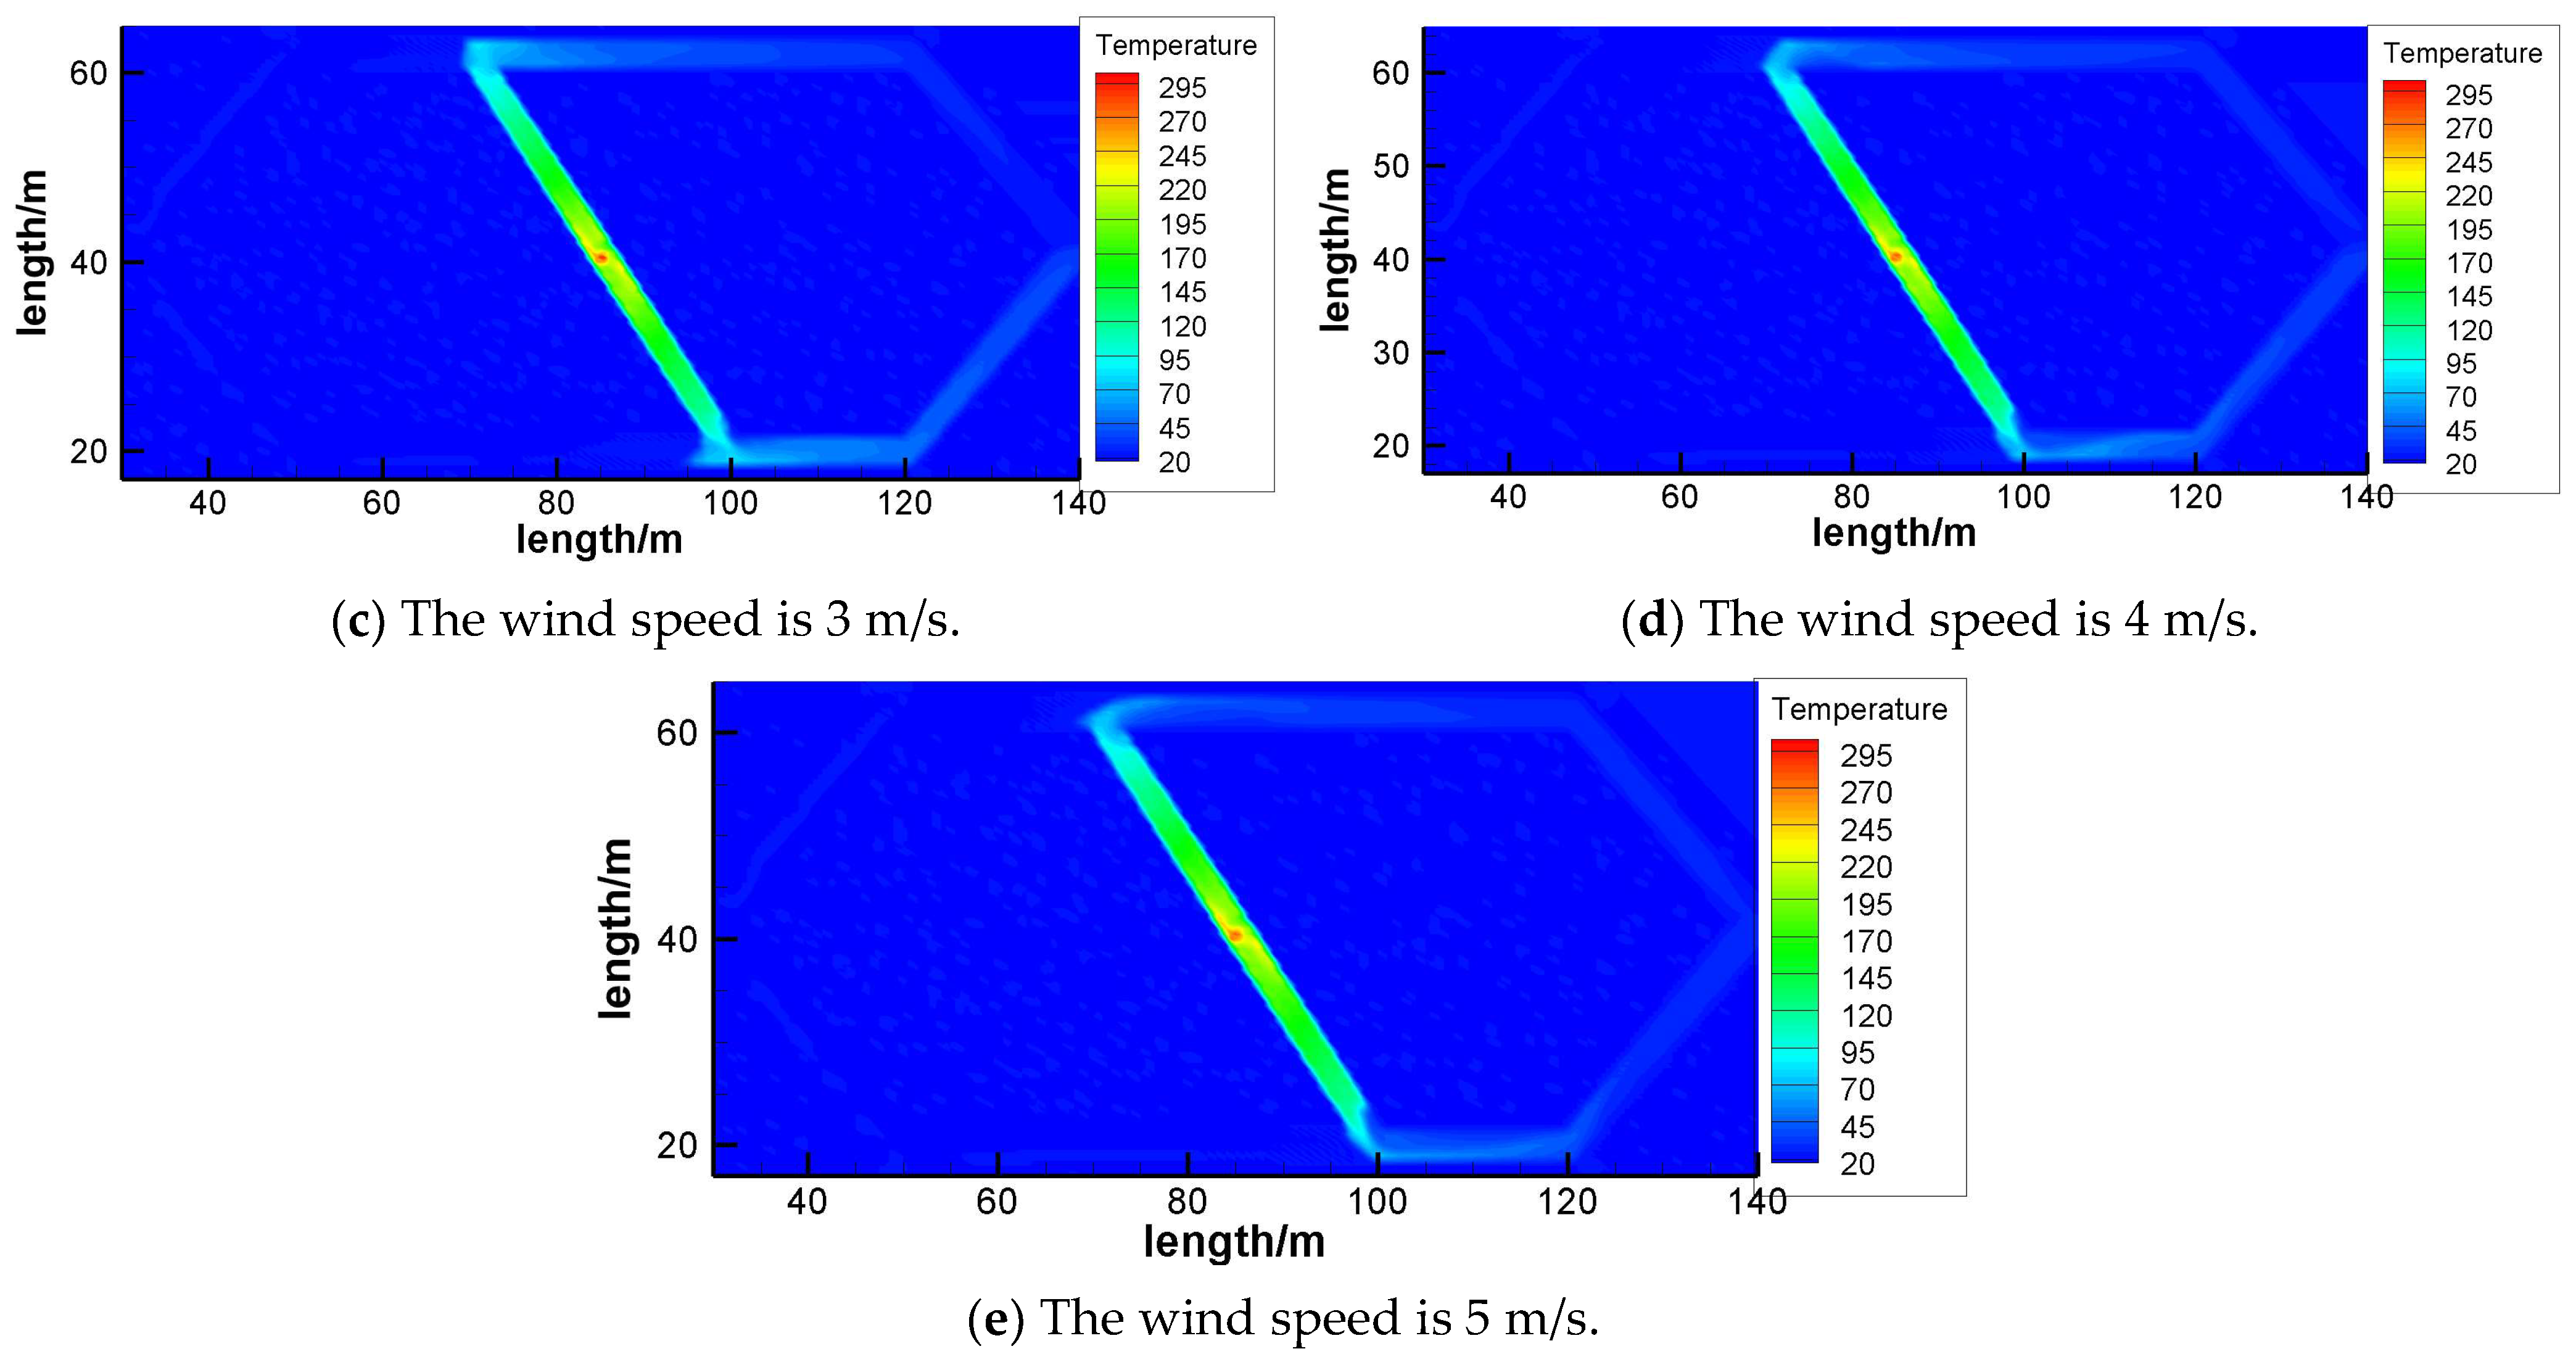
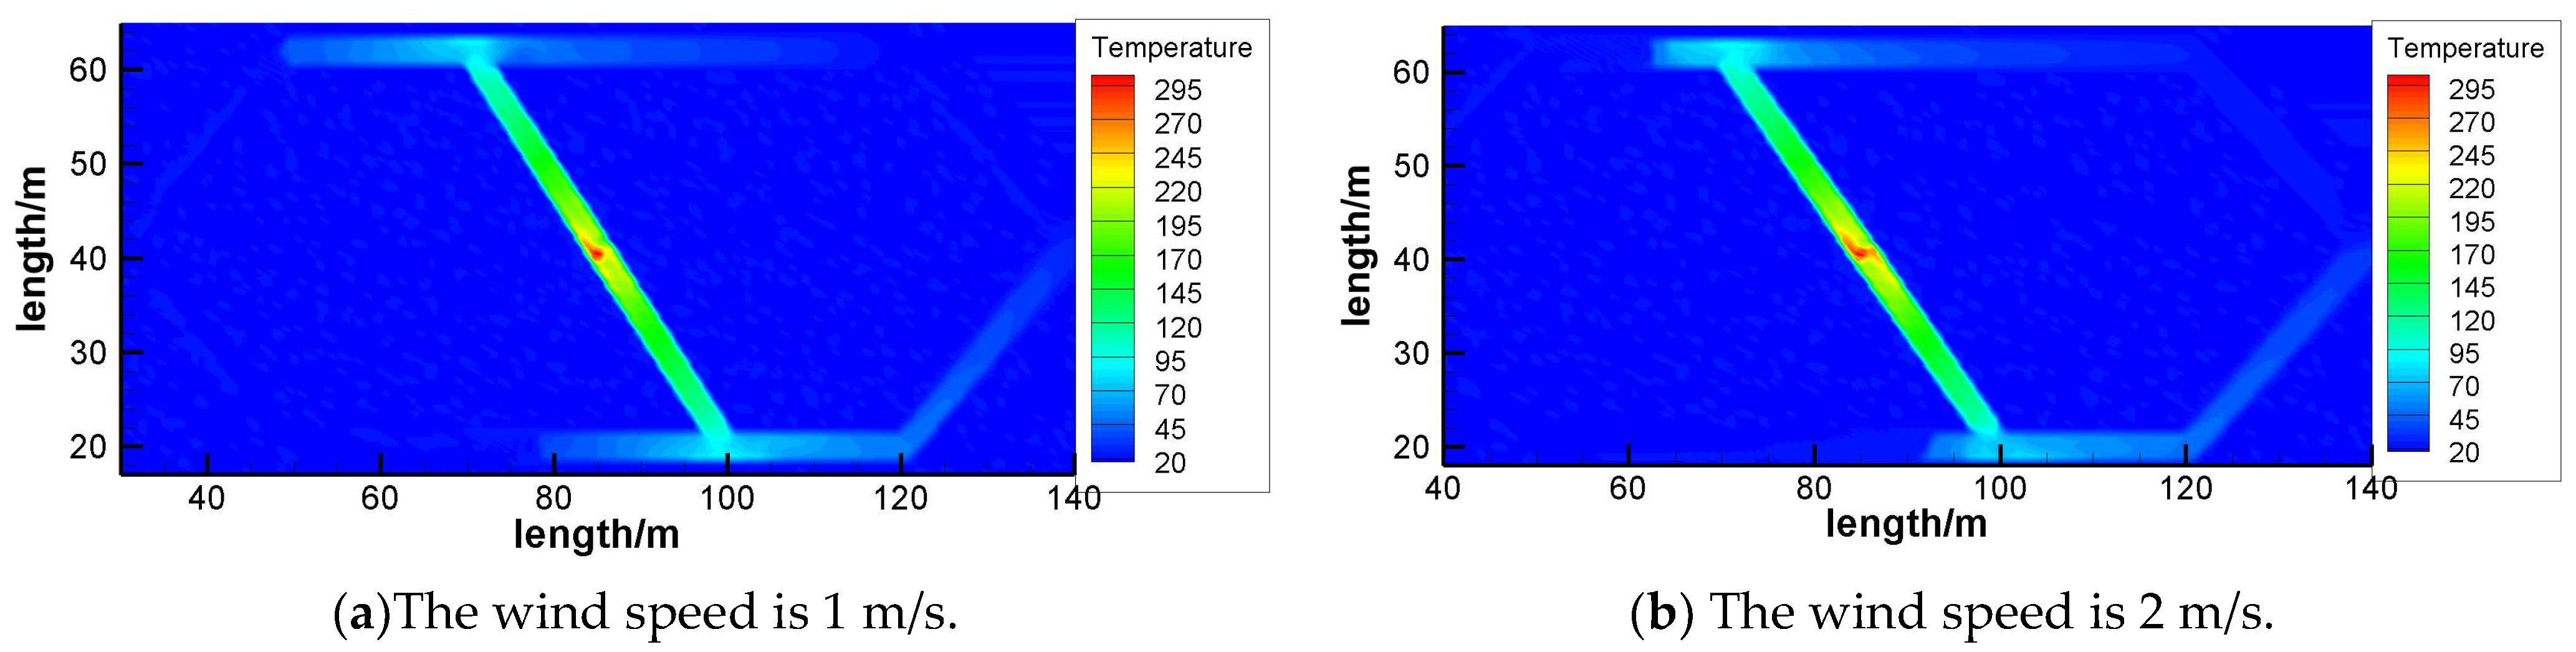
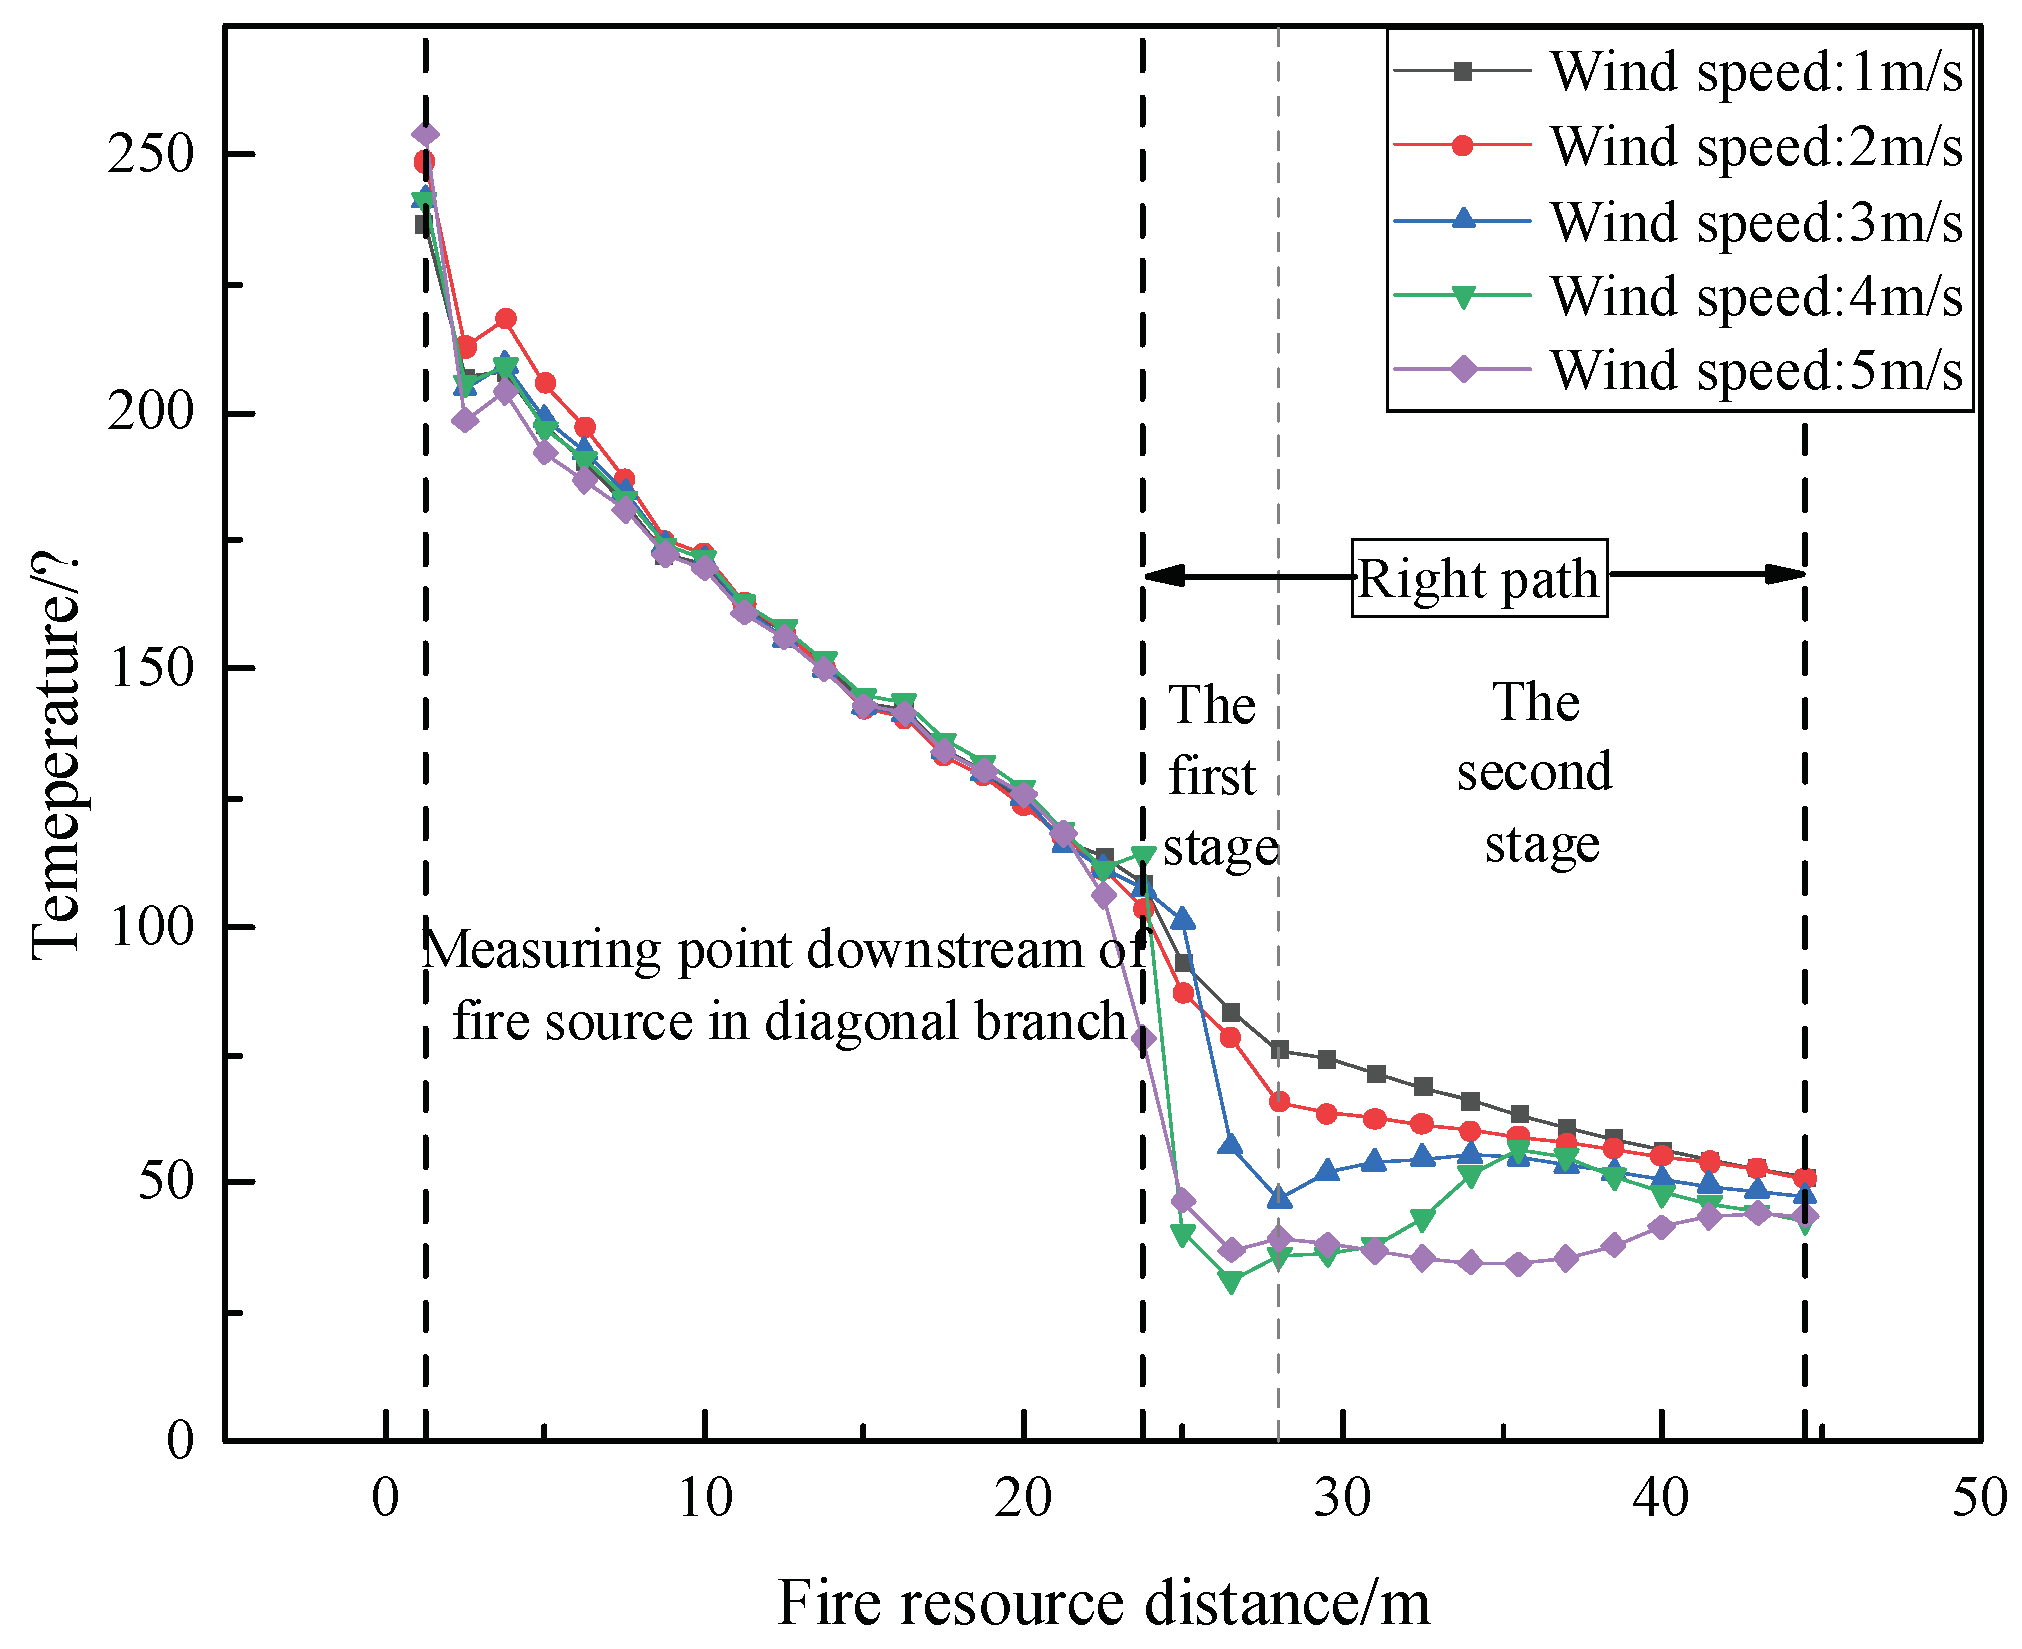
Figure 8 shows the ceiling temperature distribution in the left and right paths when the wind speed is 1 m/s, 2 m/s, 3 m/s, 4 m/s, and 5 m/s. It can be seen from (a) and (b) that when the wind speed is 1 m/s and 2 m/s, the high-temperature smoke moves to both sides after coming out of the diagonal branch, and the high-temperature range is asymmetrically distributed on both sides of the left and right correlation points. The range is smaller in the high-temperature region upstream of the correlation point (red region, the same below) and larger in the downstream high-temperature airflow region. The temperature on both sides of the left and right correlation points tends to decrease with the change in distance, and the length of the heating region of the left path is smaller than that of the right path.
From (c) and (d), it can be seen that when the wind speed is 3 m/s and 4 m/s, the high-temperature smoke moves in the direction of wind flow after coming out of the diagonal branch, and the high-temperature area in the left and right channel is downstream of the correlation point. The high-temperature range is more extensive than that of 1 m/s and 2 m/s. In addition to the high-temperature range, the overall heating area is also longer, and the heating area of the left and right paths is close to the return air position.
As can be seen from (e), when the wind speed is 5 m/s, the high-temperature area of the ceiling in the right roadway appears to be a “filamentous” feature, and the high-temperature area downstream of the right correlation point shows the clear non-uniform distribution in the cross-section of the roadway. This is because, under high-speed airflow, the high-temperature smoke flow shows an unstable flow state, and its fluidity is poor near both sides of the wall due to viscous resistance. The high-temperature smoke flow is mainly concentrated in the middle of the cross-section of the roadway. As a result, the temperature in the center of the cross-section of the roadway is significantly increased.
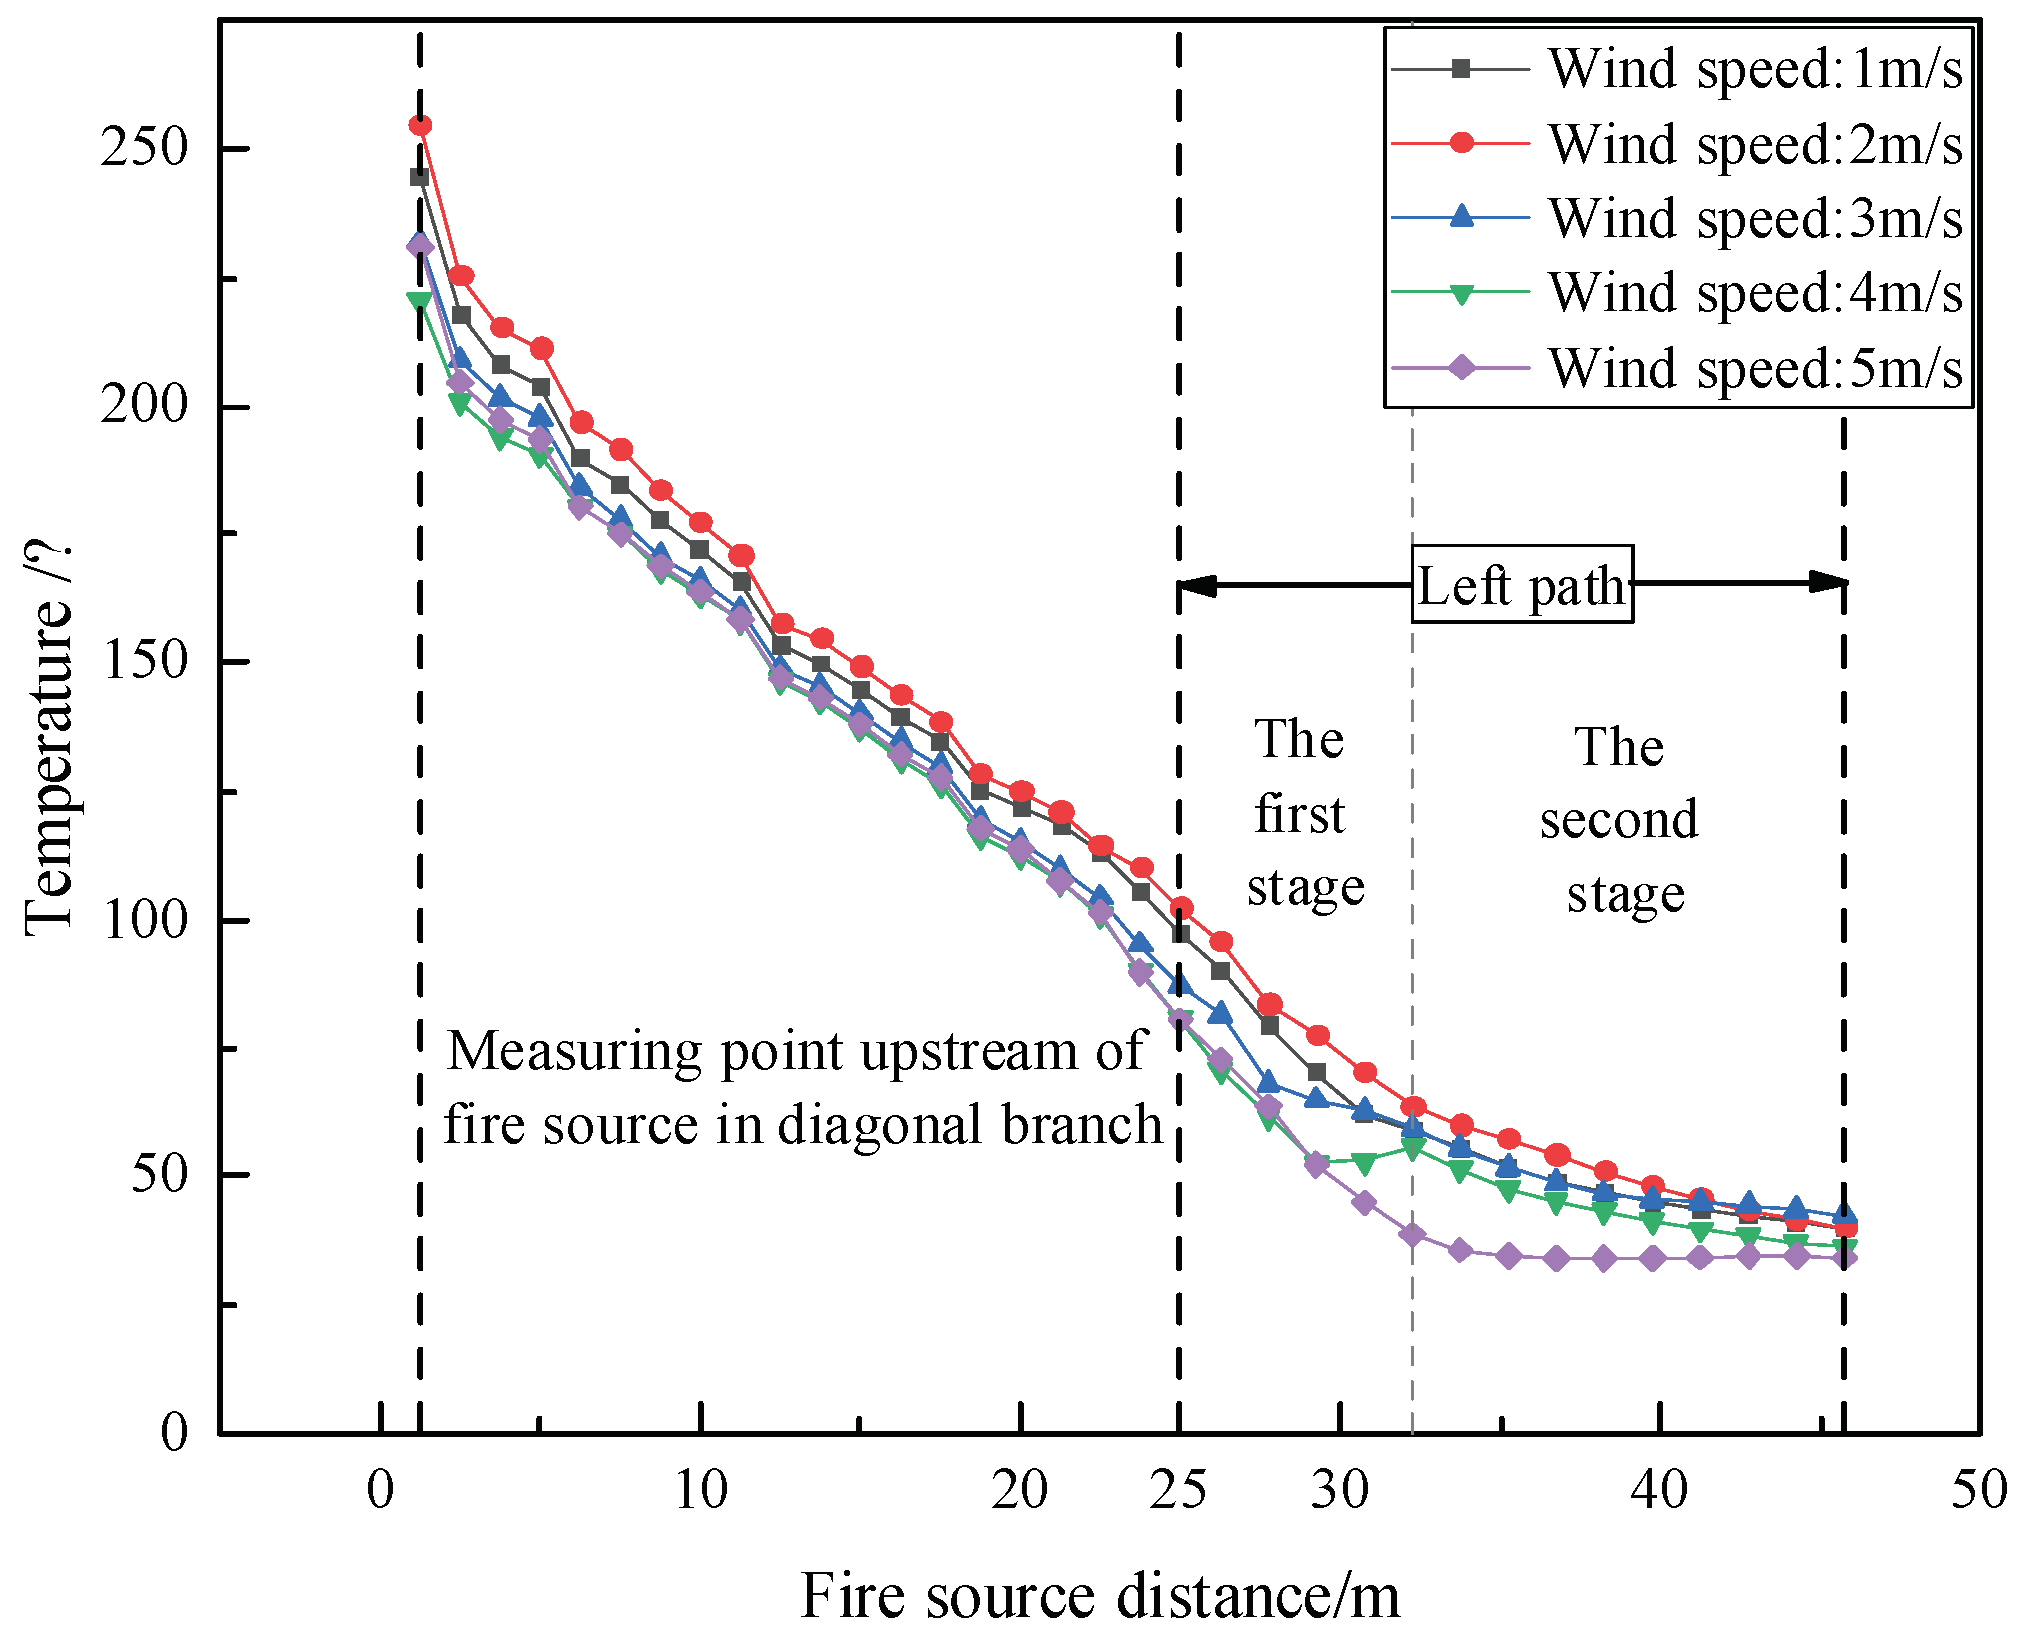
As shown in
Figure 9, the temperature of the measuring point upstream of the fire source in the diagonal branch attenuates exponentially. The smoke flow goes through two stages after it flows out of the diagonal branch. In the first stage, the temperature decreases rapidly and unevenly; this stage has passed about six measuring points. For example, when the wind speed is 3 m/s, the first stage is entered when the distance from the fire source is 25 m, the temperature attenuation rate is faster at the distance of 25–27.75 m, and the linear slope is about −9.6. At the distance of 27.75–32.25 m, the linear slope is about 2.7. In the second stage, the temperature decreases slowly and evenly, which goes through about nine measuring points. Among them, the attenuation rate is similar when the wind speed is 1 m/s, 2 m/s, 3 m/s, and 4 m/s, the linear slope is about −1.4, and the temperature attenuation rate is the smallest when the wind speed is 5 m/s. The linear slope is about −0.06, which tends to be flat.
As shown in
Figure 10, downstream of the fire source, the high-temperature smoke flow also goes through two stages after it flows out of the diagonal branch. In the first stage, the temperature decreases significantly, the temperature rises when the wind speed is high, and this stage goes through about four measuring points. Among them, the temperature drop gradient is more significant when the wind speed is 1 m/s, 2 m/s, and 3 m/s, while the temperature rises again when the wind speed is 5 m/s. When the wind speed is 5 m/s, the smoke flow enters the first stage at a distance of 23.75 m; when the temperature is 78 °C, the temperature decreases to 37 °C at a length of 26.5 m, and the temperature begins to rise to 39 °C at a distance of 28 m. In the second stage, the trend of temperature change tends to be flat, having gone through about 11 measuring points. The overall trend is that the higher the wind speed, the lower the temperature reached in the two stages.
4.3. Optimization of the Theoretical Model of Smoke Temperature Attenuation in Left and Right Paths
From the derivation process of temperature attenuation, it can be seen that the temperature attenuation model with forced ventilation in the tunnel introduces the influence of wind speed and heat release rate. In contrast, the wind speed of each branch in the diagonal pipe network is different and changes with the development of the fire, and the change mechanism is more complex. Hence, it is difficult to derive an accurate theoretical model through the mechanism. The trend of its distribution is summarized using data fitting methods and multivariate statistics based on the temperature attenuation model of a single tunnel [
24,
25].
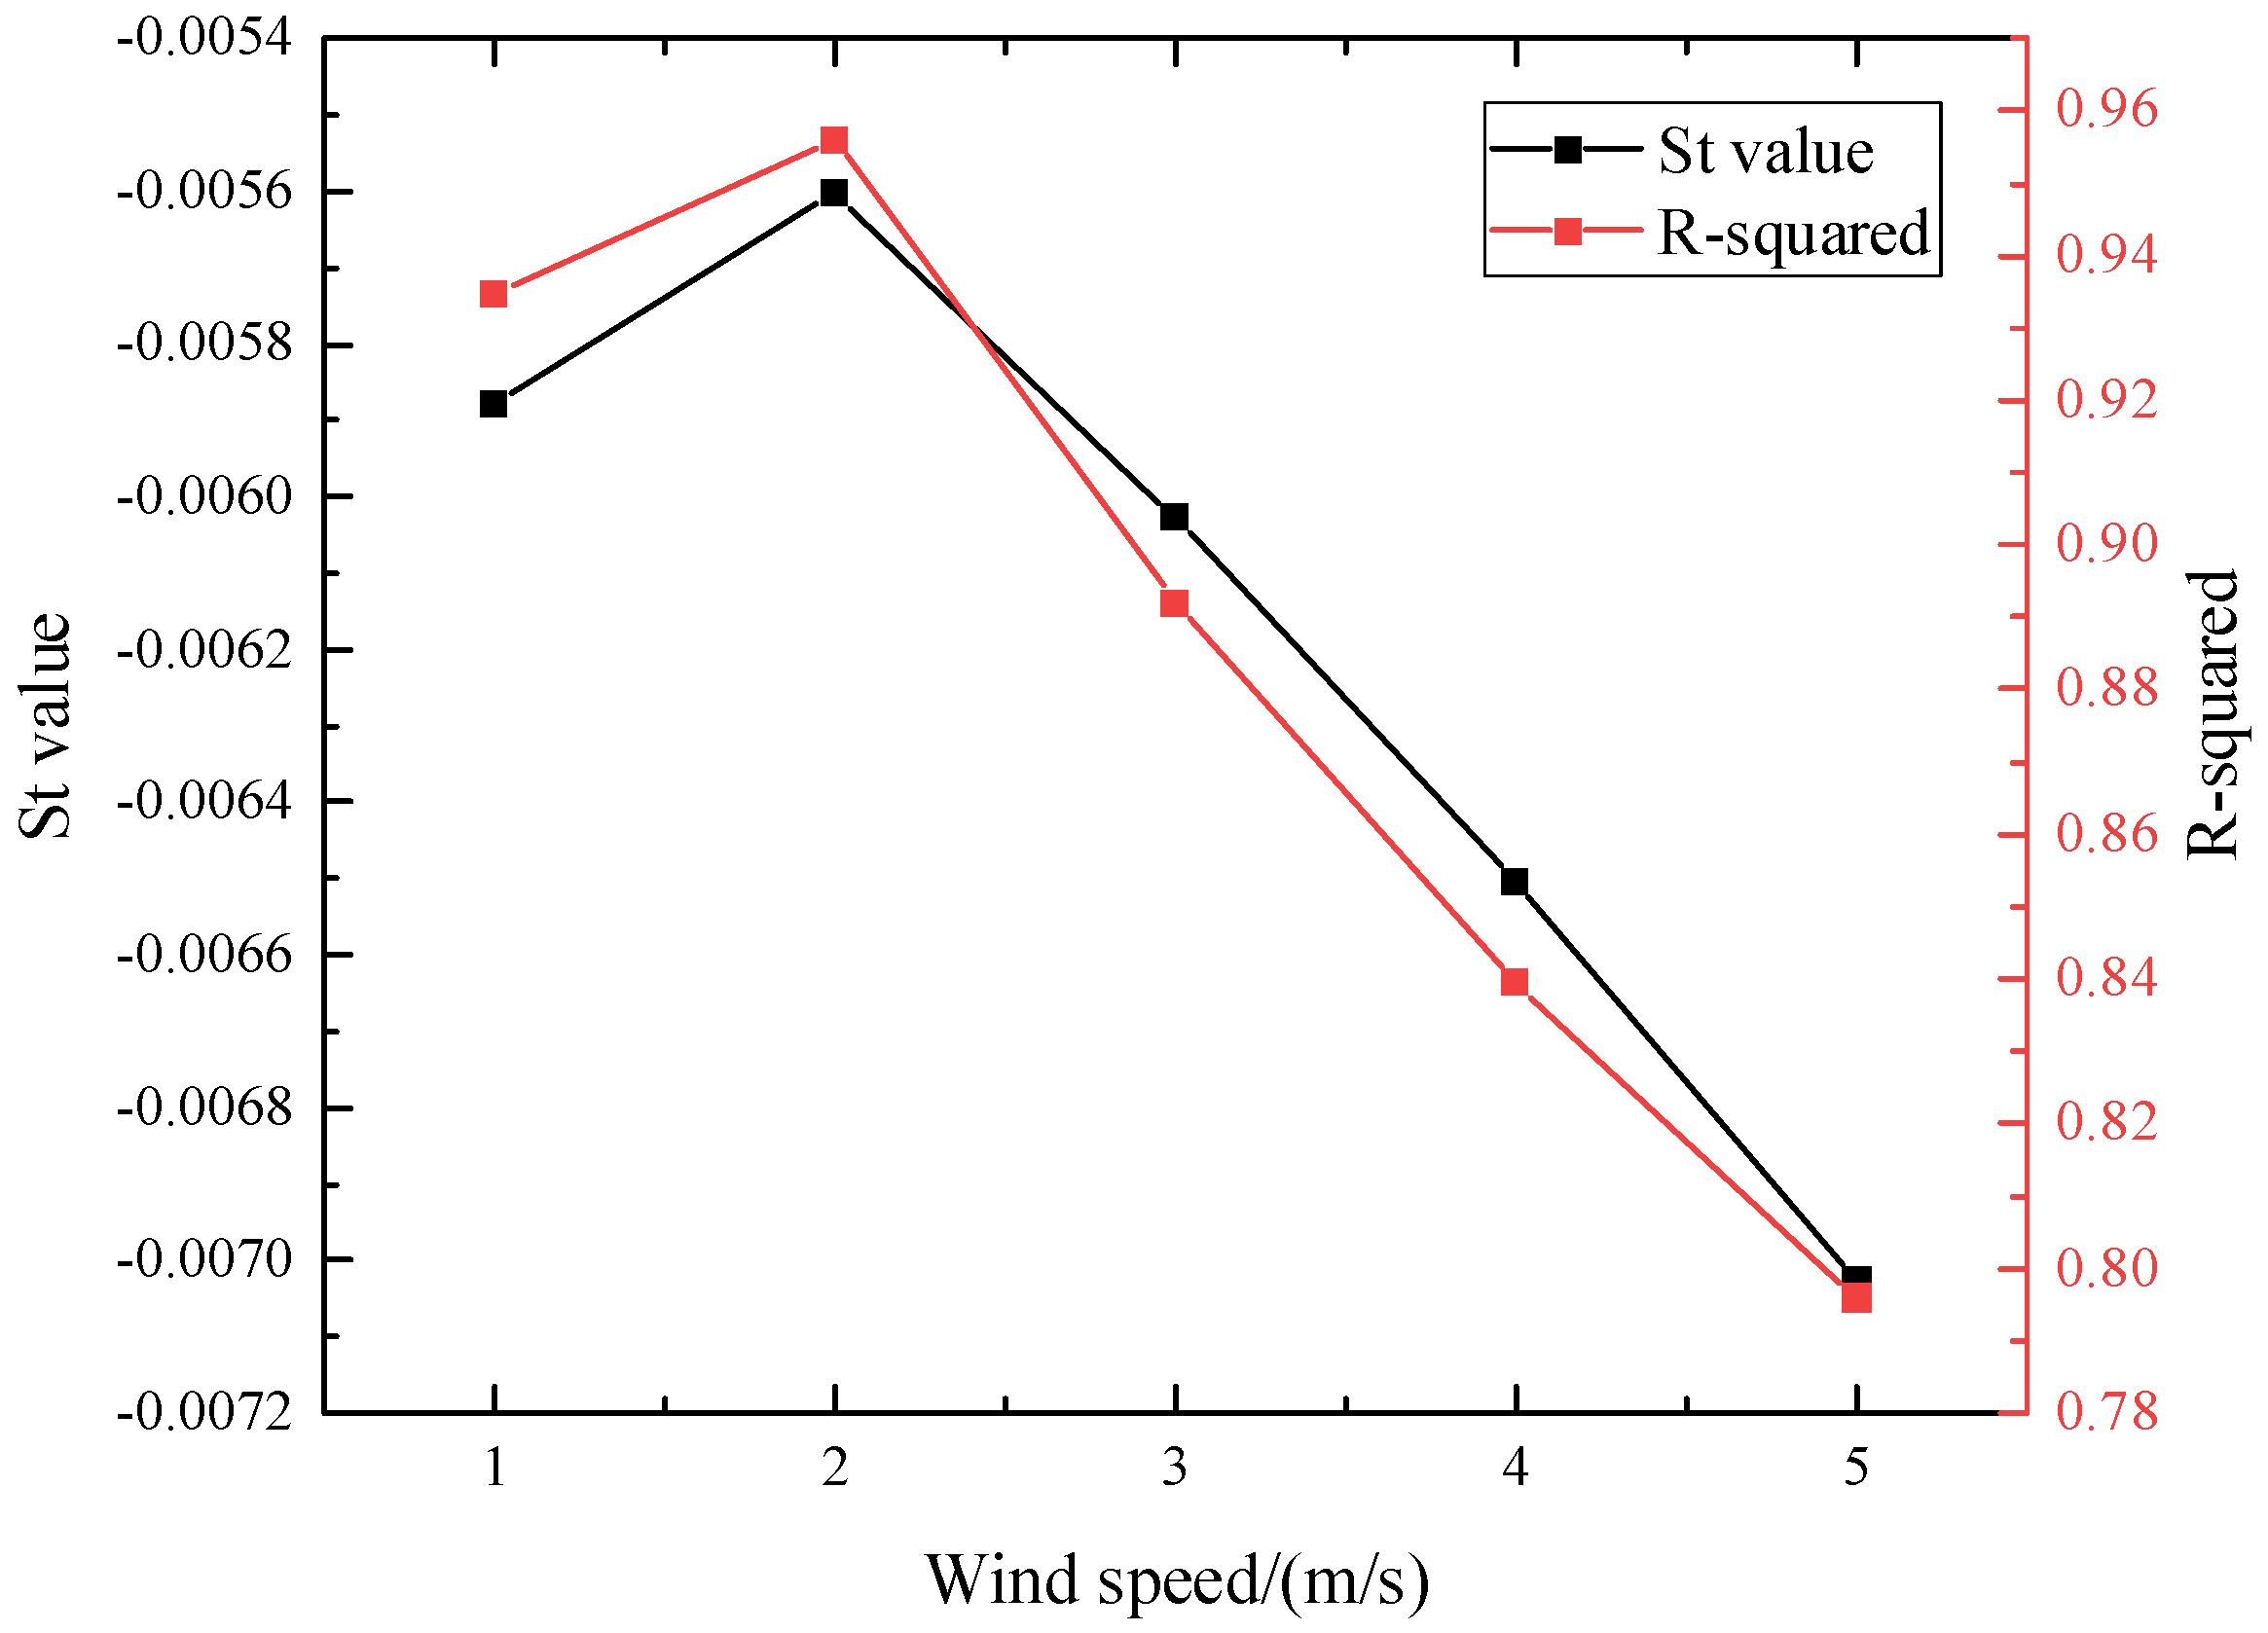
As can be seen from above, the temperature attenuation trend of the upstream and downstream of the fire source in the diagonal branch is consistent with Equation (10), and the difference lies in the magnitude of the Stanton value. As seen in
Figure 9, the temperature attenuation of the left path in the first and second stages is consistent with that in the diagonal branch, so it is considered that the original attenuation model is still used for the temperature attenuation in the left path. The optimal Stanton value is determined by using the built-in fitting algorithm of Origin; the goodness of fit is analyzed, and the result is shown in
Figure 11.
It can be seen that upstream of the fire source, the optimal St value in the temperature attenuation model is not monotonous with the wind speed. There is a positive correlation between the optimal St value and the wind speed when the wind speed is less than 2 m/s, and a negative correlation between the optimal St value and the wind speed when the wind speed is greater than 2 m/s. The maximum St value is 0.0056 when the wind speed is 2 m/s, and the minimum St value is 0.0070 when the wind speed is 5 m/s. The trend of the R square value is consistent with that of the St value; the highest R square value is 0.93 when the wind speed is 2 m/s. The simulation result is the best, and the simulation result is closest to the temperature attenuation model; when the wind speed is 5 m/s, the lowest R value is 0.80, the fitting effect is slightly worse, and the simulation results are different from the temperature attenuation model.
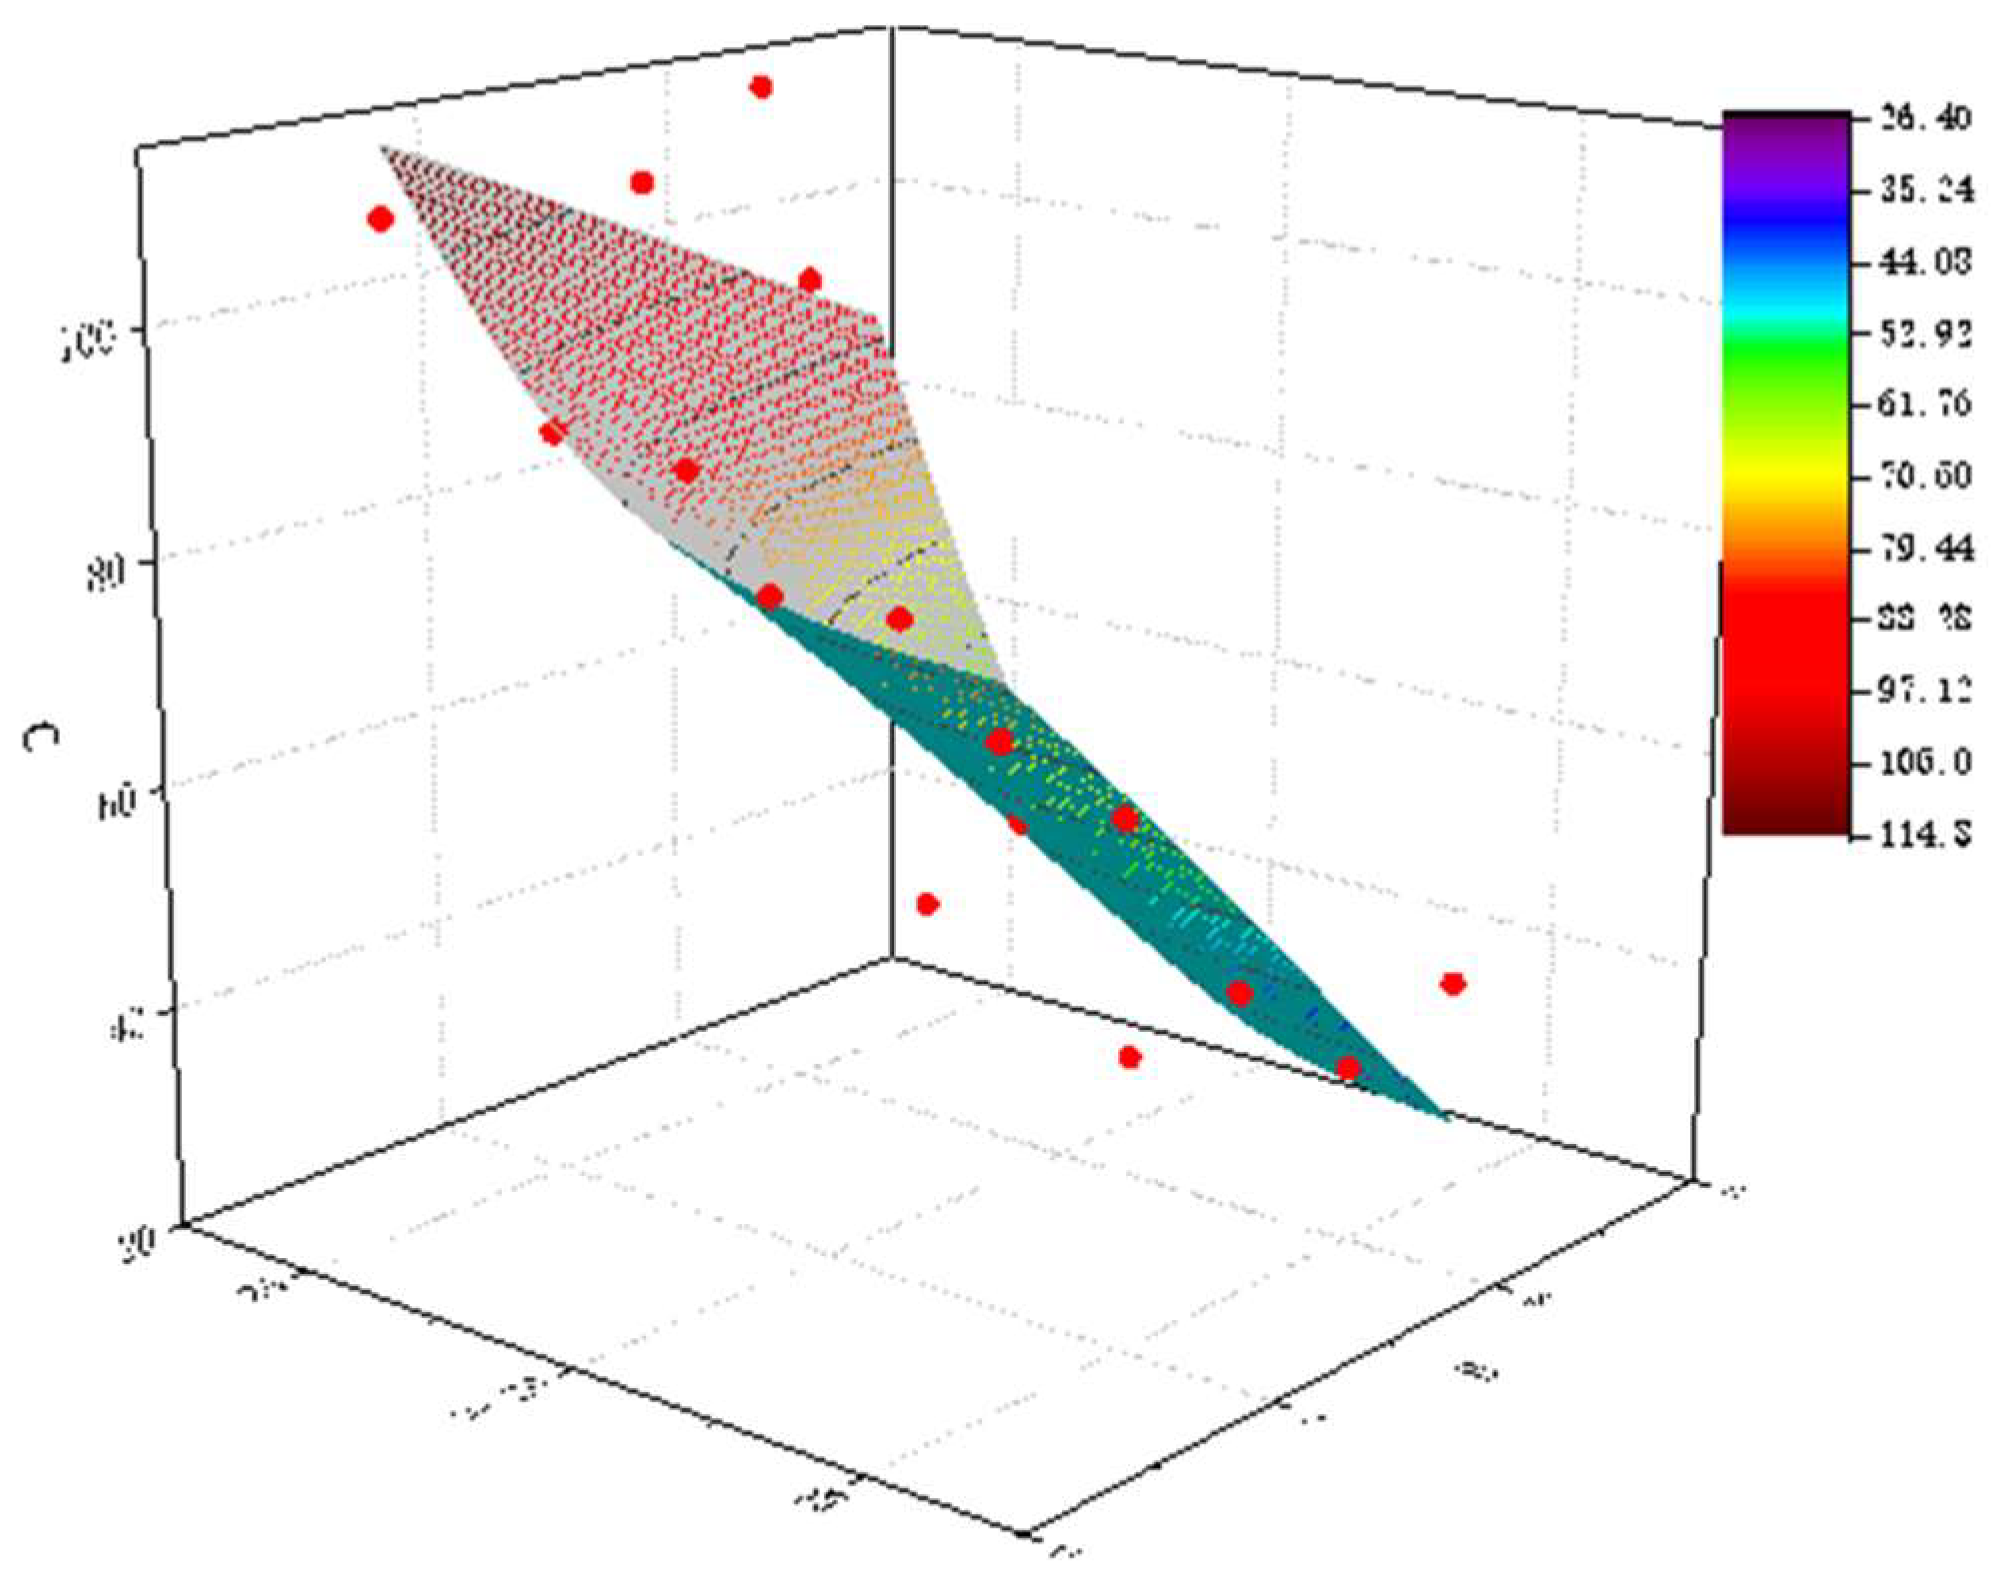
It can be seen from
Figure 10 that the temperature attenuation trend of the first stage of temperature attenuation in the right path is clearly different from that in the diagonal branch, which varies significantly with the wind speed, indicating that the temperature attenuation of the wind speed in the first stage also plays a key role. The change related to the wind speed in Equation (10) is only shown in the maximum temperature, and the effect of wind speed is not considered in the attenuation process. Therefore, the original equation cannot be used for direct analysis. Here, the nonlinear surface fitting is used to fit the three-dimensional data of wind speed, distance, and temperature, and the final fitting surface is shown in
Figure 12.
Among them, x is the distance from the fire source, m; y is the wind speed, m/s; and the fitting R square value is 0.84. It can be considered that the fitting effect is better. Although the fitting equation works well, the equation does not deal with the initial temperature well. Similar to the temperature attenuation model in the diagonal branch, the initial temperature (the maximum temperature in the diagonal branch) is crucial for the calculation of temperature attenuation. The temperature difference will determine the speed of heat conduction and to some extent determine the speed of temperature attenuation. Since the variation law of high-temperature smoke flow at the correlation point is affected by many factors and is complex, it is difficult to derive an essential temperature attenuation model. Therefore, the formula is only applicable under this model condition, and its macroscopic trend is given from the perspective of data fitting.
The temperature attenuation trend of the second stage of the right pathway is analyzed. Due to the significant difference in the initial temperature and the difficulty of three-dimensional data fitting analysis, the principal component analysis method is used to explore the influence of the initial temperature, wind speed, and distance on the temperature attenuation. The principal component analysis method converts a group of variables that may correlate with a group of linear unrelated variables through orthogonal changes. There are 60 sets of data under five wind speeds in the right pathway. The specific results are shown in
Table 2.
It can be seen that among the three factors affecting the second stage of temperature attenuation in the right path under the same fire source, the fire source distance has the most significant effect, with a percentage of the variance of 64.62%, followed by the influence of wind speed, which is 33.33%. The minimum effect of initial temperature on temperature attenuation is 2.05%. It can be seen from
Figure 10 that although the initial temperature of the second stage of the right passage varies greatly under different wind speeds, the difference in the final state temperature is small, which is the same as the conclusion of multivariate statistics, that is, the initial temperature of the second stage has little effect on temperature attenuation.
There are two reasons for the difference in the trend of temperature attenuation between the left and right roadways: the angle of the diagonal branch and the ventilation state. As shown in
Figure 13, upstream of the fire source, the angle between the diagonal branch and the left path is less than 90 degrees. At the left correlation point, the movement direction of the high-temperature smoke flow is opposite to that of the airflow, so the heat accumulation phenomenon is formed briefly at the left correlation point. Then it moves with the airflow downstream of the left path, which is equivalent to the fire source combustion under the longitudinal wind. Its essence is that the heat moves with the airflow from the gathering place. Therefore, the temperature attenuation of the left path can be approximately characterized by the temperature attenuation model in a single tunnel. Downstream of the fire source, the angle between the diagonal branch and the right path is more than 90 degrees. At the right correlation point, the movement direction of the high-temperature smoke flow is the same as that of the airflow, which destroys the original layered structure of the smoke flow and collides with the roadway structure. At this stage, the temperature attenuation is more significant and is not consistent with the original temperature attenuation model, so it cannot be characterized by the original temperature attenuation model.
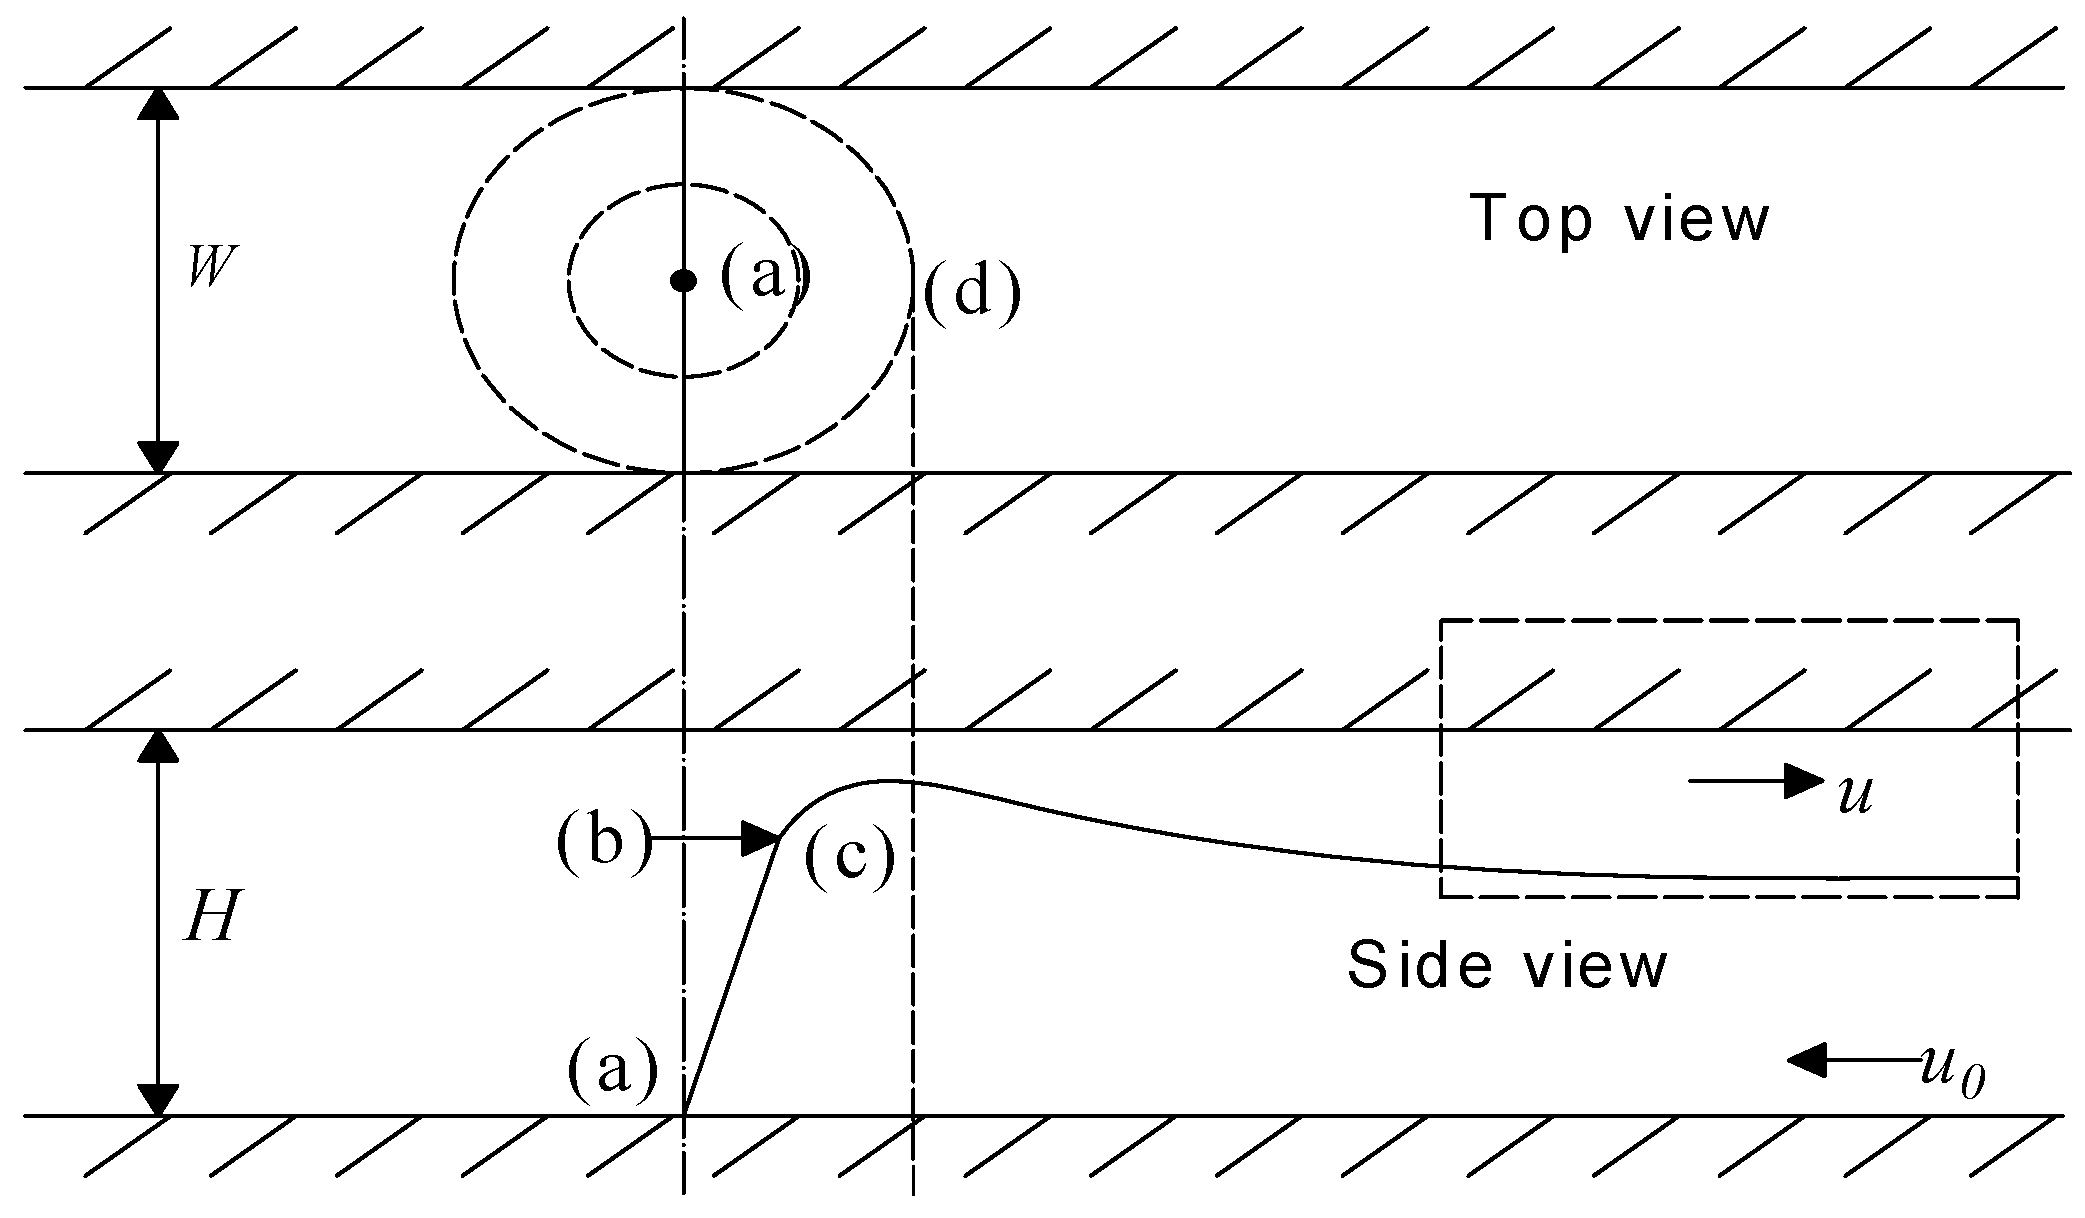
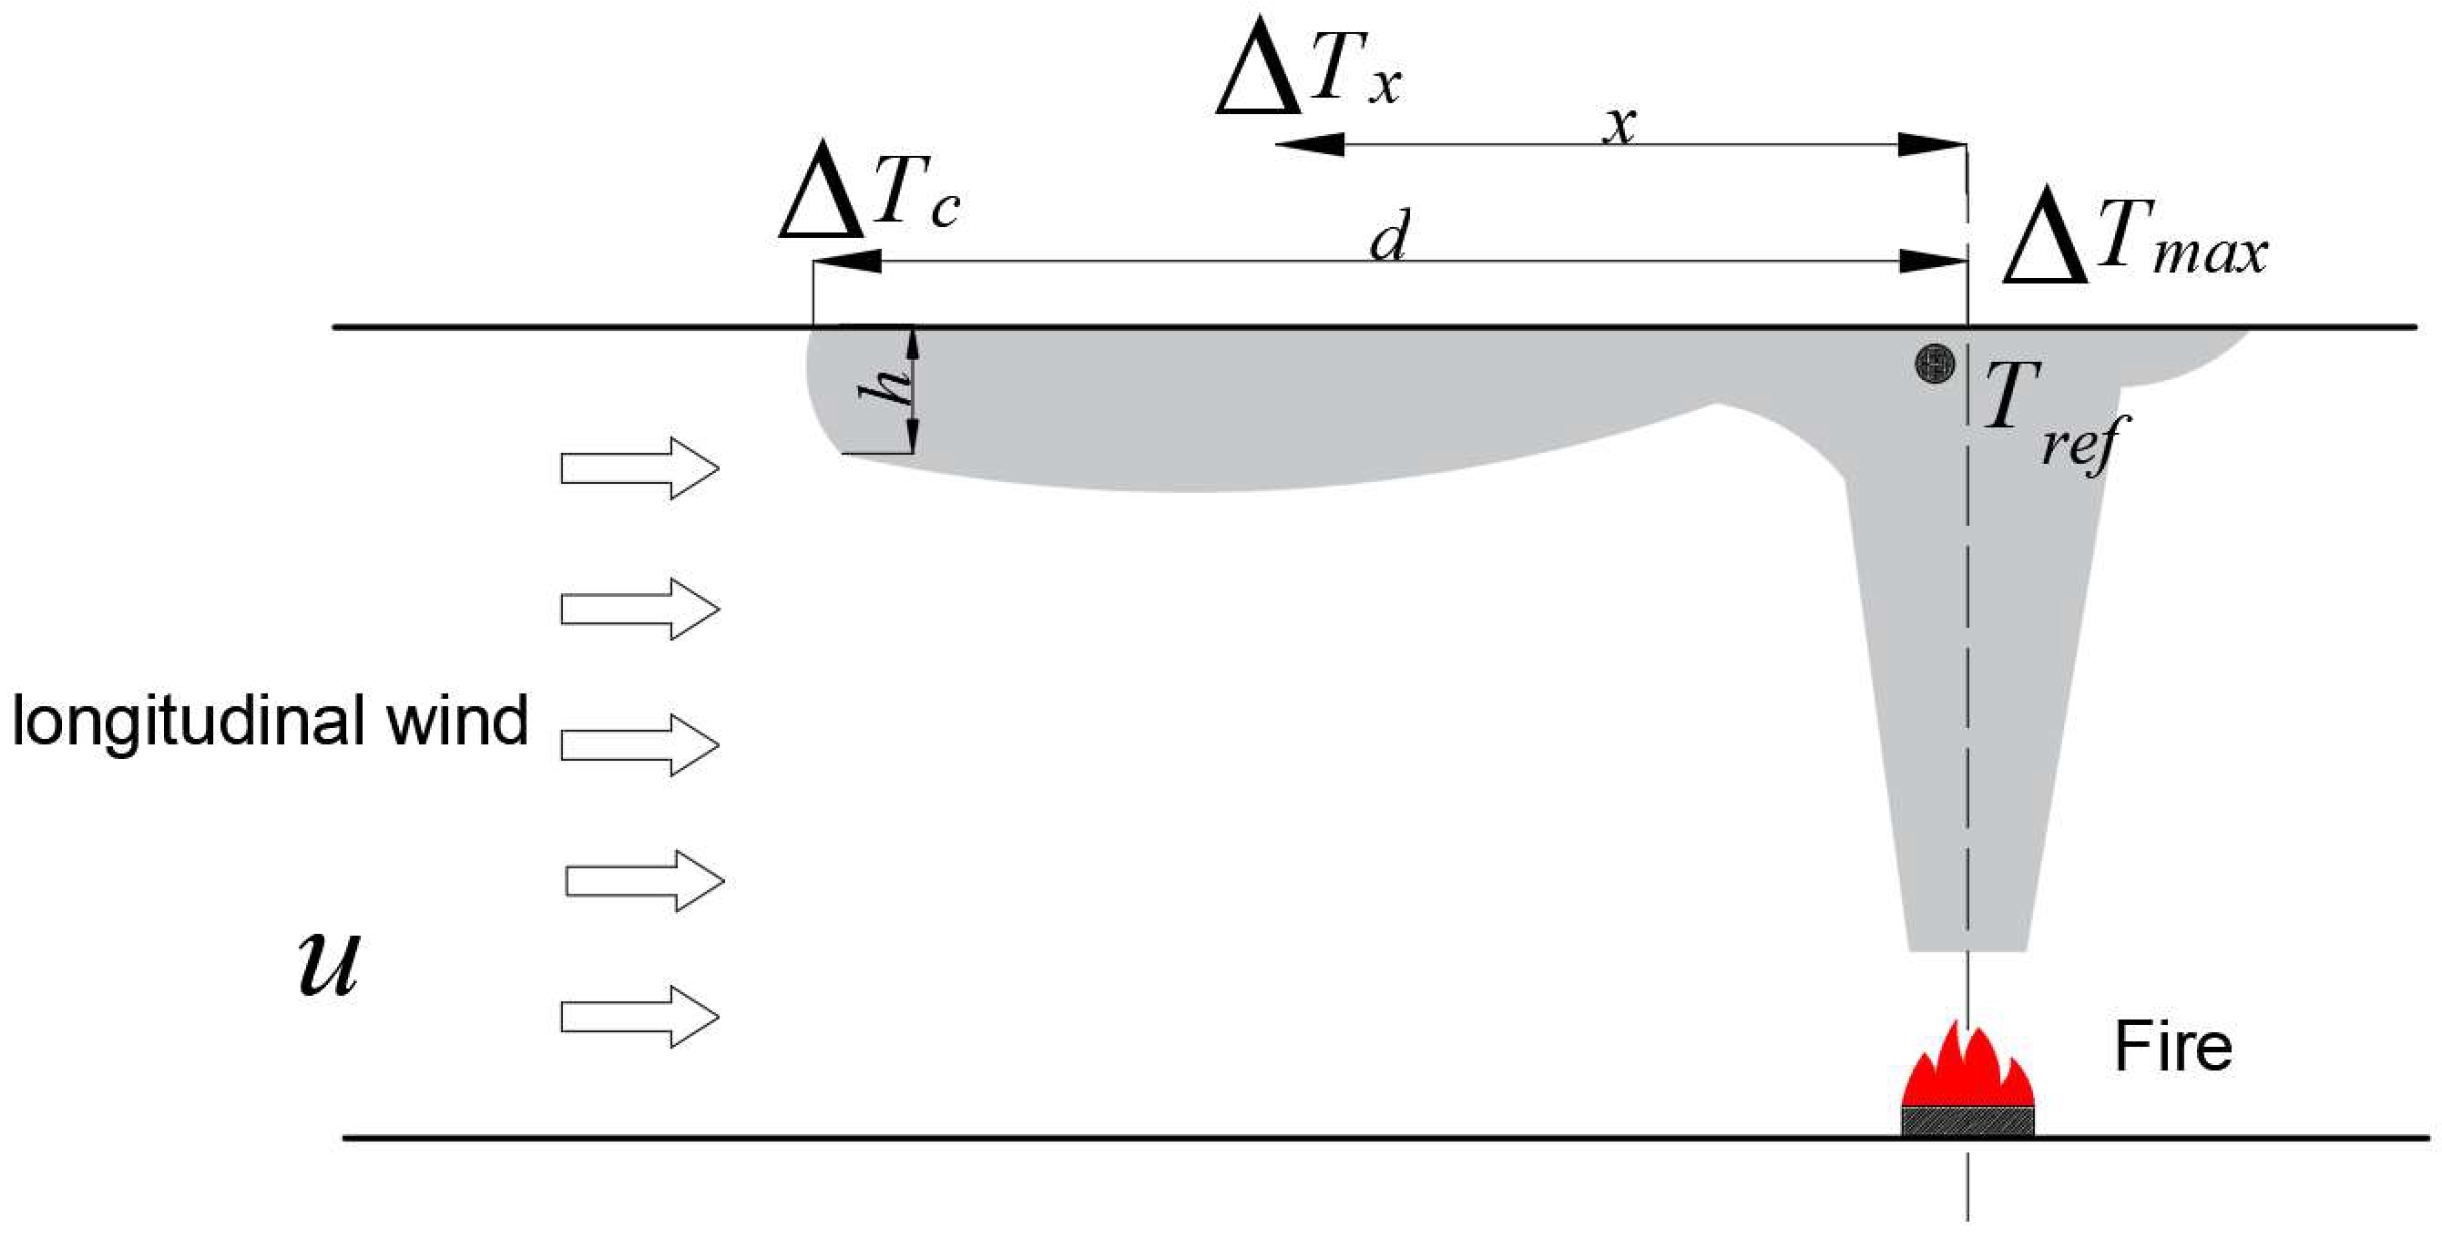
4.4. Analysis of Temperature Change of Smoke Backflow Front in Left and Right Paths
The phenomenon of flue smoke backflow in the roadway is closely related to the smoke backflow front temperature. When the driving force of the temperature difference of the smoke backflow front is equal to that of the longitudinal wind, the smoke backflow will no longer move forward [
26]. As shown in
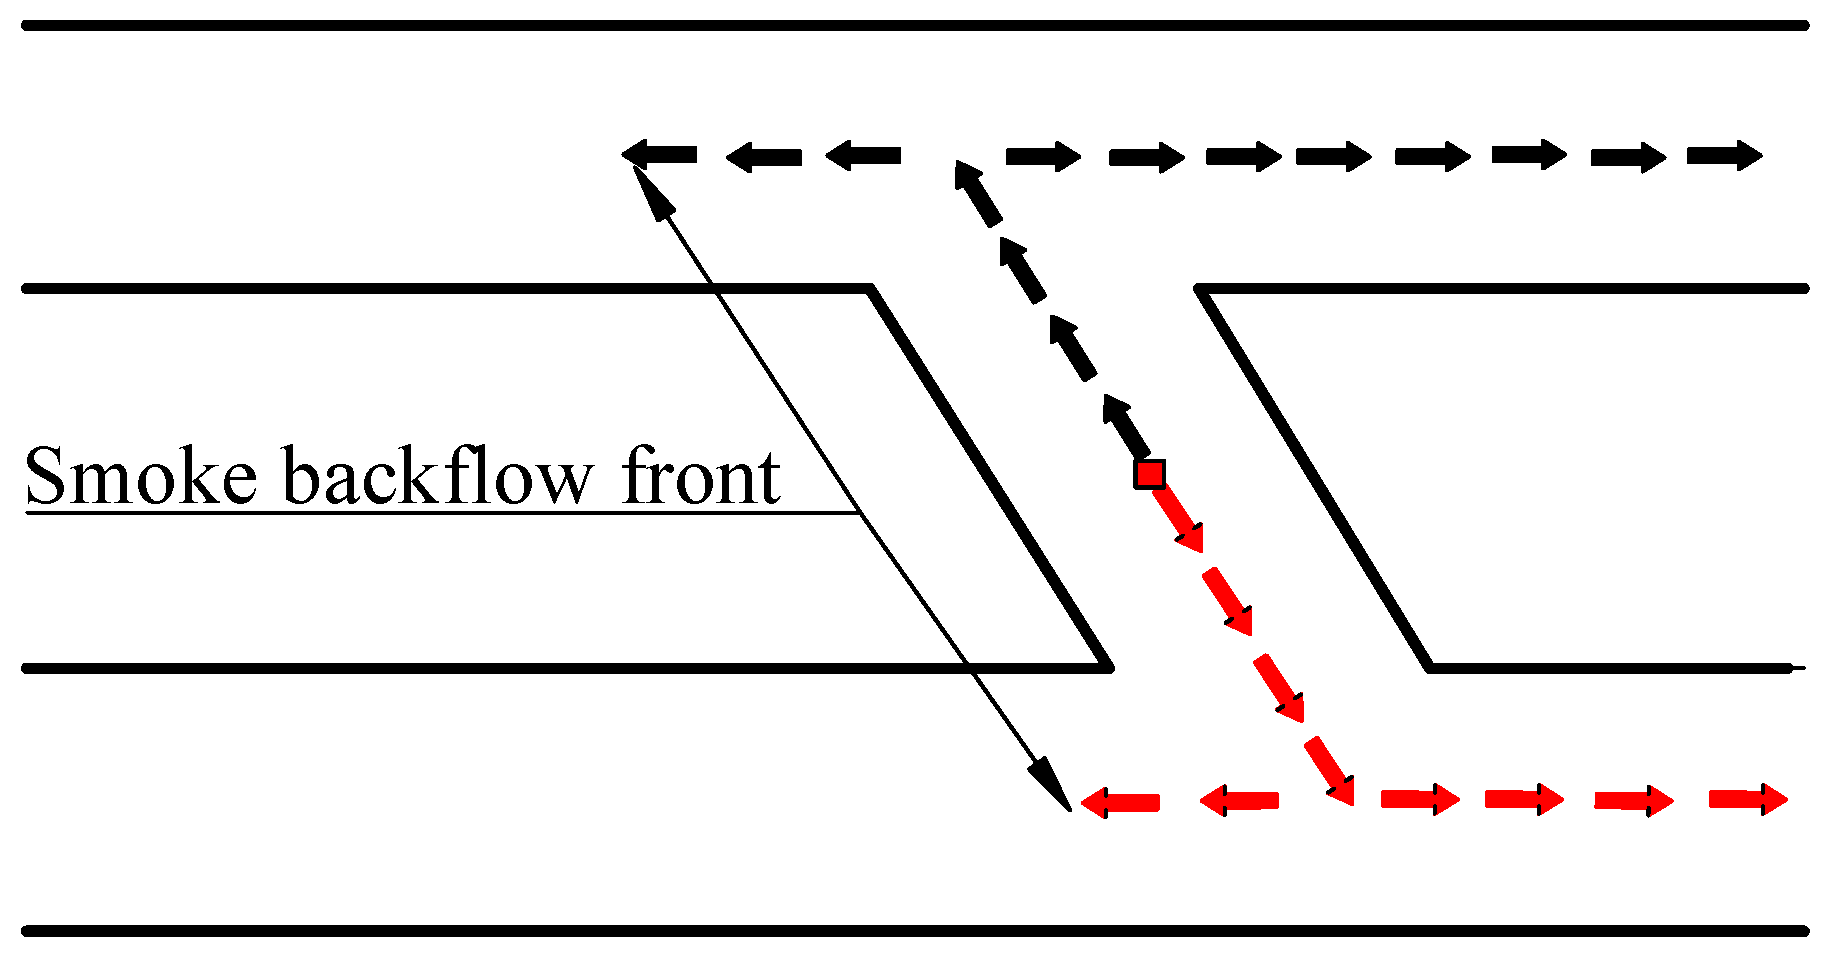
Figure 14, unlike a single tunnel, the smoke in the diagonal pipe network will regress not only in the diagonal branch, but also in the left and right path, and the retrogressive smoke will expand the scope of the disaster and change the original state of the ventilation system. Therefore, it is necessary to study the temperature of the smoke backflow front. In this section, by changing the heat release rate of the fire source, the smoke retrogression model is used to analyze the temperature distribution characteristics of the smoke backflow front in the diagonal pipe network.
At the smoke stagnation point, the static pressure difference between the smoke backflow front and the environmental control should be equal to the dynamic pressure caused by the longitudinal wind, expressed as follows:
The static pressure is mainly caused by the temperature difference between the smoke backflow and the ambient air, expressed as follows:
is the density difference between the smoke backflow front and the ambient air;
g is the acceleration of gravity; and
hs is the thickness of the smoke backflow front. The smoke movement pattern is as shown in
Figure 15.
Dynamic pressure caused by longitudinal wind:
Substituting Equation (15) into Equation (14).
Substituting Equation (17) into Equation (16)
It can be seen from the above equation that the stagnation of smoke backflow is mainly determined by the temperature difference between the retrogressive front and the ambient air. Therefore, as long as we can predict the temperature of the smoke retrogression front at different distances from the fire source, we can determine the position of the stagnation point of the smoke backflow front.
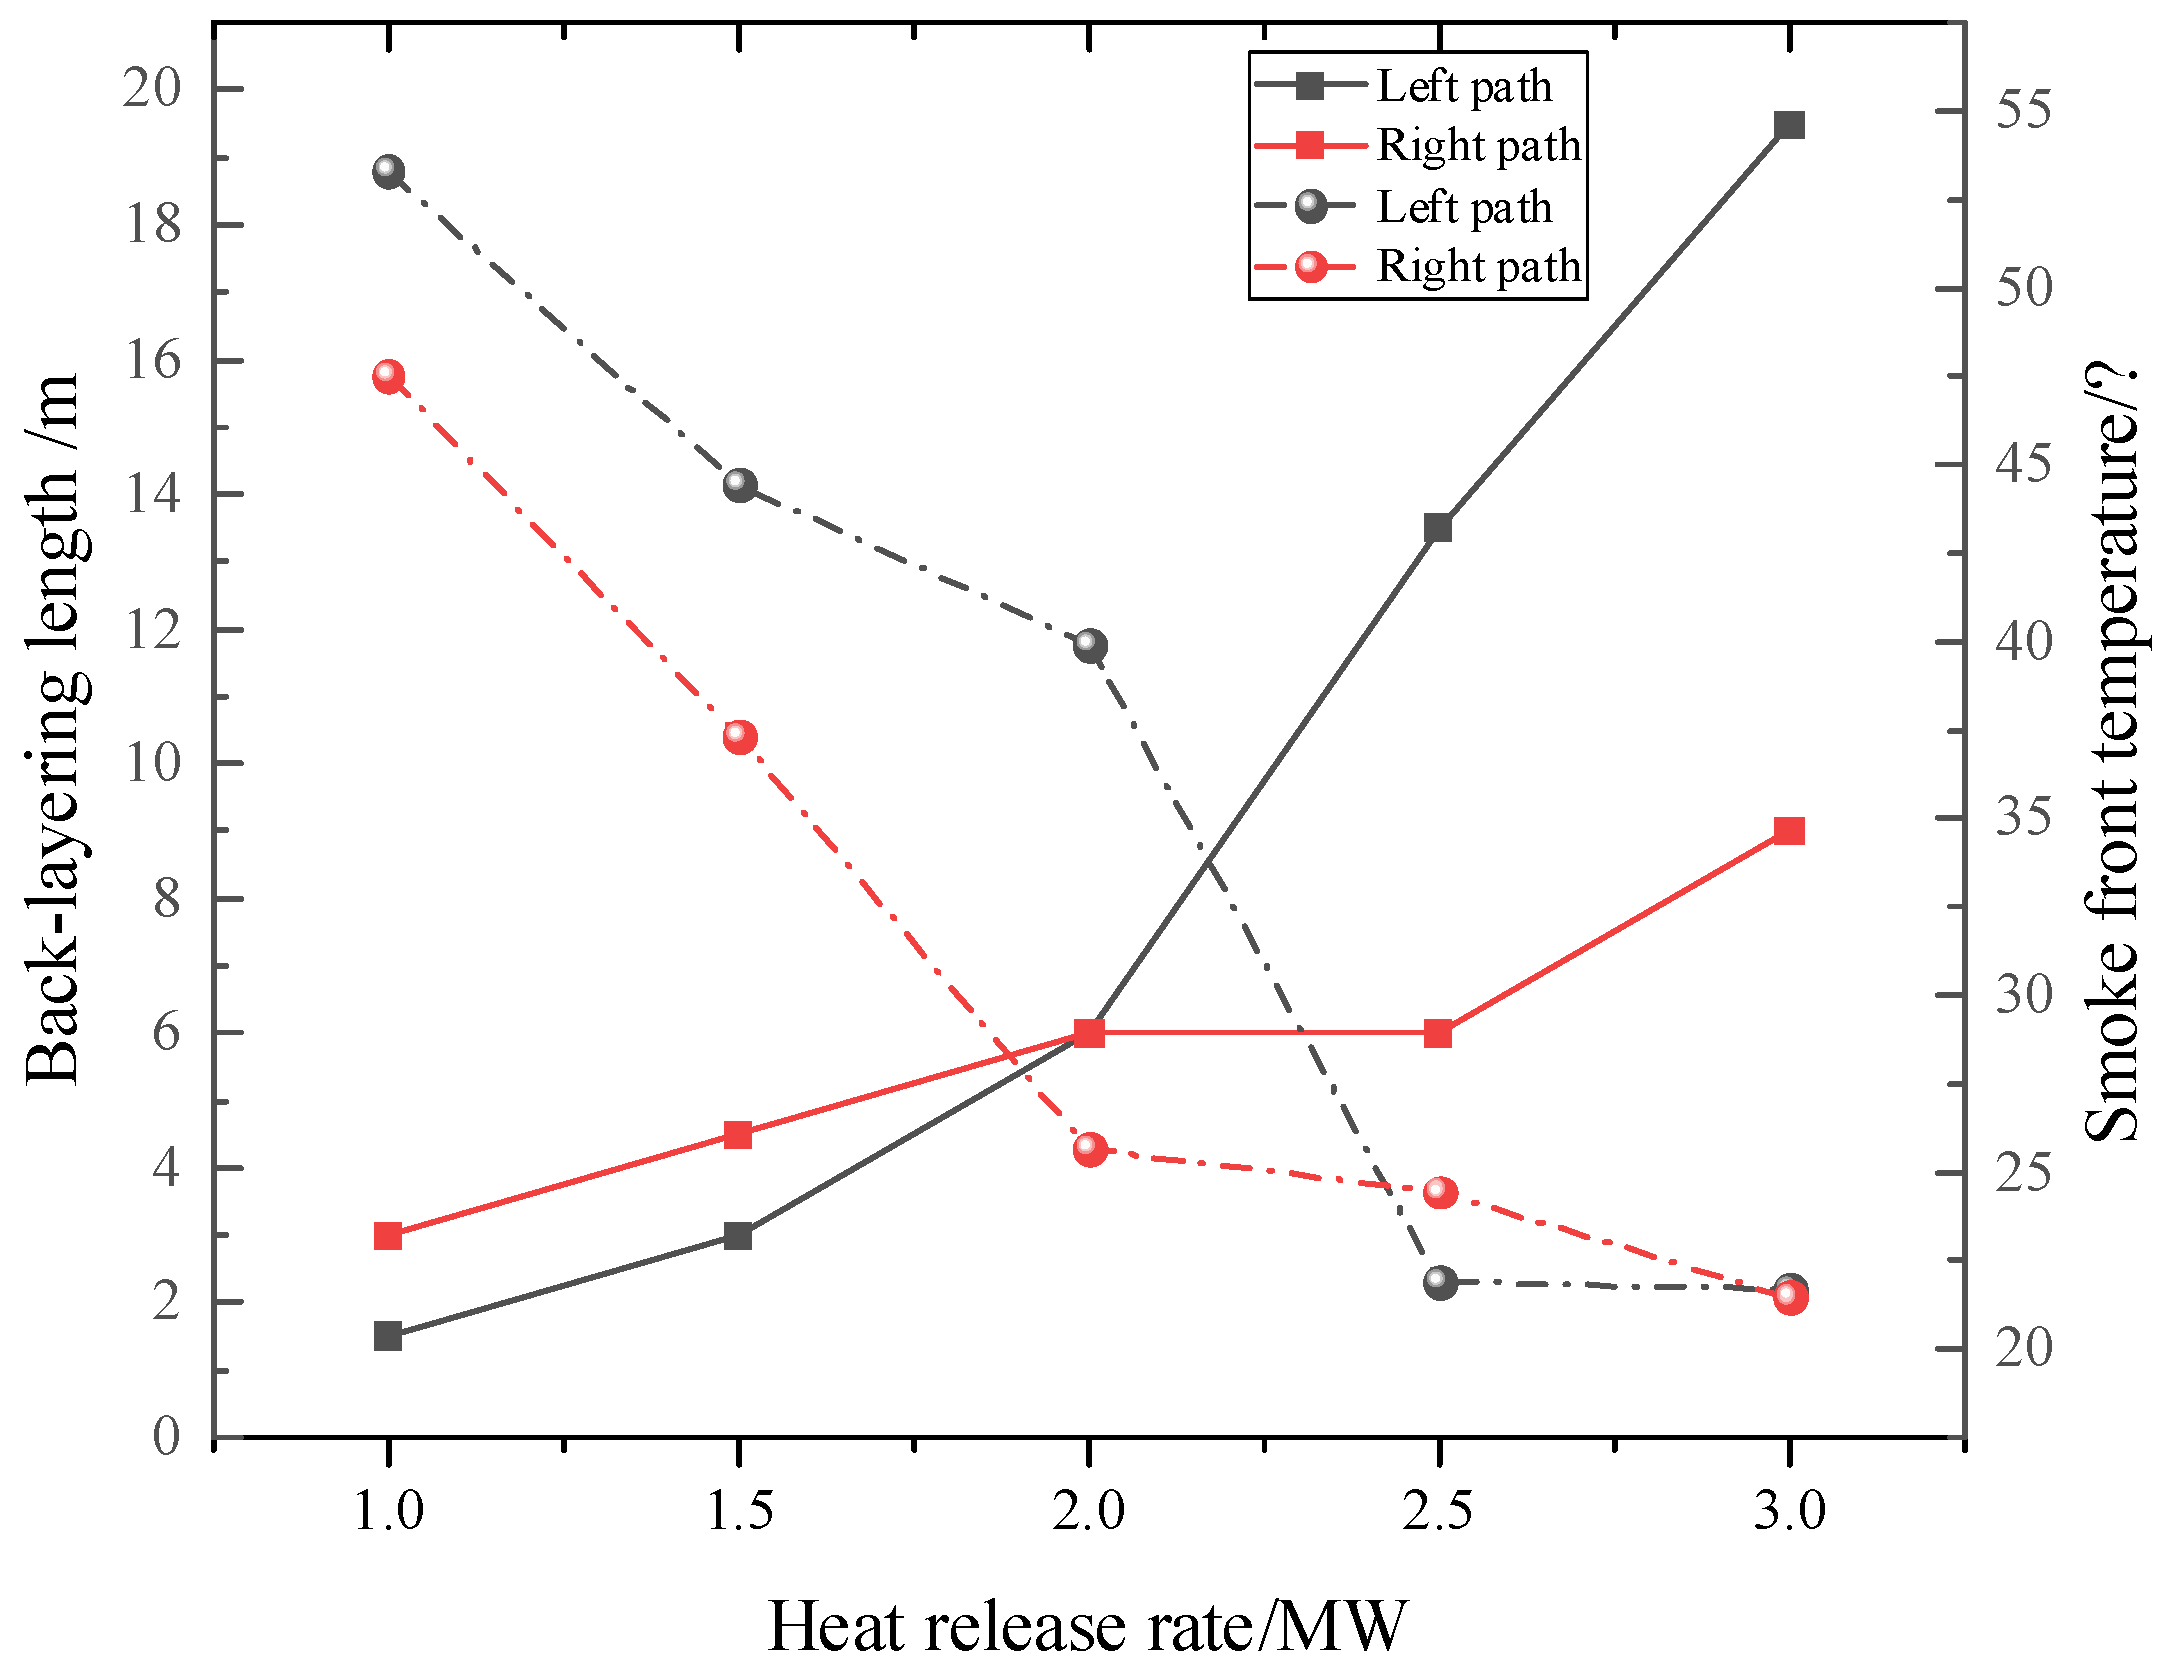
As can be seen from
Figure 16, the forward temperature of smoke retrogression in the left and right paths decreases with the increase in the heat release rate. The temperature of the smoke backflow front in the left path is higher than that in the right path as a whole. It can be seen from the aforementioned Equation (18) that there are two kinds of power at the stagnation point of smoke backflow. One is the longitudinal mechanical ventilation power, and the other is the differential pressure power caused by the temperature difference between the smoke backflow front and the air. When a fire occurs, fire resistance will be formed in the contaminated area, which mainly comes from the pressure drop of thermal expansion, the local resistance of combustibles, and smoke particles. The greater the power of the fire source, the greater the resistance effect and the smaller the ventilation effect, that is, the smaller the temperature difference required for the stagnation point of the smoke.
As shown in
Figure 17, according to the ventilation network calculation law of the diagonal ventilation network, the ventilation dynamic effect of a
1 is greater than b
1, that is,
; therefore,
. The temperature difference required for the smoke stagnation point of the left path is generally larger than that of the right path.


