Article

Wildfire Risk Levels at the Local Scale: Assessing the Relative Influence of Hazard, Exposure, and Social Vulnerability

Centre of Geographical Studies, Universidade de Lisboa, Rua Branca Edmée Marques, Cidade Universitária, 1600-276 Lisbon, Portugal
*
Author to whom correspondence should be addressed.
Fire 2022, 5(5), 166; https://doi.org/10.3390/fire5050166
Submission received: 14 September 2022 / Revised: 11 October 2022 / Accepted: 12 October 2022 / Published: 14 October 2022
(This article belongs to the Section Fire Social Science)

Abstract

:
Wildfire risk assessment provides important tools to fire management, by analysing and aggregating information regarding multiple, interactive dimensions. The three main risk dimensions hazard, exposure and vulnerability, the latter considered in its social dimension, were quantified separately at the local scale for 972 civil parishes in central mainland Portugal and integrated into a wildfire risk index. The importance of each component in the level of risk varied, as assessed by a cluster analysis that established five different groups of parishes, each with a specific profile regarding the relative importance of each dimension. The highest values of wildfire risk are concentrated in the centre-south sector of the study area, with high-risk parishes also dispersed in the northeast. Wildfire risk level is dominated by the hazard component in 52% of the parishes, although with contrasting levels of magnitude. Exposure and social vulnerability dominate together in 32% of the parishes, with the latter being the main risk driver in only 17%. The proposed methodology allows for an integrated, multilevel assessment of wildfire risk, facilitating the effective allocation of resources and the adjustment of risk reduction policies to the specific reality in each parish that results from distinct combinations of the wildfire risk dimensions.

1. Introduction

Wildfires are becoming more harmful, with recent events occurred in Southern Europe, South America, USA and Australia showing their potential destructive power [1,2,3]. In Portugal, wildfire is one of the most impactful hazards, with the extreme events occurred in 2017 causing the most devastating consequences ever recorded, including the loss of over 100 human lives [4,5]. Especially in the inner part of the territory, the combination between the abundance of flammable forest and shrub-dominated land cover, the warm and dry summers typical of Mediterranean-type climates, and the irregular topography, creates a particularly challenging fire-prone landscape [6,7,8,9]. Historical data also shows that, between 1980 and 2018, Portugal had the highest average number of annual wildfires and the second largest annual burnt area among the top affected countries of southern Europe (Portugal, Spain, France, Italy and Greece) despite having the smallest territory [5]. Most of the damage occurs in the summer months as the consequence of a relatively small number of large fires [9,10,11,12].
Like other natural hazards, wildfires can be approached from a disaster risk reduction (DRR) perspective [13,14,15]. The DRR approach conceives risk as a multi-dimensional phenomenon, that not only includes the characteristics of natural hazards and of the environment in which they occur, but also the degree to which populations, infrastructure and livelihoods are exposed to these hazards, as well as their level of vulnerability to their destructive and disruptive effects [15]. This integrated perspective enables organizations of local to global scope to act upon specific dimensions of risk, armed with the foreknowledge that a reduction in any one of them will lead to a reduction in the total risk associated with a given hazard. Available measures for such purpose are of numerous types, including economic, structural, legal, social, health, cultural, educational, environmental, technological, political, and institutional [16].
Adopting the risk assessment definitions proposed by the United Nations, wildfire hazard can be defined, for a certain area, in terms of the probability, frequency and intensity that characterize wildfires [17]. This broad definition allows for contrasting means of quantification and statistical techniques, depending on the purpose and application. For example, burn probability maps can be obtained by simulation approaches [18], to support operational decisions regarding fuel treatments and suppression activities [19], or instead, they can be based on historical fire data to provide a structural perspective of the propensity to burn based on terrain conditions [20,21], to define long-term prevention strategies.
Exposure evaluates the elements, or assets, which are located in areas where hazardous events may occur [15,22,23]. Based on the spatial intersection with the fire hazard level, potentially affected elements located in the area are analysed, among which are built-up areas, forests, agricultural lands, protected areas, infrastructures, and human communities [24,25,26].
The third component of wildfire risk is vulnerability, which represents the propensity of exposed elements to suffer adverse effects when affected by wildfires [15,27,28,29]. Given the diversity among the potentially exposed elements, this risk component has been subject to various approaches, for example focused on physical elements such as vegetation types [30], environmental elements such as ecosystems [31], social elements [29,32,33], and often on combinations of these elements [34,35,36,37,38]. Along with contrasting ways to quantify them individually, the components of risk have also been articulated in different ways to produce risk indexes, which can be hazard-specific or not. For instance, the Inform-Index For Risk Management [39] proposes three essential dimensions: hazard/exposure, vulnerability (which refers to the fragility of the socio-economic system), and lack of coping capacity (which refers to the lack of resilience to cope and recover). This index draws a strong conceptual influence from the work of Cardona and Carreño [40]. A contrasting example is the World Risk Index [14], which proposes two main risk dimensions, or spheres: the hazard sphere and the vulnerability-social sphere. The first aims to identify the diverse entities exposed and prone to be affected by a hazard event (such as communities, resources, infrastructure, or ecosystems). The vulnerability-social sphere is subdivided into three components: susceptibility (the likelihood of suffering harm in the case of a hazardous event, defined by factors such as nutrition or economic capacities), coping capacity (the ability to respond directly to the impact of a hazardous event), and adaptive capacity (the capacity for implementing long-term strategies for societal change). Neither of the above is hazard-specific, and therefore they can be adapted to any hazard or combination thereof. A wildfire-specific example is the wildfire risk assessment framework proposed by [41], in which wildfire risk for a given area is seen as the combination of wildfire hazard (in terms of likelihood and intensity), exposure, and expected effects (the expected changes in value, expressed in percentage). Other examples are the Wildland Fire Decision Support System (WFDSS) [42], in which fire spread probability (fire behaviour) is combined spatially with the nature and location of elements at risk (resource assessment), in order to facilitate rapid decision-making in a context of escaped wildfires (in this case, the expected degree of damage, i.e., the physical vulnerability, is not explicitly taken into consideration). Another example is the fire risk assessment framework proposed by Chuvieco et al. [43], in which risk is the result of the combination between the probability of fire initiation and propagation, and its potential damage. Although exposure is not explicitly included in the framework, it is implicit in its GIS-based implementation, as each pixel represents an exposed spatial unit.
In Portugal, Parente and Pereira quantified wildfire risk at the national scale, considering only damage to vegetation [30]. Using raster data, wildfire hazard was estimated as the combination of wildfire probability (quantified for each pixel as the percentage of years from the study period in which that pixel burned) and terrain susceptibility (defined as the propensity of the terrain to be burned as a function of its inherent properties, such as land cover or slope). The potential damage (corresponding to the dimensions of exposure and vulnerability) was quantified using the economic value by hectare of existing vegetation types, and their expected degree of loss in case of burning. Antunes et al. [44] used a similar approach to calculate wildfire risk for a single municipality in central-north Portugal, additionally assessing risk with a focus on scenically valuable landscape units. More recently, Oliveira et al. [28] assessed wildfire risk specifically for human settlements (villages) within a civil parish in central Portugal, combining burn probability scenarios with exposure and vulnerability levels. The latter was based on a cluster analysis of the social characteristics of resident population; in addition, coping capacity factors were also integrated, namely the time required to reach a potential fire shelter and the distance of each village to the nearest fire station.
In this work, we employ a new detailed parish-scaled approach to characterize a regional-sized study area in central mainland Portugal with respect to the three dimensions of wildfire risk: hazard, exposure, and vulnerability, the latter considered in its social dimension. We then combine the three individual dimensions into an integrated wildfire risk index, based on an adaptation of the INFORM framework [39]. This adaptation was recently applied with success by Santos et al. [45] and Pereira et al. [46], albeit to other hazards (floods and landslides, respectively) and was chosen due to its simple structure and its versatility, being applicable with varying degrees of complexity depending on the availability of data regarding each of the dimensions of risk. Cluster analysis is subsequently used to aggregate the 972 parishes into groups sharing similar wildfire risk dimensions, allowing for a nuanced perspective over the study area. Finally, we discuss the limitations of the index, as well as its potentialities in a risk management context. Our objectives are thus threefold: (1) to characterize the parishes in the study area in terms of wildfire hazard, exposure, and social vulnerability; (2) to quantify wildfire risk within the study area by means of an integrated index; (3) to identify wildfire risk profiles within the study region, by investigating the combination patterns of the components of wildfire risk among the different parishes.

2. Materials and Methods

2.1. Study Area

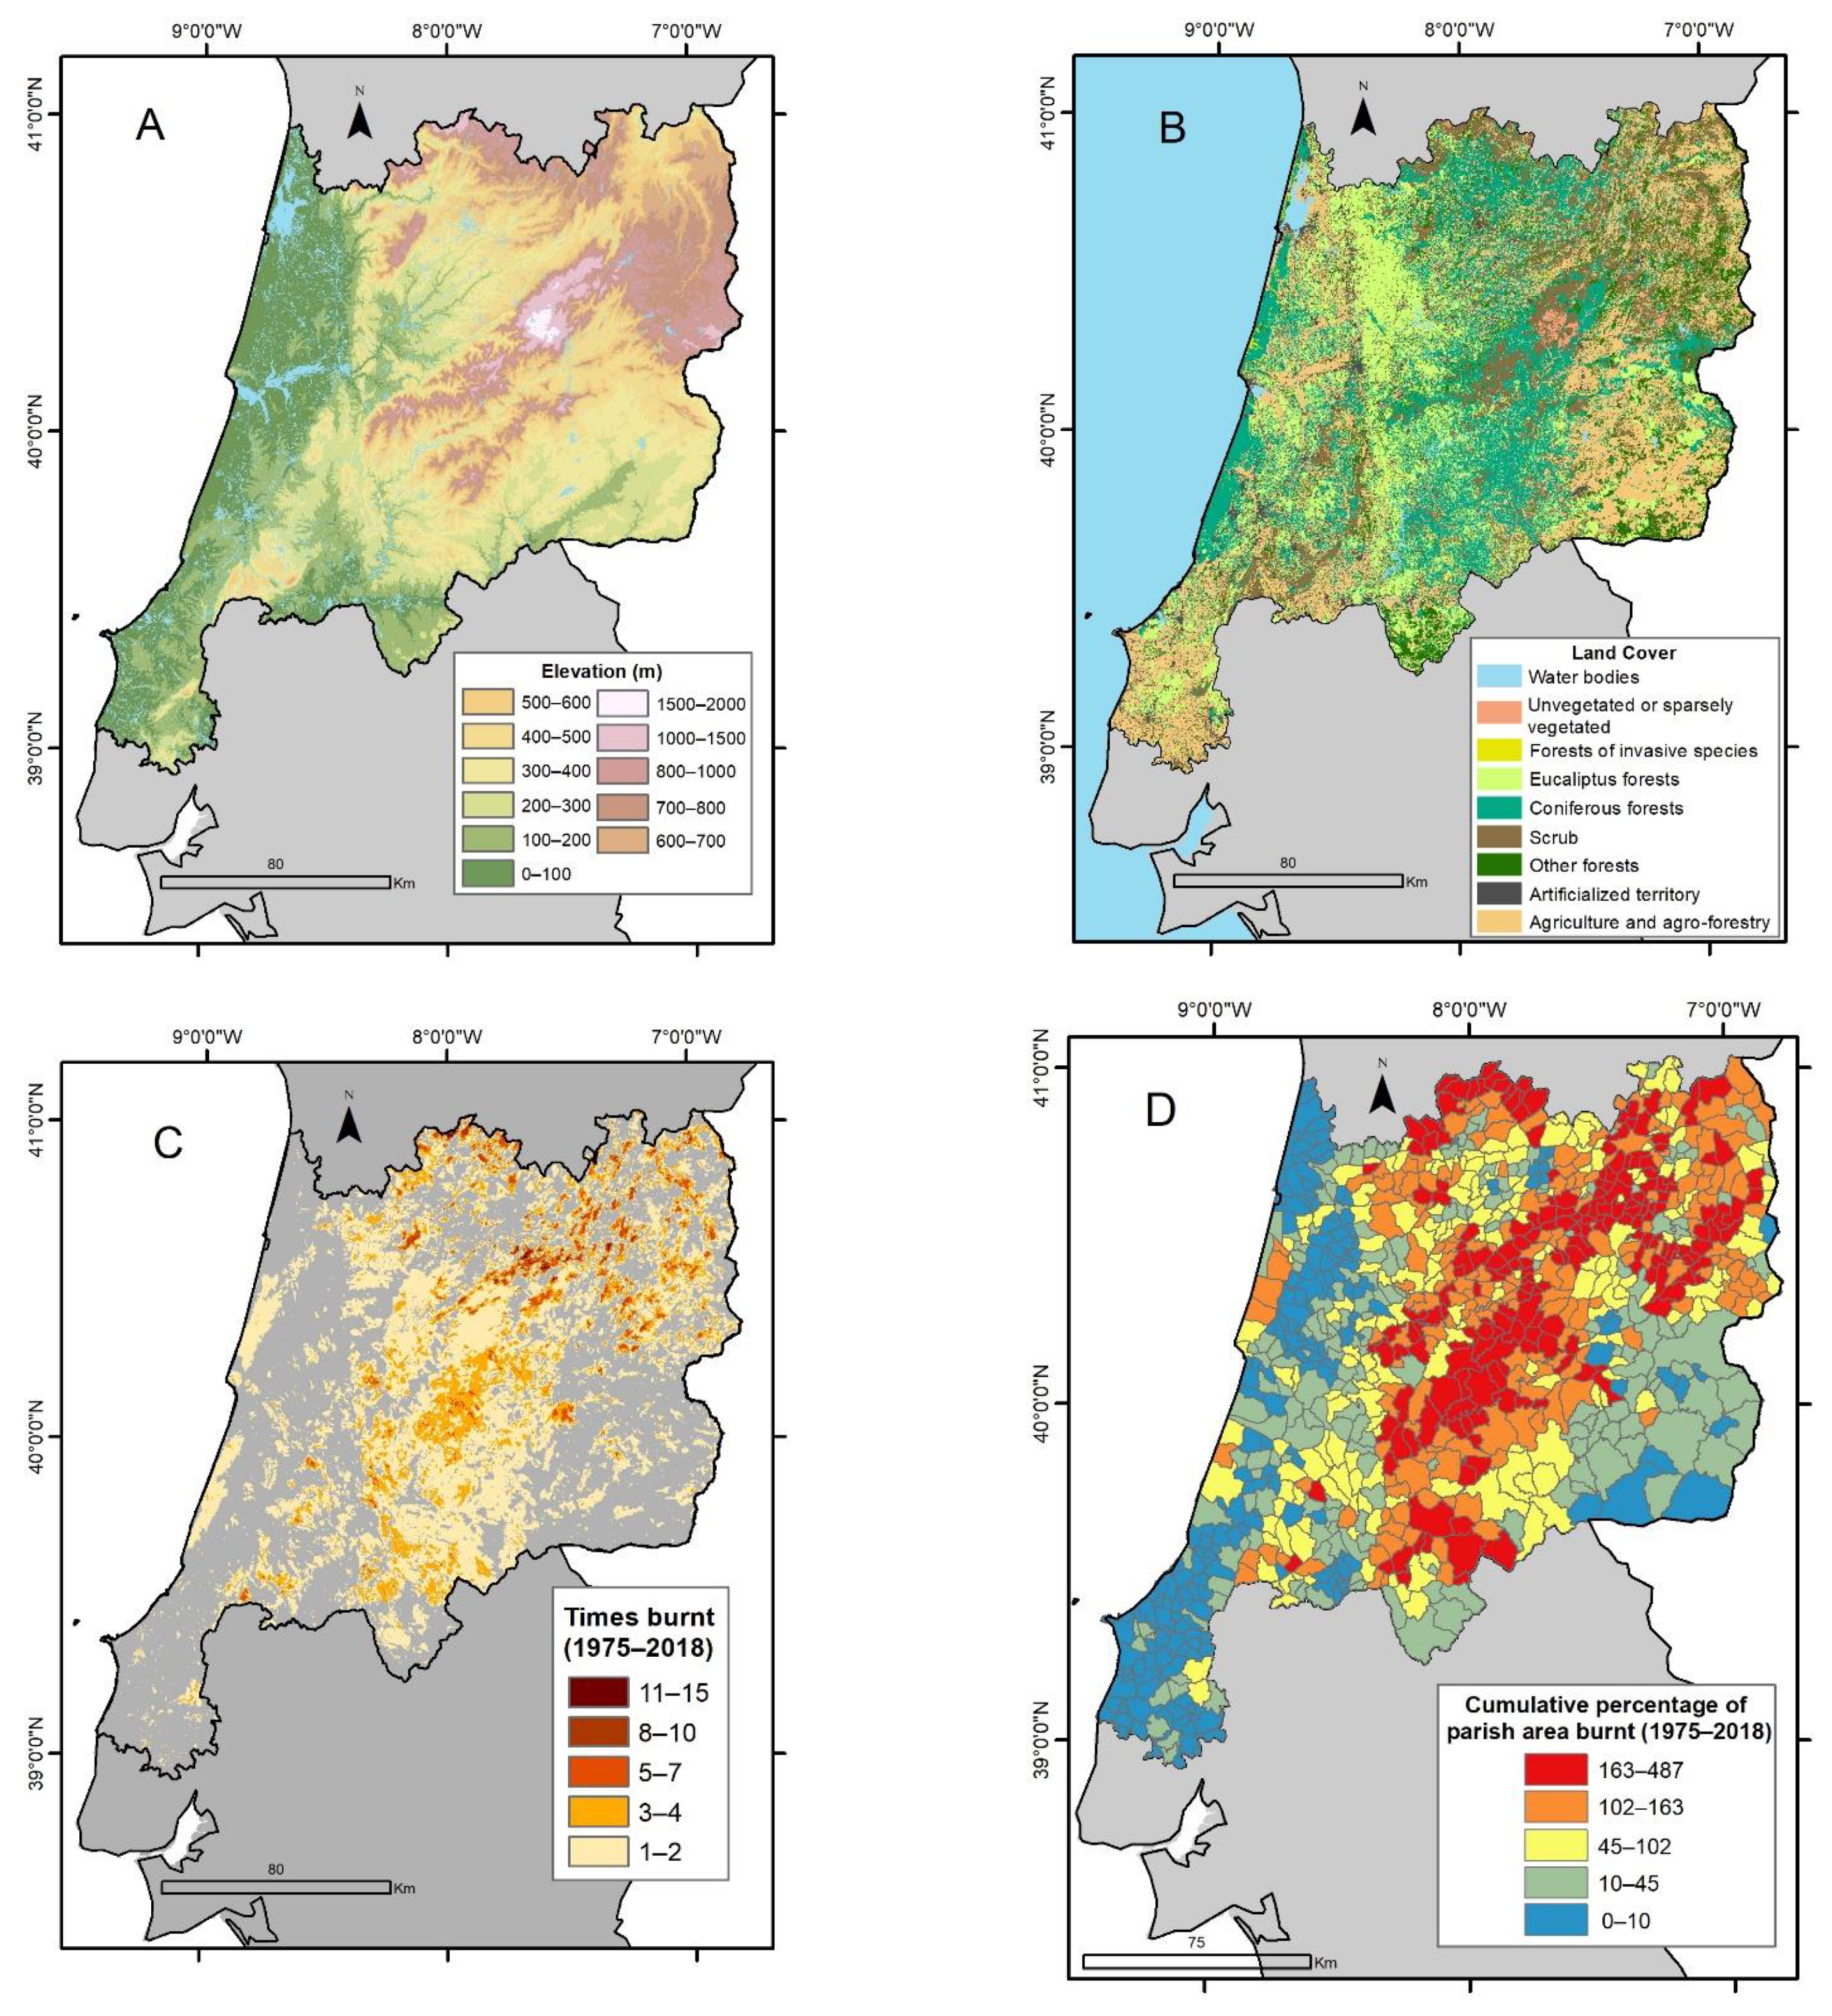
The study area was the NUTS 2 region “Centro”, which covers a total area of 28,199 km2 in central-north mainland Portugal (Figure 1). It comprises 100 municipalities, further subdivided into 972 civil parishes, which were the units of analysis adopted in this study and correspond to the smallest administrative unit in the country. The parishes vary in area from 2.0 km2 to 373.5 km2. Elevation ranges from the sea level to the highest point in mainland Portugal, 1993 m in the Estrela mountain in the east (Figure 2A), with landforms varying from coastal plains in the west to mountain ranges, and further to plateaus at different elevation levels in the east. Land cover also presents much variability (Figure 2B). It is dominated by different forest types, mainly eucalyptus (Eucalyptus globulus) and maritime pine (Pinus pinaster), concentrated in a N-S swath across the centre of the study area, and along a narrow coastal fringe. Elsewhere, forests occur interspersed with agroforestry, with the latter dominating in the SW and SE limits. In the NE, agroforestry occurs interspersed mostly with oak forests and shrubland. The SW-NE-oriented Central Mountain Range (Cordilheira Central) is marked by large patches of scrub and unvegetated or sparsely vegetated terrain. Annual rainfall ranges from a minimum of 600 mm in the extreme NE of the study area, up to 2800 mm in the highest areas of the Central Mountain Range [47]. Regarding wildfire incidence, the spatial pattern of burnt areas shows a remarkable correspondence with land cover, with burnt areas corresponding broadly to the distribution of forest and scrub; Figure 2C shows the number of times burnt between 1975 and 2018, calculated with reference to a 25 m pixel. Nonetheless, a spatial distinction is evident, with a large part of the central sector having burned 1 to 4 times, but patches that have burned a greater number of times (up to a maximum of 15) occurring in a dispersed pattern in mountainous areas of the N and NE sectors. This high recurrence is mostly related to the use of fire for pasture renovation [11]. In contrast, the central-south sector of the study area is characterized by less frequent, but much more extensive wildfires, promoted by continuous forest patches, interspersed with scrub patches corresponding to different stages of post-fire succession (Figure 2B) [11]. Figure 2D shows the cumulative percentage of area burnt by parish for the period 1975–2018, further illustrating the variability in wildfire patterns within the study area. Most of the central and NE sectors of the study area are dominated by parishes in which more than 97% of the area has burned during this 44-year period, with values above 200% being frequent. In the most extreme cases, all the area of the parish burned between three and near to five times during the considered period. In contrast, all the coastal region, as well as the S and SE limits, are dominated by parishes in the lower classes (less than 50% burned).
Population density also shows a marked variation within the study area, decreasing generally away from the coast. Its values are below 100 inhabitants/km2 in most of the study area, reaching values over 500 inhabitants/km2 only in and around the larger urban centres such as Leiria, Coimbra, Aveiro, Viseu or Guarda [47] (Figure 1).
Municipal limits within the study area are shown in light grey.

2.2. Methodology

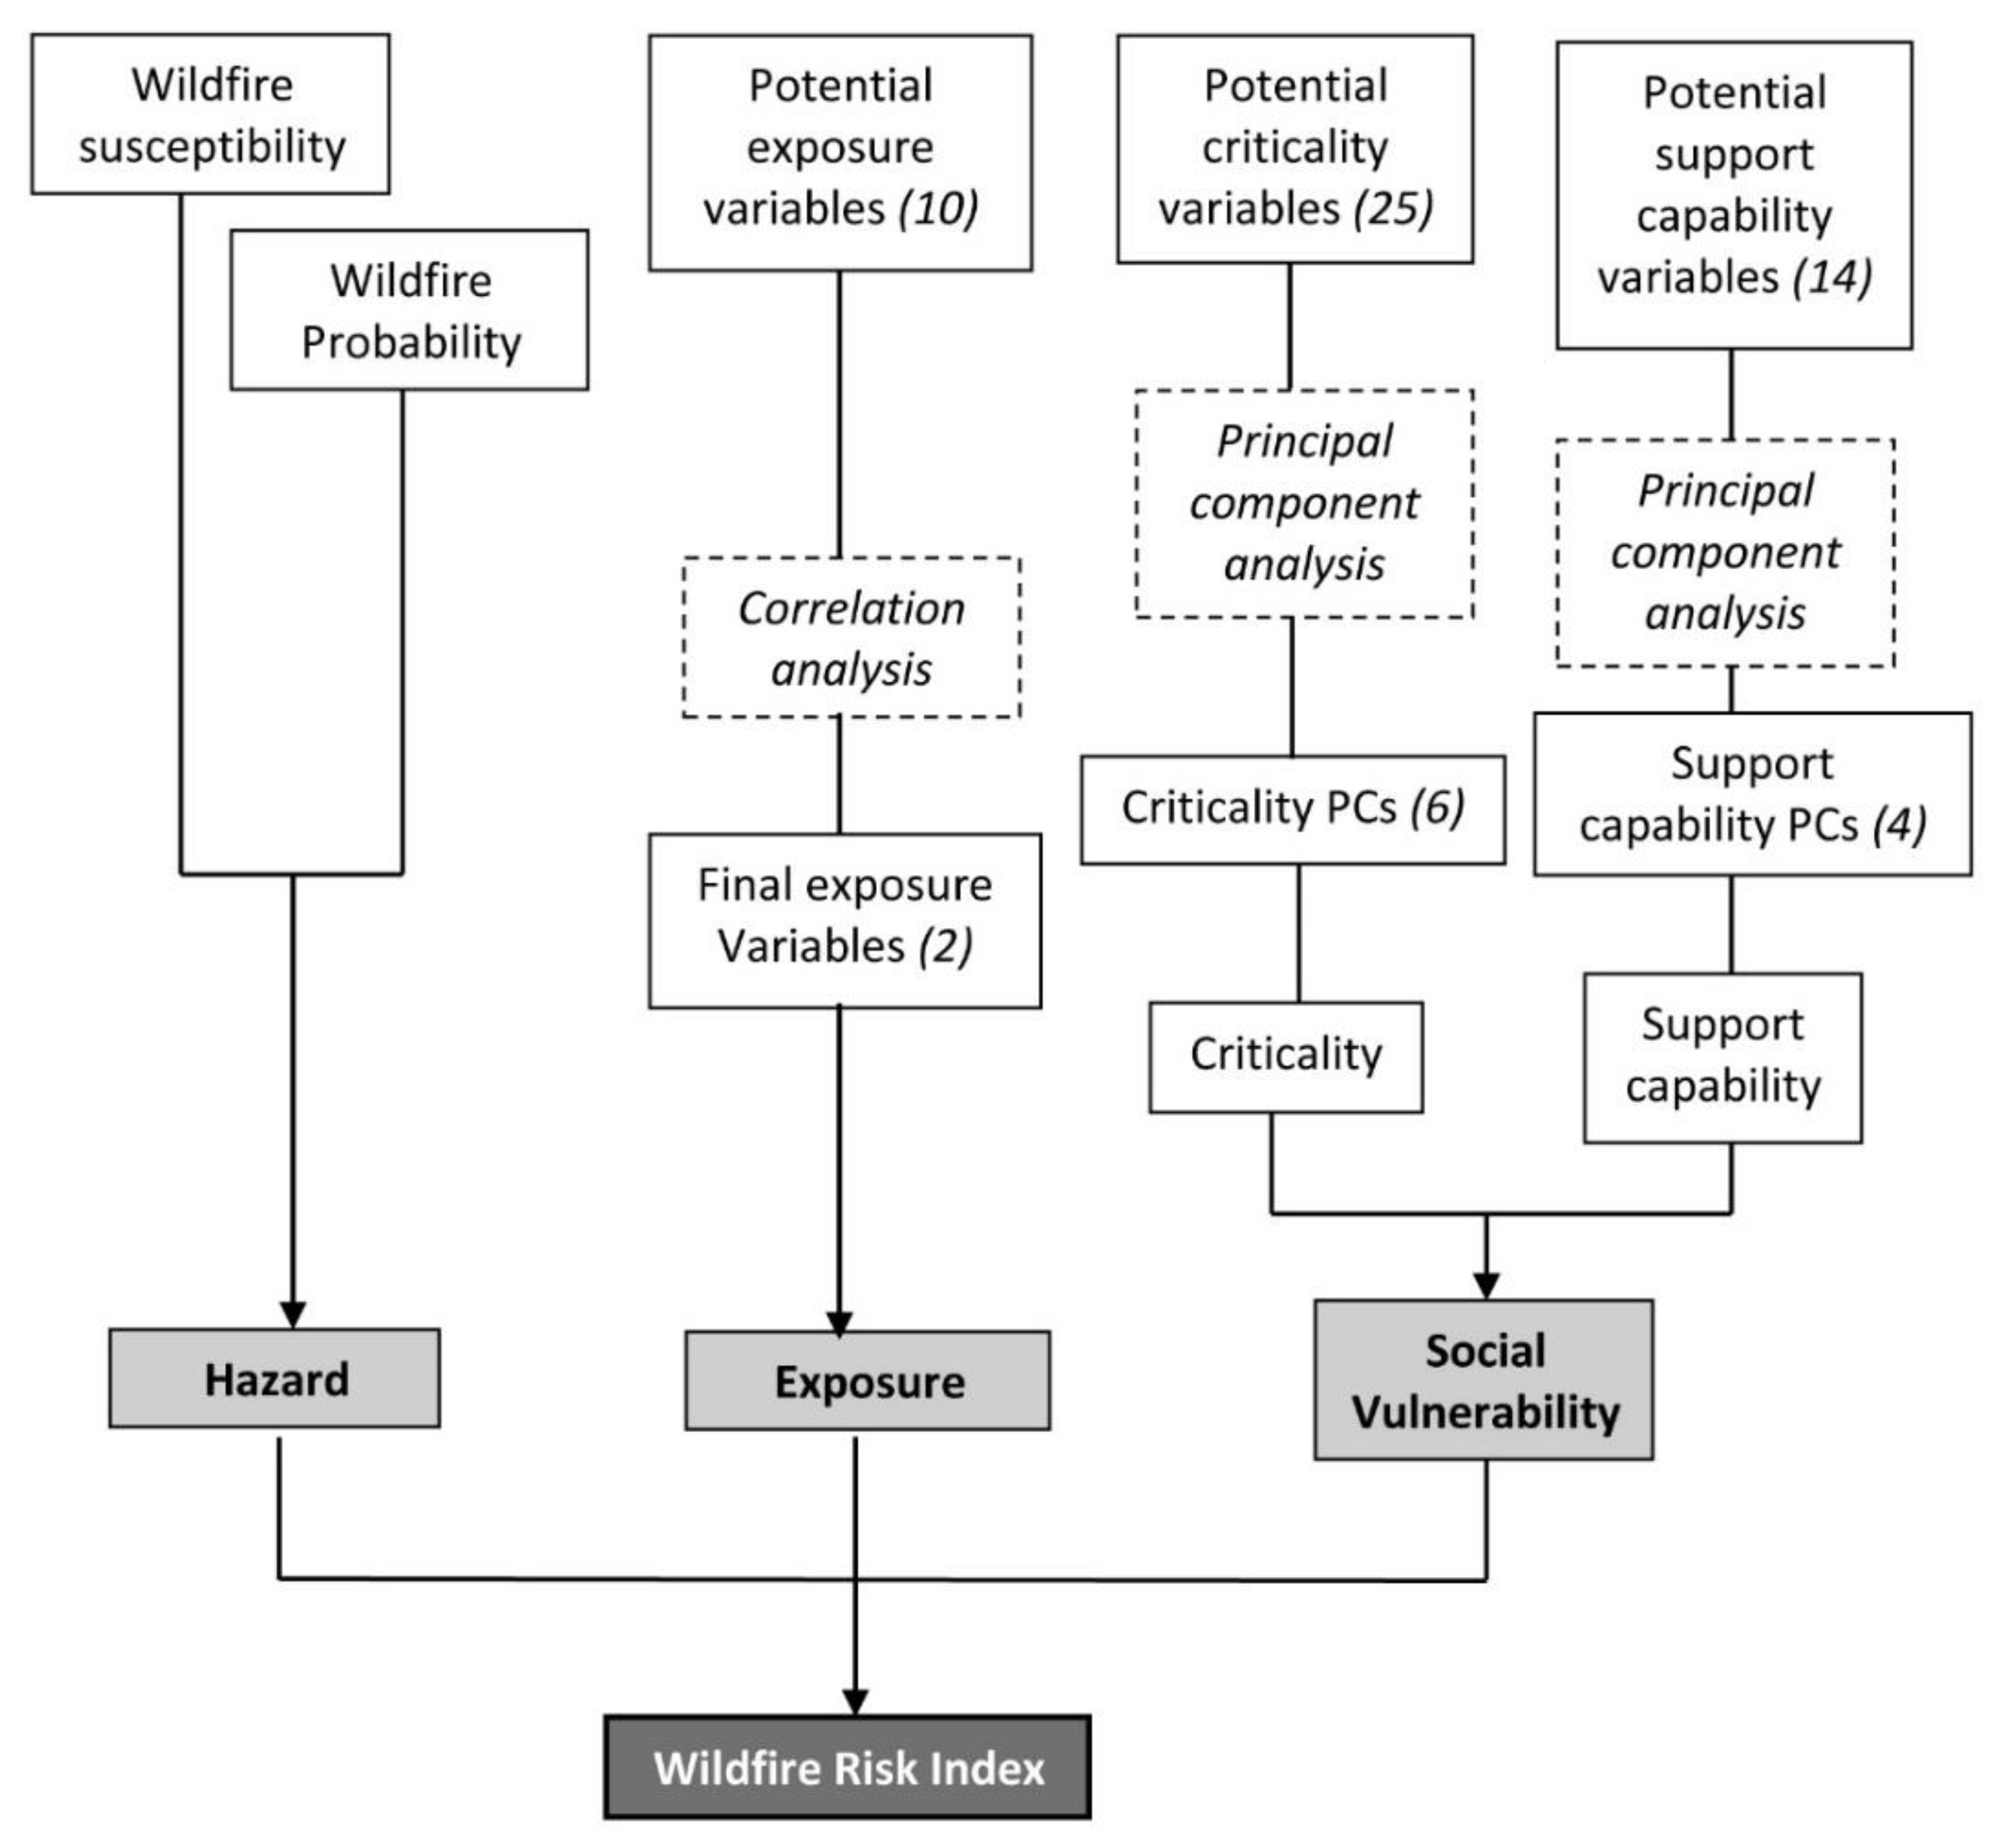
The general structure of the methodology used the calculate the wildfire risk index (WRI) is shown in Figure 3. It followed the adaptation of the INFORM framework [39] recently applied to floods and landslides [45,46]. The three dimensions of risk and their integration are described in the following sections.
A 25 m pixel was adopted for all spatial data. ArcGIS 10.7.1. software (ESRI Inc., Redlands, CA, USA) was used for all spatial analysis operations.

2.2.1. Wildfire Hazard

Wildfire hazard was calculated using the methodology described by Oliveira et al. [21] (summarized in Figure 4). According to the underlying conceptual framework, wildfire hazard is calculated as the product of susceptibility (the terrain’s propensity to suffer a wildfire or to support its spreading as dictated by its intrinsic characteristics such as elevation, slope and vegetation cover) by wildfire probability (the unconditioned probability that a given spatial unit will burn on any given year). This methodology has been previously adopted in wildfire studies [20,30,48,49] and is officially used by the Portuguese state agency for the conservation of nature and forests (ICNF) for producing yearly wildfire hazard maps for mainland Portugal [50].
For each pixel, susceptibility values are the result of the sum of the likelihood ratios (LR) associated with the variables elevation (in m), slope angle (in degrees) and land cover, obtained by cross-tabulating each of these classified variables with past burnt areas. Aspect was not considered, as this variable does not have a clear spatial relationship with burned area in mainland Portugal and has been shown not to increase the predictive capacity of wildfire hazard models [21].
Burnt area data was obtained from the Portuguese Institute for Conservation of Nature and Forests (ICNF). Topographic data were obtained from the European Environmental Agency’s Digital Surface Model, with a 25 m pixel (https://www.eea.europa.eu/data-and-maps/data/copernicus-land-monitoring-service-eu-dem; accessed on 1 March 2021). Land-cover data was obtained from the Portuguese General-Directorate of the Territory (Direção-Geral do Território).
For each class i of each variable, the LR score Lri is calculated as [51]:
L r i = S i / S N i / N
where Si is the number of burnt terrain units (pixels) corresponding to class i of variable Y, S is the number of burnt terrain units, Ni is the number of terrain units associated with class i of variable Y, and N is the total number of terrain units. For a total of n predisposing variables, the total LR score of each terrain unit (Lrj) is calculated as:
L r j = i = 1 n X i j .   L r i
where Xij equals 1 for the classes of the variables that are present and 0 for all others.
Yearly burnt areas between 1975 and 2018 were used to derive LR scores for elevation and slope angle. As land cover mapping is only available since 1995, with maps existing for 1995, 2007, 2010, and 2015, LR scores were calculated for each class considering the specific timeframe represented by each landcover map. Likelihood ratio scores were, therefore, calculated for the 1995 map using annual burnt areas for the years 1995–2006 (12 years), for the 2007 map using annual burnt areas for the years 2007–2009 (3 years), for the 2010 map using annual burnt areas for the years 2010–2014 (5 years), and for the 2015 map using burnt areas for the years 2015–2018 (4 years). The final LR score for each land cover class was calculated as the weighted average of the scores within the successive land-cover maps, with the number of years covered by each map used as weight.
Wildfire hazard was obtained by multiplying the susceptibility score of each pixel by its probability of burning each year, obtained as the ratio of times that a given pixel was burnt (between 1975 and 2018) and the total number of years within this period (44 years). The resulting map was classified in five classes (very low; low; medium; high; very high) as required by the Portuguese Forest Authority, according to the breaks of the success-rate curve and the predictive capacity of the hazard model [21].
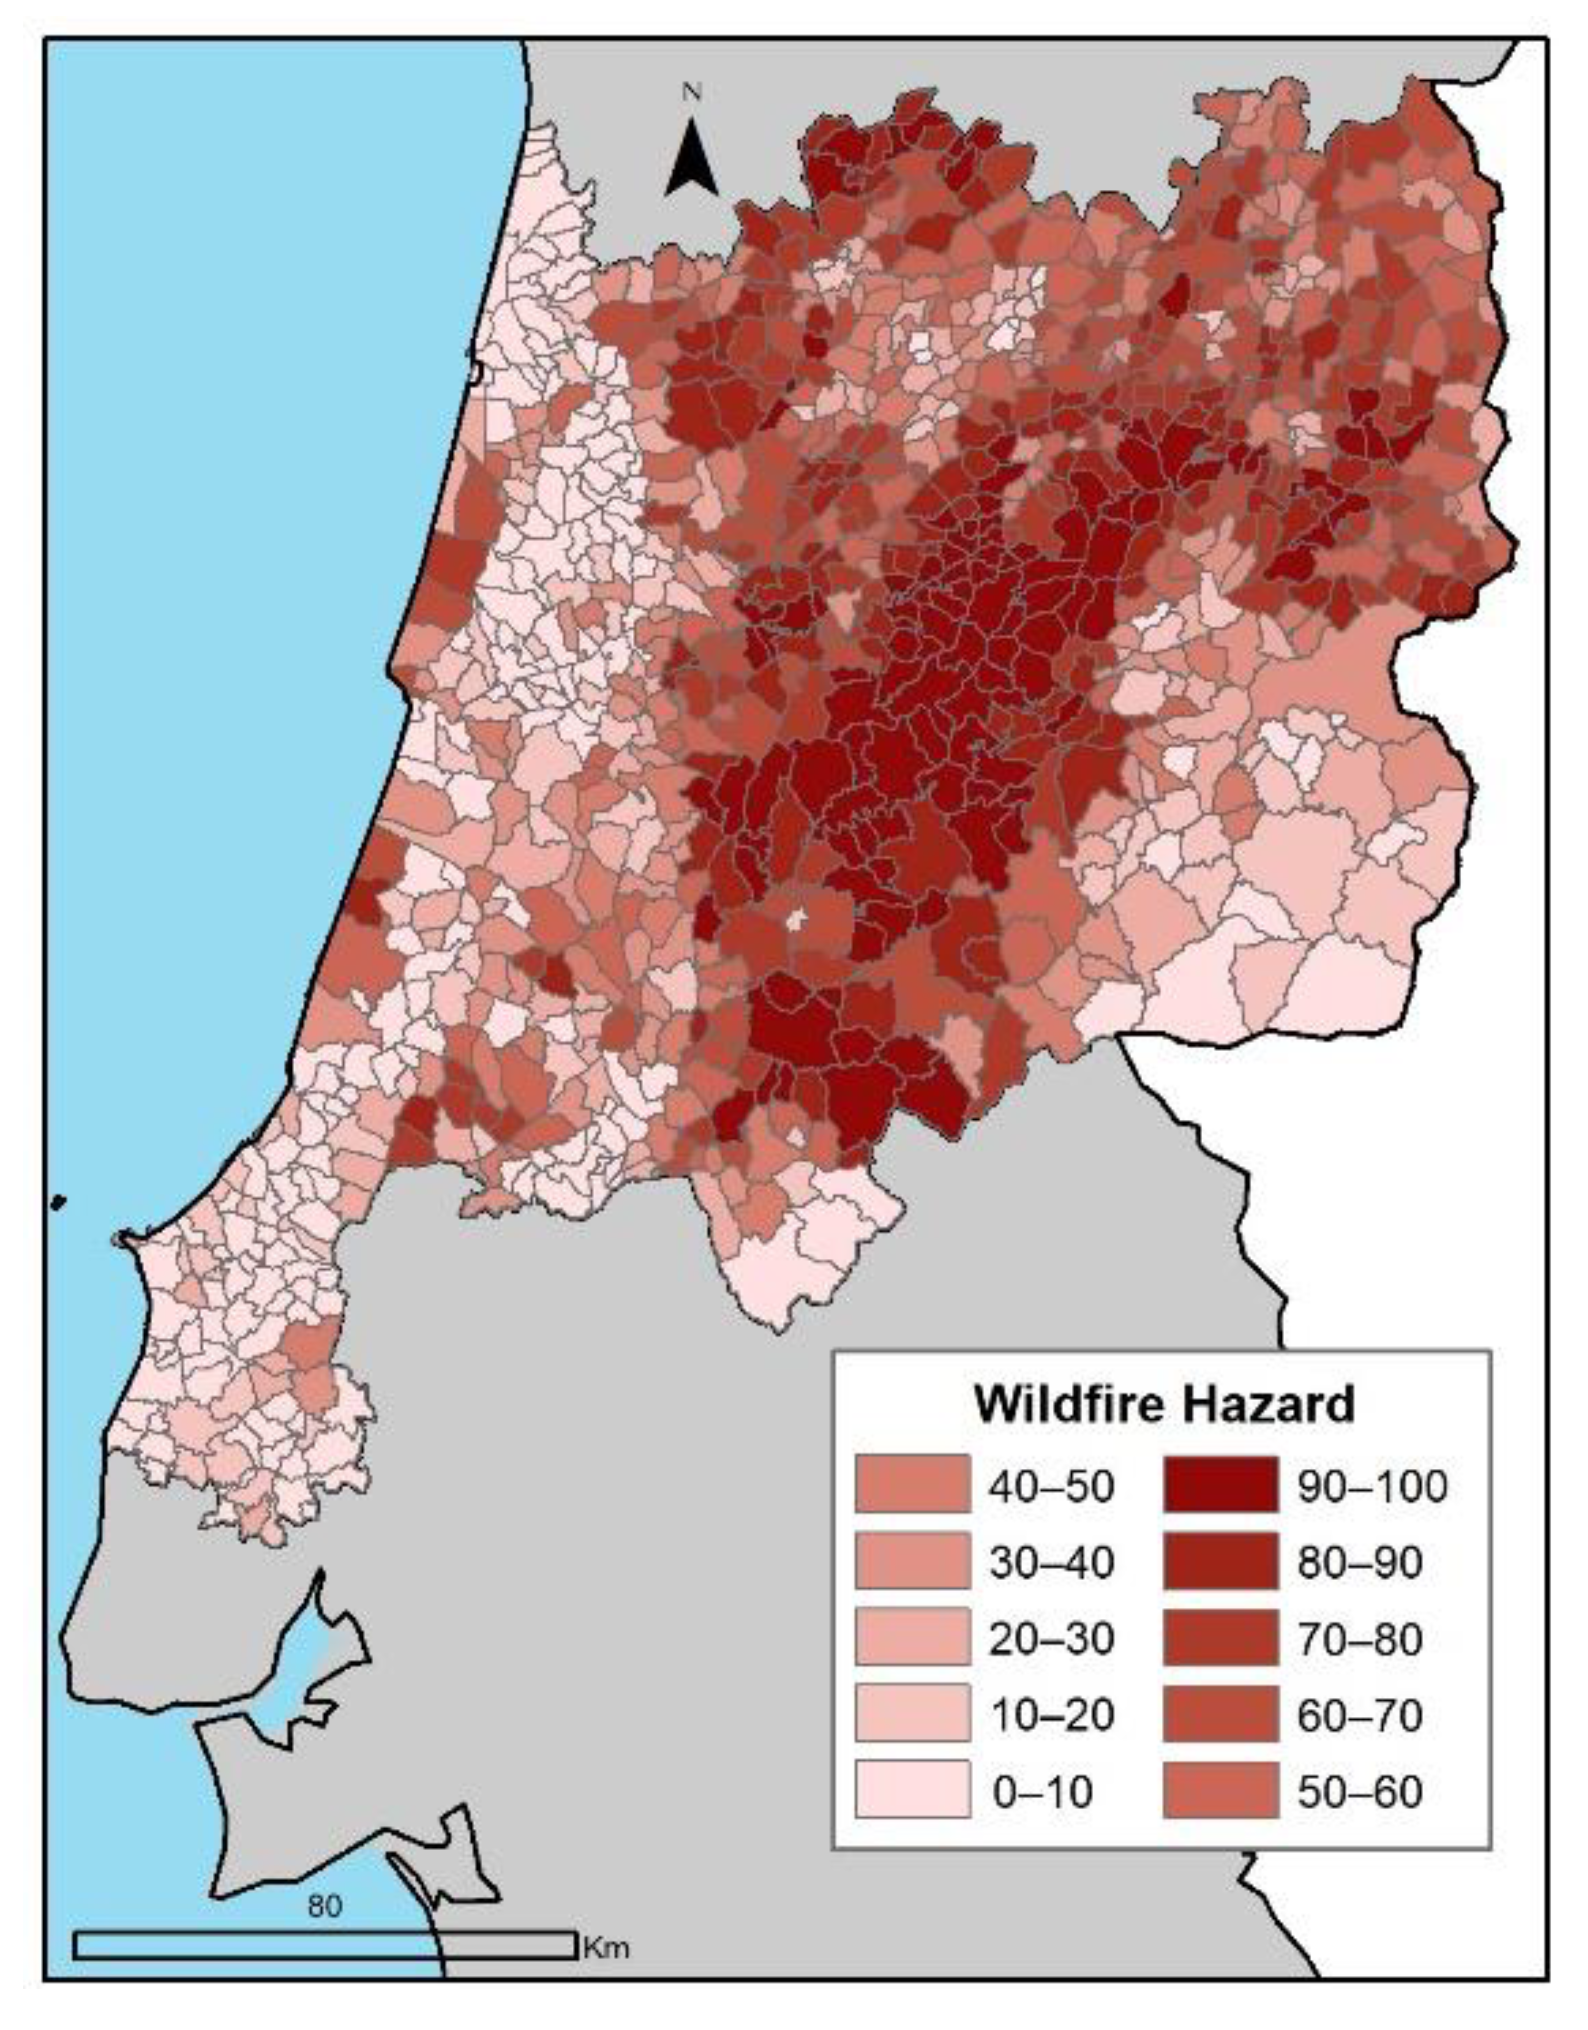
Finally, wildfire hazard was quantified for each of the 972 parishes as the percentage of the parish area classified in the two highest hazard classes (Figure 5).

2.2.2. Exposure

We approached this dimension of wildfire risk in terms of two complementary sub-components. The first was the existing number of inhabitants and residential buildings in each parish, and thus exposed to potential damage. The second was related to the spatial pattern of human occupation and expresses the degree to which the inhabitants and buildings in each parish are located outside the boundaries of the consolidated urban area (or the central area of villages and towns). The underlying assumption is that the degree of exposure of a parish increases with the increasing spatial dispersion of buildings and people within the parish, as this spatial pattern reflects a stronger intermix between urban features and forest/natural areas. Urban areas were defined by extracting all areas classified as artificialized from the Portuguese government’s 2018 Land Cover Map (Carta de Ocupação do Solo, produced by the Directorate-General of the Territory), with the exception of roads. Individual residential buildings were obtained in the form of a point dataset from the Geographical Database of Buildings (Base Geográfica de Edifícios), produced by Statistics Portugal (Instituto Nacional de Estatística, 2011).
Residents in each building were estimated using the approach employed by Garcia et al. [52]. Knowing the number of lodgings within each building (included in the Geographical Database of Buildings) and the number of residents within each statistical subsection (the smallest spatial statistical unit for which data are available; obtained from Statistics Portugal, 2011), we estimated the average number of residents within the lodgings of the buildings in each statistical subsection. As an example, if a statistical subsection has a total of 100 residents and 20 lodgings, each lodging will have on average 5 residents. If a building within that statistical subsection has 3 lodgings, this building will be estimated to have 15 residents.
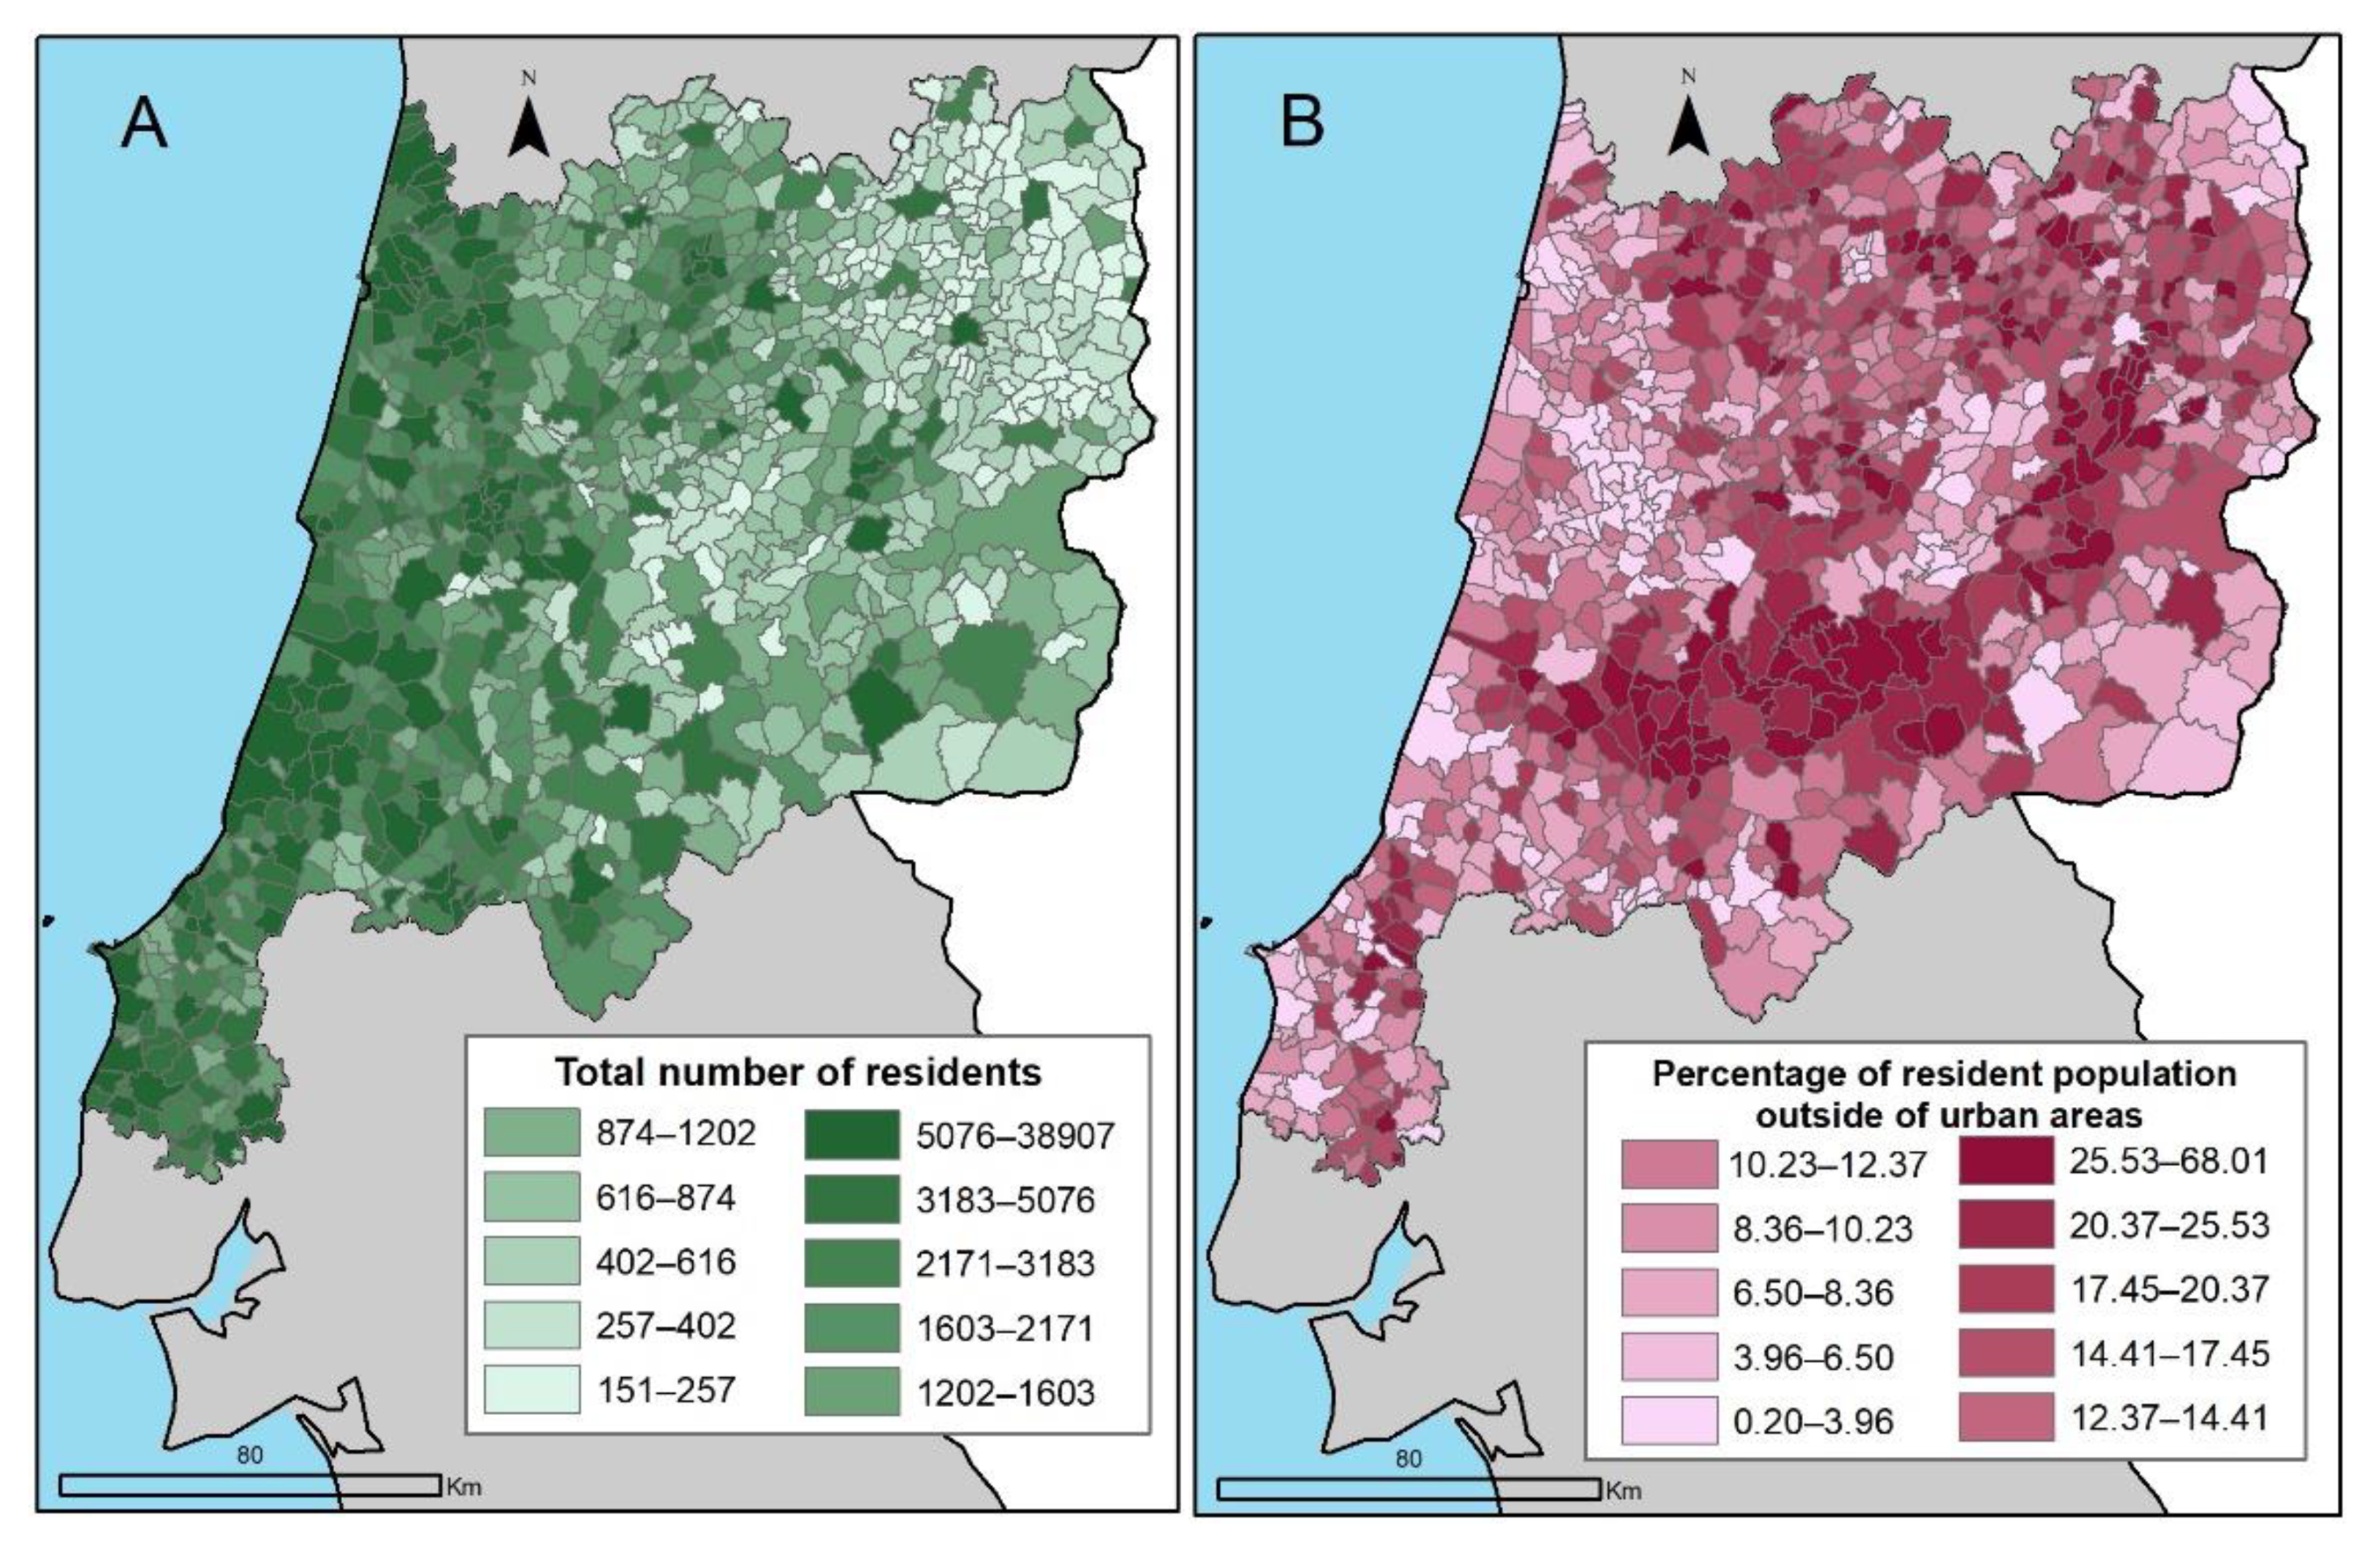
Using this approach, a total of ten variables were calculated for each of the 972 parishes as potential descriptors of the two components of exposure identified above: the total number of residents, the number of residents within urban areas, the number of residents outside of urban areas, the difference between the numbers of urban and non-urban residents, the percentage of total residents outside of urban areas, and the same five variables calculated for buildings instead of residents. A Pearson correlation analysis was then performed to understand the relations between all variables (Table 1). Values confirmed the two components of exposure and their mutual independence: the quantity of residents and buildings exposed (values highlighted in light grey in Table 1) and their degree of dispersion outside the urban area (highlighted in dark grey). Based on the collinearity between variables, two final variables were selected to express exposure for each parish: the total number of residents (Figure 6A), and the percentage of the total residents outside of urban areas (Figure 6B).
To combine both variables into one, each was normalized to the scale 0–1 using the min-max technique. Following this technique, each value x of a variable j with minimum value Minj and maximum value Maxj is re-scaled into xres using the formulation:
Xres = (xMinj)/(MaxjMinj)
After both variables had been re-scaled, the mean value from both was calculated for each parish.

2.2.3. Social Vulnerability

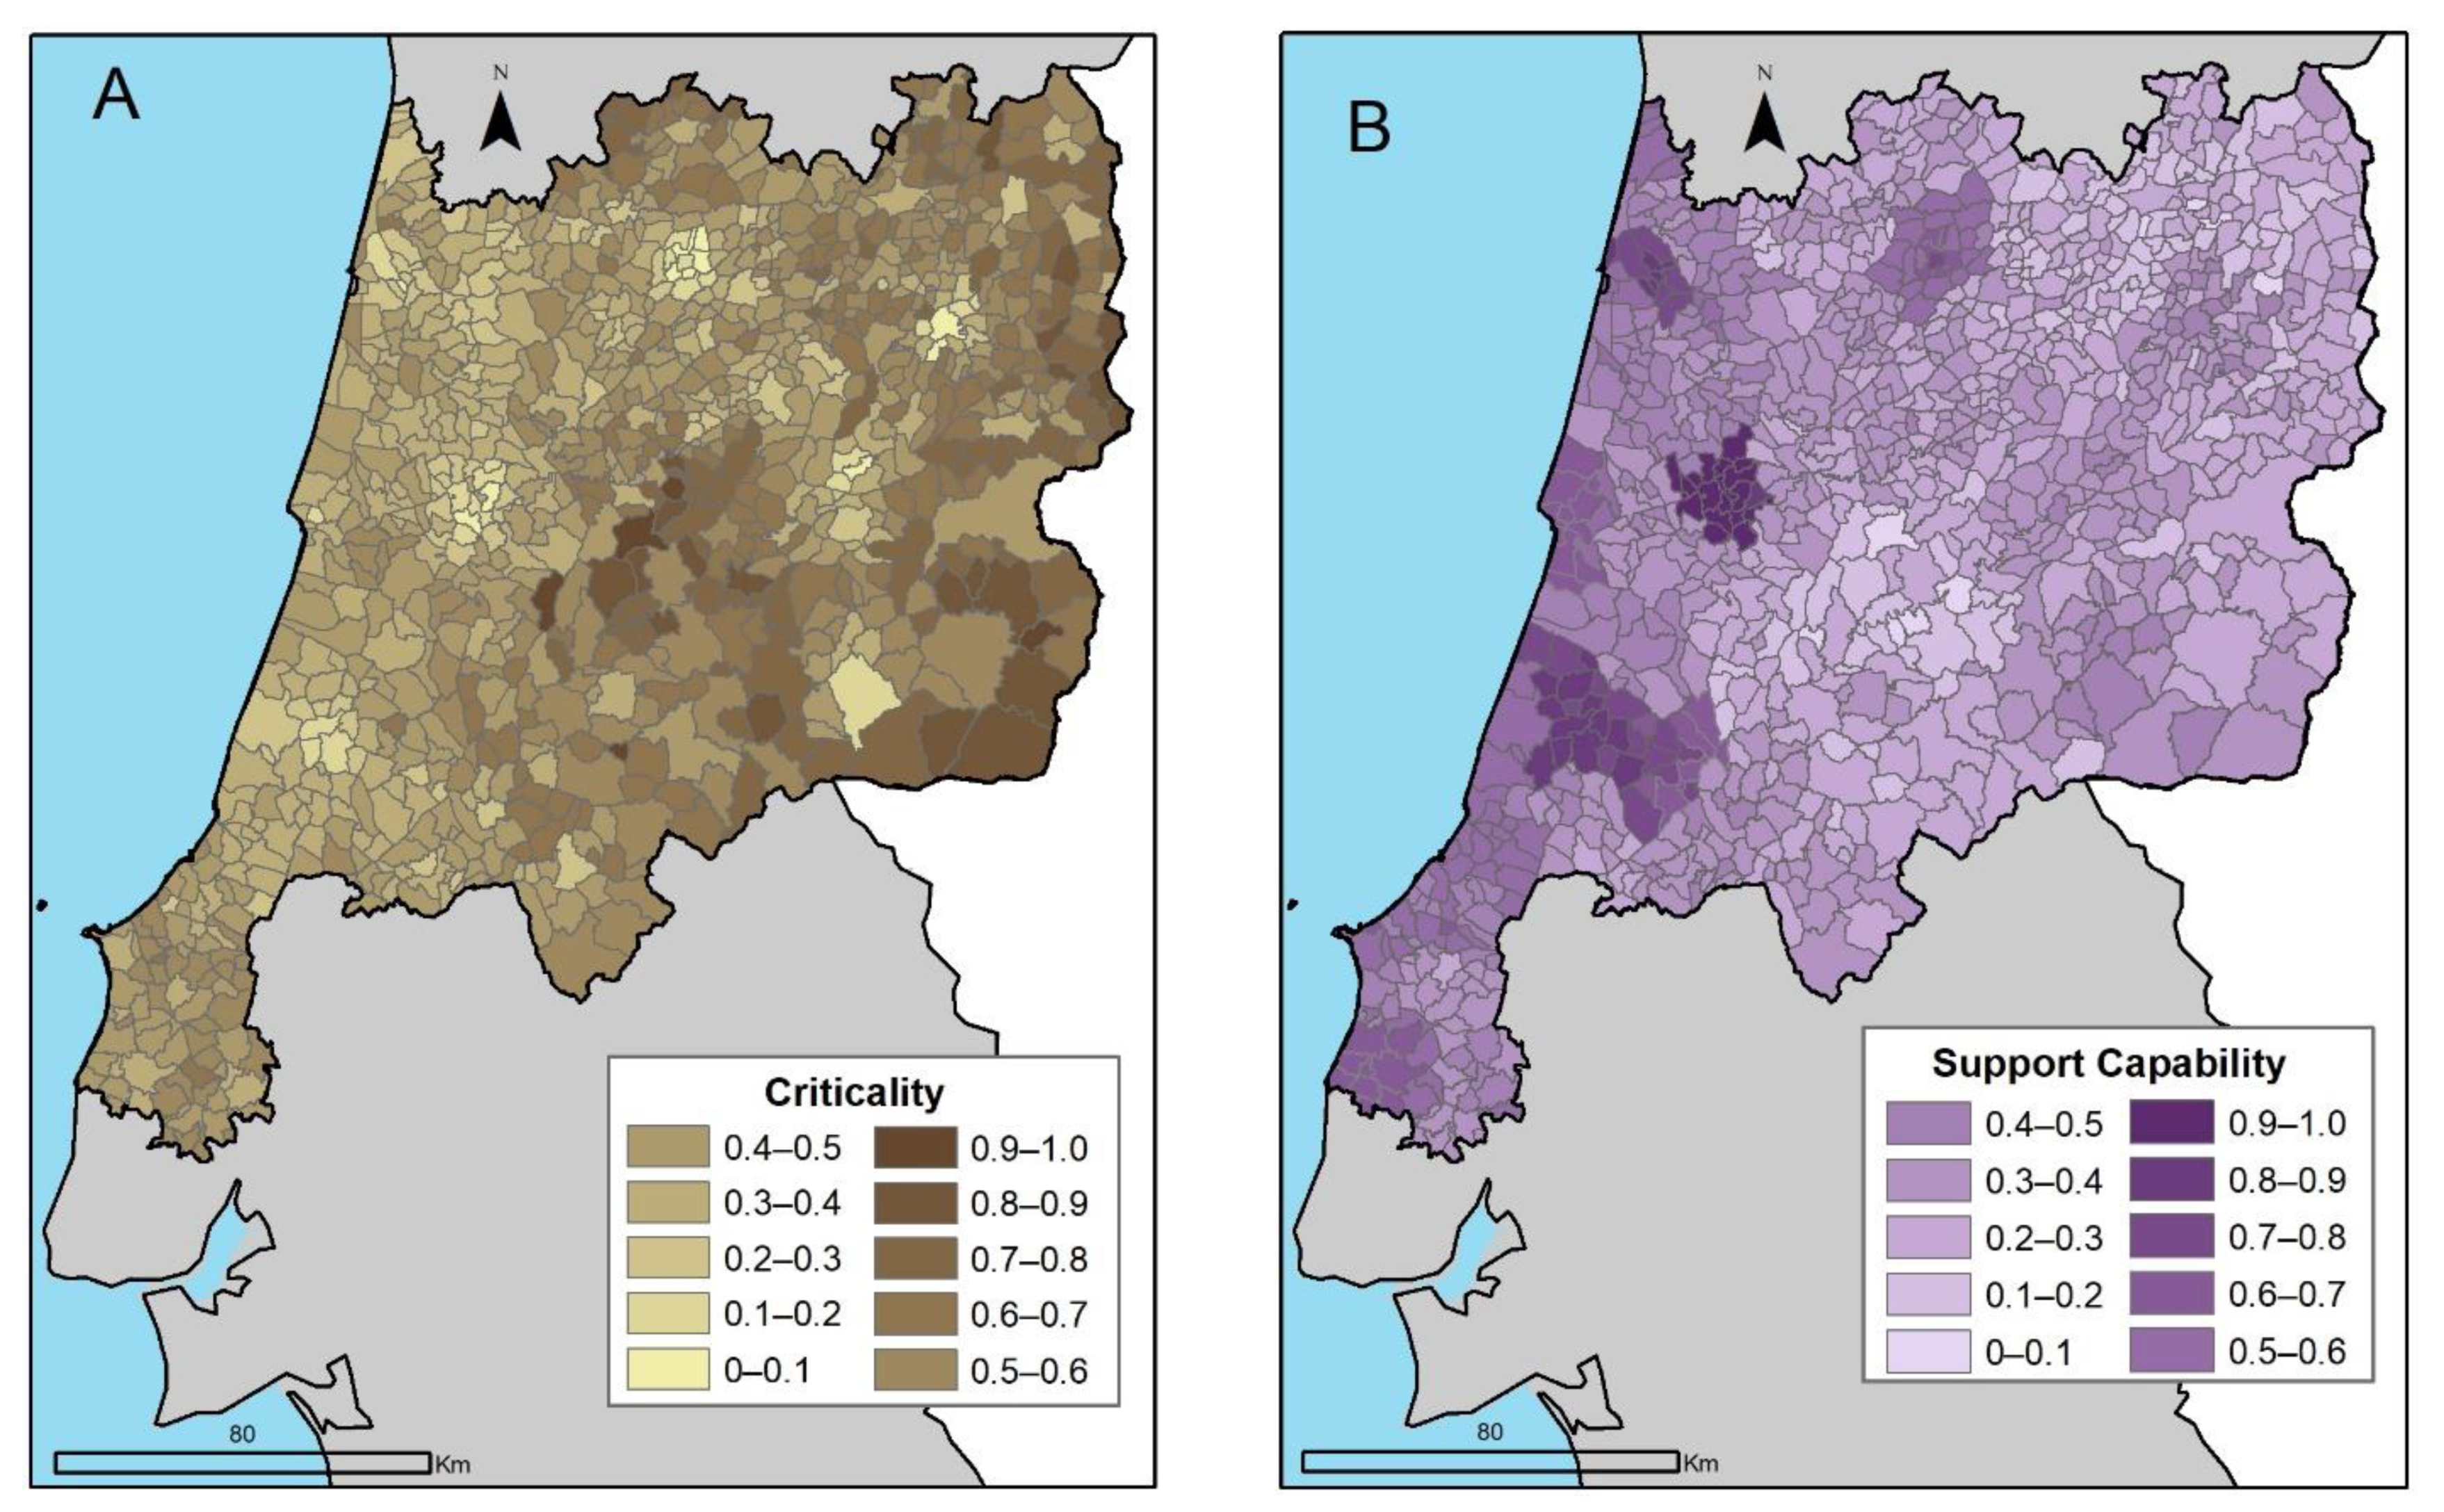
We adopted the social vulnerability methodology originally proposed by Mendes et al. [53] and further developed and applied at different spatial scales by Tavares et al. [54] and Mendes et al. [33]. This approach defines social vulnerability in terms of two dimensions: criticality and support capability. Criticality expresses individual characteristics that are related to vulnerability and to the potential for recovery (for example age, employment, housing conditions, and mobility). Support capability describes the collective equipment and infrastructure (whether public or private) held by a particular territory that contribute to the contingency of activities, the collective and individual recovery and rehabilitation, and the consequential decrease in the impact caused by a disastrous event [45].
Principal Component Analysis (PCA) was employed for the quantification of both dimensions. This technique has often been applied to social vulnerability with the purpose of reducing a relatively large set of potentially influencing variables into a smaller set of underlying dimensions [32,54,55,56].
Criticality was defined using an initial set of 25 variables, describing social and demographic characteristics of the population and properties of the built environment (Table 2; conceptual justification is shown in Table A1). All were obtained from the most recent national census (2011) at the scale of the individual parish. All values were standardized prior to use in the analysis. PCA allowed to extract 6 principal components (PC) from 20 variables out of the initial dataset, with a KMO (Kaiser-Meyer-Olkin) value of 0.874 and explaining 73% of the total variance. Support capability was defined from an initial dataset of 14 variables, obtained from different sources and varying in spatial scale from the parish to the municipal level (Table 3; conceptual justification is shown in Table A2). All were standardized prior to use. Of the initial 14-variable dataset, 11 variables were used to extract 4 PC, with a KMO of 0.773, and explaining 67% of total variance.
For each of the two dimensions of social vulnerability, the extracted PC were interpreted, and any necessary changes were made to the cardinality of the PC scores. Each parish’s criticality was quantified as the sum of its scores in each criticality PC, weighted by its proportion of explained variance. Similarly, each parish’s support capability was defined as the sum of its scores in each of the four PC describing this dimension, weighted by the proportion of variance explained by each. The values of both dimensions were re-scaled to 0–1 using the min-max technique Equation (3) (Figure 7).
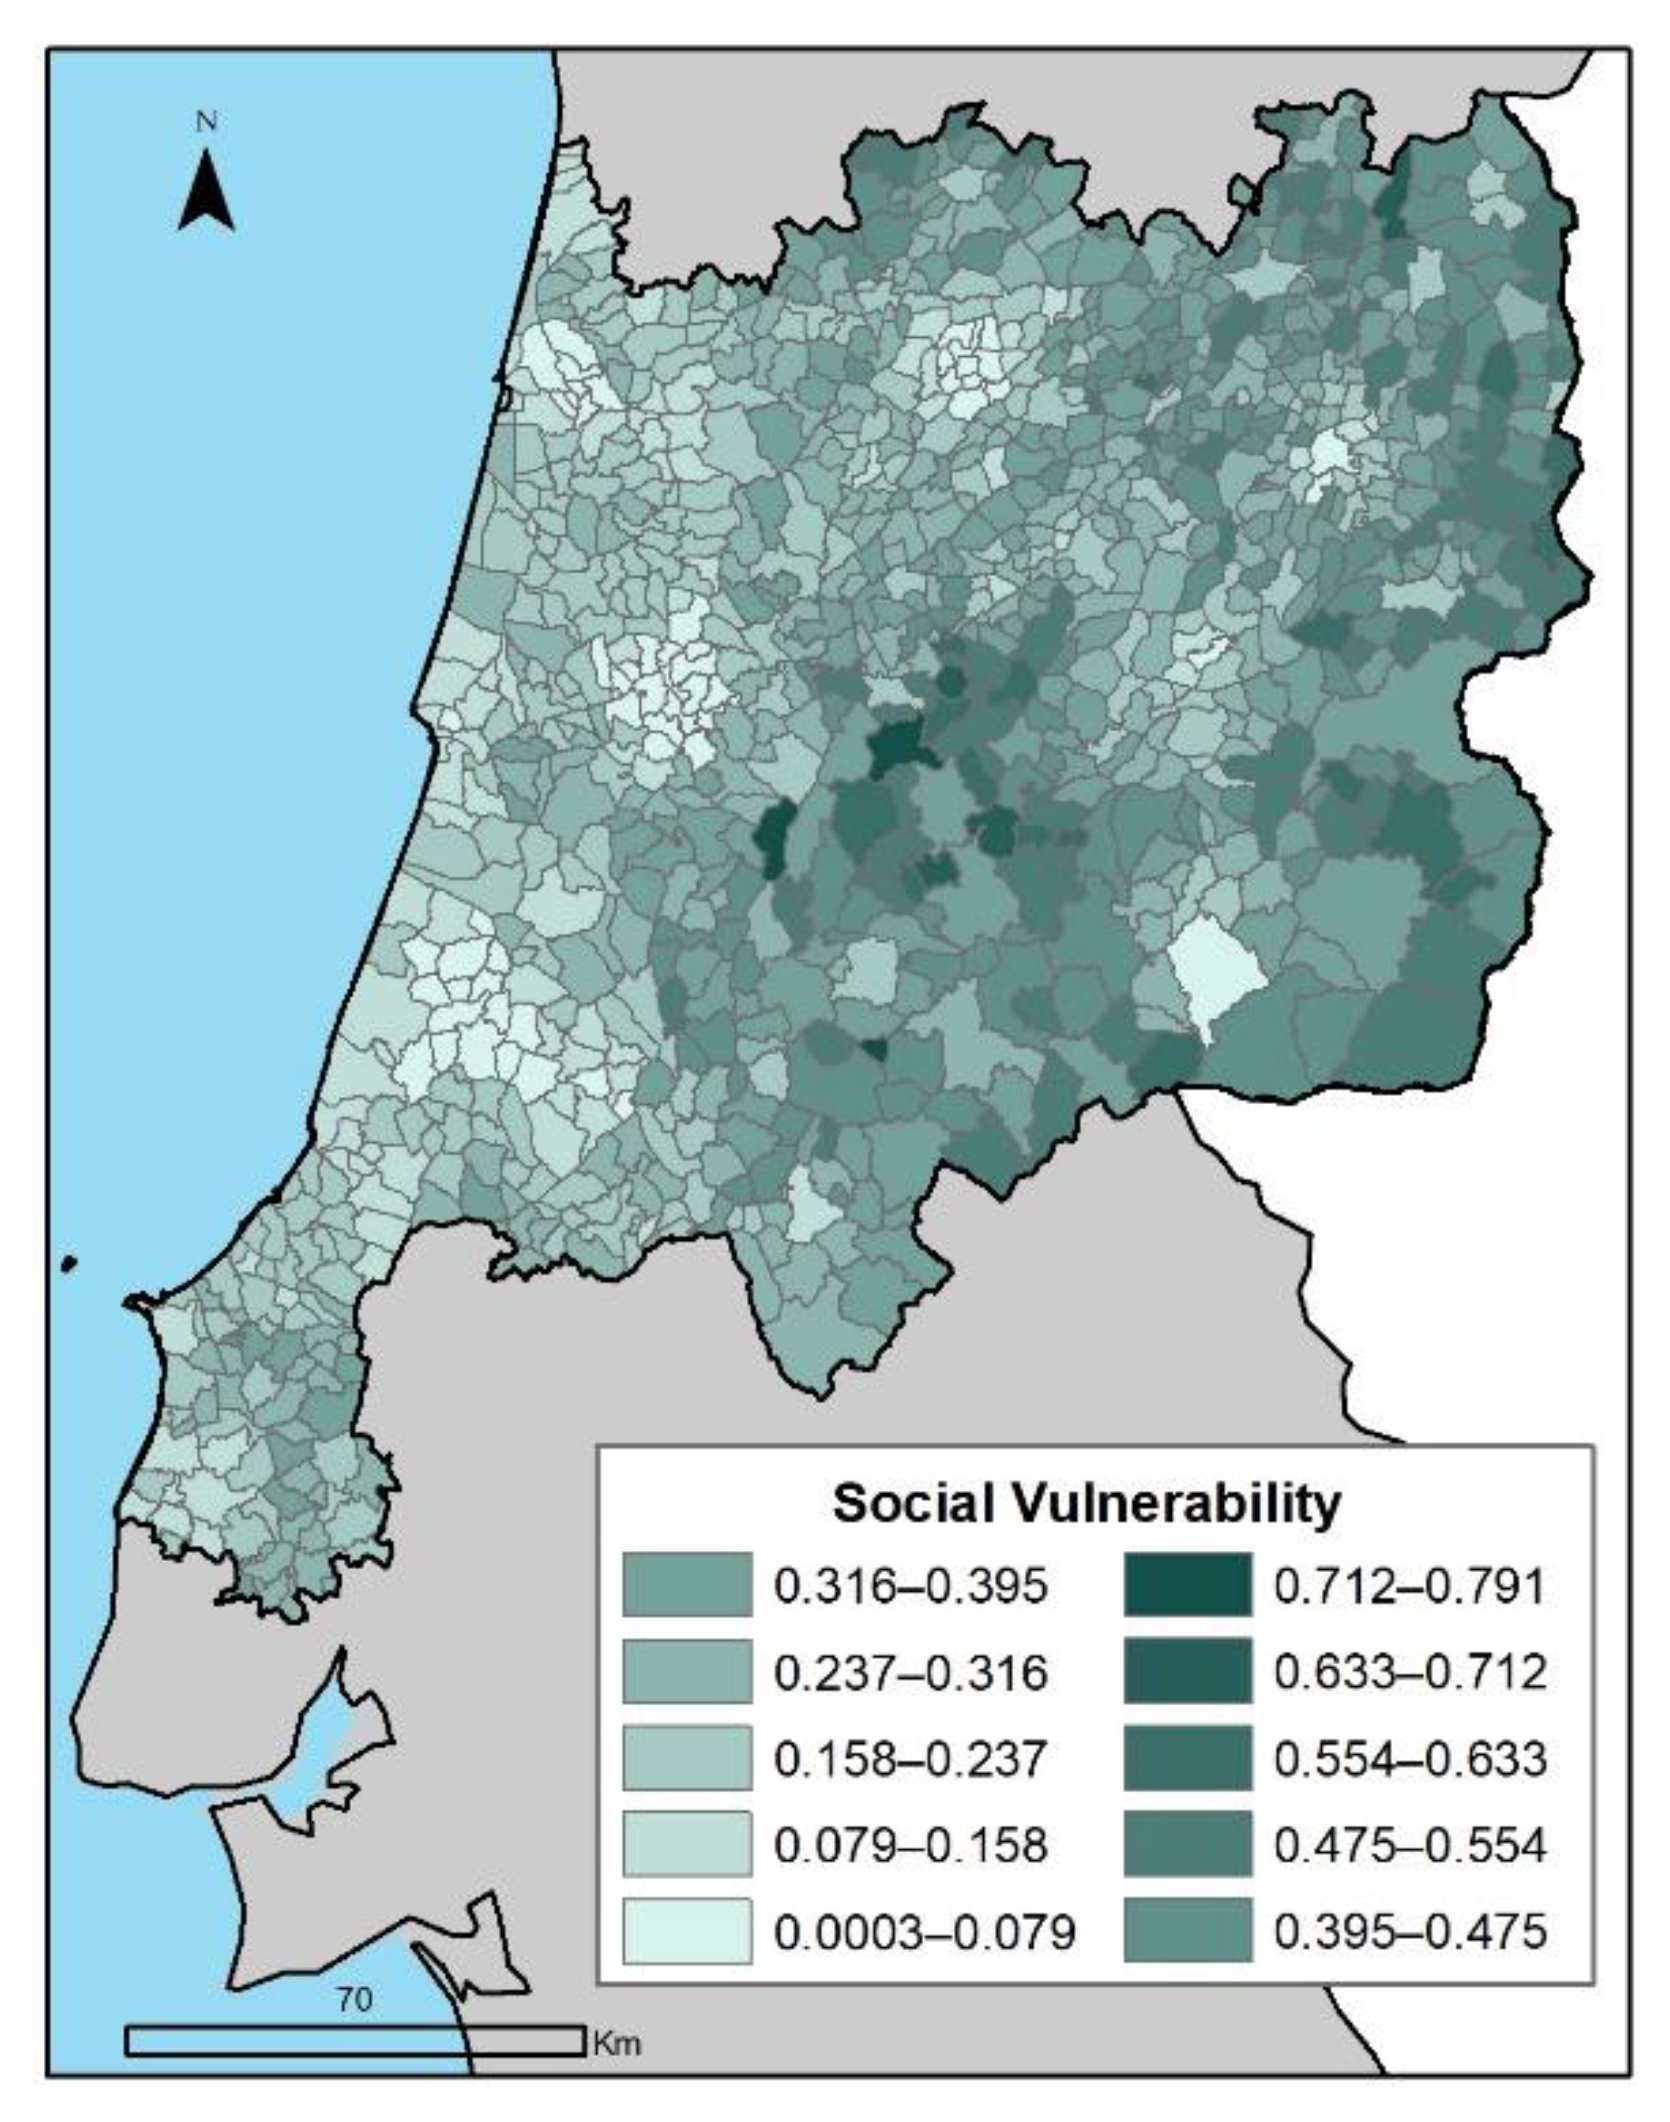
Finally, social vulnerability (SV) was calculated for each parish by integrating its values of criticality (CR) and support capability (SC) using formulation (4) [45,54]. This formulation ensures that high values of criticality and low values of support capability will result in increased social vulnerability (higher value):
SV = CR × (1 − SC)
The spatial distribution of the resulting values is shown in Figure 8.

2.2.4. Wildfire Risk Index

Following the adaptation of the INFORM methodology [39] employed in [45,46], the three components of wildfire risk were re-scaled to values between 0 and 1 using the min-max technique Equation (3). It should be noted that both sub-components of exposure had already been individually re-scaled (see Section 3.2) prior to their combination by averaging. As the final values varied only between 0.005 and 0.507, they were re-scaled to have equal range of variation to the hazard and social vulnerability values.
Finally, the three components hazard (H), exposure (E) and social vulnerability (SV) were combined into the final wildfire risk index (WRI) using the formulation [39,45]:
WRI = H1/3 × E1/3 × SV1/3
In practice, the result corresponds to the geometric average of the three dimensions, with equal weights [39]. As Pereira et al. [46] noted, the exponentiation of the factors to 1/3 allows to highlight the differences among parishes, especially the ones with lower scores, while keeping their ranking/hierarchy.
It is worth noting that, given the multiplicative structure of the formula, any null value in any of the three components would result in a parish having null wildfire risk. To avoid such an outcome, all null values in each driver were converted to a positive, albeit insignificant value. To do so, the smallest positive value among all three components was determined (0.00005 for wildfire hazard). Then, each null value in each component was replaced by a value lower than the lowest positive value in that dimension by a unit of this same order of magnitude (0.00001).

2.2.5. Cluster Analysis

Hierarchical cluster analysis was performed on the 972 parishes with the purpose of aggregating them into homogeneous groups regarding the three main risk components of hazard, exposure, and social vulnerability. This approach was previously applied to landslide and flood hazards [45,46]. Clustering was performed using SPSS (IBM Corp., Armonk, NY, USA) and following Ward’s method, with squared Euclidian distance as measure of distance between cluster centres. This clustering method consists of a bottom-up approach, in which the criterion for selecting the pair of clusters to merge at each step is based on the minimum increase in the total within-cluster variance. The range of solutions tested varied from 2 to 10 clusters. The optimal number of clusters was evaluated through Schwarz’s Bayesian Criterion (BIC), the Akaike Information Criterion (AIC) and expert judgment. The BIC suggested 2 clusters and the AIC 4 clusters. The 2-cluster solution was considered not to describe adequately the diversity of combinations between the three risk components within the study area. The 4-cluster solution enabled a better representation of the wildfire fire risk profiles. However, it grouped too broadly all the parishes with high hazard in the same cluster (356 cases out of 972 in cluster 3), instead of differentiating among them. A 5-cluster solution was therefore chosen, allowing for a more nuanced perspective over the variability of wildfire risk patterns in the study area.

3. Results

3.1. The Dimensions of Wildfire Risk

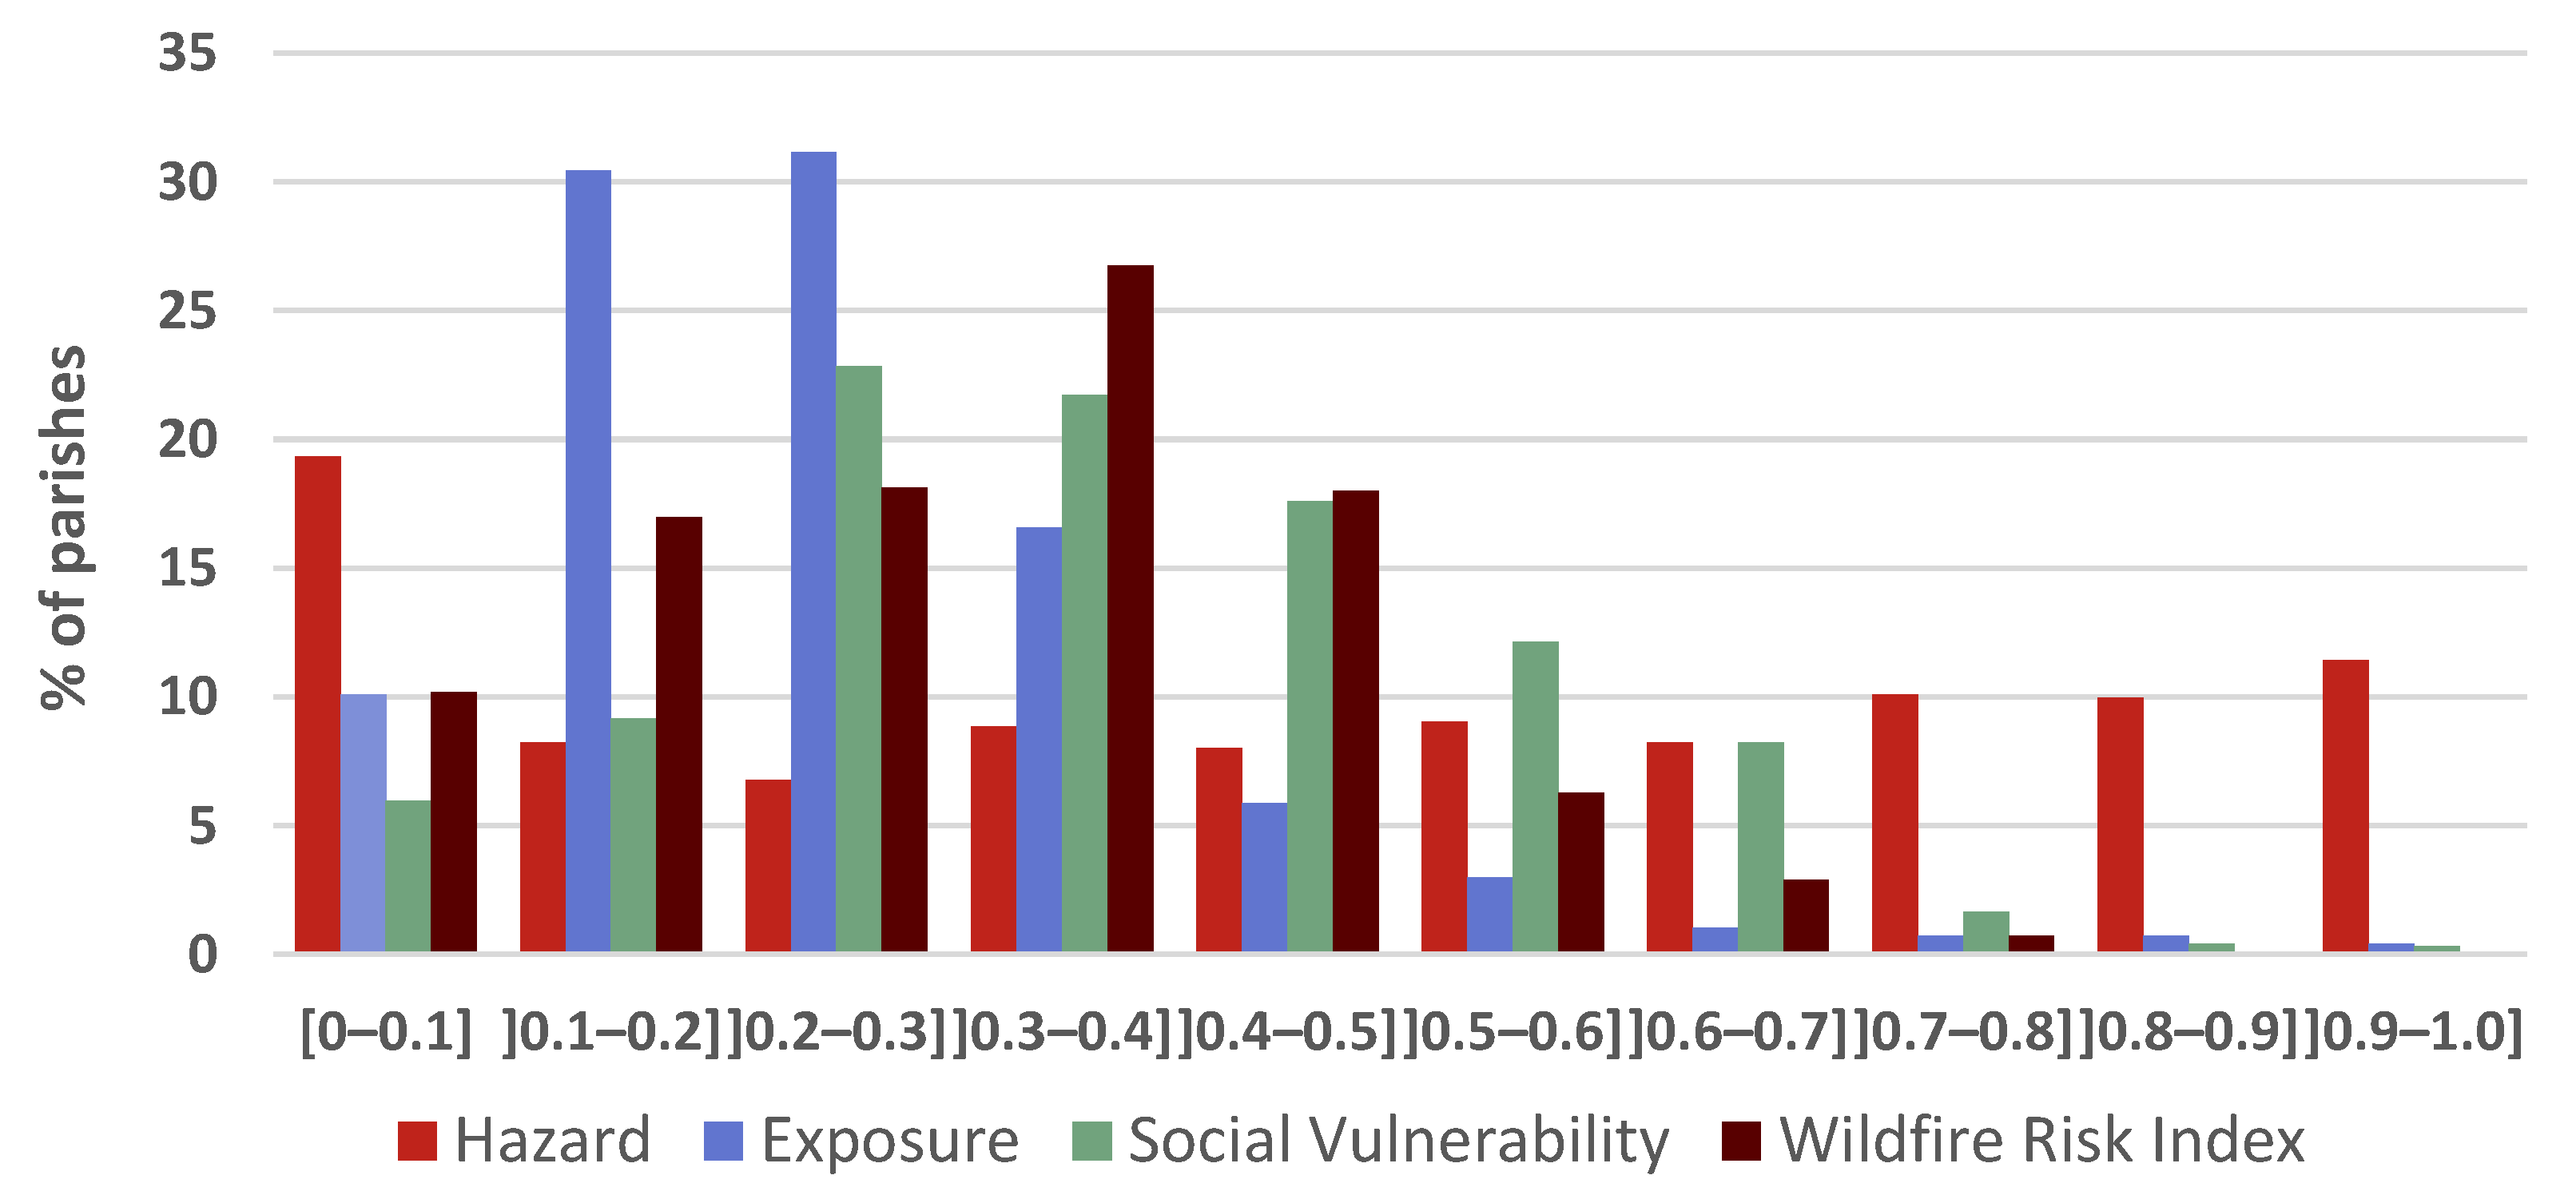
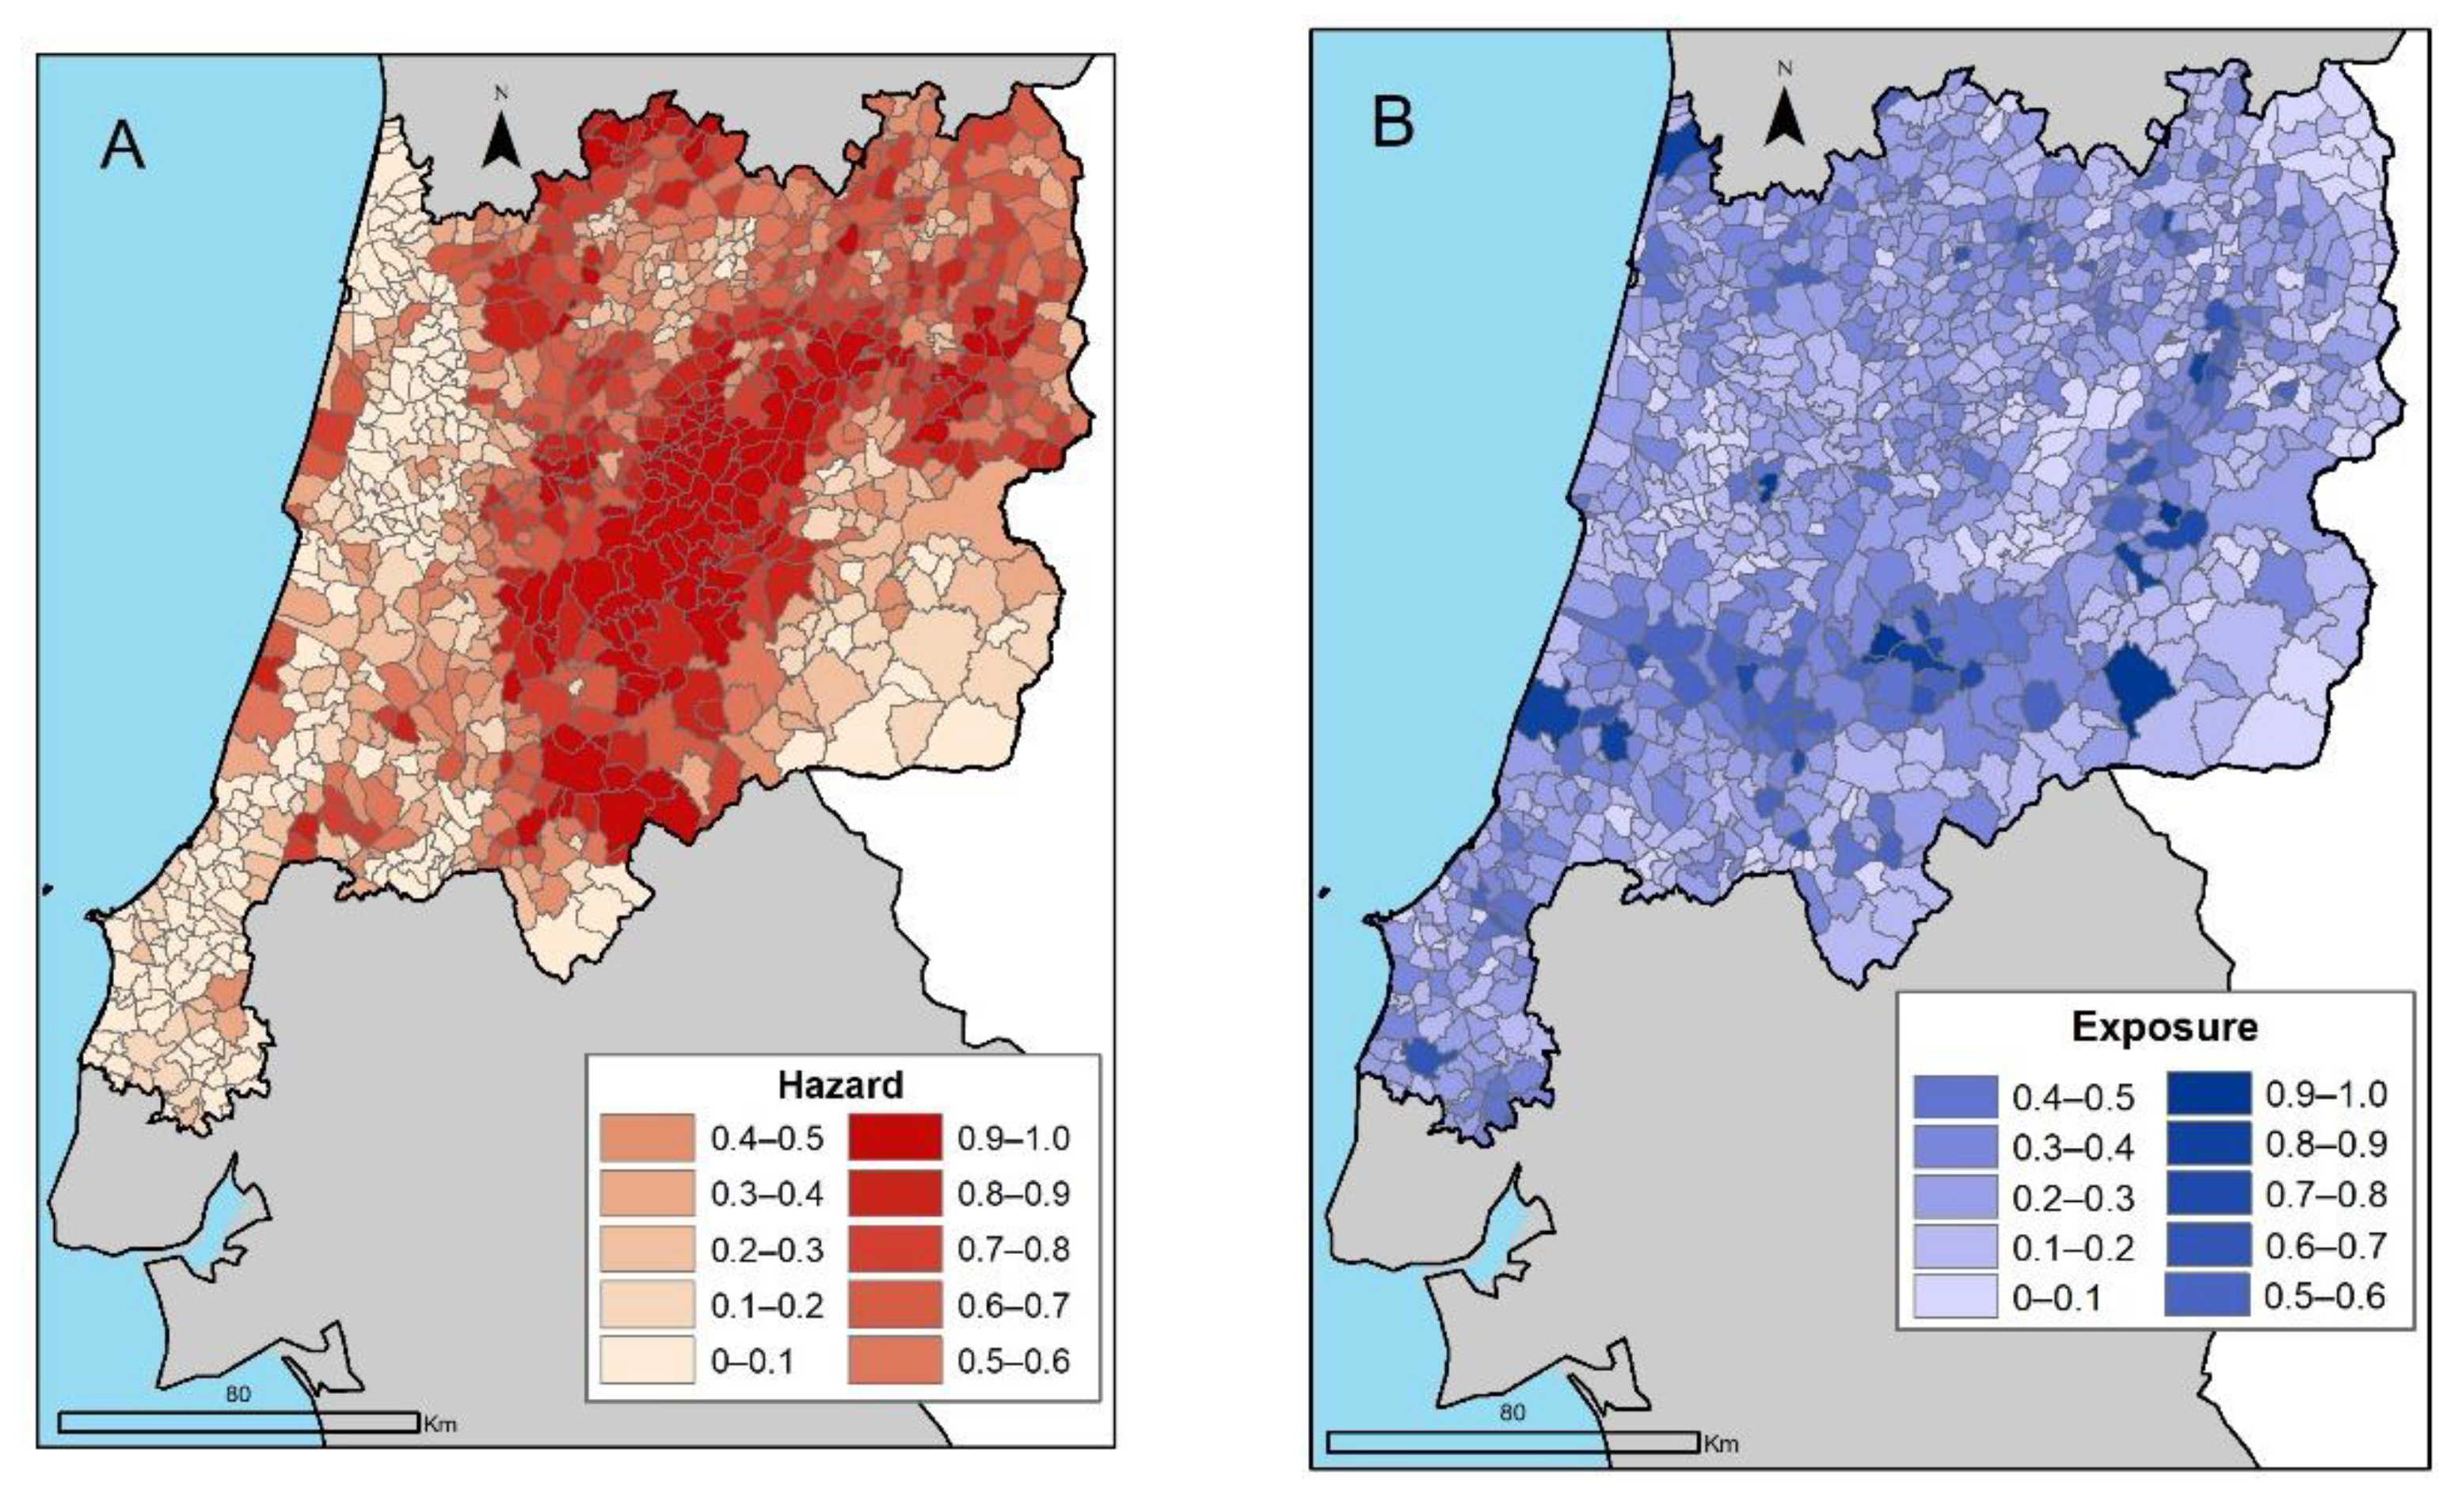
Parish-aggregated wildfire hazard, representing the percentage of parish area with high and very high hazard levels, varied between 0 (23 parishes) and 100% (2 parishes), with a mean value of 47.62%. The frequency distribution of the values (Figure 9) shows a remarkable contrast with the other dimensions of the wildfire risk index, with hazard values strongly deviating from a normal distribution (kurtosis = −1.34). The relative abundance of parishes with very low and very high hazard can be seen across the study area in Figure 10A. The highest values occur within the central, N, and NE sectors of the study area. The central sector is homogeneously characterized by very high values, whereas the N and NE sectors show more variability. In contrast, the western and SW portions of the study area, as well as its extreme southern limit, are characterized by mostly low wildfire hazard values. Few parishes along the seacoast show high wildfire hazard, in contrast with the predominantly low levels that dominate that sector of the study area. As expected, the spatial distribution of wildfire hazard follows closely that of its input factors, namely elevation (and its derivative slope) (Figure 1A), land cover (shown for 2018 in Figure 1B) and wildfire probability (proportional to the wildfire recurrence map in Figure 1C).
Exposure values vary between 0.005 and 0.507, with a mean value of 0.132. The frequency distribution is positively skewed (skewness 1.63) and strongly leptokurtic (k = 4.42) (Figure 9). Correspondingly, the spatial distribution of this variable is marked by a predominance of relatively low values (Figure 10B), with the parishes with highest values forming a narrow arch along the southern sector of the study area. In contrast, the eastern limit of the study area is marked by homogeneously low values. The maps of the two input variables behind exposure show contrasting patterns. The total number of residents per parish is highest along the coast, diminishing inland, whereas the percentage of resident population living outside of urban areas shows a concentration of high values, elongated from W to E in the southern sector of the study area (Figure 6B). The centre-north and northeast sectors have a heterogenous combination of parishes with high and low exposure levels, whereas the parishes along the seacoast show homogeneously low values. The averaging of these two contrasting maps generates a final exposure map showing predominantly low values and little spatial contrast (Figure 10B).
Regarding the two dimensions of social vulnerability, the results of the principal component analysis allowed to interpret the driving components of criticality (Table 4), by order of importance, in the following manner: PC1—social and demographic dynamics (31.18% of all variance explained); PC2—professional qualification and urban/rural contrasts (11.81%); PC3—uprooting and long-term mobility (8.41%); PC4—conditions of the built environment (8.15%); PC5—habitational conditions (7.02%); and PC6—daily commuting (6.83%). The final values varied between 0.007 and 0.953, with a mean of 0.463. The distribution is slightly positively skewed (skewness 0.164) with nearly null kurtosis (k = 0.08). The corresponding criticality map (Figure 7A) shows a clear spatial tendency, with values generally increasing from the seacoast to the interior, and the highest values occurring in the easternmost limit of the study area, as well as in a small cluster of parishes in its centre-south. This distribution implies a general increase in the individual and household-level potential for loss and a decrease in the potential for recovery as one progresses from the seacoast inland, resulting from characteristics such as an ageing (AGE) and less educated population (ILLIT), and a larger proportion of elderly people leaving alone (SING65). Likewise, characteristics such as a larger proportion of smaller residential buildings (FLOORS) and single-accommodation buildings (SINGACCO), or a larger proportion of seasonally used homes (SEASON) contribute to more isolated households and make mutual aid more difficult (Table 4).
With respect to support capability, four principal components were extracted, which can be interpreted in terms of their effect over the capacity to resist and recuperate from disaster, by decreasing order of importance (Table 5): PC1—economy and emergency resources (30.90% of variance explained); PC2—existing infra-structure (14.42%); PC3—quality of the habitational setting I (10.64%); and PC4—quality of the habitational setting II and accessibilities (10.62%). The final values varied between 0.084 and 0.959, with a mean of 0.400. The elevated positive skewness (1.41) and kurtosis (2.35) imply that most of the study area is characterized by a relatively low support capability (Figure 7B), with the lowest values occurring in a rather dispersed pattern in the centre-south and the SE sectors. In contrast to the prevailing pattern, the parishes along the seacoast show relatively high values, with some well-defined agglomerations of contiguous parishes with similar values. It should be noted that some of the variables used for quantifying support capability were only available at the municipal scale (Table 3), which may account for this pattern. A reflection on the principal components used to quantify this dimension of social vulnerability (Table 5) indicates that it is among the more urbanized (ROOMS, URBWAST, RESOUT, ROAD), economically dynamic (GVA, MEDSALEV, REPDEGR, AGEBUILD) seacoast parishes, with their relative abundance of services and infrastructure (FIREF, NURSES, WHEELCH) that the capacity to reduce the impacts of wildfires and to recover and rehabilitate in their wake are highest.
The integration of criticality and support capability allowed to obtain a distribution of values of social vulnerability varying from 0.0003 to 0.791, with a mean of 0.291 (Figure 8). The distribution is slightly positively skewed (0.275) with a slightly negative kurtosis (−0.133). It was rescaled from 0 to 1, similarly to the other components of wildfire risk. The spatial distribution of the final values (Figure 10C) shows two essential patterns. The coastal and centre-north sectors are characterized by parishes with relatively low social vulnerability, some forming homogeneous clusters. Contrarily, the parishes in the eastern and centre-south sectors are characterized by a predominance of fairly high social vulnerability, with a few dispersed parishes showing the highest values.

3.2. Wildfire Risk Index

The final wildfire risk index varied between 0.005 and 0.839, with a mean value of 0.308. The distribution is slightly positively skewed (skewness = 0.18) with a slightly negative kurtosis (k = −0.247) (Figure 9). Although the formulation of the index takes into equal consideration its three components, the final values are more closely linearly correlated to hazard (p = 0.801) than to exposure or social vulnerability (0.408 and 0.671, respectively; all correlations are significant at the 0.01 level). The spatial distribution of the values (Figure 10D) suggests four main spatial patterns. The first characterizes the coastal region and is marked by the dominance of low to very low-risk parishes, with occasional isolated parishes with higher values in the middle range. The second pattern occurs in the centre-south of the study area and is marked by a homogeneous concentration of medium to very high-risk parishes. A third pattern can be associated with the centre-north and NE of the study area, where parishes with contrasting levels of wildfire risk are distributed in a heterogeneous pattern. Finally, a fourth spatial pattern can be defined in the southeast, the extreme centre-south, and the narrow NE limit of the study area, where there is a relatively homogeneous predominance of medium-to-low risk parishes.

3.3. Risk Profiles and Cluster Analysis

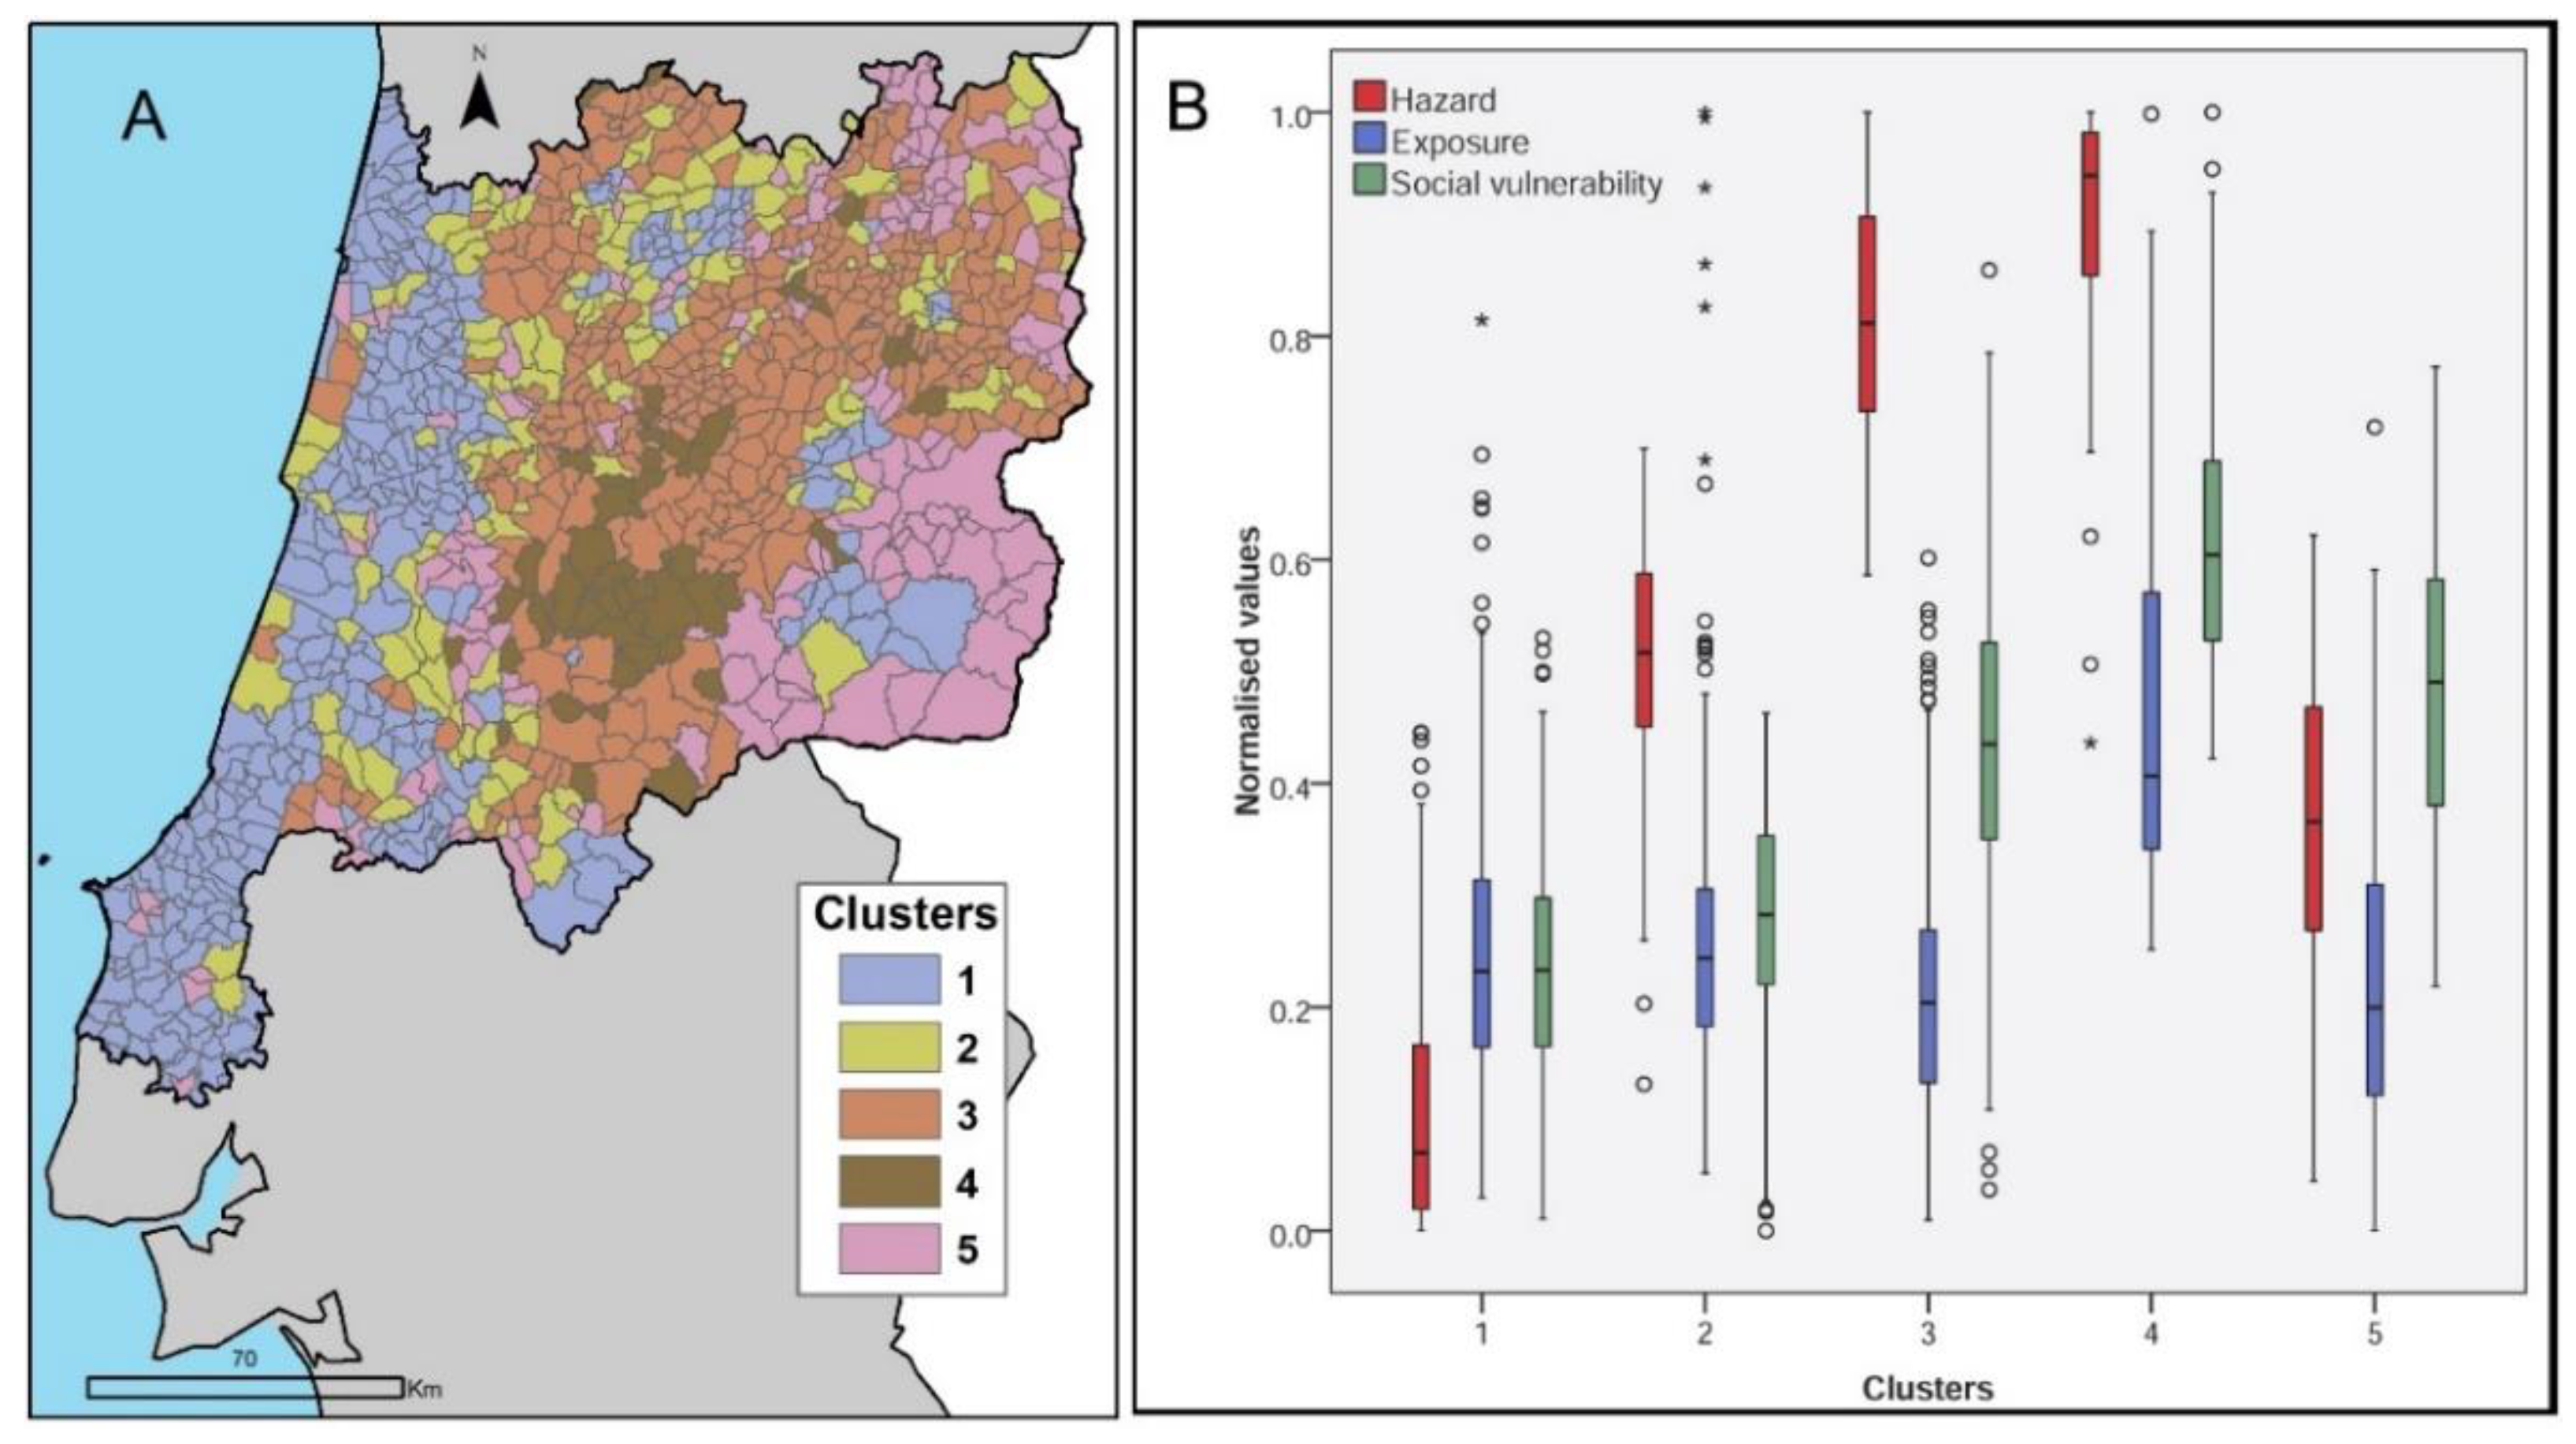
Five clusters of parishes with similar characteristics were identified (Figure 11A). The relations between the clusters and the risk components (Figure 11B) show contrasting degrees of component variability throughout the study area, with wildfire hazard values varying much more than exposure or social vulnerability, which fluctuate to a similar degree. The figure also shows that the relative importance of the components of wildfire risk varies among the five defined clusters, with hazard dominating in clusters 2, 3 and 4, but not in cluster 1 (where exposure and social vulnerability are more relevant) nor in cluster 5 (where social vulnerability is more important).
Cluster 1 includes 306 parishes, and it is the largest, closely followed in size by cluster 3. It is characterized by the lowest average wildfire hazard and social vulnerability values (Figure 11B), having an intermediate level of exposure in comparison with the other clusters. It is spatially distributed on a homogeneous N-S swath along the coastline (Figure 11A), also including a few isolated groups of parishes throughout the study area, namely in the centre-north, the extreme south, and the SE.
Cluster 2 includes 147 parishes. It presents levels of exposure and social vulnerability similar to those of cluster 1, but with a higher wildfire hazard level (Figure 11B). Spatially, it occurs mostly in association to cluster 1 in a broad N-S swath along the coastline, also appearing as a group of parishes in the centre-north (again in association with cluster 1) and more isolated in the NE and SE of the study area (Figure 11A).
Cluster 3 includes 303 parishes, the second largest group. It is characterized by relatively low exposure levels, only surpassed by cluster 5 which has the lowest exposure; it includes intermediate levels of social vulnerability, and relatively high wildfire hazard levels (near to the highest values found in cluster 4) (Figure 11B). Spatially, cluster 3 dominates the centre and NE sectors of the study area, also including a few isolated parishes within the N-S coastal swath dominated by clusters 1 and 2 (Figure 11A).
Cluster 4 is the smallest, including only 53 parishes. It stands out by having the highest values in all the three components of wildfire risk (Figure 11B). Spatially, it occurs mostly as a homogeneous concentration of parishes in the centre-south of the study area, also appearing in isolated manner in the S, extreme N, and NE (Figure 11A).
Finally, cluster 5 includes 163 parishes. It is characterized by relatively low hazard levels (the second lowest, following cluster 1), the lowest exposure levels, and relatively high social vulnerability levels (the second highest, after cluster 4) (Figure 11B). Spatially, it dominates the SE of the study area, with minor concentrations of parishes in the NE and the centre-south, and isolated parishes occurring throughout the study area (Figure 11A).
Regarding the percentage of parishes by main wildfire risk dimension, hazard dominates in 51.7% of all parishes (clusters 2, 3 and 4), with exposure together with social vulnerability dominating 31.5% (cluster 1), and social vulnerability dominating only 16.8% (cluster 5).

4. Discussion

The proposed risk index (Figure 10D) allows for a general and integrative perspective over the spatial patterns and variations of wildfire risk throughout the study area. This perspective is invaluable in a context of regional-level to country-level spatial planning and risk management. However, the applicability and value of this index can only be fully grasped in relation to its hierarchical structure in three increasing levels of detail and specificity: the final integrated level, the level of the individual dimensions of wildfire risk (hazard/exposure/social vulnerability), and the level of their individual sub-components (in the cases of exposure and social vulnerability) (Figure 3). Organizations and individuals responsible for risk management at municipal and sub-municipal scales can implement measures adjusted to the dimensions that influence wildfire risk levels in their areas, avoiding untailored, generalist and less efficient approaches. For instance, a risk manager in a municipal administration can allocate financial and human resources to early detection and suppression of wildfires in hazard-dominated parishes within the municipality (such as those in clusters 2, 3 and 4; Figure 11A), while privileging measures such as the promotion of neighbour support networks or rapid evacuation capabilities in social vulnerability-dominated parishes (such as those in cluster 5). Prior studies have shown the importance of identifying priority measures in exposed areas, regarding fuel and fire management options [28,57], as well as to engage in proactive and collaborative management to prevent wildfire losses [58]. Other studies have shown that people’s characteristics and social context are paramount to understand their perception regarding wildfires, and how it influences their relations with fire occurrence and their ability to apply protective measures [28,59]. Moreover, social context and local conditions are crucial to define suitable mitigation and adaptation strategies to increase communities’ safety and resilience [60,61].
Furthermore, in the case of parishes where the main driving dimensions result from the combination of more than one component (exposure and vulnerability), risk managers can resort to the third level of detail—that of the sub-components—to support their decision-making. For example, it is expectable that similar social vulnerability values among parishes will result in some cases from a particularly high criticality, and in others from a particularly low support capability. A consideration at this third and most detailed level would allow risk managers to focus their policies and measures on the more relevant constituents of the more relevant dimension of risk within each parish.
Regarding spatial scale, the use of the individual parish as unit of analysis allowed for a high level of detail to represent wildfire risk and its dimensions, that can be either directly used or adapted to any level of territorial management. At the municipal level, the results allow risk managers to differentiate parishes within a given municipality, thus informing their planning decisions. At higher levels of spatial planning (e.g., region, association of municipalities), results can be adjusted to a municipal scale of representation, for example by using area-weighted averages of the values of the parishes within each municipality. Our choice of the parish as spatial unit of analysis is in accordance with the considerations put forward by the authors of the Inform index [39], which indicate that the index can be applied at any spatial scale for which information is available. In our case, spatial data was available with a 25 m pixel, and most of the statistical data were available at the parish level. The exceptions were nine of the variables used as input for quantifying support capability, which were only available at the municipal scale (Table 3). Nevertheless, the index can be applied to spatial units of any level: municipal, regional, or national (for multi-country assessments).
A similar consideration can be made regarding temporal scale. Although we employed a structural approach to assess wildfire hazard by using wildfire factors that change only on a multi-year scale [21], the applied wildfire risk methodology could be focused on summer-specific wildfire risk, if summer-specific wildfire hazard data were available. In this respect, this index could be combined with a seasonal approach to wildfire hazard such as that recently proposed by [20].
In parallel to the potential advantages of using this wildfire risk index, some limitations to our approach need also to be considered. The dimension of exposure was expressed using two variables only: total number of residents per parish, and percentage of resident population outside of urban areas by parish, due to the high collinearity with other variables focused on residential buildings. In practice, the first variable quantifies both the number of people and residential infrastructures exposed to wildfires, whereas the second expresses the degree of isolation that these elements are subject to in each parish, adding to their level of exposure. Given the variety of elements that can be at risk within the territory besides people and buildings, our approach excluded elements such as non-residential structures (e.g., cultural, industrial, collective equipment such as hospitals) and economic activities, as well as agricultural lands, forest areas and ecosystems. It also excluded the temporary residents or seasonal visitors that are present only during summertime, when wildfires are more frequent. Future work should be dedicated to diversifying the elements represented within the exposure dimension. A good example in this respect is the HANZE exposure database [62], which included land cover classes and the estimation of their economic value. Further examples are the works of Salis et al. [25] and Thompson et al. [26], in which diverse types of exposed elements (e.g., wildland-urban interfaces, vineyards and orchards, various infrastructure types, areas of ecologic value such as wildlife habitats) are spatially differentiated.
Like exposure, the dimension of vulnerability should also be made more comprehensive in future work. Our approach was focused solely on its social component, and therefore on the characteristics of the residents. Features such as the expected level of destruction of physical structures [63] and land use parcels (e.g., forests), as well as their estimated economic value [30,44] would make the quantification of vulnerability more realistic. Such changes would require the consideration of expected wildfire severity in the methodology, as well as reliable and accessible estimations of the economic value and potential recovery costs of the different elements, which may vary depending on the country or region. Risk is inherently multidimensional, and any application of a risk index will be more effective the more detailed and exhaustive the available data are for each of its dimensions and sub-dimensions.

5. Conclusions

A comprehensive wildfire risk index was proposed and applied to a region in central Portugal. The index was complemented with the division of the 972 parishes studied, by means of cluster analysis, into groups characterized by similar relations between the three wildfire risk dimensions: hazard, exposure, and social vulnerability.
The hierarchical structure of the index, which is based in the INFORM framework, allows approaching wildfire risk management in different levels. At the most generalized, the final index values allow for a general perspective over the distribution of wildfire risk throughout the study area. Results suggest four distinct spatial patterns, with the highest risk parishes being evidently concentrated in the centre-south of the study area, where mitigation measures should be applied first. At the level of the three dimensions of risk, results can inform the decisions of wildfire risk managers, allowing them to more efficiently allocate resources to the major dimension (or dimensions) that are more relevant in each parish. In this respect, the five defined clusters illustrate different risk profiles, with three of them being dominated by hazard (although with values of differing magnitude), and the other two being dominated, respectively, by exposure together with social vulnerability, and social vulnerability only. At the most detailed, sub-dimension level, available only in the cases of exposure and social vulnerability, risk managers can focus their attention on the most relevant factors behind these dimensions, further adjusting policies and measures to the specific reality within each parish.
The proposed index provides an integrated and spatially detailed perspective of wildfire risk that is relevant for disaster risk reduction approaches. It can be easily applied to other study areas, using any spatial unit for which spatial and statistical data are available.

Author Contributions

Conceptualization, R.B., S.O., P.S. and J.L.Z.; Formal analysis, R.B. and P.S.; Methodology, S.O., P.S. and J.L.Z.; Project administration, J.L.Z.; Supervision, J.L.Z.; Writing—original draft, R.B.; Writing—review and editing, R.B., S.O., P.S. and J.L.Z. All authors have read and agreed to the published version of the manuscript.

Funding

This work was financed by national funds through FCT—Portuguese Foundation for Science and Technology, I.P., under the framework of the project “People & Fire: Reducing Risk, Living with Risk (PCIF/AGT/0136/2017), under the programme of ‘Stimulus of Scientific Employment—Individual Support’ (contracts 2020.03873.CEECIND and CEECIND/00268/2017), and by the Research Unit UIDB/00295/2020 and UIDP/00295/2020.

Institutional Review Board Statement

Not applicable.

Informed Consent Statement

Not applicable.

Data Availability Statement

The dataset is available at the Zenodo repository: https://doi.org/10.5281/zenodo.7078455 (accessed on 14 September 2022).

Conflicts of Interest

The authors declare no conflict of interest.

Appendix A

Table A1. Conceptual justification for the variables adopted for expressing criticality.
VariableRelation to Criticality
Illiteracy rate (%)Education is linked to socioeconomic status, with higher educational attainment resulting in greater lifetime earnings. Lower education constrains the ability to understand warning information and access to recovery information [29,32,64].
Proportion of the resident population with university degree (%)
School dropout rate (%)
Proportion of socially more valued professionals (%)Socially valued professions are associated with higher income and education level and are likely to be associated with a greater capacity to resist and recover from wildfire events.
Proportion of single-member families constituted by people with 65 or more years of age (%)Extremes of the age spectrum affect the movement out of harm’s way. Parents lose time and money caring for children when daycare facilities are affected; elderly may have mobility constraints or mobility concerns increasing the burden of care and lack of resilience [32,64].
Mean age of resident population (years)
Proportion of the resident population with 14 or less years of age (%)
Proportion of lodgings formed by couples with children (%)Families with children will have to allocate time and resources to care for them, which may affect their resilience and capacity to recover from hazards.
Mean commuting time of the working or studying resident population (min)The greater the amount of time a resident is absent from home on a regular basis, the less likely is he/she to be able to react quickly in case of wildfire, and the more difficult will be the recovery. This will be especially acute in the case of seasonally used homes.
Proportion of the resident population working or studying in another municipality (%)
Proportion of seasonally used classic family lodgings (%)
Proportion of the resident population that resided in another municipality 5 years before (%)New residents and foreign nationals will be less likely to have established consolidated networks of social connections, and thus be less likely to benefit from help from neighbours and more likely to be unaware of warning information. In the case of foreigners, the language barrier may constrain disaster preparedness and resilience [29], and cultural barriers may affect access to post-disaster relief initiatives.
Proportion of the resident population of foreign nationality (%)
Female activity rate (%)Women can have a more difficult time during recovery than men, often due to sector-specific employment, lower wages, and family care responsibilities [32].
Female proportion of the population (%)
Proportion of self-owned lodgings that include expenses (%)Home expenses can be a major component of the household budget and impact the capacity to invest in resilience prior to a disaster, as well as the capacity to recover from it.
Proportion of family lodgings lacking at least one basic infrastructure (%)The quality of residential construction affects potential losses and recovery [32]. Older buildings, those lacking basic infrastructures, or mobile or improvised habitations are likely to be more vulnerable to the effects of wildfire [29].
Average age of buildings (years)
Proportion of buildings built within the previous ten years (%)
Proportion of non-classical lodgings (%)
Proportion of rented or subleased classic lodgings (%)People that rent do so because they are either transient or do not have the financial resources for home ownership. They often lack access to information about financial aid during recovery. In the most extreme cases, renters lack sufficient shelter options when lodging becomes uninhabitable or too costly to afford [32].
Proportion of single-lodging buildings (%)People in rural areas tend to have limited access to emergency and contingency-related resources, good and services. Their rehabilitation potential is also reduced compared to urban areas [56].
Proportion of overcrowded lodgings (%)Overcrowding may be associated with financial constraints, also making evacuation more difficult [29,64].
Floors by building (Nº)High-density areas (urban) complicate evacuation in case of disaster [29,32].
Proportion of the population using automobile for dislocations (%)Residents with access to automobiles will be more mobile, which will facilitate getting out of harm’s way [29], as well as the capacity to recover from a wildfire.
Table A2. Conceptual justification for the variables adopted for expressing support capability.
VariableRationale
Ageing ratio of buildings (%)Infrastructure that is old or degraded will likely be more vulnerable to wildfire damage, while possibly constraining the efficiency of response on the part of authorities. Additionally, the state and age of constructions is an indicator of the economic health of a parish (see economic indicators below).
Proportion of buildings in need of major reparations or very degraded (%)
Proportion of buildings having wheelchair accessibility (%)An indicator of the capacity of residents with impaired mobility to efficiently evacuate in case of wildfire, either with or without assistance.
Proportion of the resident population living outside of urban centres (%)Population that is dispersed across the parish territory will likely be harder to assist by authorities in the case of disaster. Additionally, rural residents may be more vulnerable due to lower incomes and more dependent on locally based resource extraction economies [32].
Road network density (km/km2)The greater the number of corporations and firefighters, the greater the capacity of authorities to respond in case of wildfire [36]. Road density will promote overall accessibility, and therefore promote the efficiency of this response [36]. High road density will also facilitate evacuation in case of disaster.
Firefighter corporations (Nº)
Firefighters (Nº)
Pharmacies and mobile pharmaceutical posts (Nº)The number of nurses and pharmacies are likely indicators of the overall capacity for efficient medical response in case of wildfire, decreasing its impacts and promoting recovery.
Nurses by workplace (Nº)
Rooms in tourist accommodation establishments (Nº)All these variables were adopted as indicators of overall economic health and vitality of parishes.
Wealth enables communities to absorb and recover from losses more quickly due to insurance, social safety nets, and entitlement programs [32,64].
Urban waste collected by inhabitant (kg)
Gross Value Added of enterprises (EUR) (note: does not include financial sector)
Median sale value by m2 of family accommodations
ATM machines (Nº)

References

  1. Ager, A.A.; Palaiologou, P.; Evers, C.R.; Day, M.A.; Barros, A.M.G. Assessing Transboundary Wildfire Exposure in the Southwestern United States. Risk Anal. 2018, 38, 2105–2127. [Google Scholar] [CrossRef] [Green Version]
  2. Alcasena, F.J.; Ager, A.A.; Bailey, J.D.; Pineda, N.; Vega-García, C. Towards a comprehensive wildfire management strategy for Mediterranean areas: Framework development and implementation in Catalonia, Spain. J. Environ. Manag. 2019, 231, 303–320. [Google Scholar] [CrossRef] [PubMed]
  3. Andersen, L.M.; Sugg, M.M. Geographic multi-criteria evaluation and validation: A case study of wildfire vulnerability in Western North Carolina, USA following the 2016 wildfires. Int. J. Disaster Risk Reduct. 2019, 39, 101123. [Google Scholar] [CrossRef]
  4. Antunes, C.C.; Xavier, D.; Manuel, J. Avaliação do Risco de Incêndio Florestal no Concelho de Arganil. Silva Lusit. 2011, 19, 165–179. [Google Scholar]
  5. Bergonse, R.; Oliveira, S.; Gonçalves, A.; Nunes, S.; da Câmara, C.; Zêzere, J.L. A combined structural and seasonal approach to assess wildfire susceptibility and hazard in summertime. Nat. Hazards 2021, 106, 2545–2547. [Google Scholar] [CrossRef]
  6. Bergonse, R.; Oliveira, S.; Zêzere, J.L.; Moreira, F.; Ribeiro, P.F.; Leal, M.; Lima e Santos, J.M. Biophysical controls over fire regime properties in Central Portugal. Sci. Total Environ. 2022, 810, 152314. [Google Scholar] [CrossRef] [PubMed]
  7. Boer, M.M.; Resco de Dios, V.; Bradstock, M.A. Unprecendented burn area of Australian mega forest fires. Nat. Clim. Change 2020, 10, 170. [Google Scholar] [CrossRef]
  8. De Brito, R.S. (Ed.) Atlas de Portugal, 1st ed.; Instituto Geográfico Português: Lisbon, Portugal, 2005. [Google Scholar]
  9. Calkin, D.E.; Thompson, M.P.; Finney, M.A.; Hyde, K.D. A real-time Risk Assessment tool supporting wildland fire decisionmaking. J. For. 2011, 109, 274–280. [Google Scholar] [CrossRef]
  10. Cardona, O.; Carreño, M.L. Updating the Indicators of Disaster Risk and Risk Management for the Americas. J. Integr. Disaster Risk Manag. 2011, 1, 27–47. [Google Scholar] [CrossRef]
  11. Cardona, O.D.; Van Aalst, M.K.; Birkmann, J.; Fordham, M.; Mc Gregor, G.; Rosa, P.; Pulwarty, R.S.; Schipper, E.L.F.; Sinh, B.T.; Décamps, H.; et al. Determinants of risk: Exposure and vulnerability. In Managing the Risks of Extreme Events and Disasters to Advance Climate Change Adaptation: Special Report of the Intergovernmental Panel on Climate Change; Cambridge University Press: Cambridge, UK, 2012; pp. 65–108. [Google Scholar] [CrossRef] [Green Version]
  12. Chas-Amil, M.L.; García-Martínez, E.; Touza, J. Iberian Peninsula October 2017 wildfires: Burned area and population exposure in Galicia (NW of Spain). Int. J. Disaster Risk Reduct. 2020, 48, 101623. [Google Scholar] [CrossRef]
  13. Chen, W.; Cutter, S.L.; Emrich, C.T.; Shi, P. Measuring social vulnerability to natural hazards in the Yangtze River Delta region, China. Int. J. Disaster Risk Sci. 2013, 4, 169–181. [Google Scholar] [CrossRef] [Green Version]
  14. Chuvieco, E.; Aguado, I.; Yebra, M.; Nieto, H.; Salas, J.; Martín, M.P.; Vilar, L.; Martínez, J.; Martín, S.; Ibarra, P.; et al. Development of a framework for fire risk assessment using remote sensing and geographic information system technologies. Ecol. Model. 2010, 221, 46–58. [Google Scholar] [CrossRef]
  15. Chuvieco, E.; Martínez, S.; Román, M.V.; Hantson, S.; Pettinari, M.L. Integration of ecological and socio-economic factors to assess global vulnerability to wildfire. Glob. Ecol. Biogeogr. 2014, 23, 245–258. [Google Scholar] [CrossRef]
  16. Cutter, S.L.; Boruff, B.J.; Shirley, W.L. Social vulnerability to environmental hazards. Soc. Sci. Q. 2003, 84, 242–261. [Google Scholar] [CrossRef]
  17. De Groeve, T. Index for Risk Management—INFORM; JRC Scientific and Policy Reports; Joint Research Centre, European Commission: Ispra, Italy, 2015; Volume 53. [Google Scholar] [CrossRef]
  18. Duguy, B.; Alloza, J.A.; Baeza, M.J.; De La Riva, J.; Echeverría, M.; Ibarra, P.; Llovet, J.; Cabello, F.P.; Rovira, P.; Vallejo, R.V. Modelling the ecological vulnerability to forest fires in mediterranean ecosystems using geographic information technologies. Environ. Manag. 2012, 50, 1012–1026. [Google Scholar] [CrossRef]
  19. Evers, C.R.; Ager, A.A.; Nielsen-Pincus, M.; Palaiologou, P.; Bunzel, K. Archetypes of community wildfire exposure from national forests of the western US. Landsc. Urban Plan. 2019, 182, 55–66. [Google Scholar] [CrossRef] [Green Version]
  20. Flanagan, B.E.; Gregory, E.W.; Hallisey, E.J.; Heitgerd, J.L.; Lewis, B. A Social Vulnerability Index for Disaster Management. J. Homel. Secur. Emerg. Manag. 2011, 8, 33–42. [Google Scholar] [CrossRef]
  21. Garcia, R.A.C.; Oliveira, S.C.; Zêzere, J.L. Assessing population exposure for landslide risk analysis using dasymetric cartography. Nat. Hazards Earth Syst. Sci. 2016, 16, 2769–2782. [Google Scholar] [CrossRef] [Green Version]
  22. Gómez-González, S.; Ojeda, F.; Fernandes, P.M. Portugal and Chile: Longing for sustainable forestry while rising from the ashes. Environ. Sci. Policy 2018, 81, 104–107. [Google Scholar] [CrossRef]
  23. Haynes, K.; Short, K.; Xanthopoulos, G.; Viegas, D.X.; Ribeiro, L.M.; Blanchi, R. Wildfires and WUI Fire Fatalities. In Encyclopedia of Wildfires and Wildland-Urban Interface (WUI) Fires; Manzello, S., Ed.; Springer: Berlin/Heidelberg, Germany, 2020; pp. 1073–1088. [Google Scholar] [CrossRef]
  24. Lee, S. Application of likelihood ratio and logistic regression models to landslide susceptibility mapping using GIS. Environ. Manag. 2004, 34, 223–232. [Google Scholar] [CrossRef]
  25. Leuenberger, M.; Parente, J.; Tonini, M.; Pereira, M.G.; Kanevski, M. Wildfire susceptibility mapping: Deterministic vs. stochastic approaches. Environ. Model. Softw. 2018, 101, 194–203. [Google Scholar] [CrossRef]
  26. Marques, S.; Borges, J.G.; Garcia-Gonzalo, J.; Moreira, F.; Carreiras, J.M.B.; Oliveira, M.M.; Cantarinha, A.; Botequim, B.; Pereira, J.M.C. Characterization of wildfires in Portugal. Eur. J. For. Res. 2011, 130, 775–784. [Google Scholar] [CrossRef]
  27. Mendes, J.M.; Tavares, A.O.; Cunha, L.; Freiria, S. A vulnerabilidade social aos perigos naturais e tecnológicos em Portugal. Social Vulnerability to Natural and Technological Hazards in Portugal. La vulnérabilité sociale face aux risques naturels et technologiques au Portugal. Rev. Crítica De Ciências Sociais 2011, 93, 95–128. [Google Scholar] [CrossRef] [Green Version]
  28. Mendes, J.M.; Tavares, A.O.; Santos, P.P. Social vulnerability and local level assessments: A new approach for planning. Int. J. Disaster Resil. Built Environ. 2019, 11, 15–43. [Google Scholar] [CrossRef]
  29. Mitsopoulos, I.; Mallinis, G.; Arianoutsou, M. Wildfire Risk Assessment in a Typical Mediterranean Wildland–Urban Interface of Greece. Environ. Manag. 2014, 55, 900–915. [Google Scholar] [CrossRef]
  30. Nauslar, N.J.; Abatzoglou, J.T.; Marsh, P.T. The 2017 north bay and southern california fires: A case study. Fire 2018, 1, 18. [Google Scholar] [CrossRef] [Green Version]
  31. Oliveira, S.; Félix, F.; Nunes, A.; Lourenço, L.; Laneve, G.; Sebastián-López, A. Mapping wildfire vulnerability in Mediterranean Europe. Testing a stepwise approach for operational purposes. J. Environ. Manag. 2018, 206, 158–169. [Google Scholar] [CrossRef]
  32. Oliveira, S.; Gonçalves, A.; Benali, A.; Sá, A.; Zêzere, J.L.; Pereira, J.M. Assessing risk and prioritizing safety interventions in human settlements affected by large wildfires. Forests 2020, 11, 859. [Google Scholar] [CrossRef]
  33. Oliveira, S.; Gonçalves, A.; Zêzere, J.L. Reassessing wildfire susceptibility and hazard for mainland Portugal. Sci. Total Environ. 2020, 762, 143121. [Google Scholar] [CrossRef]
  34. Oliveira, S.; Zêzere, J.L. Assessing the biophysical and social drivers of burned area distribution at the local scale. J. Environ. Manag. 2020, 264, 110449. [Google Scholar] [CrossRef]
  35. Oliveira, S.; Zêzere, J.L.; Queirós, M.; Pereira, J.M. Assessing the social context of wildfire-affected areas. The case of mainland Portugal. Appl. Geogr. 2017, 88, 104–117. [Google Scholar] [CrossRef]
  36. Pahl Consulting; IGOT. Metodologia Para a Produção de Carta de Perigosidade de Incêndio Rural de cariz Estrutural—Relatório Definitivo. 2020. Available online: https://www.icnf.pt/api/file/doc/96bb210ebf341cda (accessed on 13 September 2022).
  37. Palaiologou, P.; Ager, A.A.; Nielsen-Pincus, M.; Evers, C.R.; Day, M.A. Social vulnerability to large wildfires in the western USA. Landsc. Urban Plan. 2019, 189, 99–116. [Google Scholar] [CrossRef] [Green Version]
  38. Paprotny, D.; Morales-Nápoles, O.; Jonkman, S.N. HANZE: A pan-European database of exposure to natural hazards and damaging historical floods since 1870. Earth Syst. Sci. Data 2017, 2013, 1–25. [Google Scholar] [CrossRef] [Green Version]
  39. Parente, J.; Pereira, M.G. Structural fire risk: The case of Portugal. Sci. Total Environ. 2016, 573, 883–893. [Google Scholar] [CrossRef]
  40. Parisien, M.A.; Dawe, D.A.; Miller, C.; Stockdale, C.A.; Armitage, O.B. Applications of simulation-based burn probability modelling: A review. Int. J. Wildland Fire 2019, 28, 913–926. [Google Scholar] [CrossRef] [Green Version]
  41. Paveglio, T.B.; Abrams, J.; Ellison, A. Developing Fire Adapted Communities: The Importance of Interactions Among Elements of Local Context. Soc. Nat. Resour. 2016, 29, 1246–1261. [Google Scholar] [CrossRef]
  42. Paveglio, T.B.; Edgeley, C.M.; Stasiewicz, A.M. Assessing influences on social vulnerability to wildfire using surveys, spatial data and wildfire simulations. J. Environ. Manag. 2018, 213, 425–439. [Google Scholar] [CrossRef]
  43. Pereira, J.M.C.; Carreiras, J.M.B.; Silva, J.M.N.; Vasconcelos, M.J. Alguns Conceitos Básicos sobre os Fogos Rurais em Portugal. In Incêndios Florestais em Portugal: Caracterização, Impactes e Prevenção; Pereira, J.S., Pereira, J.M.C., Rego, F.C., Silva, J.M.N., Silva, T.P., Eds.; ISAPress: Lisbon, Portugal, 2006; pp. 133–161. [Google Scholar]
  44. Pereira, M.G.; Malamud, B.D.; Trigo, R.M.; Alves, P.I. The history and characteristics of the 1980-2005 Portuguese rural fire database. Nat. Hazards Earth Syst. Sci. 2011, 11, 3343–3358. [Google Scholar] [CrossRef]
  45. Pereira, M.G.; Trigo, R.M.; Da Camara, C.C.; Pereira, J.M.C.; Leite, S.M. Synoptic patterns associated with large summer forest fires in Portugal. Agric. For. Meteorol. 2005, 129, 11–25. [Google Scholar] [CrossRef]
  46. Pereira, S.; Santos, P.P.; Zêzere, J.L.; Tavares, A.O.; Garcia, R.A.C.; Oliveira, S.C. A landslide risk index for municipal land use planning in Portugal. Sci. Total Environ. 2020, 735, 139463. [Google Scholar] [CrossRef]
  47. Rodríguez y Silva, F.; Molina Martínez, J.R.; Herrera Machuca, M.; Zamora Diaz, R. Vulnerabilidad socioeconómica de los espacios forestales frente al impactode los incendios, aproximación metodológica mediante sistemas de informacióngeográficos (proyecto Firemap). In Proceedings of the IV International Wildland Fire Conference, Sevilla, Spain, 13–17 May 2007. [Google Scholar]
  48. Román, M.V.; Azqueta, D.; Rodrígues, M. Methodological approach to assess the socio-economic vulnerability to wildfires in Spain. For. Ecol. Manag. 2013, 294, 158–165. [Google Scholar] [CrossRef]
  49. Salis, M.; Ager, A.A.; Arca, B.; Finney, M.A.; Bacciu, V.; Duce, P.; Spano, D. Assessing exposure of human and ecological values to wildfire in Sardinia, Italy. Int. J. Wildland Fire 2013, 22, 549–565. [Google Scholar] [CrossRef]
  50. Salis, M.; Del Giudice, L.; Arca, B.; Ager, A.A.; Alcasena-Urdiroz, F.; Lozano, O.; Bacciu, V.; Spano, D.; Duce, P. Modeling the effects of different fuel treatment mosaics on wildfire spread and behavior in a Mediterranean agro-pastoral area. J. Environ. Manag. 2018, 212, 490–505. [Google Scholar] [CrossRef] [PubMed]
  51. San-Miguel-Ayanz, J.; Durrant, T.; Boca, R.; Libertá, G.; Branco, A.; de Rigo, D.; Ferrari, D.; Maianti, P.; Vivancos, T.A.; Lana, F.; et al. Forest Fires in Europe, Middle East and North Africa 2017; EUR 29318 EN; Joint Research Centre, European Commission: Ispra, Italy, 2018. [Google Scholar] [CrossRef]
  52. San-Miguel-Ayanz, J.; Moreno, J.M.; Camia, A. Analysis of large fires in European Mediterranean landscapes: Lessons learned and perspectives. For. Ecol. Manag. 2013, 294, 11–22. [Google Scholar] [CrossRef]
  53. Santos, P.P.; Pereira, S.; Zêzere, J.L.; Tavares, A.O.; Reis, E.; Garcia, R.A.C.; Oliveira, S.C. A comprehensive approach to understanding flood risk drivers at the municipal level. J. Environ. Manag. 2020, 260, 110127. [Google Scholar] [CrossRef]
  54. Schmidtlein, M.C.; Deutsch, R.C.; Piegorsch, W.W.; Cutter, S.L. A sensitivity analysis of the social vulnerability index. Risk Anal. 2008, 28, 1099–1114. [Google Scholar] [CrossRef]
  55. Scott, J.H.; Thompson, M.P.; Calkin, D.E. A Wildfire Risk Assessment Framework for Land and Resource Management; General Technical Report RMRS-GTR-315; US Department of Agriculture, Forest Service, Rocky Mountain Research Station: Missoula, MT, USA, 2013. [Google Scholar] [CrossRef]
  56. Tavares, A.O.; Barros, J.L.; Mendes, J.M.; Santos, P.P.; Pereira, S. Decennial comparison of changes in social vulnerability: A municipal analysis in support of risk management. Int. J. Disaster Risk Reduct. 2018, 31, 679–690. [Google Scholar] [CrossRef]
  57. Thompson, M.P.; Gannon, B.M.; Caggiano, M.D.; O’Connor, C.D.; Brough, A.; Gilbertson-Day, J.W.; Scott, J.H. Prototyping a geospatial Atlas for wildfire planning and management. Forests 2020, 11, 909. [Google Scholar] [CrossRef]
  58. Thompson, M.P.; Haas, J.R.; Gilbertson-Day, J.W.; Scott, J.H.; Langowski, P.; Bowne, E.; Calkin, D.E. Development and application of a geospatial wildfire exposure and risk calculation tool. Environ. Model. Softw. 2015, 63, 61–72. [Google Scholar] [CrossRef]
  59. UNDRR. Report of the Open-Ended Intergovernmental Expert Working Group on Indicators and Terminology Relating to Disaster Risk Reduction. 2016. Available online: https://www.preventionweb.net/files/50683_oiewgreportenglish.pdf (accessed on 13 September 2022).
  60. UNISDR. Living With Risk—A Global Review of Disaster Reduction Initiatives; United Nations International Strategy for Disaster Risk Reduction: Geneva, Switzerland, 2004; Volume 1. [Google Scholar]
  61. UNISDR. Making Development Sustainable: The Future of Disaster Risk Management. Global Assessment Report on Disaster Risk Reduction; United Nations Office for Disaster Risk Reduction (UNISDR): Geneva, Switzerland, 2015. [Google Scholar]
  62. UNISDR. Sendai Framework for Disaster Risk Reduction 2015–2030; United Nations Office for Disaster Risk Reduction (UNISDR): Geneva, Switzerland, 2015. [Google Scholar]
  63. Verde, J.C.; Zêzere, J.L. Assessment and validation of wildfire susceptibility and hazard in Portugal. Nat. Hazards Earth Syst. Sci. 2010, 10, 485–497. [Google Scholar] [CrossRef]
  64. Welle, T.; Birkmann, J. The World Risk Index—An approach to assess risk and vulnerability on a global scale. J. Extrem. Events 2015, 2, 1–34. [Google Scholar] [CrossRef]
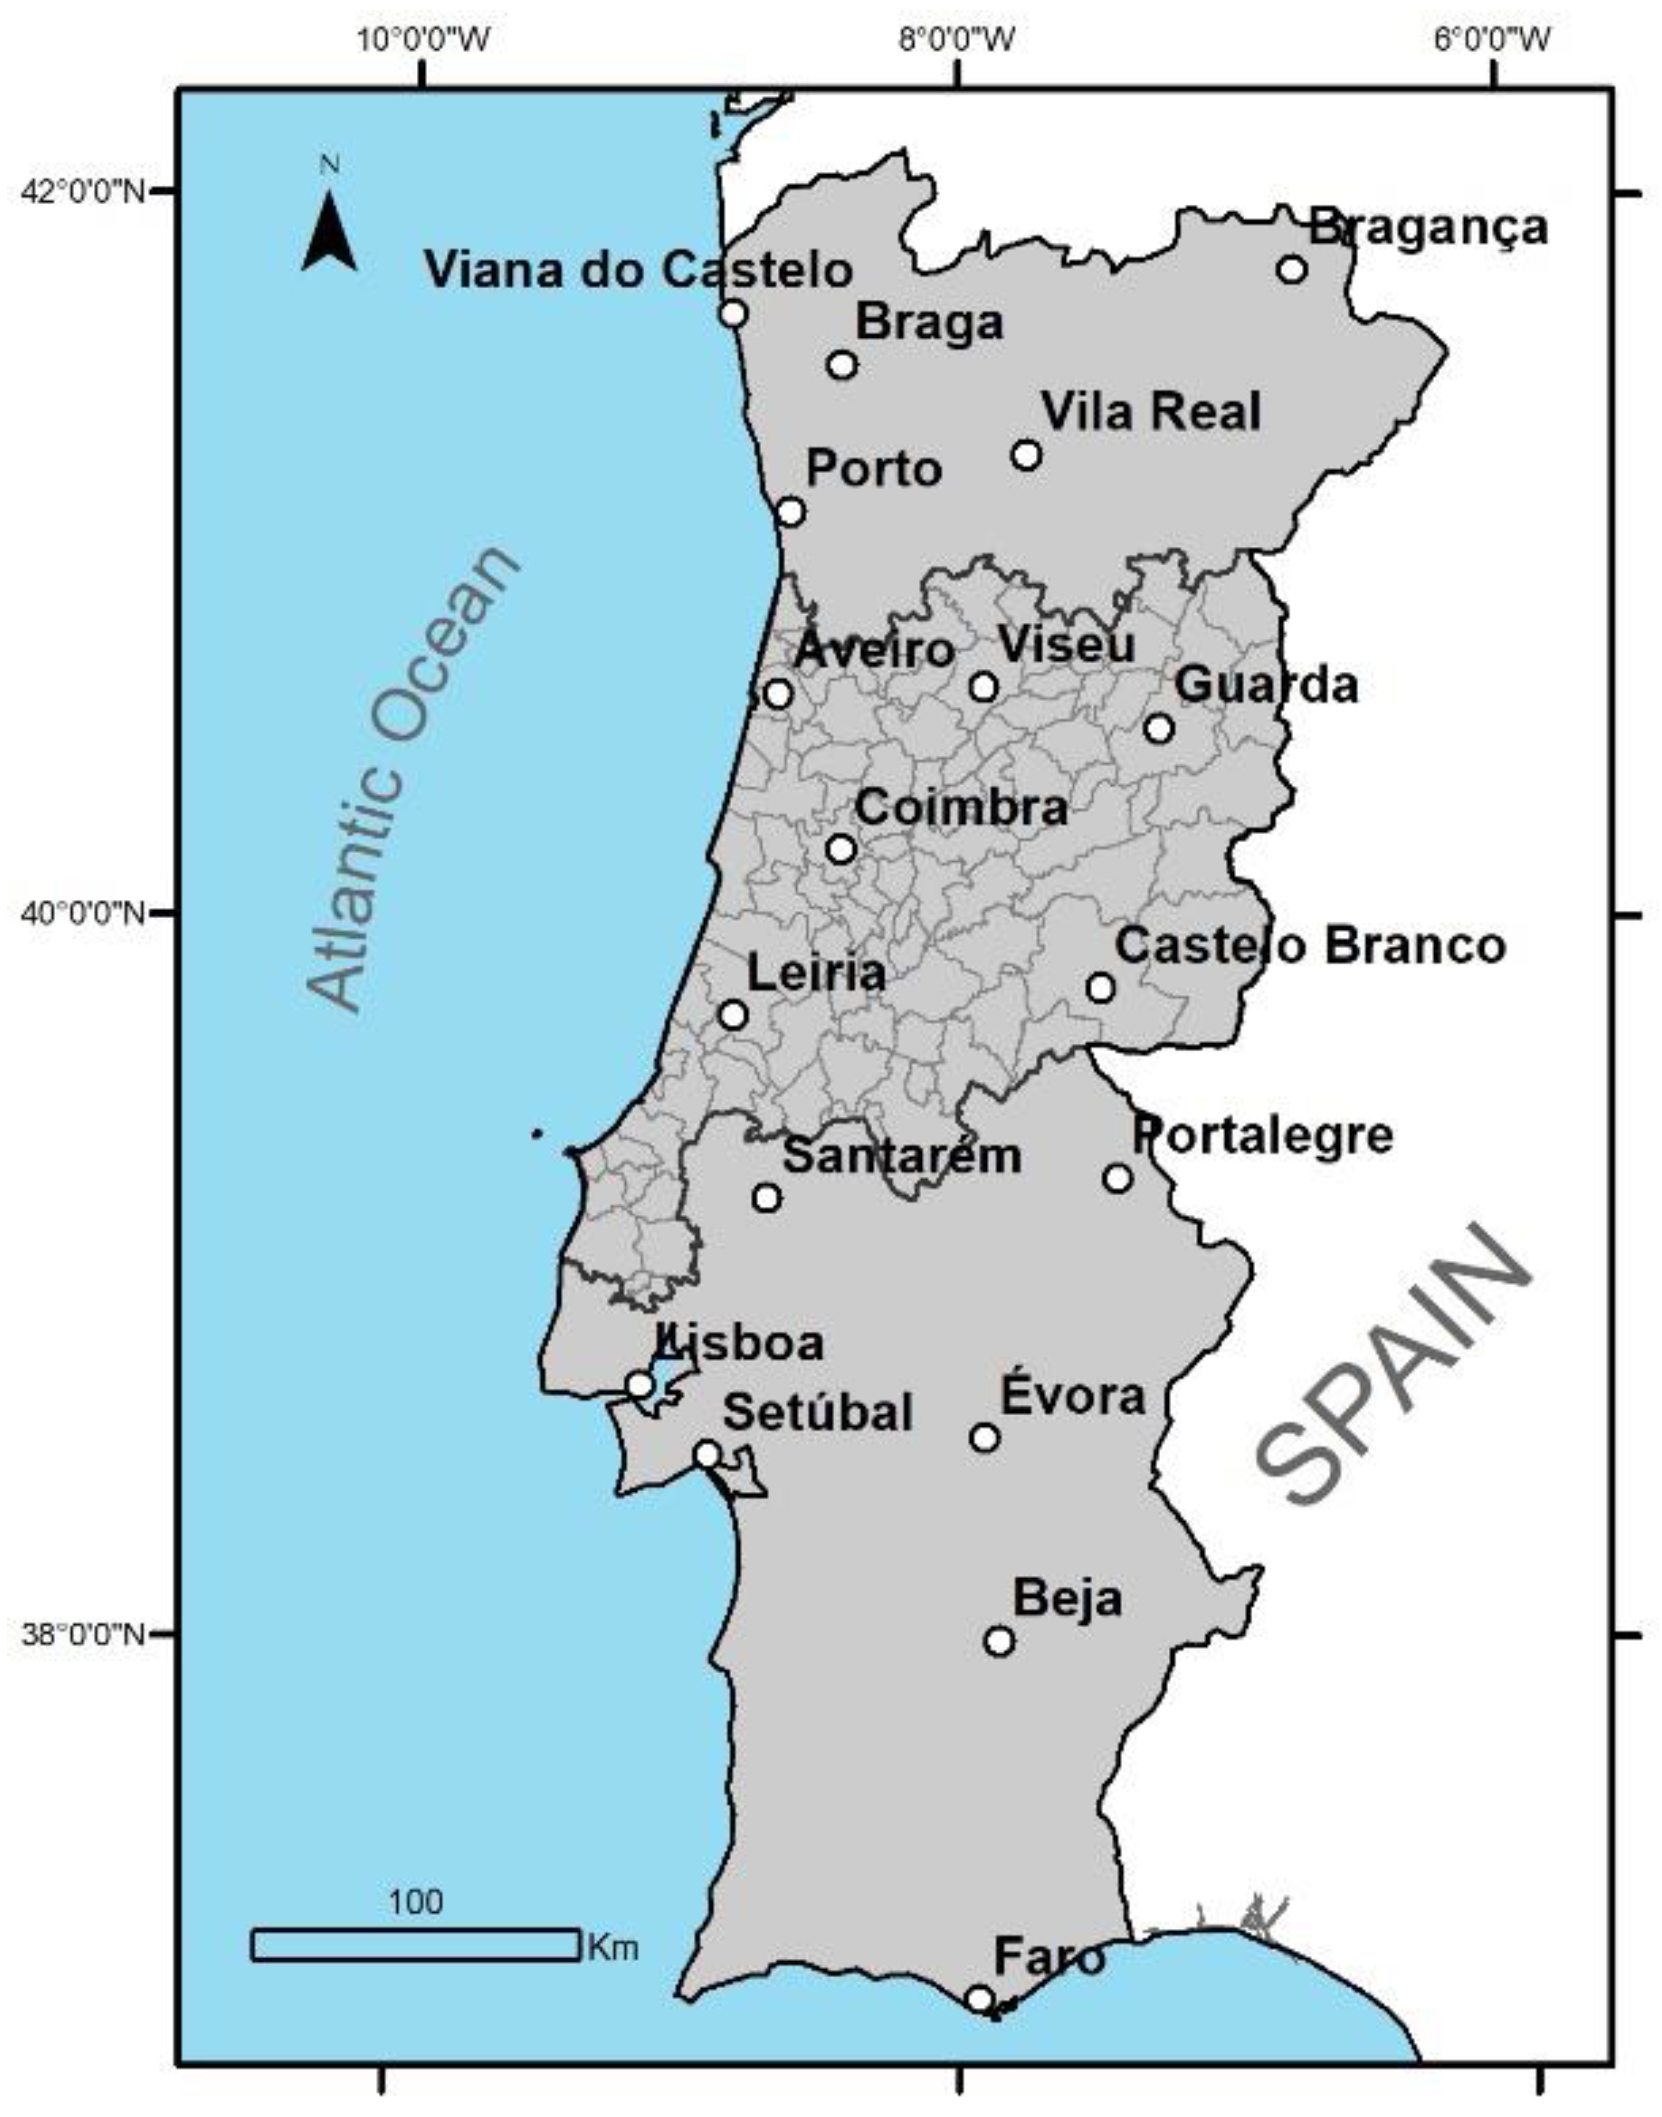
Figure 1. Location of the study area in relation to mainland Portugal and its main cities.
Fire 05 00166 g001
Figure 2. Characteristics of the study area: (A) elevation. Source https://www.eea.europa.eu/data-and-maps/data/copernicus-land-monitoring-service-eu-dem (accessed on 1 March 2021); (B) land cover. Source: Portuguese General-Directorate of the Territory (Direção-Geral do Território); (C) number of times burnt per 25 m pixel between 1975 and 2018; (D) cumulative percentage of parish area burnt between 1975 and 2018, classified using quintiles. Source of (C,D): Institute for Conservation of Nature and Forests (Instituto da Conservação da Natureza e das Florestas).
Fire 05 00166 g002
Figure 3. A schematic representation of the methodology employed to calculate the wildfire risk index.
Fire 05 00166 g003
Figure 4. A schematic representation of the methodology used to produce the wildfire hazard map.
Fire 05 00166 g004
Figure 5. Wildfire hazard, defined for each parish as the percentage of its area classified as having “High” or “Very High” wildfire hazard.
Fire 05 00166 g005
Figure 6. (A) total number of residents by parish; (B)—percentage of resident population outside the boundaries of the consolidated urban areas by parish. Both variables were classified in deciles.
Fire 05 00166 g006
Figure 7. The two dimensions of social vulnerability: (A) criticality; (B) support capability. Values were re-scaled to 0–1 and are shown classified in equal intervals.
Fire 05 00166 g007
Figure 8. Social vulnerability. Values were classified in equal intervals.
Fire 05 00166 g008
Figure 9. Frequency distributions for the wildfire risk index and its components.
Fire 05 00166 g009
Figure 10. The three wildfire risk dimensions and the final wildfire risk index: (A) hazard, (B) exposure, (C) social vulnerability; (D) wildfire risk. All values were rescaled to values between 0 and 1 using the min-max technique. Maps were classified using equal intervals.
Fire 05 00166 g010aFire 05 00166 g010b
Figure 11. (A) Division of the parishes in the study area in five clusters based on hazard, exposure, and social vulnerability levels; (B) Distribution of hazard, exposure, and social vulnerability levels among the five clusters. Circles identify potential outliers, defined as situated between 1.5× and 3× the interquartile range below the 1st quartile and above the 3rd quartile. Asterisks identify potential extreme outliers, exceeding 3 times the interquartile range below or above the 1st and the 3rd quartile.
Fire 05 00166 g011
Table 1. Pearson correlation coefficients between the potential exposure descriptors. Values ≥ 0.7 highlighted in grey. The two grey tones are intended to differentiate groups of collinear variables, considered to express different dimensions of exposure. TotBui—total number of buildings; UBui—number of urban buildings; NUBui—number of non-urban buildings; DiffBui—difference between urban and non-urban buildings; PerNUBui—percentage of total buildings that are non-urban; TotRes—total number of residents; Ures—urban residents; NURes—non-urban residents; DiffRes—difference between urban and non-urban residents; PerNURes—percentage of total residents that are non-urban. ** Significant at the p = 0.01 level.
TotBuiUBuiNUBuiDiffBuiPerNUBuiTotResUResNUResDiffRes
TotBui
UBui0.995 **
NUBui0.596 **0.511 **
DiffBui0.976 **0.993 **0.408 **
PerNUBui−0.220 **−0.287 **0.410 **−0.360 **
TotRes0.912 **0.921 **0.435 **0.919 **−0.238 **
URes0.900 **0.914 **0.394 **0.917 **−0.261 **0.999 **
NURes0.707 **0.640 **0.922 **0.555 **0.242 **0.584 **0.544 **
DiffRes0.885 **0.903 **0.350 **0.912 **−0.284 **0.995 **0.999 **0.499 **
PerNURes−0.300 **−0.358 **0.289 **−0.419 **0.950 **−0.318 **−0.337 **0.139 **−0.357 **
Table 2. The set of 25 variables used as input in the PCA for defining criticality. All variables are at the parish scale and were extracted from the 2011 census, published by Statistics Portugal. Variables in italic were not selected for the extracted principal components.
CodeVariable
ILLITIlliteracy rate (%)
UNIVDEGProportion of the resident population with university degree (%)
SING65Proportion of single-member families constituted by people with 65 or more years of age (%)
CCHILDProportion of lodgings formed by couples with children (%)
COMMUTMean commuting time of the working or studying resident population (min)
RESOTHER5Proportion of the resident population that resided in another municipality 5 years before (%)
AUTOMProportion of the population using automobile for dislocations (%)
----School dropout rate (%)
----Proportion of the resident population with 14 or less years of age (%)
FOREIGNProportion of the resident population of foreign nationality (%)
FEMACTFemale activity rate (%)
AGEMean age of resident population (years)
WSOTHERProportion of the resident population working or studying in another municipality (%)
PROFSOCVProportion of socially more valued professionals (%) 1
----Female proportion of the population (%)
SEASONProportion of seasonally used classic family lodgings (%)
LACKINFProportion of family lodgings lacking at least one basic infrastructure (%)
SELFOWNProportion of self-owned lodgings that include expenses (%)
AGEBUILDAverage age of buildings (years)
OVERCRProportion of overcrowded lodgings (%)
----Proportion of rented or subleased classic lodgings (%)
SINGACCOProportion of single-lodging buildings (%)
BUILT10Proportion of buildings built within the previous ten years (%)
FLOORSFloors by building (Nº)
----Proportion of non-classical lodgings2(%).
1 Representatives of legislative power and of executive bodies, directors and executive managers, as well as specialists in intellectual and scientific fields. 2 Lodgings that, while serving as residence for at least a family, are either mobile, improvised or otherwise not built for habitation.
Table 3. The set of 14 variables used as input in the PCA for defining support capability. Variables in italic were not selected for the extracted principal components. INE—Statistics Portugal; DGT—Directorate-General of the Territory; OSM—Open Street Map.
CodeVariableSpatial ScopeSourceYear
AGEBUILDAgeing ratio of buildings (%)ParishINE2011
WHEELCHProportion of buildings having wheelchair accessibility (%)ParishINE2011
REPDEGRProportion of buildings in need of major reparations or very degraded (%)ParishINE2011
RESOUTProportion of the resident population living outside of urban centres (%)ParishINE, DGT2011
ROADRoad network density (km/km2)NationalOSM2020
-------ATM machines (Nº)MunicipalityINE2019
-------Firefighter corporations (Nº)MunicipalityINE2018
FIREFFirefighters (Nº)MunicipalityINE2018
-------Pharmacies and mobile pharmaceutical posts (Nº)MunicipalityINE2019
NURSESNurses by workplace (Nº)MunicipalityINE2019
ROOMSRooms in tourist accommodation establishments (Nº)MunicipalityINE2019
URBWASTUrban waste collected by inhabitant (kg)MunicipalityINE2019
GVAGross Value Added of enterprises (EUR) (note: does not include financial sector)MunicipalityINE2018
MEDSALEVMedian sale value by m2 of family accommodationsMunicipalityINE2019
Table 4. Loadings, cardinality and percentage of variance explained for the 6 principal components extracted to express criticality. Loading values ≥ 0.4 or ≤−0.4 are highlighted in grey. The total percentage of variance explained was 73.38%.
Variable CodePrincipal Component
123456
AGE0.919−0.073−0.065−0.174−0.1360.039
FEMACT−0.8860.1970.1000.125−0.014−0.090
CCHILD−0.8640.016−0.0690.1760.143−0.045
SING650.838−0.066−0.066−0.1710.0200.018
SEASON0.821−0.0170.0350.0330.122−0.093
ILLIT0.783−0.159−0.124−0.0420.066−0.016
SELFOWN−0.7460.3590.2220.085−0.039−0.085
AUTOM−0.541−0.049−0.0090.123−0.453−0.023
FLOORS0.1820.763−0.0430.0790.062−0.048
SINGACCO0.358−0.747−0.2720.070−0.0870.096
UNIVDEG−0.5560.6860.2120.048−0.174−0.041
PROFSOCV−0.3180.6770.1680.093−0.260−0.049
RESOTHER50.0840.1440.8360.121−0.0870.173
FOREIGN−0.1870.1380.761−0.0380.131−0.109
BUILT10−0.1680.0570.1140.8630.0900.044
AGEBUILD0.205−0.0530.038−0.8430.1410.079
OVERCR−0.264−0.0720.1610.0140.805−0.049
LACKINF0.418−0.075−0.283−0.0300.5300.138
WSOTHER−0.201−0.1770.1790.029−0.1440.793
COMMUT0.2260.004−0.116−0.0610.1600.788
Cardinality++++
% Variance explained31.17611.8138.4058.1497.0166.825
Table 5. Loadings, cardinality and percentage of variance explained for the 4 principal components extracted to express support capability. Loading values ≥ 0.4 or ≤−0.4 are highlighted in grey. The total percentage of variance explained was 66.58%.
Variable CodePrincipal Component
1234
FIREF0.878−0.18−0.0190.000
GVA0.8580.21−0.084−0.115
ROOMS0.7870.004−0.0690.05
NURSES0.7620.1960.100−0.071
MEDSALEV0.7180.404−0.140−0.226
URBWAST0.1370.787−0.1730.195
RESOUT−0.054−0.742−0.0310.172
REPDEGR−0.0240.0390.8−0.057
WHEELCH0.0820.28−0.598−0.274
AGEBUILD0.010.0660.1760.848
ROAD0.3840.2310.264−0.481
Cardinality++
% Variance explained30.89714.42410.63710.620
Publisher’s Note: MDPI stays neutral with regard to jurisdictional claims in published maps and institutional affiliations.