Article

Longleaf Pine Seedlings Are Extremely Resilient to the Combined Effects of Experimental Fire and Drought

1
Warnell School of Forestry and Natural Resources, University of Georgia, Athens, GA 30602, USA
2
Athens Fire Laboratory, Southern Research Station, USDA Forest Service, 320 Green Street, Athens, GA 30602, USA
3
Savannah River Ecology Laboratory, University of Georgia, PO Drawer E, Aiken, SC 29802, USA
4
Department of Forest, Rangeland, and Fire Sciences, College of Natural Resources, University of Idaho, Moscow, ID 83844, USA
5
Department of Earth and Spatial Sciences, College of Science, University of Idaho, Moscow, ID 83844, USA
*
Author to whom correspondence should be addressed.
Fire 2022, 5(5), 128; https://doi.org/10.3390/fire5050128
Submission received: 4 August 2022 / Revised: 23 August 2022 / Accepted: 26 August 2022 / Published: 27 August 2022
(This article belongs to the Collection Technical Forum for Fire Science Laboratory and Field Methods)

Abstract

:
The longleaf pine ecosystem is dependent on frequent fire. Climate change is expected to influence moisture availability and it is unclear how drought conditions may interact with prescribed fire to influence management objectives associated with maintaining longleaf pine ecosystems. This study aimed to understand the impacts of drought, fire intensity and their interaction on P. palustris grass-stage seedlings. We used droughted and well-watered P. palustris seedlings burned at two different fire intensity levels at an indoor combustion facility. Needle fuel moisture content of burned seedlings was not different between droughted and well-watered groups. Mortality and resprouting only occurred at fire intensity levels exceeding 3.5 MJ m−2 in combination with drought that resulted in predawn water potentials more negative than −1.7 MPa. Our observations of minimal mortality after exposing P. palustris seedlings to a range of fire intensities in a burn lab contrast the higher mortality observed in field studies for the species. Compared to seedlings and saplings of Western US Pinus species, this study demonstrates that P. palustris is considerably more resistant to the combined effects of high surface fire intensity and drought.

1. Introduction

Earth’s terrestrial biomes are expected to undergo major changes in the coming decades in response to climate change, largely caused by increases in atmospheric [CO2] and land use changes, resulting in altered temperature and precipitation patterns [1,2,3]. Some of the most visible impacts of climate change will be forest die off or lack of seedling recruitment as a result of an increased frequency of individual and concurrent extreme events such as fire, drought and pests [4,5]. While much past plant ecophysiology research has focused on responses to changes in mean rainfall and temperature, more recently the field has shifted towards understanding the responses to extreme events such as heatwaves and extended drought [6,7]. Throughout the southeastern United States, climate change is expected to result in a change in precipitation regimes with individual rainfall event intensity increasing but with an associated decline in the actual frequency of precipitation events [8]. This will likely result in surface water saturation leading to more frequent flooding [8,9], but also more frequent severe drought periods and favorable wildfire conditions [10].
Understanding how seedlings respond to the combined effects of fire and drought has been of interest for decades in wildfire research [11]. Previous investigations of how tree seedlings respond to fire have been focused on tracking seedling regeneration based on fuel loading and fuel moisture [12,13] or assessing seedling mortality and physiology pre- and post-fire [14]. There are few studies that have looked at the physiological consequences of drought and fire, and their interaction at known fire radiative energy (FRE), the energy released by fire per area [15,16,17,18,19]. FRE, in contrast to measures of fuel or maximum temperature, can be used to compare different fuel loads, moistures and burning environments as to better understand plant response to energy released by fires [20]. The most intensively studied Pinus species in relation to fire and drought effects on young life stage physiology is Pinus ponderosa Doug. C, a western US species dependent upon frequent fire regimes. Pinus ponderosa can survive low to intermediate fire intensity at when there is ample moisture, but under drought it is likely to die from these fires [17,18,21]. However, understanding remains limited on how the coupling of fire intensity and drought will change plant mortality under changing land use practices and climate change [22]. Seedling responses to varying degrees of fire intensity are generally unknown, especially for trees of the southeast United States [19], where more prescribed fire is used to manage more than 2 million hectares annually, representing approximately 80% of the total annual prescribed fire area in the US [23].
P. palustris is unique in its growth forms, where it begins its life as a “grass stage”, a morphology only found in a few other pines that experience frequent fire regimes (e.g., Pinus merkusii Jungh. & Vriese ex Vriese, P. montezumae Lamb, P. michoacana Lindl.; [24]). Grass stage seedlings only have a few centimeters of woody tissue above the soil with a dense tuft of needles insulating a singular apical bud from low intensity fire [25,26]. After five to ten years in the grass stage, seedlings allocate carbon to stem production to grow up to two meters in a single year to escape subsequent fires [27]. The exact conditions that promote this accelerated stem growth are currently unknown [28,29]. Where frequent fire is maintained, the interaction of resinous and quickly consumed needles and herbaceous understory creates a positive feedback response among fuels, fire and vegetation to allow P. palustris to persist under many soil and environmental conditions [26,30,31]. P. palustris grass stage, thick bark and insulated buds present a unique model under which to understand the response to drought and fire compared to other species.
P. palustris is an ideal species to investigate seedling response to fire as it not only tolerant of fire, but dependent upon it as well for regeneration and growth [25]. Within this study we aimed to understand what FRE it takes to top kill (kill all needles but cause resprouting from existing dormant buds) or completely kill (no resprouting) P. palustris and how hydraulic drought (as opposed to atmospheric drought) impacts potential survival and recovery. We hypothesized that our highest FREs would completely kill longleaf based on previous studies on P. ponderosa [17,21], but the combined effects of drought and fire would kill P. palustris at lower fuel loads. We also predicted that P. palustris would have less mortality following fire and drought compared to the previously studied western conifers.

2. Materials and Methods

2.1. Plant Material and Growth Conditions

Pinus palustris (Mill.) grass stage seedlings were acquired from a state nursery (Georgia Forestry Commission, Byromville, GA, USA) from open pollinated 1-0 seedstock in January of 2020 and stored in a cooler at 4 °C for approximately one week before being planted into 10 L round plastic pots. A 5 cm layer of playground sand followed by 30 cm commercially available sand was placed into each pot as a growing medium. Plastic mesh was placed at the bottom of each pot to prevent sand mixture from spilling through drainage holes while watering. Plants were fertilized with 20-10-20 liquid fertilizer (J.R. Peters, Inc., Allentown, PA, USA) at 75 ppm of nitrogen equivalent once to prevent transplant shock, and then at 200 ppm equivalent thereafter approximately every 12 weeks. Seedlings were grown in a glasshouse for the following year. In March 2021, seedlings were placed in two Conviron BDW40 (Controlled Environments LTD., Winnipeg, MB, CA) growth chambers on 14/10-h day/night cycle with 800 µmol m−2 s−1 of photosynthetically active radiation. Temperatures were set to 25 °C during the day and 18 °C at night and relative humidity was set at 50% during the day and 85% at night. Chamber [CO2] was not controlled but averaged 445 ± 0.36 ppm (Table S1).

2.2. Experimental Design & Treatment Application

An incomplete factorial design with eight treatment groups was used to test the interaction of fire intensity 3 levels of fuel loading representing a relative scale of low (L), medium (M), and high (H) fire intensities and drought (two levels; well-watered control (W) and drought (D)) on survival of P. palustris grass stage seedlings (Table S2). There were two control groups that did not receive a burn, the first well-watered throughout the experiment (C), and the other (DD) that was used for more intensive physiological measures (listed below). The drought treatment seedlings were not watered for 14 days prior to experimental burn, whereas well-watered controls were watered at least two times per week throughout the entire experiment. Fire intensity treatments consisted of three fuel amounts of 0.24 kg m−2, 0.49 kg m−2, and 0.99 kg m−2 (Table S2). The lowest fuel load was based on average pine needle fuel loading for controlled burns in managed longleaf stands throughout the Southeast United States [32]. A dry down curve was performed on five seedlings and was used in developing a relationship between pre-dawn water potential and leaf level transpiration (described below). Preliminary data suggested (data not shown) and dry down data confirmed (described and analyzed below) that drought alone would not cause whole plant mortality, so the drought only treatment group was kept intentionally small (n = 6) as to increase sample size of fire and drought treatment groups.
Eight experimental burns occurred across two non-consecutive days at the Athens Prescribed Fire Science Lab, part of the United States Forest Service Southern Research Station. The low and medium intensity burns were completed on 13 May 2021 (weather conditions averaged 15 °C & 50% RH) and the high intensity burns were completed on 29 July 2021 (weather conditions averaged 26 °C and 80% RH) (UGA Climatology Research Lab 2022). A 2.44 m by 2.44 m platform was constructed using plywood elevated on lumber supports with holes cut into the plywood to place ten seedlings at a time (Figure 1, [19]). Seedling pot rims were cut to be flush with the soil surface and plywood platform. One gram of fresh needles was collected from all droughted seedlings and a subset of well-watered seedlings minutes before burning to test potential differences in Live Fuel Moisture (LFM), a metric related to plant water status and flammability [33]. LFM was calculated using Equation (1):
%   F u e l   m o i s t u r e = F r e s h   s a m p l e   m a s s D r y   s a m p l e   m a s s D r y   s a m p l e   m a s s × 100
Longleaf pine needles (Vigoro, Atlanta, GA, USA) were used as fuel for the burns and were dried at 105 °C for at least 24 h prior to each of the burns and dead fuel moisture averaged 5.8 ± 2.33% across all burns. Longleaf needles were sorted manually to remove unwanted non-longleaf litter, as well as all sticks and cones. Fuel was spread by hand into a level bed across the platform prior to each burn.
Fuel was ignited with a propane torch and a generated wind speed of 1.5 m s−1 produced by a bank of fans to produce a head fire with a uniform wind field. Each fire took approximately one to two minutes to move across the platform and consume the fuel, with the higher intensity burns taking longer than the lower intensity burns. A FLIR A655 thermal imager (Teledyne FLIR LLC., Wilsonville, OR, USA) positioned 3.5 m above the burn platform was used to capture temperature and fire radiative power (kW m−2) of solid surfaces during each fire at a resolution of 640 × 480 pixels at one frame per second.

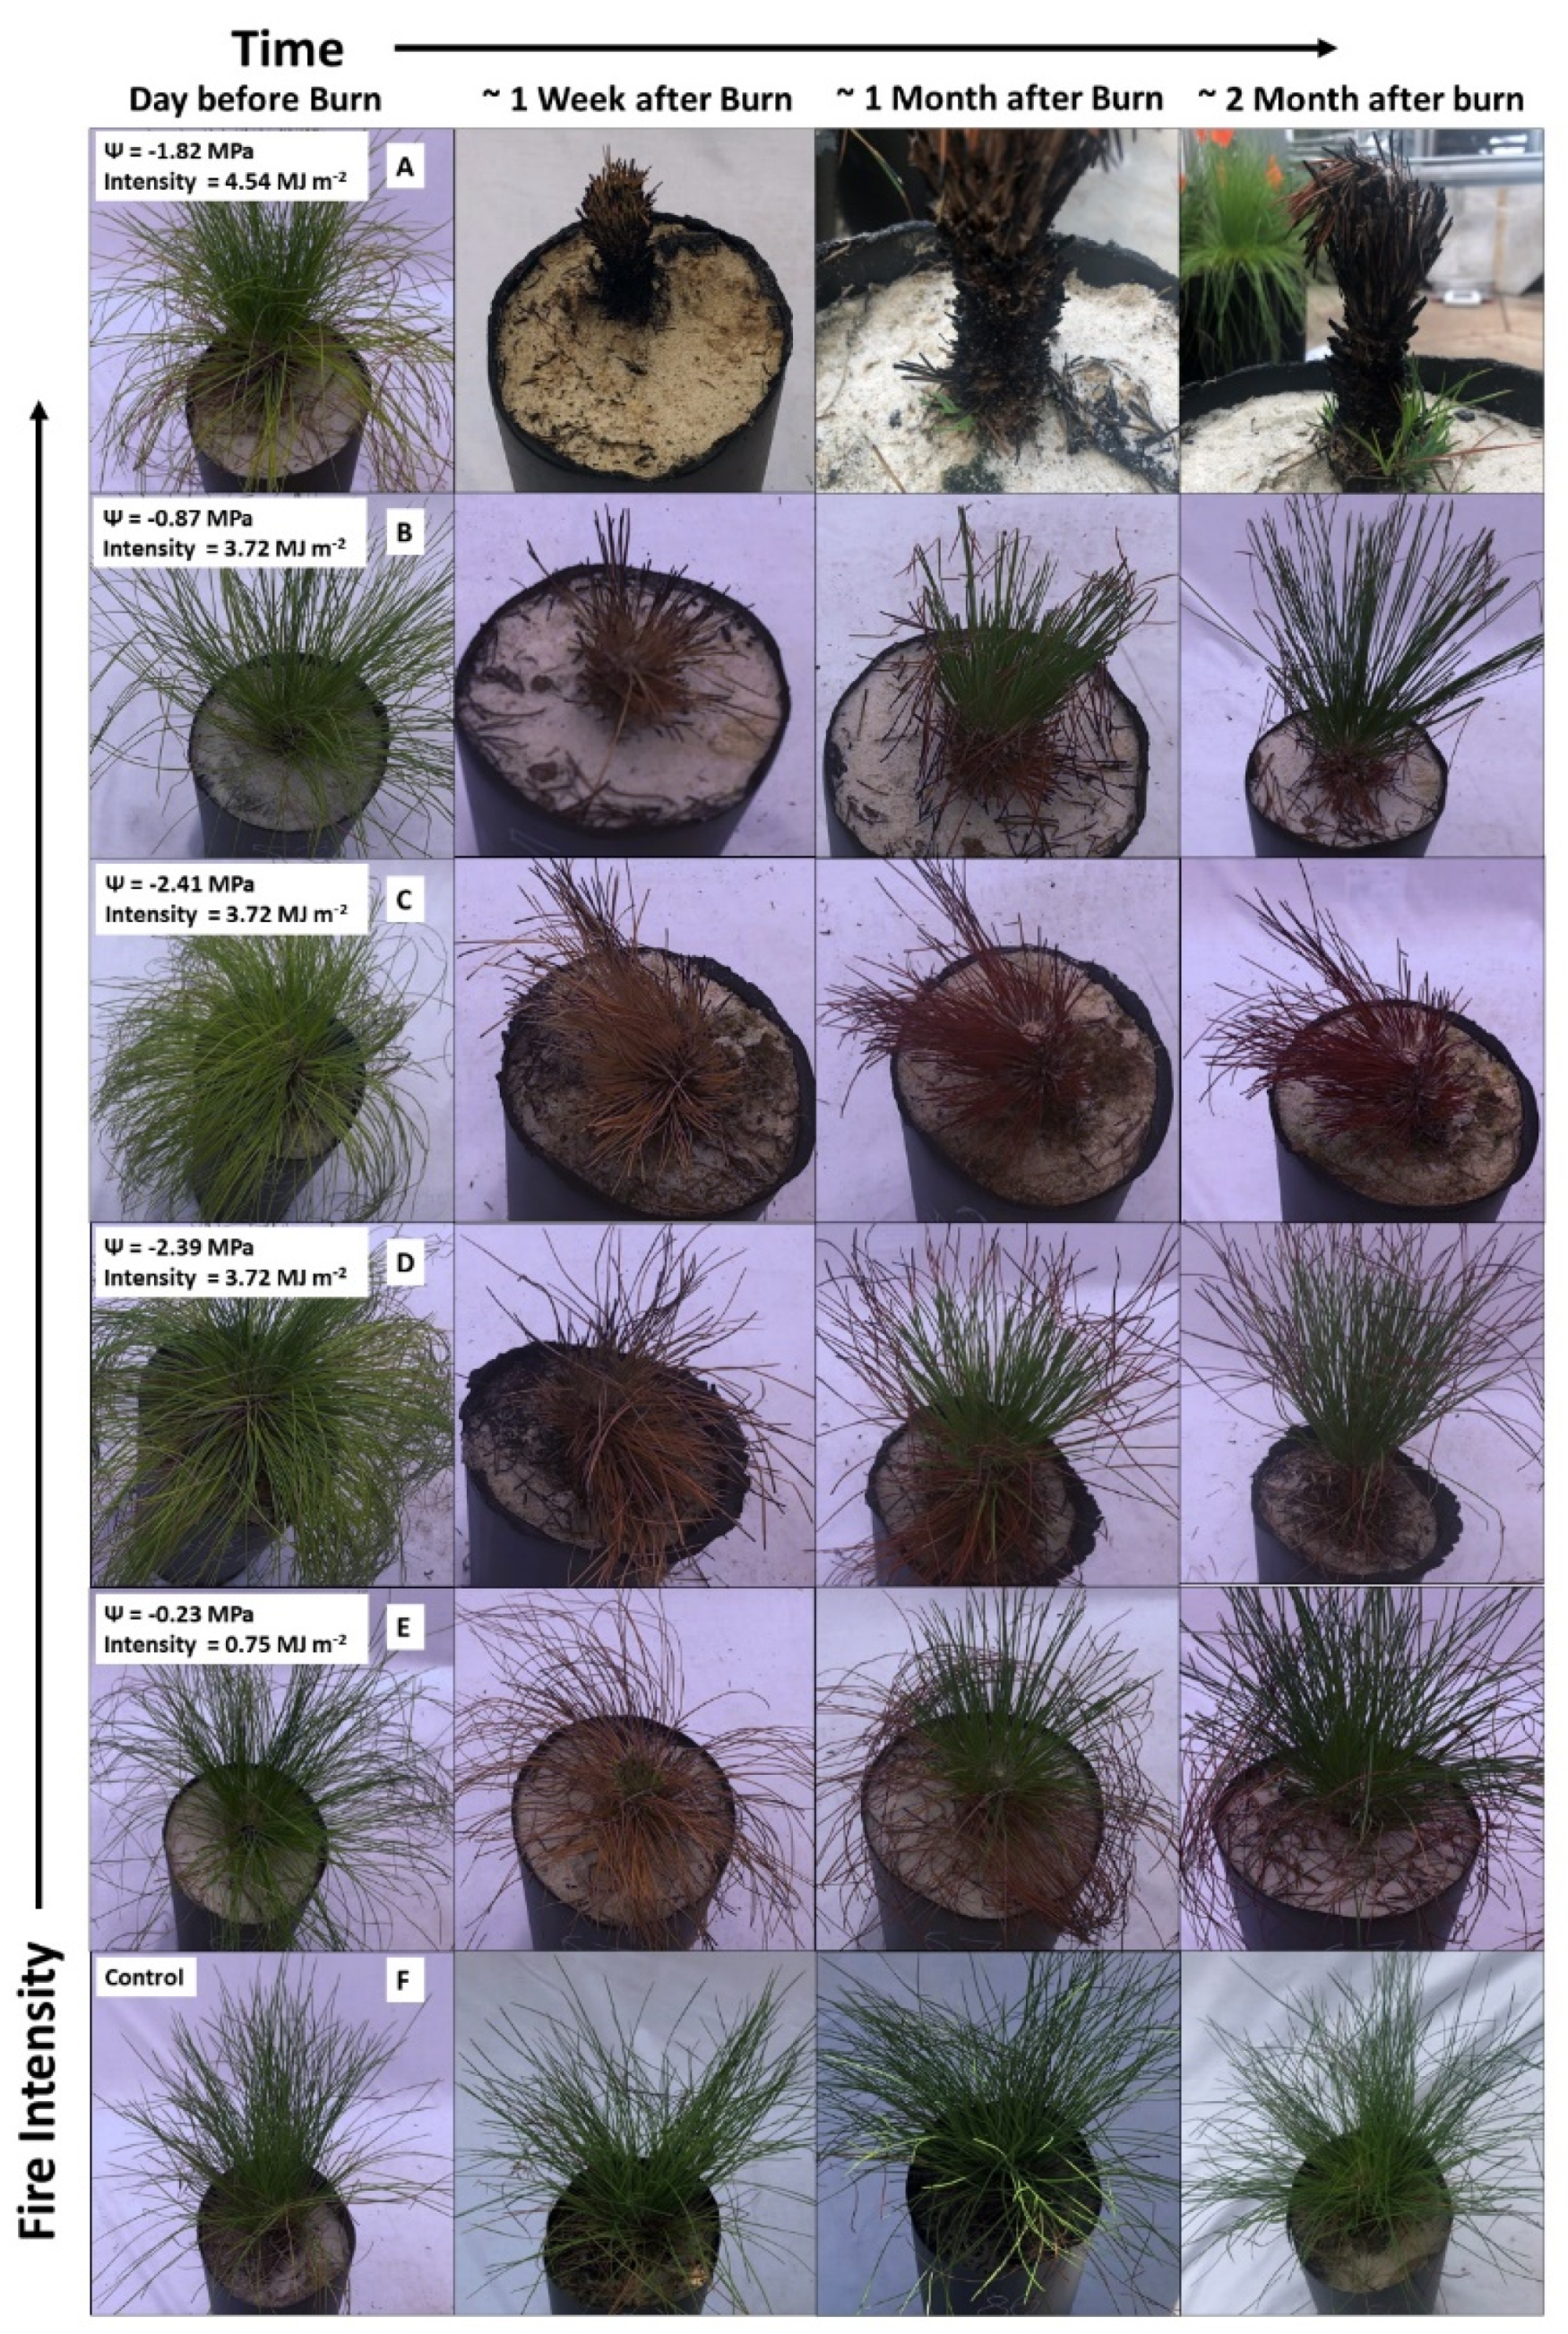
2.3. Plant Imaging and Tracking of Recovery

RGB images were collected of all seedlings at various timepoints, representing pre-burn, day after burn, and then periodically after the burn to track regrowth of foliage using an iPhone 8 (Apple Inc. Cupertino, CA, USA). Unburned seedlings were imaged on the same days for comparison. All seedlings were placed in front of a white fabric background at 1.5 m from a tripod affixed camera within a BW40 growth chamber during daytime light conditions. The reflective walls within the chambers allowed seedlings to be illuminated from all sides to reduce shadows. Images collected more than two days after the second burn were done at the glasshouse on sunny days at the same distance from the camera and in front of the white background. Images collected with the growth chamber appeared very warm due to light bulb temperature, so image color temperature was adjusted to 3000 K to appear similar to those at the greenhouse under full sun. Seedlings were categorizing as either (1) alive, if new needles emerged and persisted from the apical bud, (2) resprout, if the apical bud was killed but new needles emerged from epicormic buds, and (3) dead, if no new growth was present.

2.4. Physiological Measurements

Pre-dawn leaf water potential (Ψpd) was measured using a pressure chamber (Model 600D, PMS Instruments, Corvallis, OR, USA) on the day of the burn on all droughted seedlings and a subset of 3 seedlings per growth chamber per well-watered group. Whole plant conductance was calculated by measuring Ψpd, mid-day water potential (Ψmd), and changes in pot mass (i.e., water lost via transpiration) within growth chambers on all droughted seedlings and a subset of well-watered seedlings at the beginning of drought and the day or two days before burn [34,35]. Ψpd was measured before lights turned on within growth chambers. Between 9:00 and 10:00 seedlings were placed on balances (Ohaus EX35001, Corp. Parsippany, NJ, USA) to measure initial mass ±0.1 g, placed back into the growth chamber, and then final mass measured again approximately two hours later. Stopwatches were used to calculate time between mass measurements for each seedling. Ψmd was measured at the time of the final mass measurement. During transpiration measurements, 6 mil thick plastic was placed on the top of the soil in seedling posts to prevent soil evaporation. Whole plant conductance was then calculated using Equation (2) [36]:
K = I n i t a l   m a s s   ( g ) F i n a l   m a s s   ( g )   Ψ p d Ψ m d elapsed   time   ( s )
After experimental burns, eight seedlings that were never burned or droughted were used to construct a dry down leaf-level transpiration curve within the glasshouse beginning on 24 September 2021. Three seedlings were used as controls and watered regularly while five were droughted. All measurements were performed once before water was withheld and at least twice per week thereafter until plants reached a Ψpd of ~−2.5 MPa at which leaf level transpiration had completely stopped. Seedlings were rewatered and re-measured one week and two weeks after cessation of drought. Leaf level gas exchange was measured using a LI-6800 infra-red gas analyzer (LICOR Biosciences, Lincoln, NE, USA) at ambient temperature and humidity but under a constant light level of 800 µmol−1 m−2 s−1 and under 415 ppm of CO2 at mid-day (11:00–13:00). For each measurement, two fascicles, approximately 5–6 needles, were placed into the cuvette and allowed to equilibrate for approximately 1–2 min before being logged. Needles within the chamber were cut and their leaf area was determined using a portable scanner (Canon LiDE220, Ōta, Tokyo, Japan) and ImageJ software [37] to correct gas-exchange data for leaf area. The LI-6800 IRGAs were matched using the auto match function between every measurement. Pre-dawn (before 07:00, Ψpd) and mid-day (11:00–12:30, Ψmd) leaf water potentials were measured on the same day as leaf level transpiration using a pressure chamber. Ψmd were taken on fascicles adjacent to those being measured for gas exchange.

2.5. Analyses

A combination of ResearchIR (Teledyne FLIR LLC., Wilsonville, OR, USA) and Python were used to analyze infrared images using the Stefan-Boltzmann Equation [19,38]. Total energy release was integrated for the duration of each burn and corrected for the size of the burn area. We also aggregated pixels around each individual pot (646 cm2) to calculate FRE for each seedling. All statistical analyses were performed in program R version 4.0.2 using the ‘Tidyverse’ and ‘cowplot’ suite of packages ([39,40], R Core Team 2020). To synthesize data from previous studies testing the interaction of FRE probability of mortality, we replotted data along the same axis [15,17,21].

3. Results

At the time of the first burn, seedling diameter at soil level was 29.10 ± 0.26 mm (mean ± SE) and plant height was 6.58 ± 0.77 cm for all seedlings. Ψpd were statistically different between droughted and watered control groups on the day of burn (Students t test, n = 51, t = 16.23, p = >0.001). However, there were no differences (α = 0.05) in water potential between the different droughted groups or between the different well-watered groups on the day of burn (Figure S1). Live Fuel Moisture (LFM) of droughted and well-watered seedling was not statistically different immediately prior to each burn (n = 49, t = 0.44, p = 0.65, Figure S2).
FRE released from each fuel loading treatment ranged from 0.66 MJ m−2 to 5.5 MJ m−2 (Table S2 and Figure S3). While fuel loading of the high fire intensity treatment (H and HD at 0.99 kg m−2) was double that of the medium fire intensity treatment (M and MD at 0.49 kg m−2), FRE released was only ~50% greater than M and MD (Figure S3). A timeseries of images representing all seedling outcomes (alive, resprout, and dead) and combination of fire intensities and drought conditions at time of burn are represented within Figure 2 Our fire intensity treatments only killed one seedling and top-killed two causing resprouting (Figure 2A,C). Control seedling images were taken at the same points in time (Figure 2F). Well-watered seedlings that received a low intensity burn still had green needles near the apical bud approximately 1 week after burn (Figure 2E). Many seedlings that had moderate to severe drought (indicated by Ψpd on day of burn) and high intensity fires appeared completely brown after fire but flushed new needles within a month (Figure 2D,E). The seedlings that resprouted or died experienced fire intensity levels of >3.5 MJ m−2 and a Ψpd of at least −1.8 MPa the morning of the burn (Figure 3). The dry down curve of unburned seedlings showed that seedlings had halted mid-day leaf level transpiration and carbon assimilation by a Ψpd of −0.7 MPa (Figure 4A,C), while all transpiration had ceased at a Ψmd of −1.2 MPa (Figure 4B). Two weeks following rewatering, physiological measures of plant status had recovered compared to controls on the same day: those measures being transpiration (n = 7, t = 2.47, p = 0.143), carbon assimilation (n = 7, t = 1, p = 0.356), and Ψpd (n = 7, t = 2.099, p = 0.198, Figure 4A–C). Whole plant conductance the day prior to experimental burns had also ceased at water potentials of −0.7 MPa (Figure 4D).
As a comparison of this study to others, we visualized the interaction of FRE and probability of mortality for droughted and watered conifer seedlings (Figure 5). Other studies [15,17,21] observed complete mortality in droughted and well-watered saplings by 1.5 MJ m−2, while this study had no mortality for well-watered seedlings and one seedling death within the drought group at 1.5 MJ m−2. All droughted seedlings were binned together at each FRE level for this studies data, although actual Ψpd varied at the time of burn.

4. Discussion

While this experiment showed that interaction of extreme drought and fire can kill longleaf pine seedlings (see dead and resprout points in Figure 3), complete mortality and top kill were uncommon. We were unable to definitively determine the threshold of fire intensity and level of drought at which this occurs; however, the only seedling that experienced mortality had a water potential of −2.4 MPa and received a FRE > 3.5 MJ m−2. Even our highest fuel load was only able to kill one seedling and cause two to resprout, suggesting that fuel loads in frequently burned stands are unlikely to cause longleaf seedling mortality under extreme drought unless woody fuels are near the seedling [41]. We also posit that increased incidence of fire-induced mortality of P. palustris seedlings might occur if the plant has a carbohydrate or nutrient deficiencies that may occur following dormancy or following repeated fires. Synthesizing results from previous studies, we showed that P. palustris seedlings are resilient to increased levels of experimental fire when compared to several western United States conifer species (Figure 5). Related studies of how FRE and drought influences mortality have shown that saplings of P. ponderosa, P. contorta and Larix occidentalis are killed at ≤1.5 MJ m−2 regardless of plant water status [15,18,21]. Additionally, P. ponderosa saplings experiencing a drought of −2.0 MPa were killed completely at 0.7 MJ m−2 [17]. However, in the current study, mortality was only observed at FRE > 3.5 MJ m−2, even in droughted seedlings, indicating that P. palustris seedlings are more resilient to drought and fire than western species, likely because of morphological characteristics of its unique seedling stage. Although more Pinus studies need to be evaluated, this study provides additional evidence that the Pinus genus may exhibit a base resistance to fire, as evidenced by all species evaluated to date (e.g., P. palustris, P. ponderosa, P. contorta var. latifolia) exhibiting 100% survival when FRE doses are ≤0.4 MJ m−2.
The only seedling that died (Figure 2C) had the most negative water potential of any seedling burned (Figure 3, Triangular point). One week after burn, foliage was brown, but one-month and two-months post burn foliage appeared red (Figure 2C). Other seedlings that recovered from fire initially appeared brown, but quickly recovered with new needle growth based around the apical bud (Figure 2E). These images indicate that the presence of brown scorched foliage alone cannot be used to predict mortality of P. palustris seedlings, but red scorched foliage may indicate subsequent mortality (but see also [42]). Two seedlings utilized buds at the root collar to sprout approximately one month following fire (Figure 2B). One seedling had its root collar above the soil level, while the other’s root collar was just below the soil level. Within P. palustris, exposed root collars and smaller seedlings had higher rates of mortality, while small seedlings depend on resprouting for survival [43].
The drought treatments prior to burns were effective at creating a range of Ψpd at time of burn and did not differ between groups (Figure S1). However, there was no difference in live fuel moisture between the well-watered and drought treatment which is likely due to the brief duration of the drought and the fact that the plants were kept in the high humidity environment of the growth chambers until the morning of the burn. The dry down curve showed that this population of P. palustris ceased tranpiration and photosynthesis at −0.7 MPa Ψpd and thus, gas exchange in the droughted seedlings is assumed have been near zero. However, two weeks after rewatering of dry down seedlings, gas exchange had completely recovered (Figure 4). Three of the five dry down seedlings lost needles towards the bottom of the stem after rewatering indicating hydraulic stress but otherwise recovered. The hydraulic stress was likely limited to the rhizosphere because gas exchange values were not statistically different than controls two weeks after rewatering (Figure 4). Under field conditions, P. palustris that has had prior drought may lose needles which would result in less insulation the apical bud making subsequent fire potentially more damaging [26].
While this study was unable to determine the FRE that is necessary to kill P. palustris, mortality may begin occurring around 3.0 MJ m−2 when under drought. Drought did not limit seedlings’ ability to respond and regrow in the two months following fire. After P. palustris is burned, it may be difficult to determine survival for up to a month within the growing season. This study adds to the growing knowledge of plant response to fire intensity, in addition to better understanding P. palustris’ response to fire and drought. Although P. palustris are unlikely to die from fire on managed lands, it does occur [13,43,44,45,46], creating a disconnect between experimental lab-based burns and practical applications of fire outdoors. The severity of our experimental drought is likely beyond the point that which safe prescribed fire would occur [47]. Therefore, P. palustris are unlikely to die during fire on managed lands without the presence of coarse woody debris to further increase intensity to cause seedlings mortality [41]. Additionally, the heterogeneity of fire intensity during prescribed burns is not captured in lab conditions and could also result in seedling mortality. Future investigations should use fine scale measurements of FRE outdoors to accurately assess fire energy and mortality to compare to this study and others.

Supplementary Materials

The following supporting information can be downloaded at: https://www.mdpi.com/article/10.3390/fire5050128/s1, Tables S1 and S2 and Figures S1–S4.

Author Contributions

Conceptualization, L.A.W. and D.M.J.; Formal analysis, L.A.W.; Methodology, L.A.W., D.M.J., R.W.T., J.J.O. and R.N.S. Writing—original draft, L.A.W.; Writing—review and editing, L.A.W., R.W.T., D.M.J., D.P.A., J.J.O. and A.M.S.S. All authors have read and agreed to the published version of the manuscript.

Funding

This research was funded by National Science Foundation Graduate Research Fellowship Program #1-842396 (LAW), USDA National Institute of Food and Agriculture through McIntire Stennis Project 1023985 (D.P.A. & D.M.J.), Department of Energy DE-EM0004391 (D.P.A.). Department of Defense Strategic Environmental Research and Development Program RC19-C1-1119 (D.P.A. & R.W.T) and National Science Foundation DMS-1520873 (A.M.S.S).

Institutional Review Board Statement

Not applicable.

Informed Consent Statement

Not applicable.

Data Availability Statement

Data available by contacting the corresponding author.

Acknowledgments

The Authors would like to thank Ben Hornsby for his assistance burning seedlings at the USFS Fire Laboratory, David Love, Kentrell Richardson and Cory McClung for help with measurements and Suzanne Tate and Hannah Weissinger for support at the greenhouse. JC Domec, Justine Valadez, Monica Harmon, and Kathryn Baker provided additional thoughtful discussion.

Conflicts of Interest

The authors declare no conflict of interest.

References

  1. IPCC. Climate Change 2014–Impacts, Adaptation and Vulnerability: Part A: Global and Sectoral Aspects: Working Group II Contribution to the IPCC Fifth Assessment Report: Volume 1: Global and Sectoral Aspects. Cambridge University Press, Cambridge. 2014. Available online: https://www.cambridge.org/core/books/climate-change-2014-impacts-adaptation-and-vulnerability-part-a-global-and-sectoral-aspects/1BE4ED76F97CF3A75C64487E6274783A (accessed on 15 January 2022).
  2. IPCC. Summary for Policymakers. In Climate Change 2021: The Physical Science Basis. Contribution of Working Group I to the Sixth Assessment Report of the Intergovernmental Panel on Climate Change; Masson-Delmotte, V., Zhai, P., Pirani, A., Connors, S.L., Péan, C., Berger, S., Caud, N., Chen, Y., Goldfarb, L., Gomis, M.I., Eds.; Cambridge University Press: Cambridge, UK, 2021. [Google Scholar]
  3. IPCC. Climate Change 2022: Impacts, Adaptation, and Vulnerability; Contribution of Working Group II to the Sixth Assessment Report of the Intergovernmental Panel on Climate Change; Pörtner, H.-O., Roberts, D.C., Tignor, M., Poloczanska, E.S., Mintenbeck, K., Alegría, A., Craig, M., Langsdorf, S., Löschke, S., Möller, V., et al., Eds.; Cambridge University Press: Cambridge, UK, 2022. [Google Scholar]
  4. Hartmann, H.; Moura, C.F.; Anderegg, W.R.L.; Ruehr, N.K.; Salmon, Y.; Allen, C.D.; Arndt, S.K.; Breshears, D.D.; Davi, H.; Galbraith, D. Research frontiers for improving our understanding of drought-induced tree and forest mortality. New Phytol. 2018, 218, 15–28. [Google Scholar] [CrossRef] [PubMed]
  5. Woolman, A.M.; Coop, J.D.; Shaw, J.D.; DeMarco, J. Extent of recent fire-induced losses of ponderosa pine forests of Arizona and New Mexico, USA. For. Ecol. Manag. 2022, 520, 120381. [Google Scholar] [CrossRef]
  6. Smith, M.D. The ecological role of climate extremes: Current understanding and future prospects. J. Ecol. 2011, 99, 651–655. [Google Scholar] [CrossRef]
  7. Seneviratne, S.I.; Nicholls, N.; Easterling, D.; Goodess, C.M.; Kanae, S.; Kossin, J.; Luo, Y.; Marengo, J.; McInnes, K.; Rahimi, M.; et al. Changes in climate extremes and their impacts on the natural physical environment. In Managing the Risks of Extreme Events and Disasters to Advance Climate Change Adaptation. A Special Report of Working Groups I and II of the Intergovernmental Panel on Climate Change (IPCC); Cambridge University Press: Cambridge, UK, 2012. [Google Scholar]
  8. Easterling, D.R.; Kunkel, K.E.; Arnold, J.R.; Knutson, T.; LeGrande, A.N.; Leung, L.R.; Vose, R.S.; Waliser, D.E.; Wehner, M.F. Precipitation Change in the United States. In Climate Science Special Report: Fourth National Climate Assessment, 1; (GSFC-E-DAA-TN49608); U.S. Global Change Research Program: Washington, DC, USA, 2017. [Google Scholar]
  9. Mitchell, R.J.; Liu, Y.; O’Brien, J.J.; Elliott, K.J.; Starr, G.; Miniat, C.F.; Hiers, J.K. Future climate and fire interactions in the southeastern region of the United States. For. Ecol. Manag. 2014, 327, 316–326. [Google Scholar] [CrossRef]
  10. Bowman, D.M.J.S.; Williamson, G.J.; Abatzoglou, J.T.; Kolden, C.A.; Cochrane, M.A.; Smith, A.M.S. Human exposure and sensitivity to globally extreme wildfire events. Nat. Ecol. Evol. 2017, 1, 58. [Google Scholar] [CrossRef] [PubMed]
  11. Ahlgren, C.E. Some Effects of Fire on Reproduction and Growth of Vegetation in Northeastern Minnesota. Ecology 1960, 41, 431–445. [Google Scholar] [CrossRef]
  12. Gisborne, H.T. Measuring Forest-Fire Danger in Northern Idaho. No. 29; United States, Department of Agriculture: Washington, DC, USA, 1928. [Google Scholar]
  13. Brethauer, D.K.; Sharma, A.; Vogel, J.G.; Miller, D.L.; van Santen, E. Longleaf pine seedling growth and survival: Effects of season and intensity of simulated prescribed burning. For. Ecol. Manag. 2021, 502, 119719. [Google Scholar] [CrossRef]
  14. Smith, A.M.S.; Sparks, A.M.; Kolden, C.A.; Abatzoglou, J.T.; Talhelm, A.F.; Johnson, D.M.; Boschetti, L.; Lutz, J.A.; Apostol, K.G.; Yedinak, K.M.; et al. Towards a new paradigm in fire severity research using dose–response experiments. Int. J. Wildland Fire 2016, 25, 158–166. [Google Scholar] [CrossRef]
  15. Smith, A.M.S.; Talhelm, A.F.; Johnson, D.M.; Sparks, A.M.; Kolden, C.A.; Yedinak, K.M.; Apostol, K.G.; Tinkham, W.T.; Abatzoglou, J.T.; Lutz, J.A.; et al. Effects of fire radiative energy density dose on Pinus contorta and Larix occidentalis seedling physiology and mortality. Int. J. Wildland Fire 2017, 26, 82–94. [Google Scholar] [CrossRef]
  16. Dickinson, M.B.; Butler, B.W.; Hudak, A.T.; Bright, B.C.; Kremens, R.L.; Klauberg, C. Inferring energy incident on sensors in low-intensity surface fires from remotely sensed radiation and using it to predict tree stem injury. Int. J. Wildland Fire 2019, 28, 230. [Google Scholar] [CrossRef]
  17. Partelli-Feltrin, R.; Johnson, D.M.; Sparks, A.M.; Adams, H.D.; Kolden, C.A.; Nelson, A.S.; Smith, A.M.S. Drought Increases Vulnerability of Pinus ponderosa Saplings to Fire-Induced Mortality. Fire 2020, 3, 56. [Google Scholar] [CrossRef]
  18. Partelli-Feltrin, R.; Smith, A.M.S.; Adams, H.D.; Kolden, C.A.; Johnson, D.M. Short- and long-term effects of fire on stem hydraulics in Pinus ponderosa saplings. Plant Cell Environ. 2021, 44, 696–705. [Google Scholar] [CrossRef] [PubMed]
  19. Ruswick, S.K.; O’Brien, J.J.; Aubrey, D.P. Carbon starvation is absent regardless of season of burn in Liquidambar styraciflua L. For. Ecol. Manag. 2021, 479, 118588. [Google Scholar] [CrossRef]
  20. Wooster, M.J.; Roberts, G.J.; Giglio, L.; Roy, D.P.; Freeborn, P.H.; Boschetti, L.; Justice, C.; Ichoku, C.; Schroeder, W.; Davies, D.; et al. Satellite remote sensing of active fires: History and current status, applications and future requirements. Remote Sens. Environ. 2021, 267, 112694. [Google Scholar] [CrossRef]
  21. Steady, W.D.; Partelli Feltrin, R.; Johnson, D.M.; Sparks, A.M.; Kolden, C.A.; Talhelm, A.F.; Lutz, J.A.; Boschetti, L.; Hudak, A.T.; Nelson, A.S.; et al. The Survival of Pinus ponderosa Saplings Subjected to Increasing Levels of Fire Behavior and Impacts on Post-Fire Growth. Fire 2019, 2, 23. [Google Scholar] [CrossRef]
  22. Jolly, W.M.; Johnson, D.M. Pyro-Ecophysiology: Shifting the Paradigm of Live Wildland Fuel Research. Fire 2018, 1, 8. [Google Scholar] [CrossRef]
  23. Melvin, M.A. National Prescribed Fire Use Report. Tech. Bull. 2020, 4–20. Available online: https://www.nwfirescience.org/sites/default/files/publications/2020-Prescribed-Fire-Use-Report-1.pdf (accessed on 15 January 2022).
  24. Keeley, J.E. Ecology and evolution of pine life histories. Ann. For. Sci. 2012, 69, 445–453. [Google Scholar] [CrossRef]
  25. Wahlenberg, W.G. Longleaf Pine: Its Use, Ecology, Regeneration, Protection, Growth, and Management; US Forest Service: Washington, DC, USA, 1946. [Google Scholar]
  26. O’Brien, J.J.; Hiers, J.K.; Callaham, M.A.; Mitchell, R.J.; Jack, S.B. Interactions among Overstory Structure, Seedling Life-history Traits, and Fire in Frequently Burned Neotropical Pine Forests. Ambio 2008, 37, 542–547. [Google Scholar] [CrossRef]
  27. Frost, C. History and future of the longleaf pine ecosystem. In The Longleaf Pine Ecosystem; Springer: Berlin/Heidelberg, Germany, 2007; pp. 9–48. [Google Scholar]
  28. Boyer, W.D. Pinus palustris Mill. longleaf pine. Silv. N. Am. 1990, 1, 405–412. [Google Scholar]
  29. Aubrey, D.P. Grass(stage)root movement to ensure future resilience of longleaf pine ecosystems. New For. 2021. [Google Scholar] [CrossRef]
  30. Fonda, R.W. Burning Characteristics of Needles from Eight Pine Species. For. Sci. 2001, 47, 390–396. [Google Scholar]
  31. Mitchell, R.J.; Hiers, J.K.; O’Brien, J.; Starr, G. Ecological forestry in the Southeast: Understanding the ecology of fuels. J. For. 2009, 107, 391–397. [Google Scholar]
  32. Wiggers, M.S.; Kirkman, L.K.; Boyd, R.S.; Hiers, J.K. Fine-scale variation in surface fire environment and legume germination in the longleaf pine ecosystem. For. Ecol. Manag. 2013, 310, 54–63. [Google Scholar] [CrossRef]
  33. Pivovaroff, A.L.; Emery, N.; Sharifi, M.R.; Witter, M.; Keeley, J.E.; Rundel, P.W. The Effect of Ecophysiological Traits on Live Fuel Moisture Content. Fire 2019, 2, 28. [Google Scholar] [CrossRef]
  34. Cochard, H.; Bréda, N.; Granier, A. Whole tree hydraulic conductance and water loss regulation in Quercus during drought: Evidence for stomatal control of embolism? Ann. For. Sci. 1996, 53, 197–206. [Google Scholar] [CrossRef]
  35. Dichio, B.; Montanaro, G.; Sofo, A.; Xiloyannis, C. Stem and whole-plant hydraulics in olive (Olea europaea) and kiwifruit (Actinidia deliciosa). Trees 2013, 27, 183–191. [Google Scholar] [CrossRef]
  36. Tsuda, M.; Tyree, M.T. Plant hydraulic conductance measured by the high pressure flow meter in crop plants. J. Exp. Bot. 2000, 51, 823–828. [Google Scholar] [CrossRef]
  37. Abramoff, M.D.; Magalhães, P.J.; Ram, S.J. Image processing with Image. J. Biophotonics Int. 2004, 11, 36–42. [Google Scholar]
  38. O’Brien, J.J.; Loudermilk, E.L.; Hornsby, B.; Hudak, A.T.; Bright, B.C.; Dickinson, M.B.; Hiers, J.K.; Teske, C.; Ottmar, R.D. High-resolution infrared thermography for capturing wildland fire behaviour: RxCADRE 2012. Int. J. Wildland Fire 2015, 25, 62–75. [Google Scholar] [CrossRef]
  39. Wilke, C. cowplot: Streamlined Plot Theme and Plot Annotations for ’ggplot2. 2019. Available online: https://CRAN.R-project.org/package=cowplot (accessed on 15 January 2022).
  40. Wickham, H.; Averick, M.; Bryan, J.; Chang, W.; McGowan, L.D.; François, R.; Grolemund, G.; Hayes, A.; Henry, L.; Hester, J.; et al. Welcome to the Tidyverse. J. Open Source Softw. 2019, 4, 1686. [Google Scholar] [CrossRef]
  41. O’Brien, J.J.; Loudermilk, E.L.; Hiers, J.K.; Pokswinski, S.M.; Hornsby, B.; Hudak, A.T.; Strother, D.; Rowell, E.; Bright, B.C. Canopy-Derived Fuels Drive Patterns of In-Fire Energy Release and Understory Plant Mortality in a Longleaf Pine (Pinus palustris) Sandhill in Northwest Florida, USA. Can. J. Remote Sens. 2016, 42, 489–500. [Google Scholar] [CrossRef]
  42. Hammond, W.M.; Yu, K.; Wilson, L.A.; Will, R.E.; Anderegg, W.R.; Adams, H.D. Dead or dying? Quantifying the point of no return from hydraulic failure in drought-induced tree mortality. New Phytol. 2019, 223, 1834–1843. [Google Scholar] [CrossRef] [PubMed]
  43. Jin, S.; Moule, B.; Yu, D.; Wang, G.G. Fire Survival of Longleaf Pine (Pinus palustris) Grass Stage Seedlings: The Role of Seedling Size, Root Collar Position, and Resprouting. Forests 2019, 10, 1070. [Google Scholar] [CrossRef]
  44. Grace, S.L.; Platt, W.J. Effects of Adult Tree Density and Fire on the Demography of Pregrass Stage Juvenile Longleaf Pine (Pinus palustris Mill.). J. Ecol. 1995, 83, 75–86. [Google Scholar] [CrossRef]
  45. Jack, S.B.; Hiers, J.K.; Mitchell, R.J.; Gagnon, J.L. Fuel loading and fire intensity-effects on longleaf pine seedling survival. In Proceedings of the 14th Biennial Southern Silvicultural Research Conference, Athens, Georgia, 26 February–1 March 2007; Gen. Tech. Rep. SRS–121; Stanturf, J.A., Ed.; US Department of Agriculture, Forest Service, Southern Research Station: Asheville, NC, USA, 2010; pp. 275–279. Available online: https://www.fs.usda.gov/treesearch/pubs/35825 (accessed on 15 January 2022).
  46. Knapp, B.O.; Pile, L.S.; Walker, J.L.; Geoff Wang, G. Fire effects on a fire-adapted species: Response of grass stage longleaf pine seedlings to experimental burning. Fire Ecol. 2018, 14, 2. [Google Scholar] [CrossRef]
  47. Addington, R.N.; Hudson, S.J.; Hiers, J.K.; Hurteau, M.D.; Hutcherson, T.F.; Matusick, G.; Parker, J.M. Relationships among wildfire, prescribed fire, and drought in a fire-prone landscape in the south-eastern United States. Int. J. Wildland Fire 2015, 24, 778–783. [Google Scholar] [CrossRef] [Green Version]
Figure 1. Low, medium, and high fuel loads after ignition. (A) Burn platform with 0.24 kg−1 m−2 of fuel, low fuel load (L). (B) Burn Platform with 0.49 kg−1 m−2 of fuel, medium fuel load (M). (C) Burn platform with 0.99 kg−1 m−2 of fuel, high fuel load (H).
Fire 05 00128 g001
Figure 2. Burned and unburned longleaf seedlings over time. Each column represents a point in time relative to when burned with time since burn increasing to the right. Each row is an individual seedling with the pre-dawn water potential on day of burn (Ψ), and individual seedling burn intensity, with intensity between seedlings increasing bottom to top. The first row (A) is one of the two seedlings that resprouted. The second row (B), is of a seedling with moderate drought but very intense fire, while the third row (C) is the only seedling that died. The fourth row (D) is of a droughted seedling with moderate to severe intensity burn. The fifth row (E) is a seedling that was well watered with a low intensity burn. The sixth row (F) is a control seedling with images at the same points in time.
Fire 05 00128 g002
Figure 3. Pre-dawn water potential (MPa) and Fire Radiative Energy (FRE, MJ m−2) at time of burn. Different colors represent each treatment group, and shape represents seedling fate. Points circled in red are those that either sprouted or died. Points with a water potential of 0 were not measured but plotted to show the distribution of FRE for the whole population of burned plants. Treatment acronyms are low fuel loading (L), low fuel loading + drought (LD), medium fuel loading (M), medium fuel loading + drought (MD), high fuel loading (H), high fuel loading + drought (HD). Vertical dashed red line is the point at which mid-day leaf level transpiration had stopped according to our dry down curve.
Fire 05 00128 g003
Figure 4. Plant physiological parameters measured throughout the experiment. (A) Interaction of predawn water potential (MPa) and leaf level transpiration (E, mmol m−2 s−1). (B) Interaction of midday water potential (MPa) and leaf level transpiration (E, mmol M−2 s−1). (C) Interaction of predawn water potential (MPa) and leaf level carbon assimilation (A, µmol m−2 s−1). For panels (AC), Control trees are squares, while dry down and dry drown recovery trees are circles. (D) Interaction of predawn water potential (MPa) and whole plant conductance (K, mmol MPa−1 s−1) of trees the day before burn. For panel D, each point color is a different burn treatment, acronyms are control (C), low fuel loading (L), low fuel loading + drought (LD), medium fuel loading (M), medium fuel loading + drought (MD), high fuel loading (H), high fuel loading + drought (HD). Vertical dashed red line is the point at which mid-day leaf level transpiration had stopped during the post burn dry down curve (−0.7 MPa).
Fire 05 00128 g004
Figure 5. Interaction of fire radiative energy levels (FRE) (MJ m−2) and probability of mortality for this study and others. Well-watered samples are represented by circular symbols and solid lines while droughted samples are represented by triangular symbols and dotted lines. Data from other studies are redrawn from [15,17,21]. Seedlings that resprouted were considered alive for the P. palustris data from this study. Individual points are averaged from all droughted or well-watered samples at a given FRE.
Fire 05 00128 g005
Publisher’s Note: MDPI stays neutral with regard to jurisdictional claims in published maps and institutional affiliations.

