
Investigation of Spontaneous Combustion Zones and Index Gas Prediction System in Goaf of “Isolated Island” Working Face


Abstract
:1. Introduction
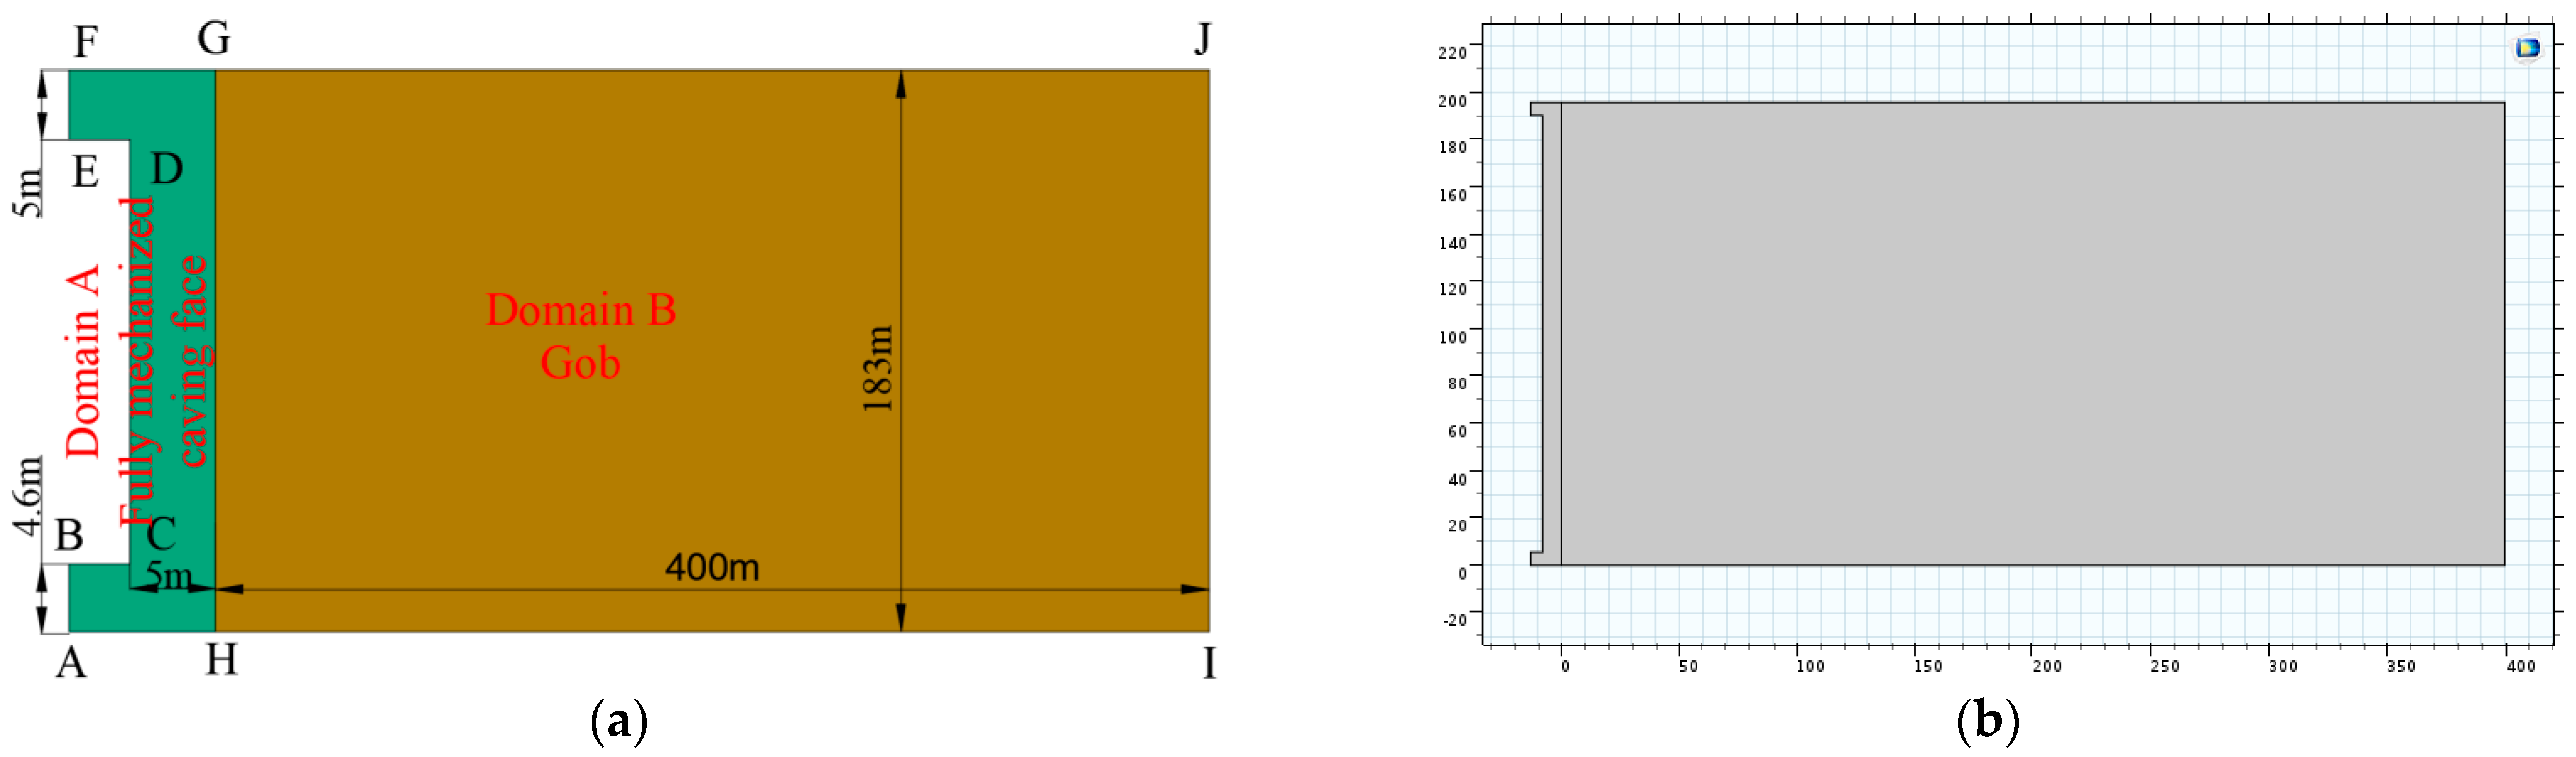
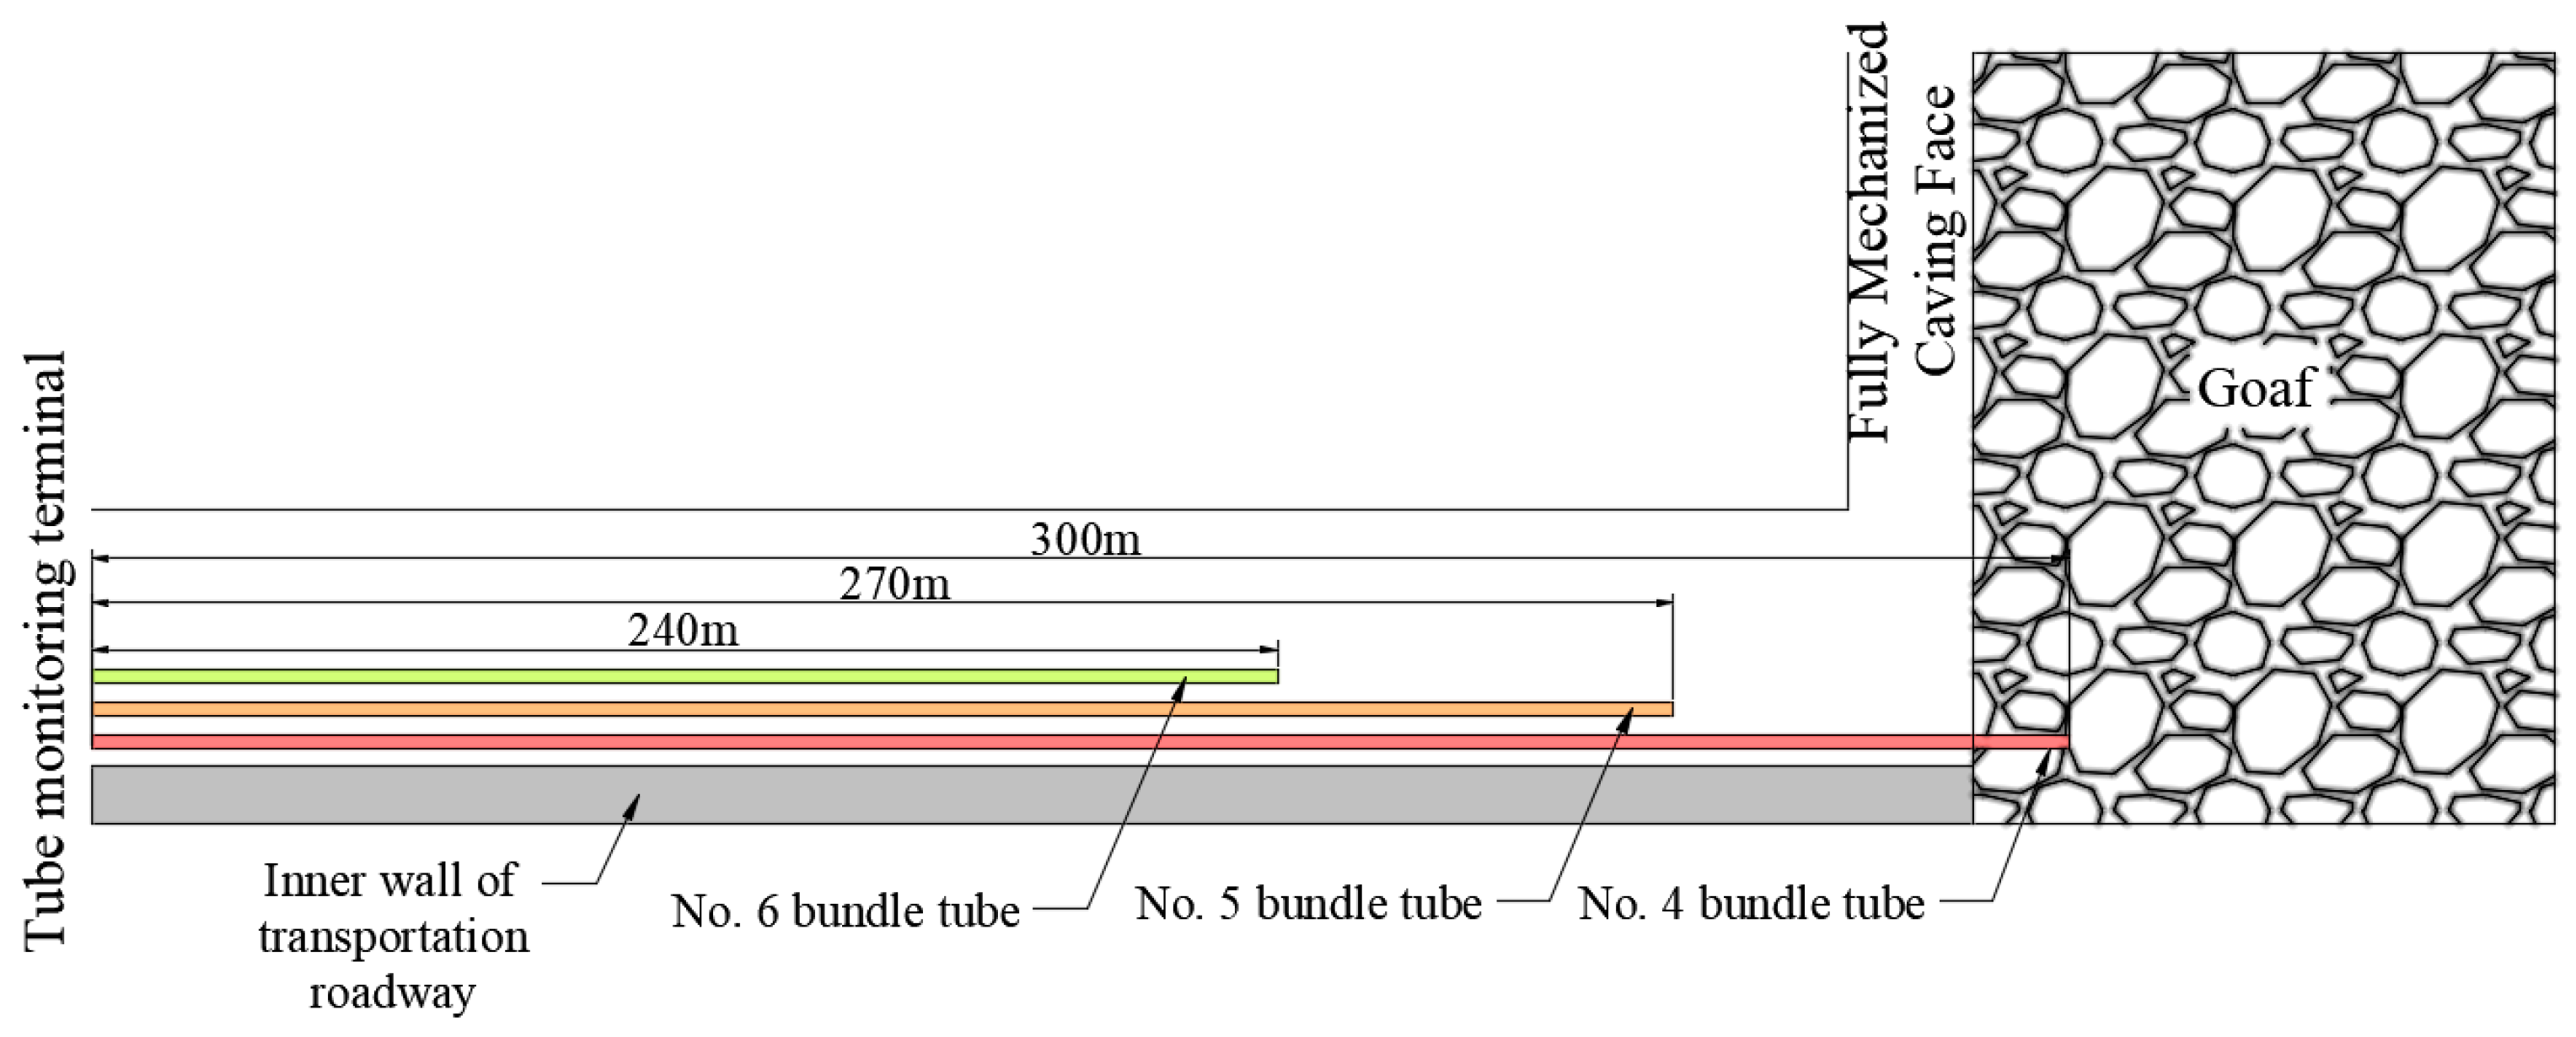
2. Project Overview
3. Mathematical Model
3.1. Theory of the Goaf Flow Field
3.2. Gas Concentration in Goaf
3.3. Determination of Key Parameters of the Numerical Simulation
- (1)
- Coefficient of dilatancy
- (2)
- Porosity
- (3)
- Permeability
- (4)
- Oxygen diffusion coefficient
- (5)
- Oxygen consumption rate
4. Model Results and Analysis
4.1. Simulation Cases and Conditions
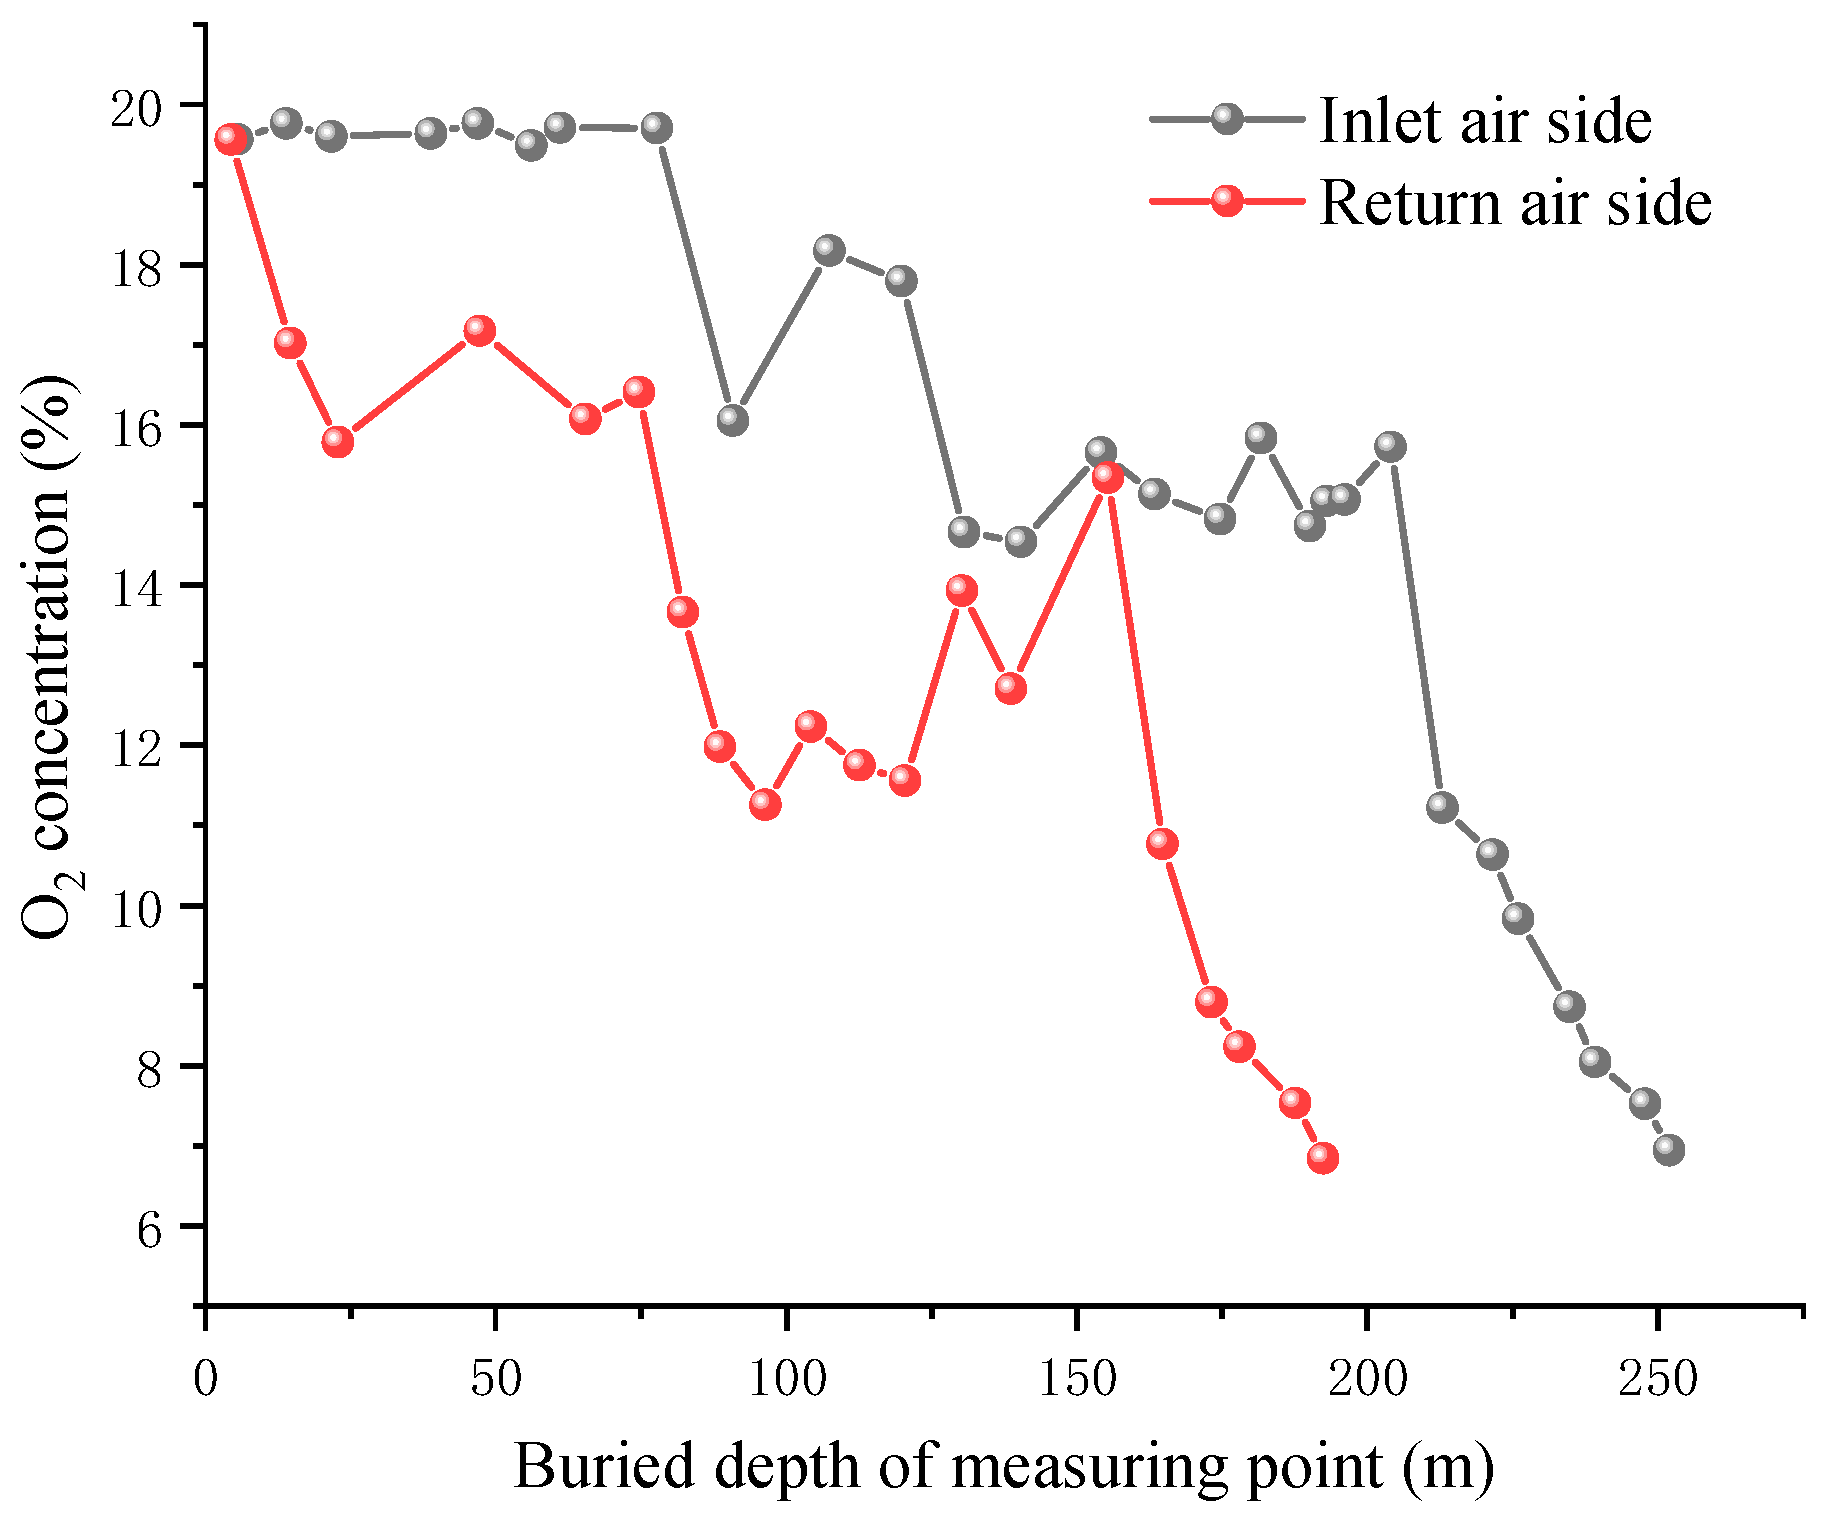
4.2. Simulation Results and Verification
4.2.1. Scheme Design
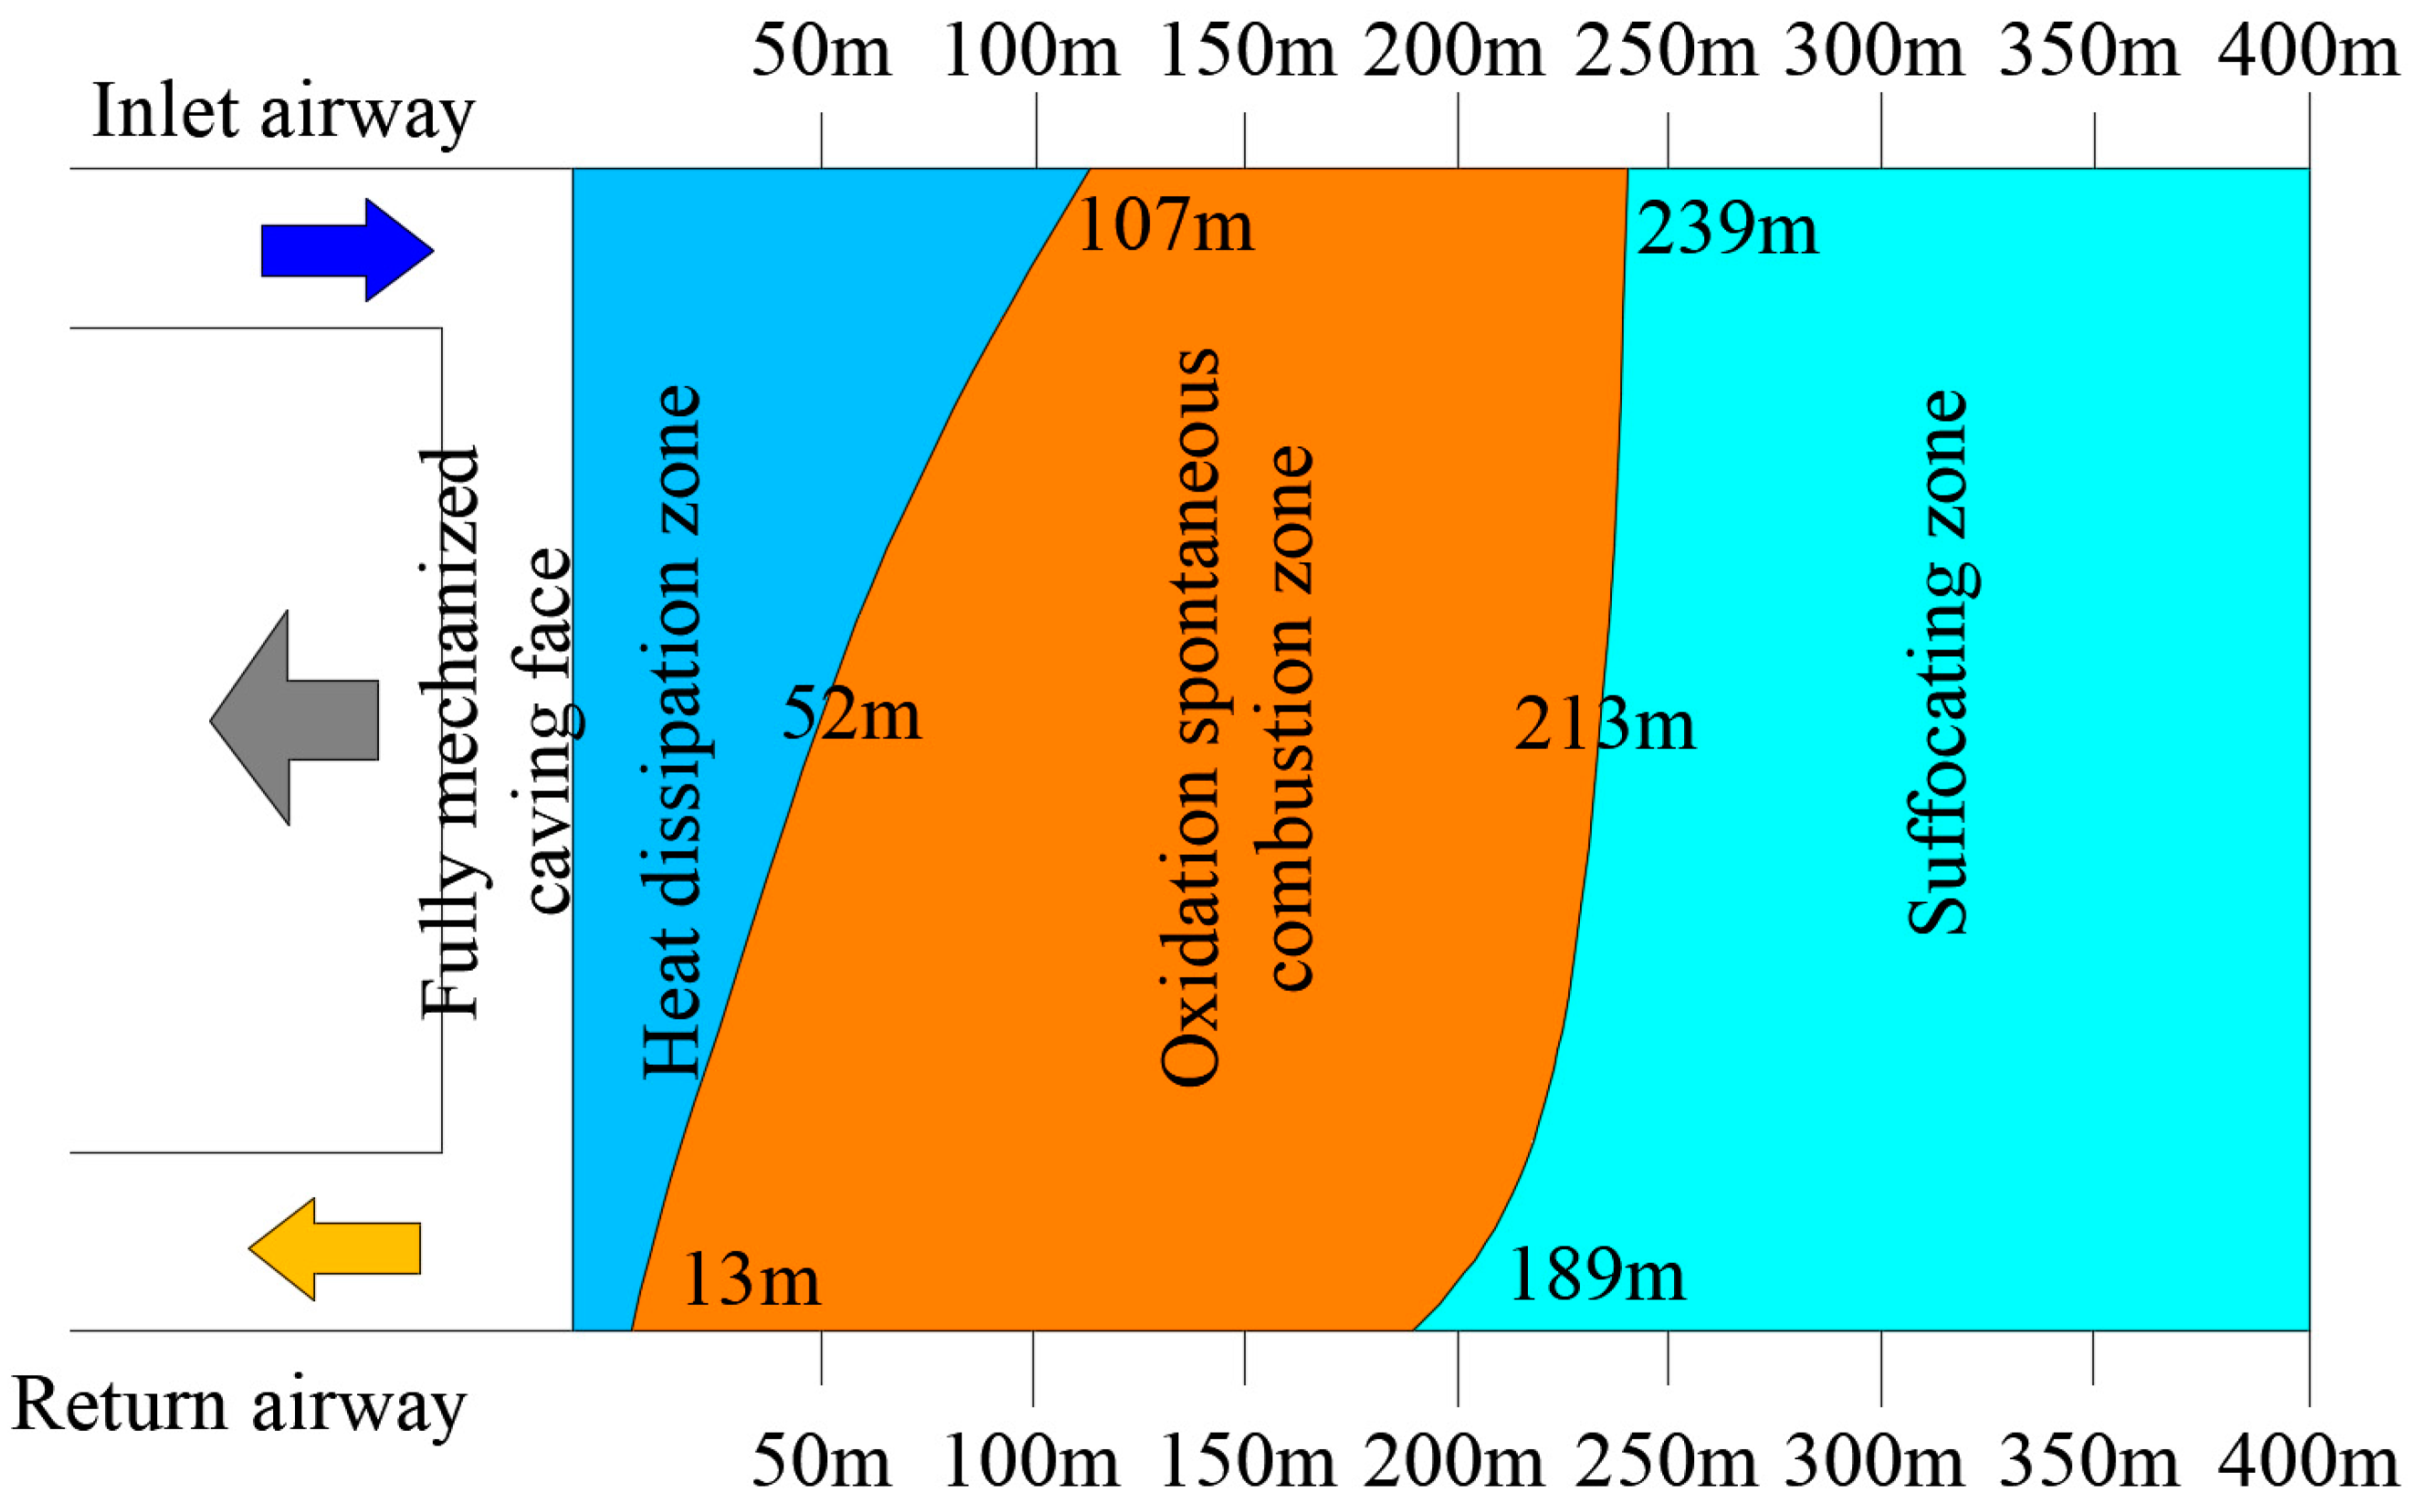
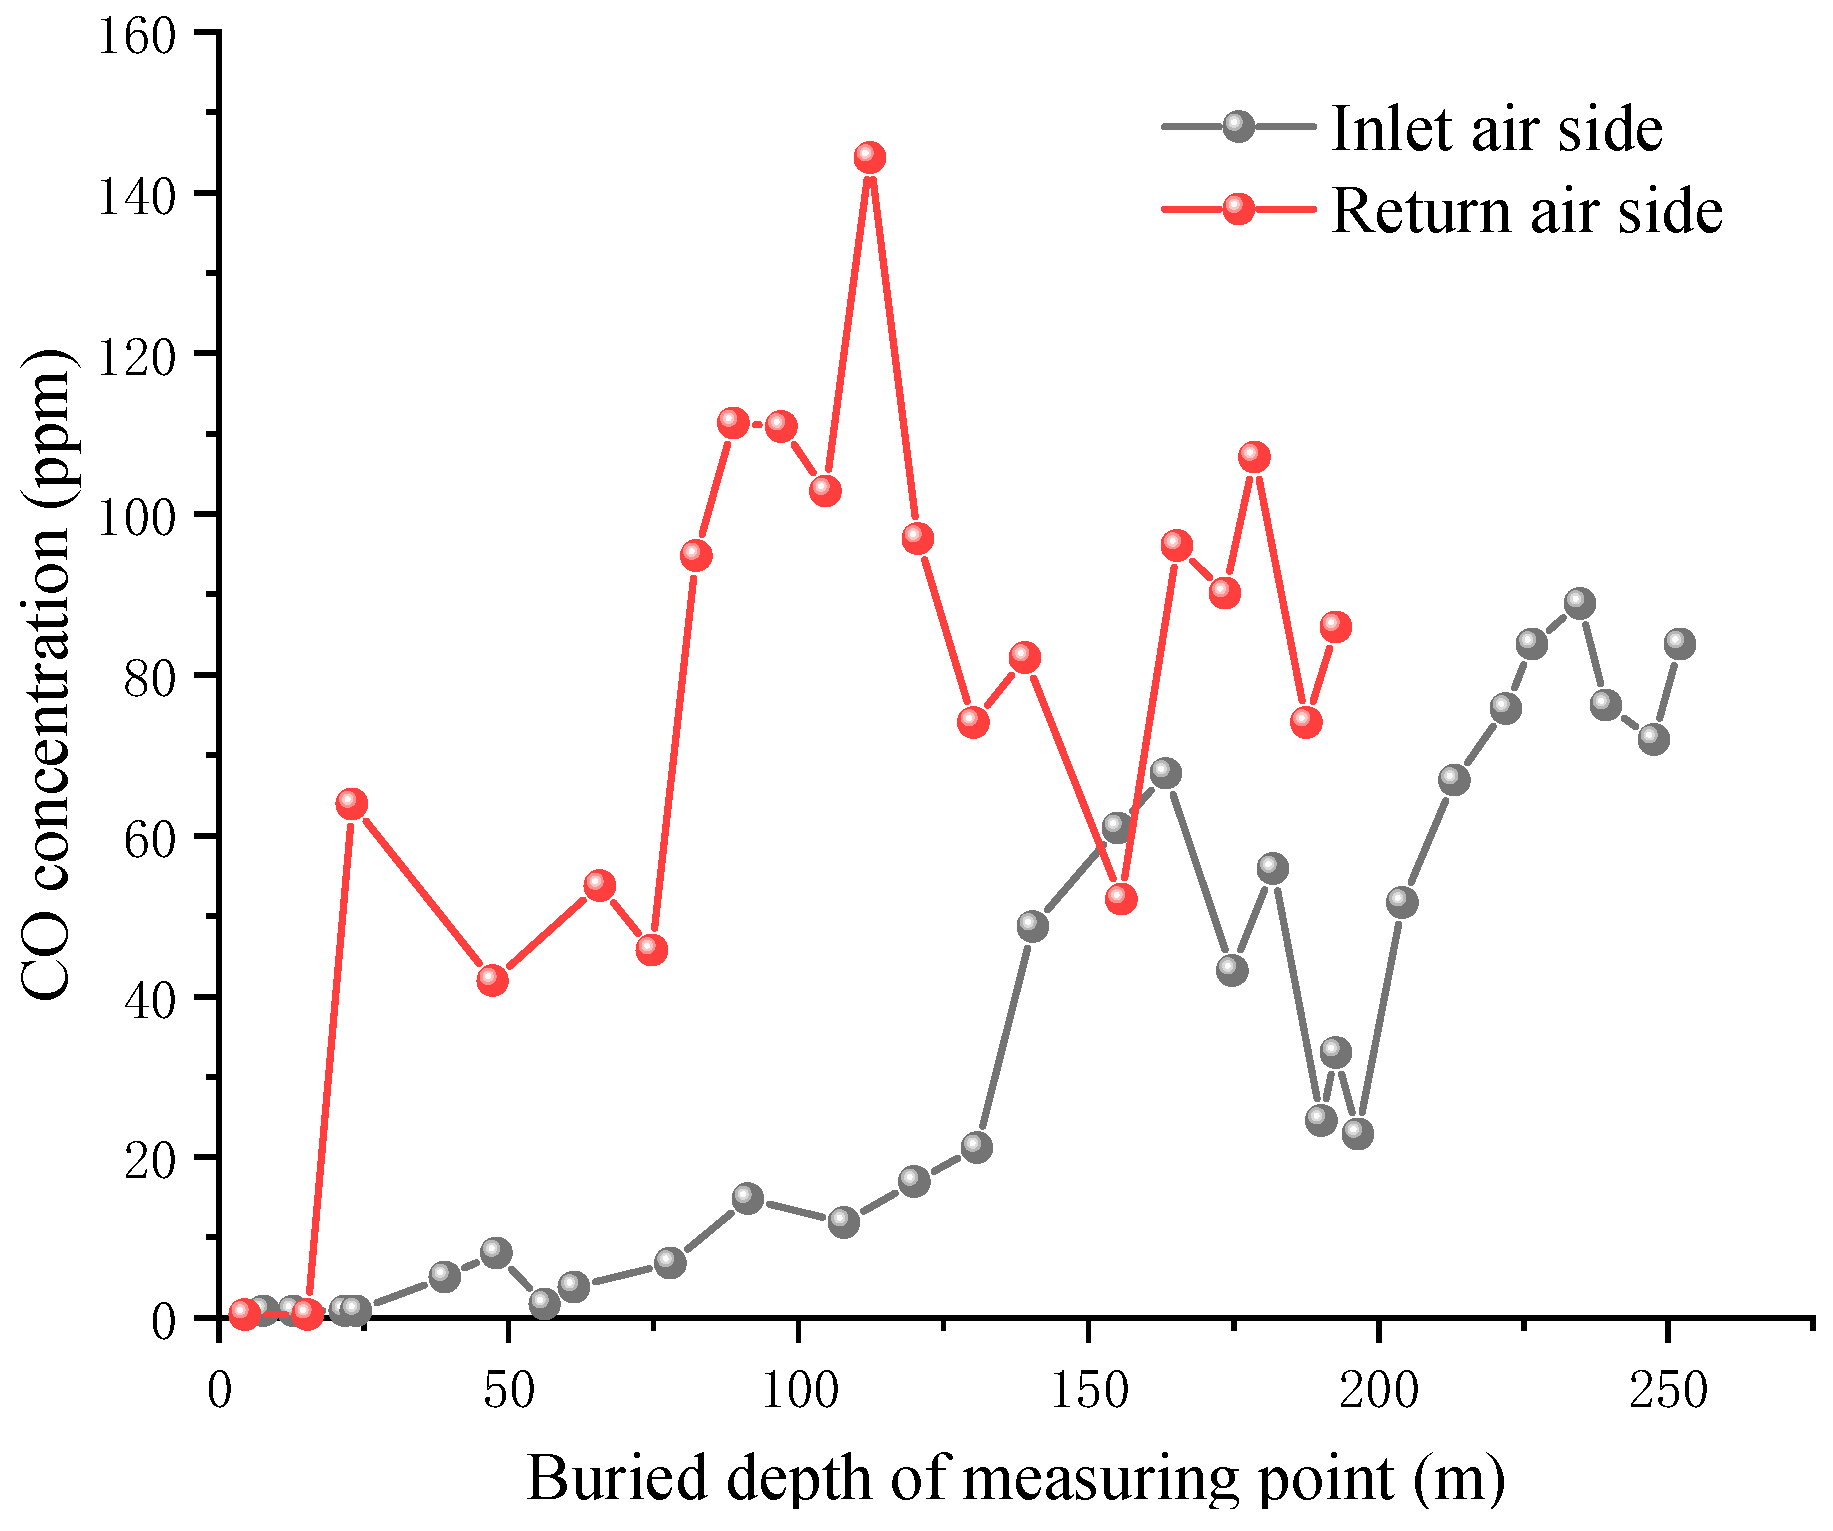
4.2.2. Result Analysis
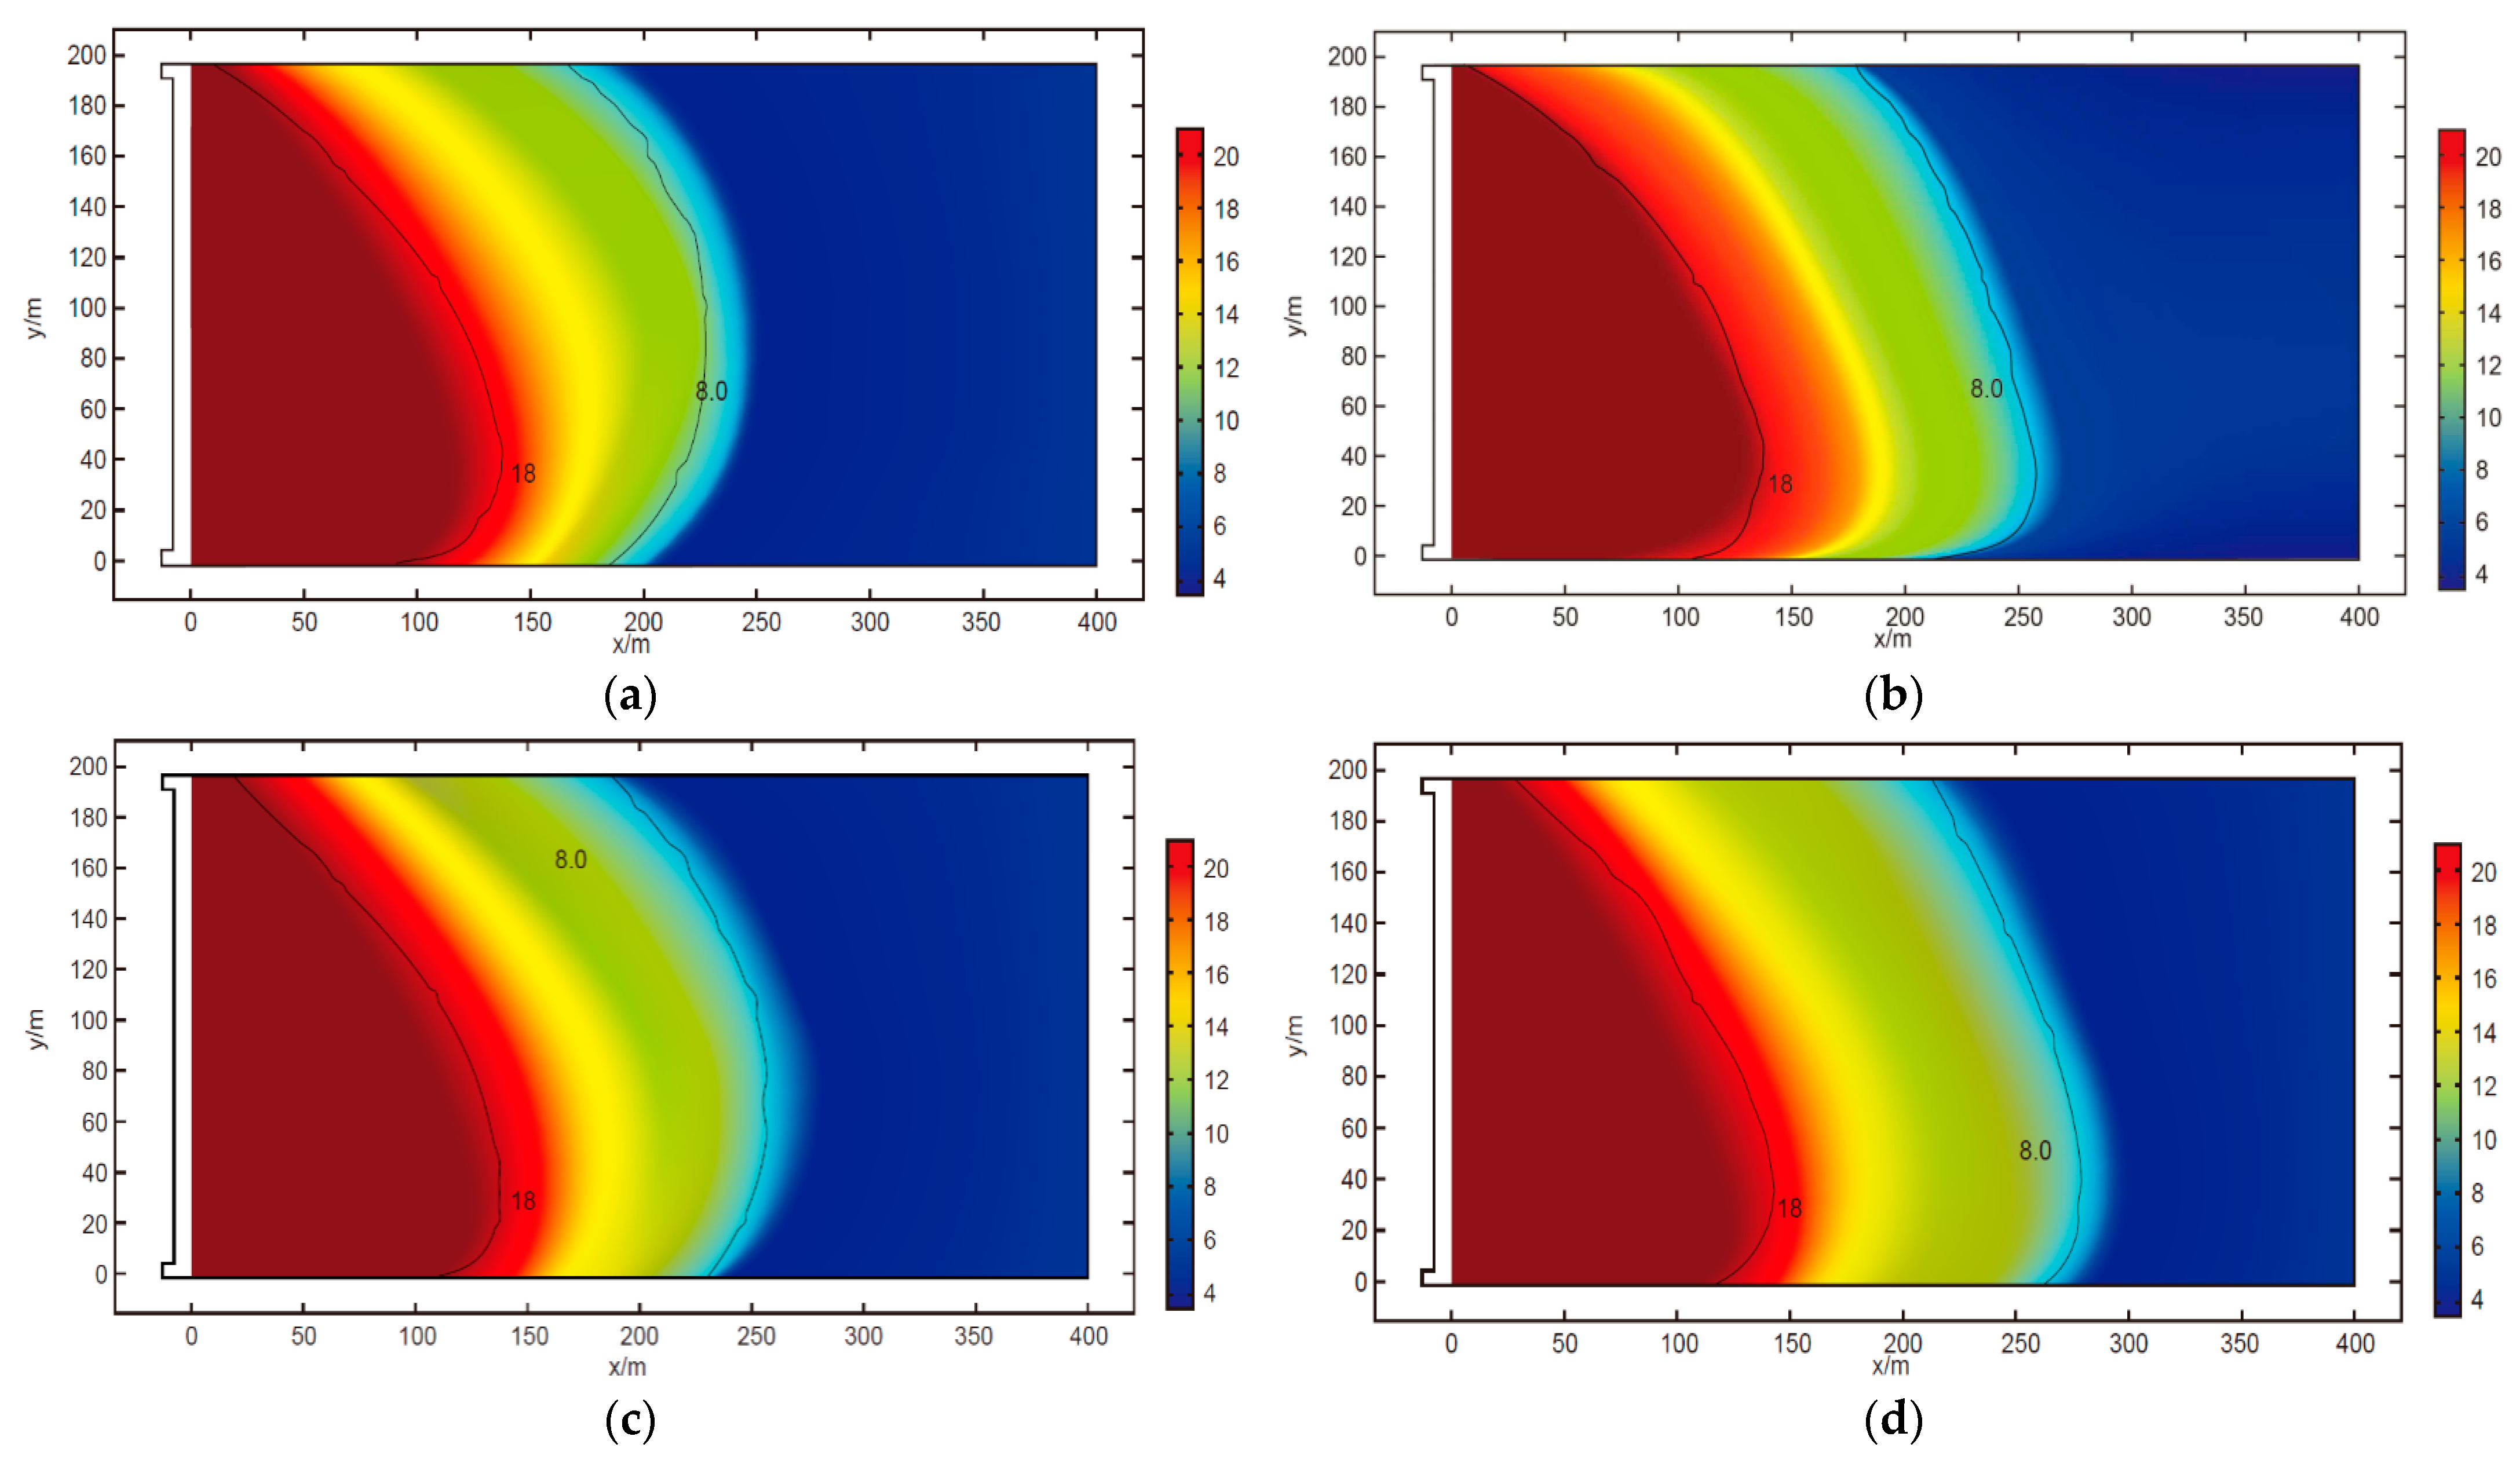
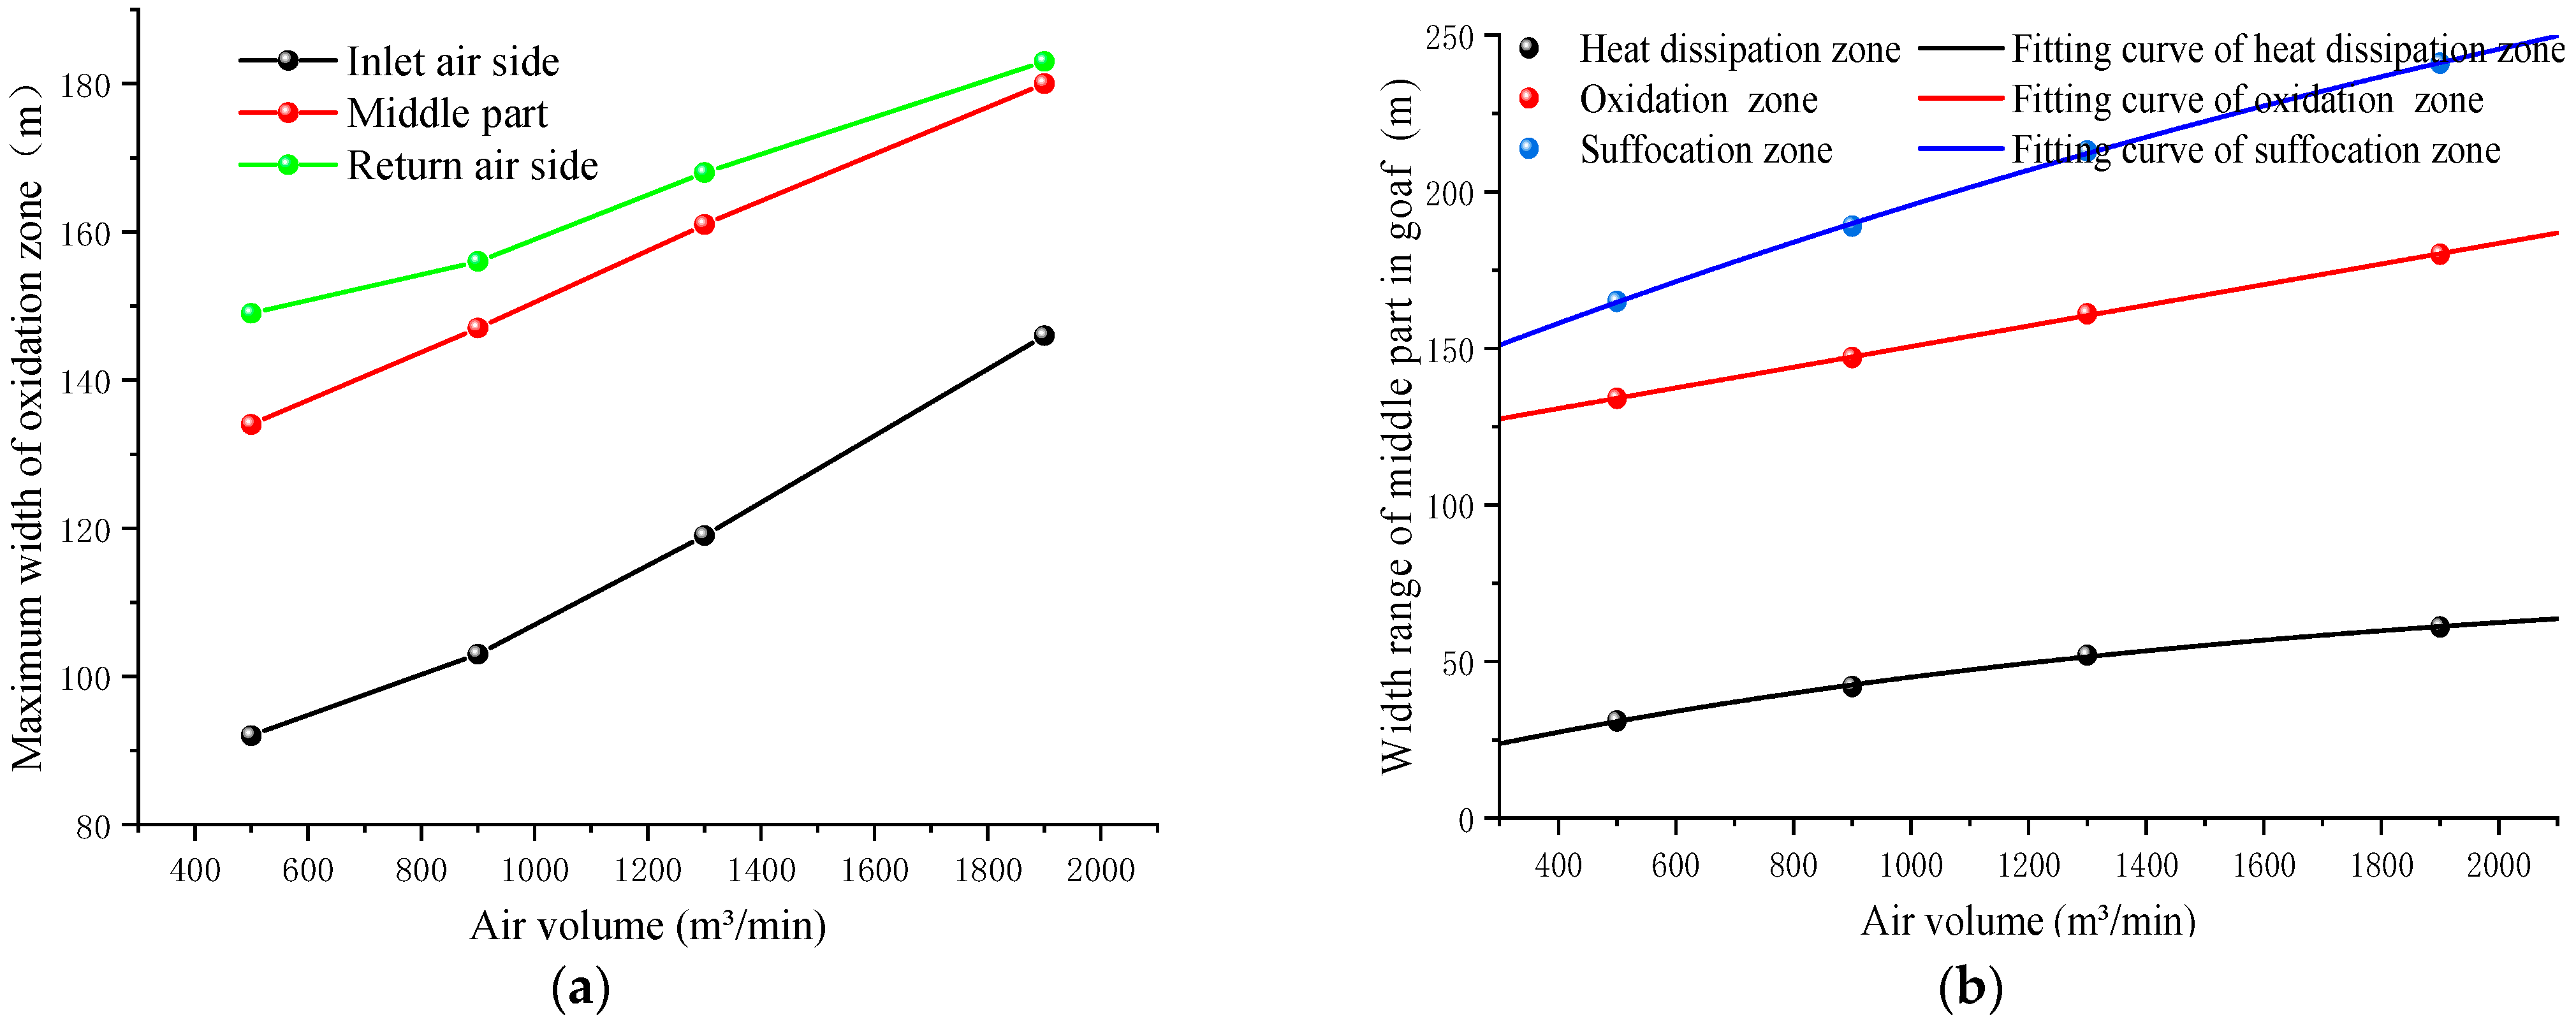
4.3. Analysis of Influence of Different Air Volume on Three Zones of SC in Goaf
5. Prediction of SC Index Gas in Goaf
5.1. Experimental Conditions
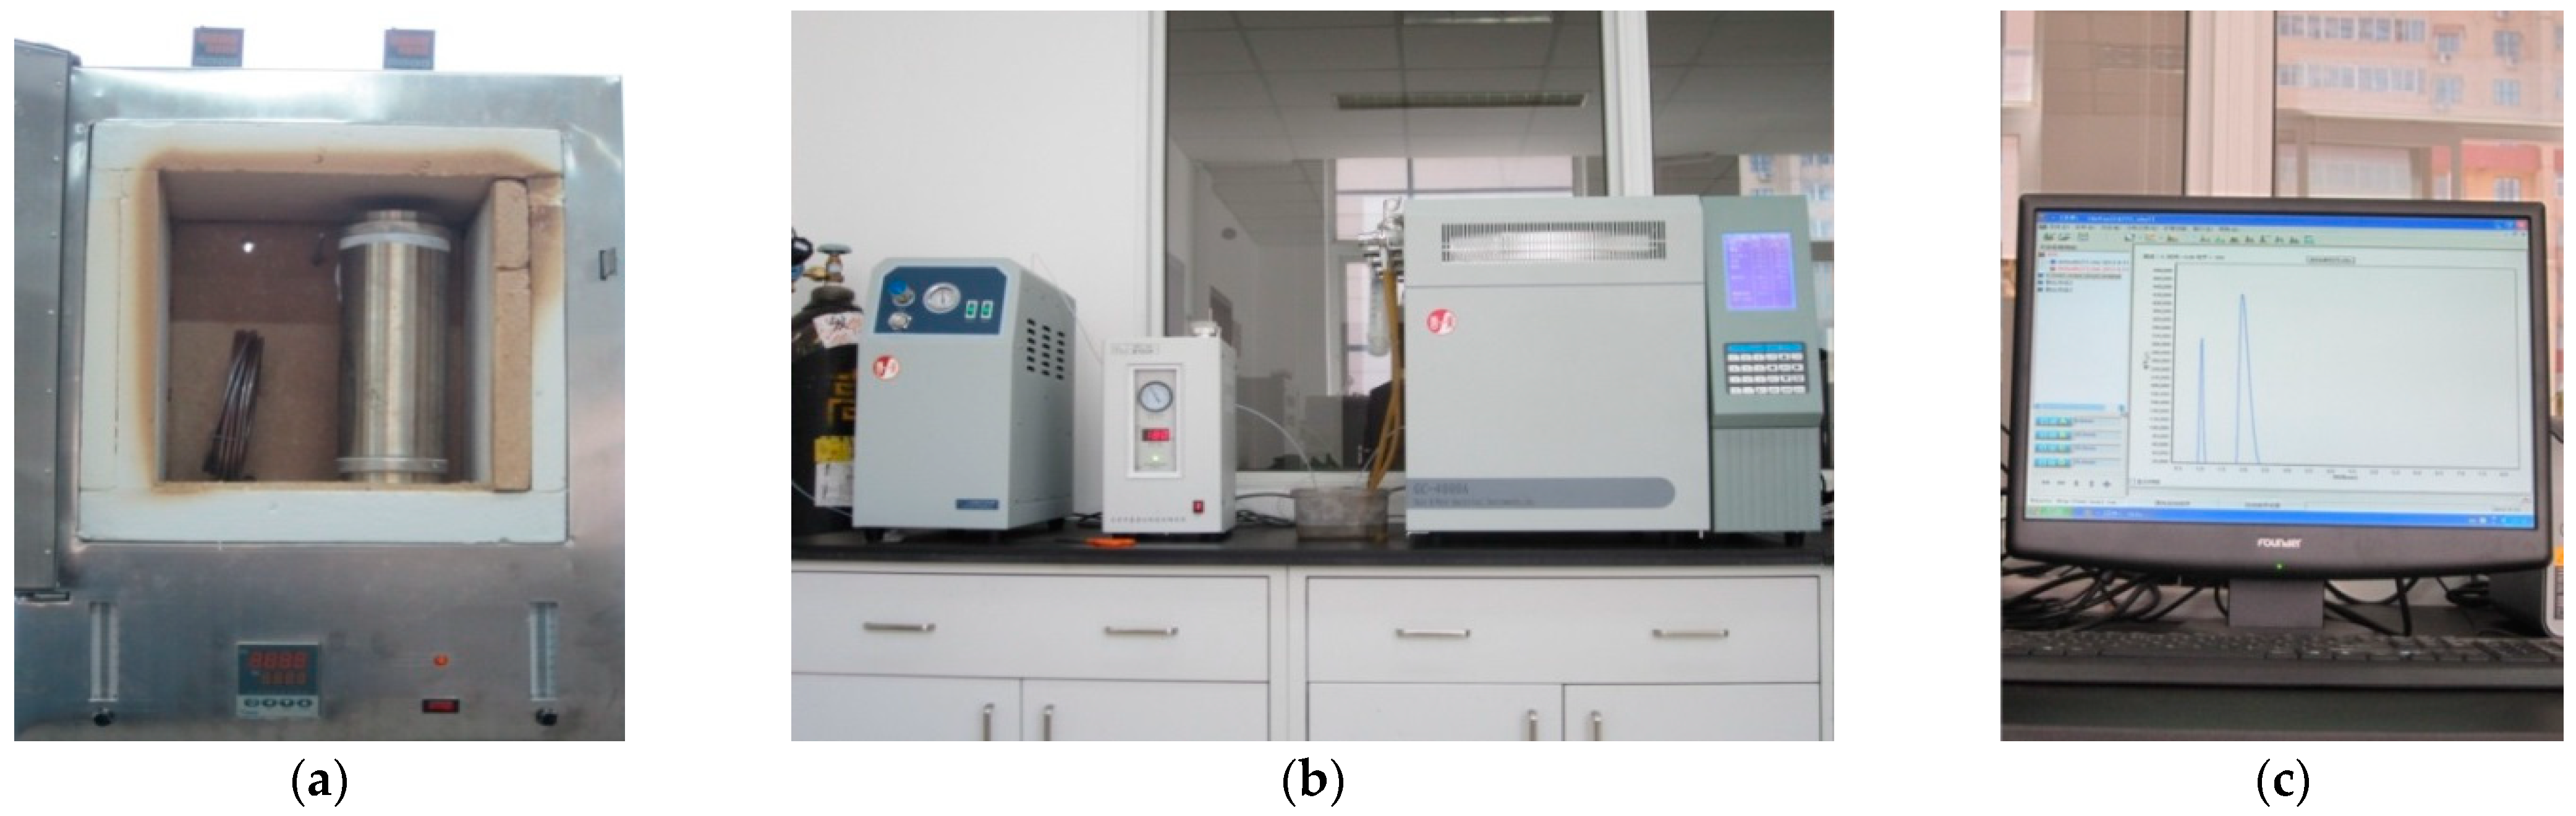
5.2. Experimental Equipment
5.3. Experimental Results
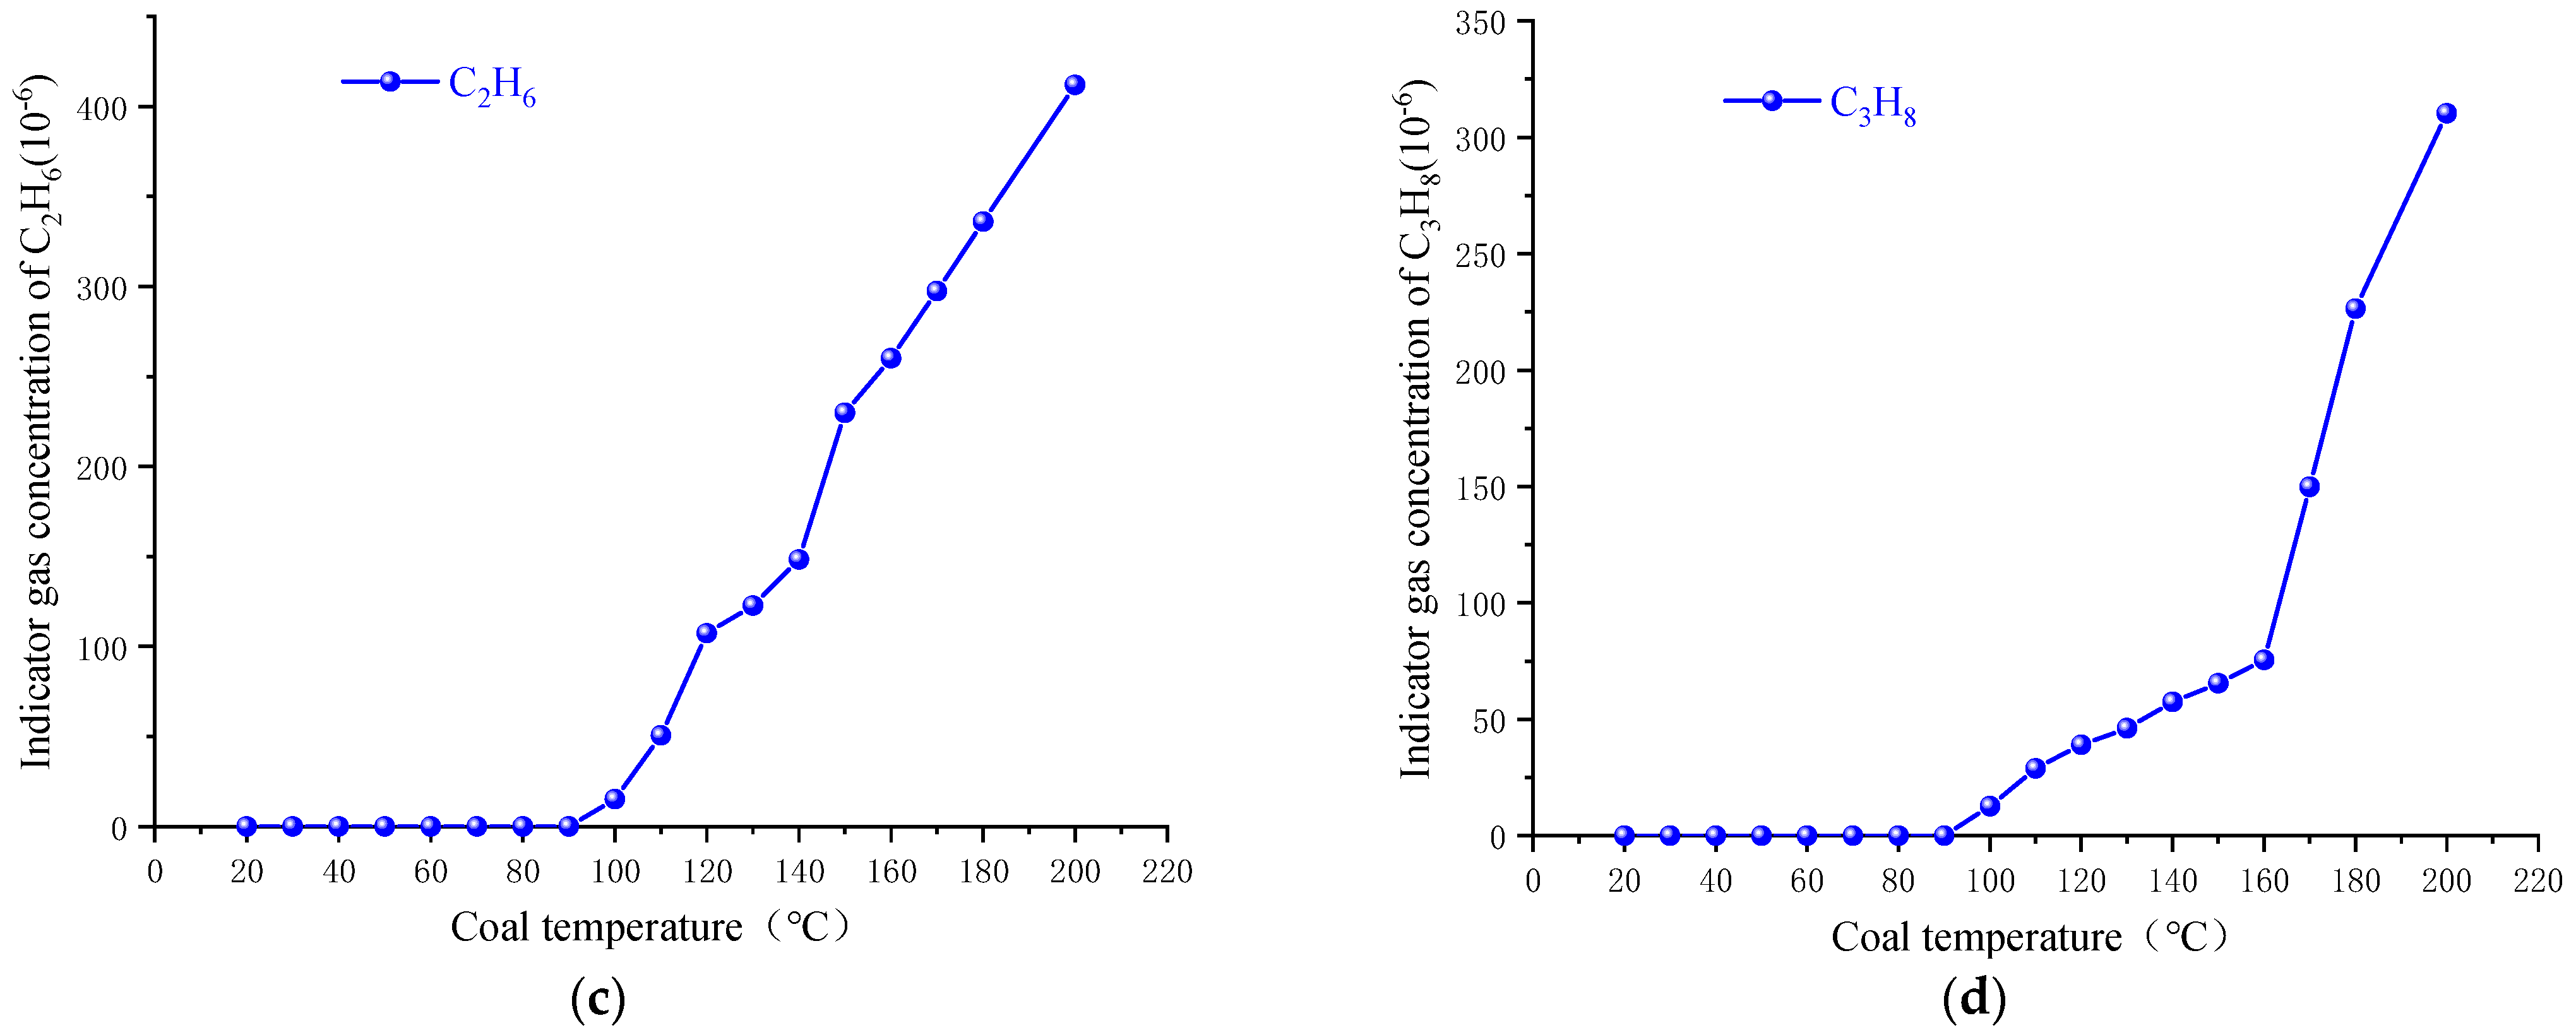
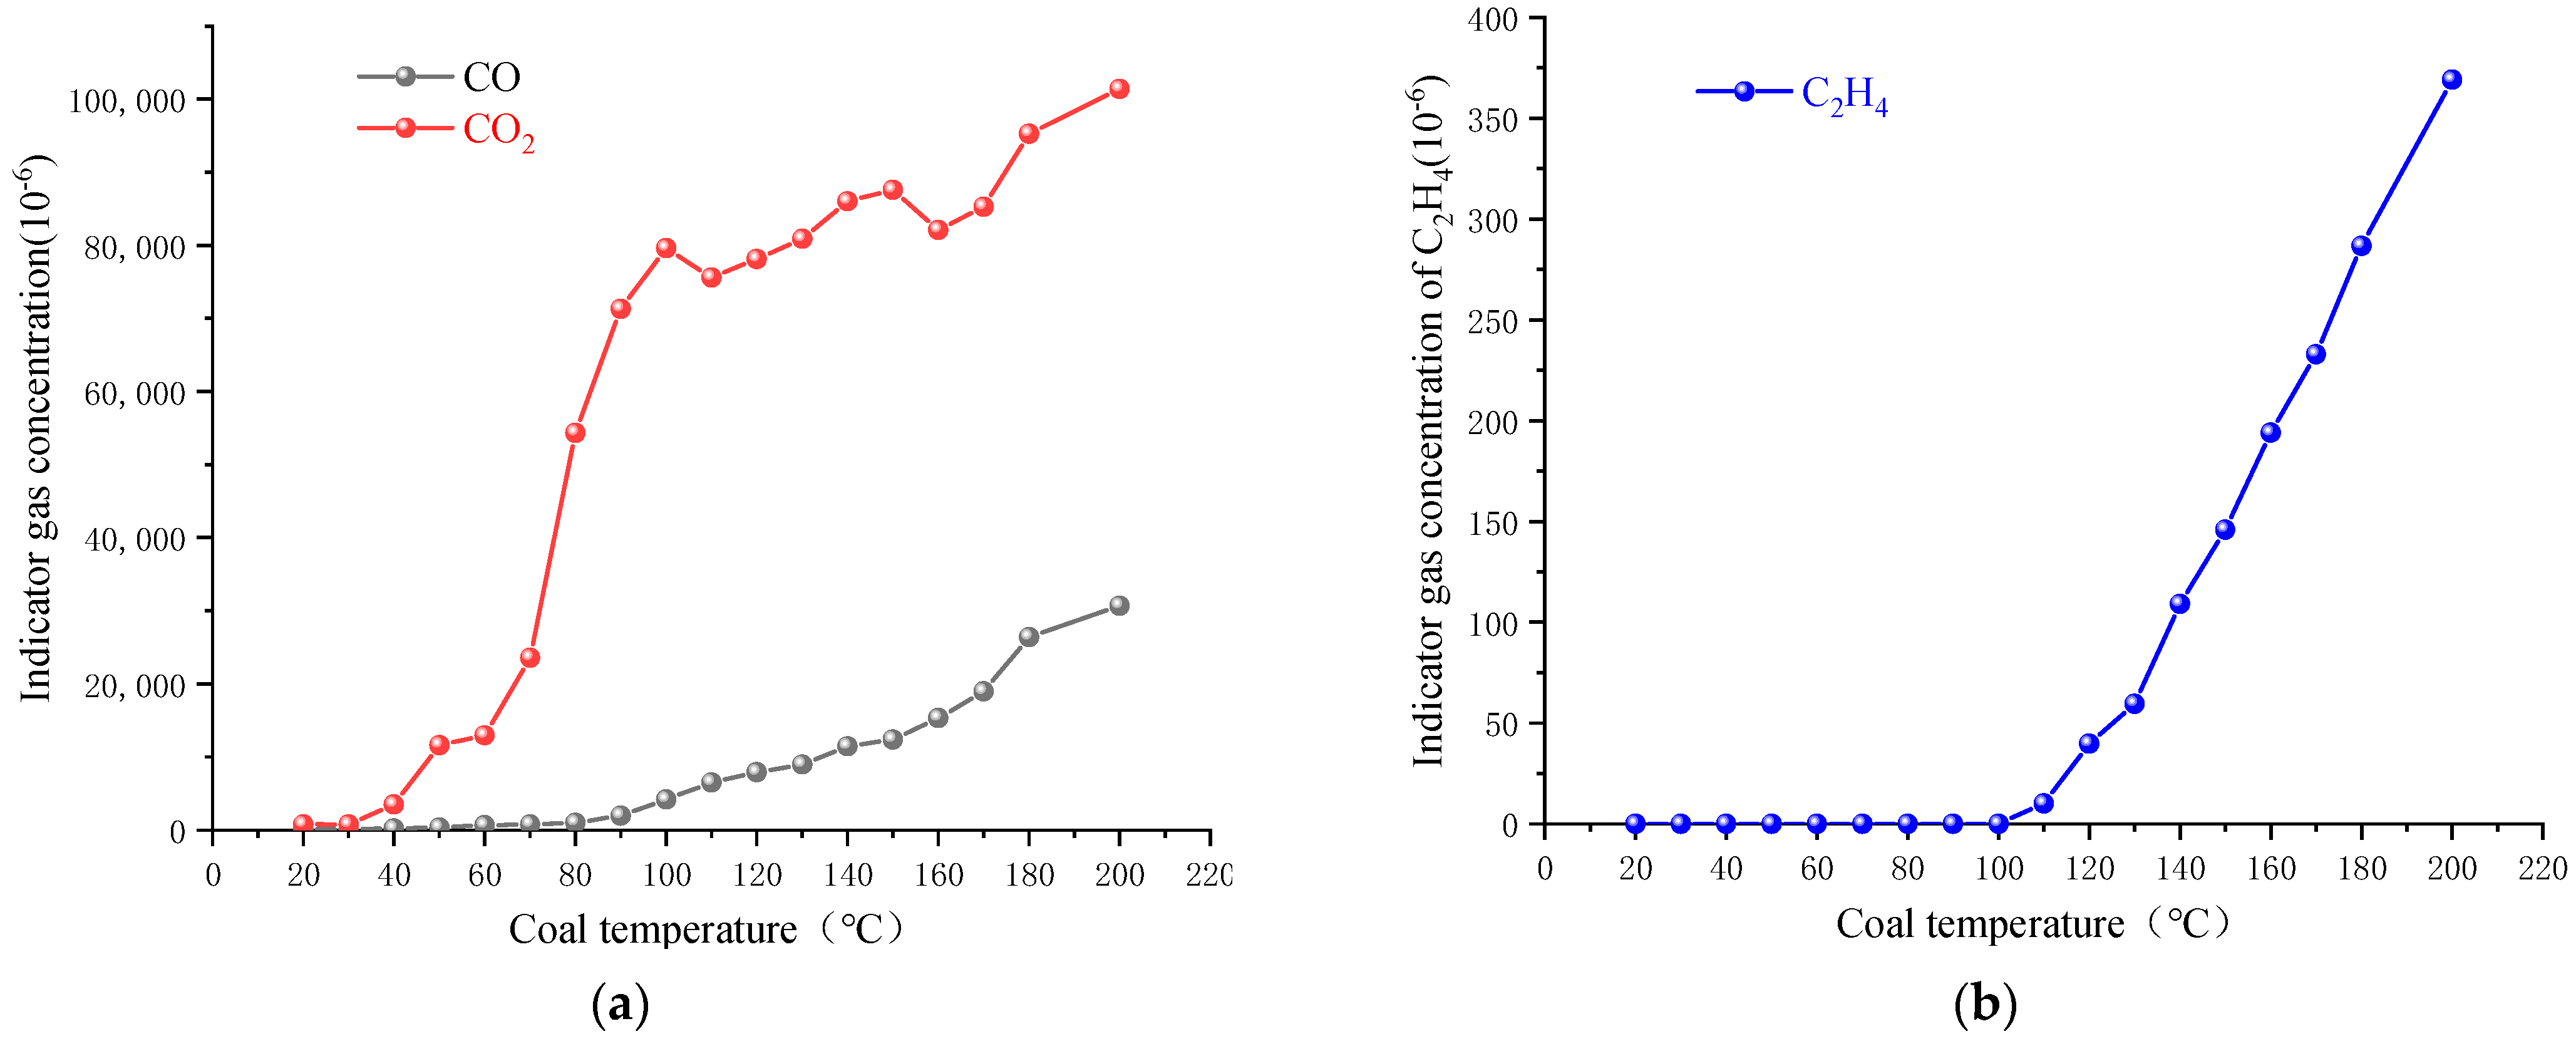
5.3.1. Generation of Index Gases
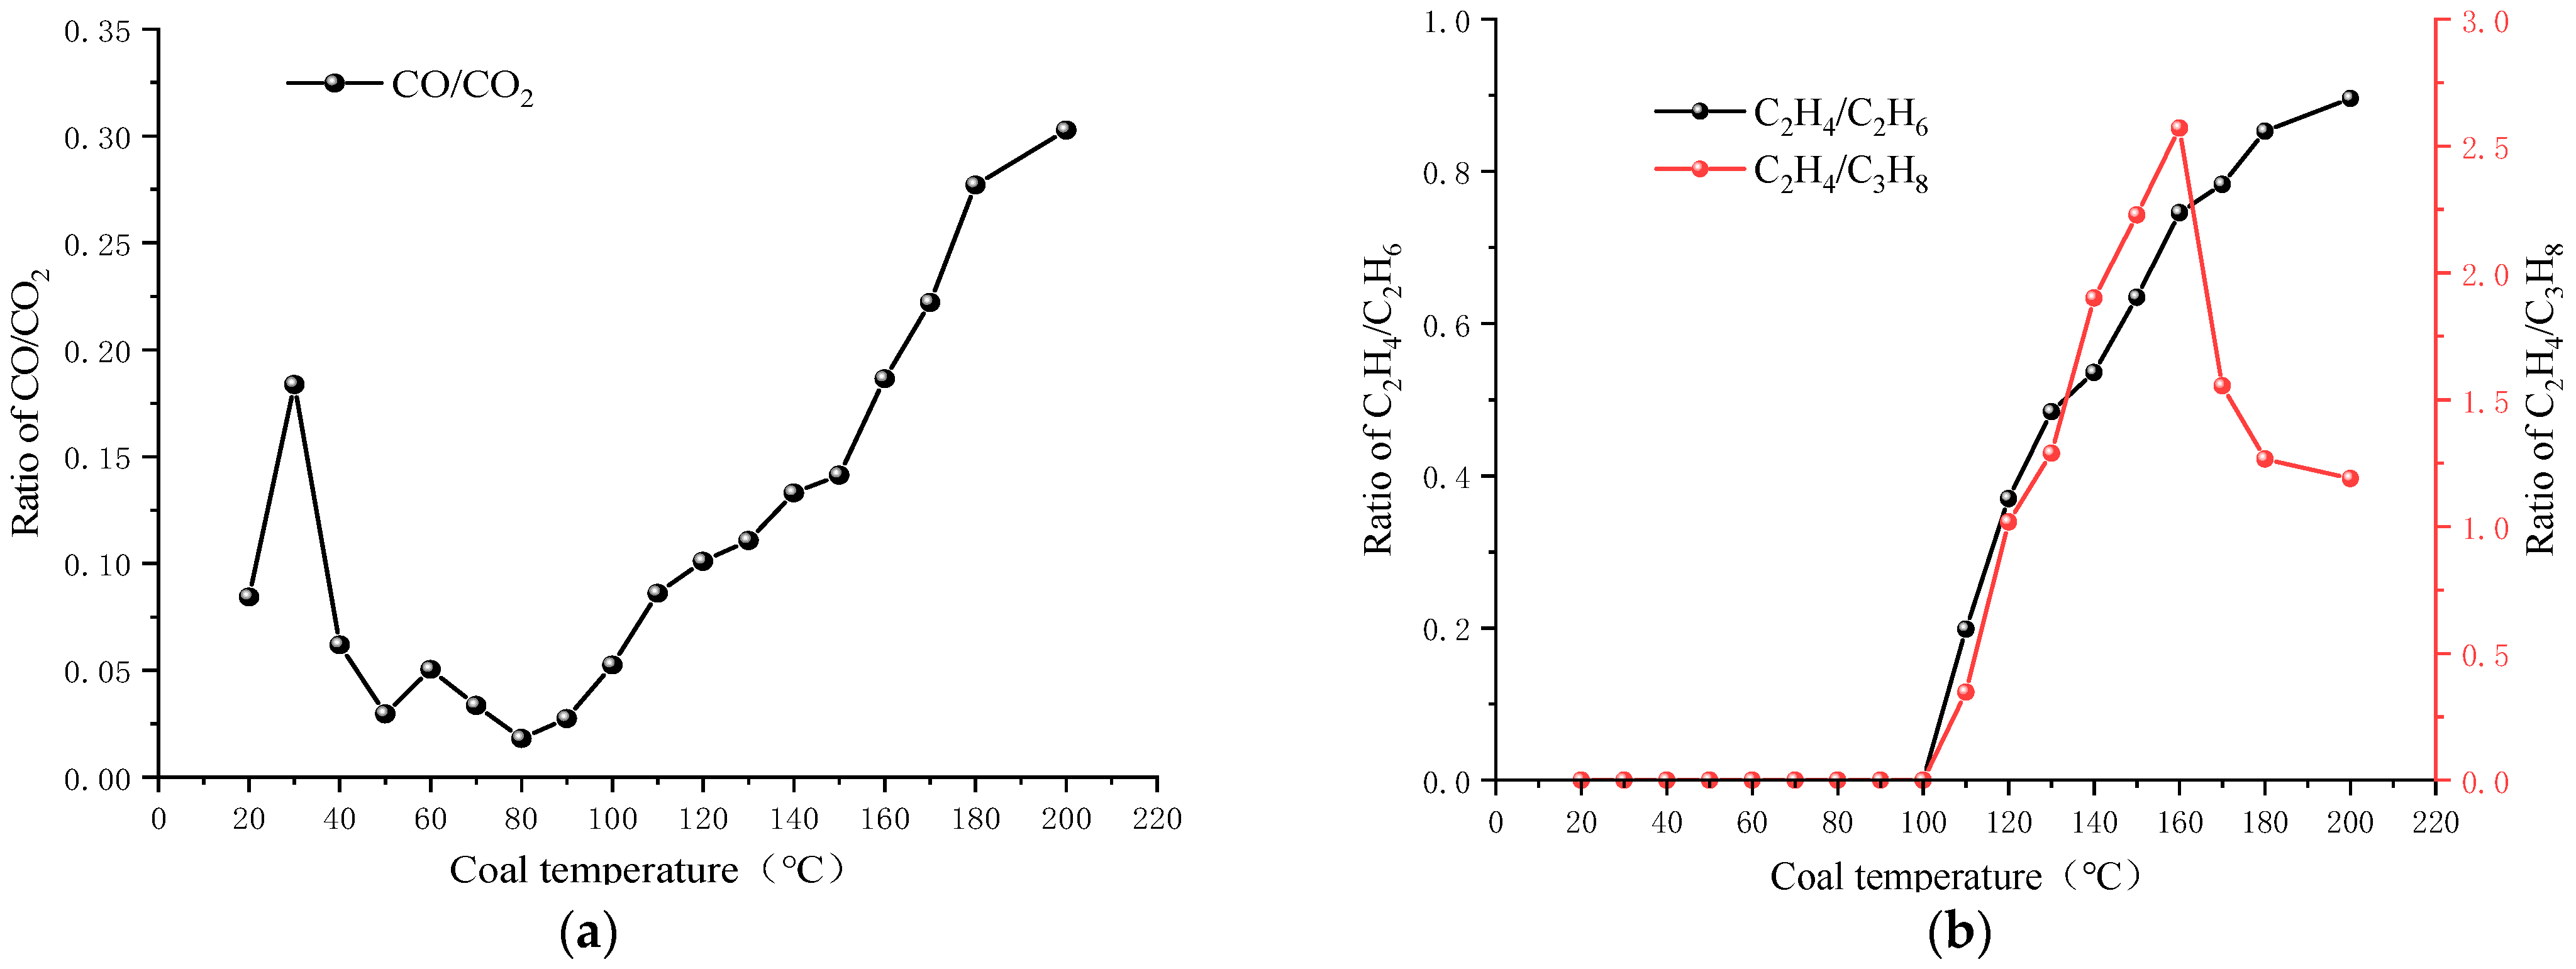
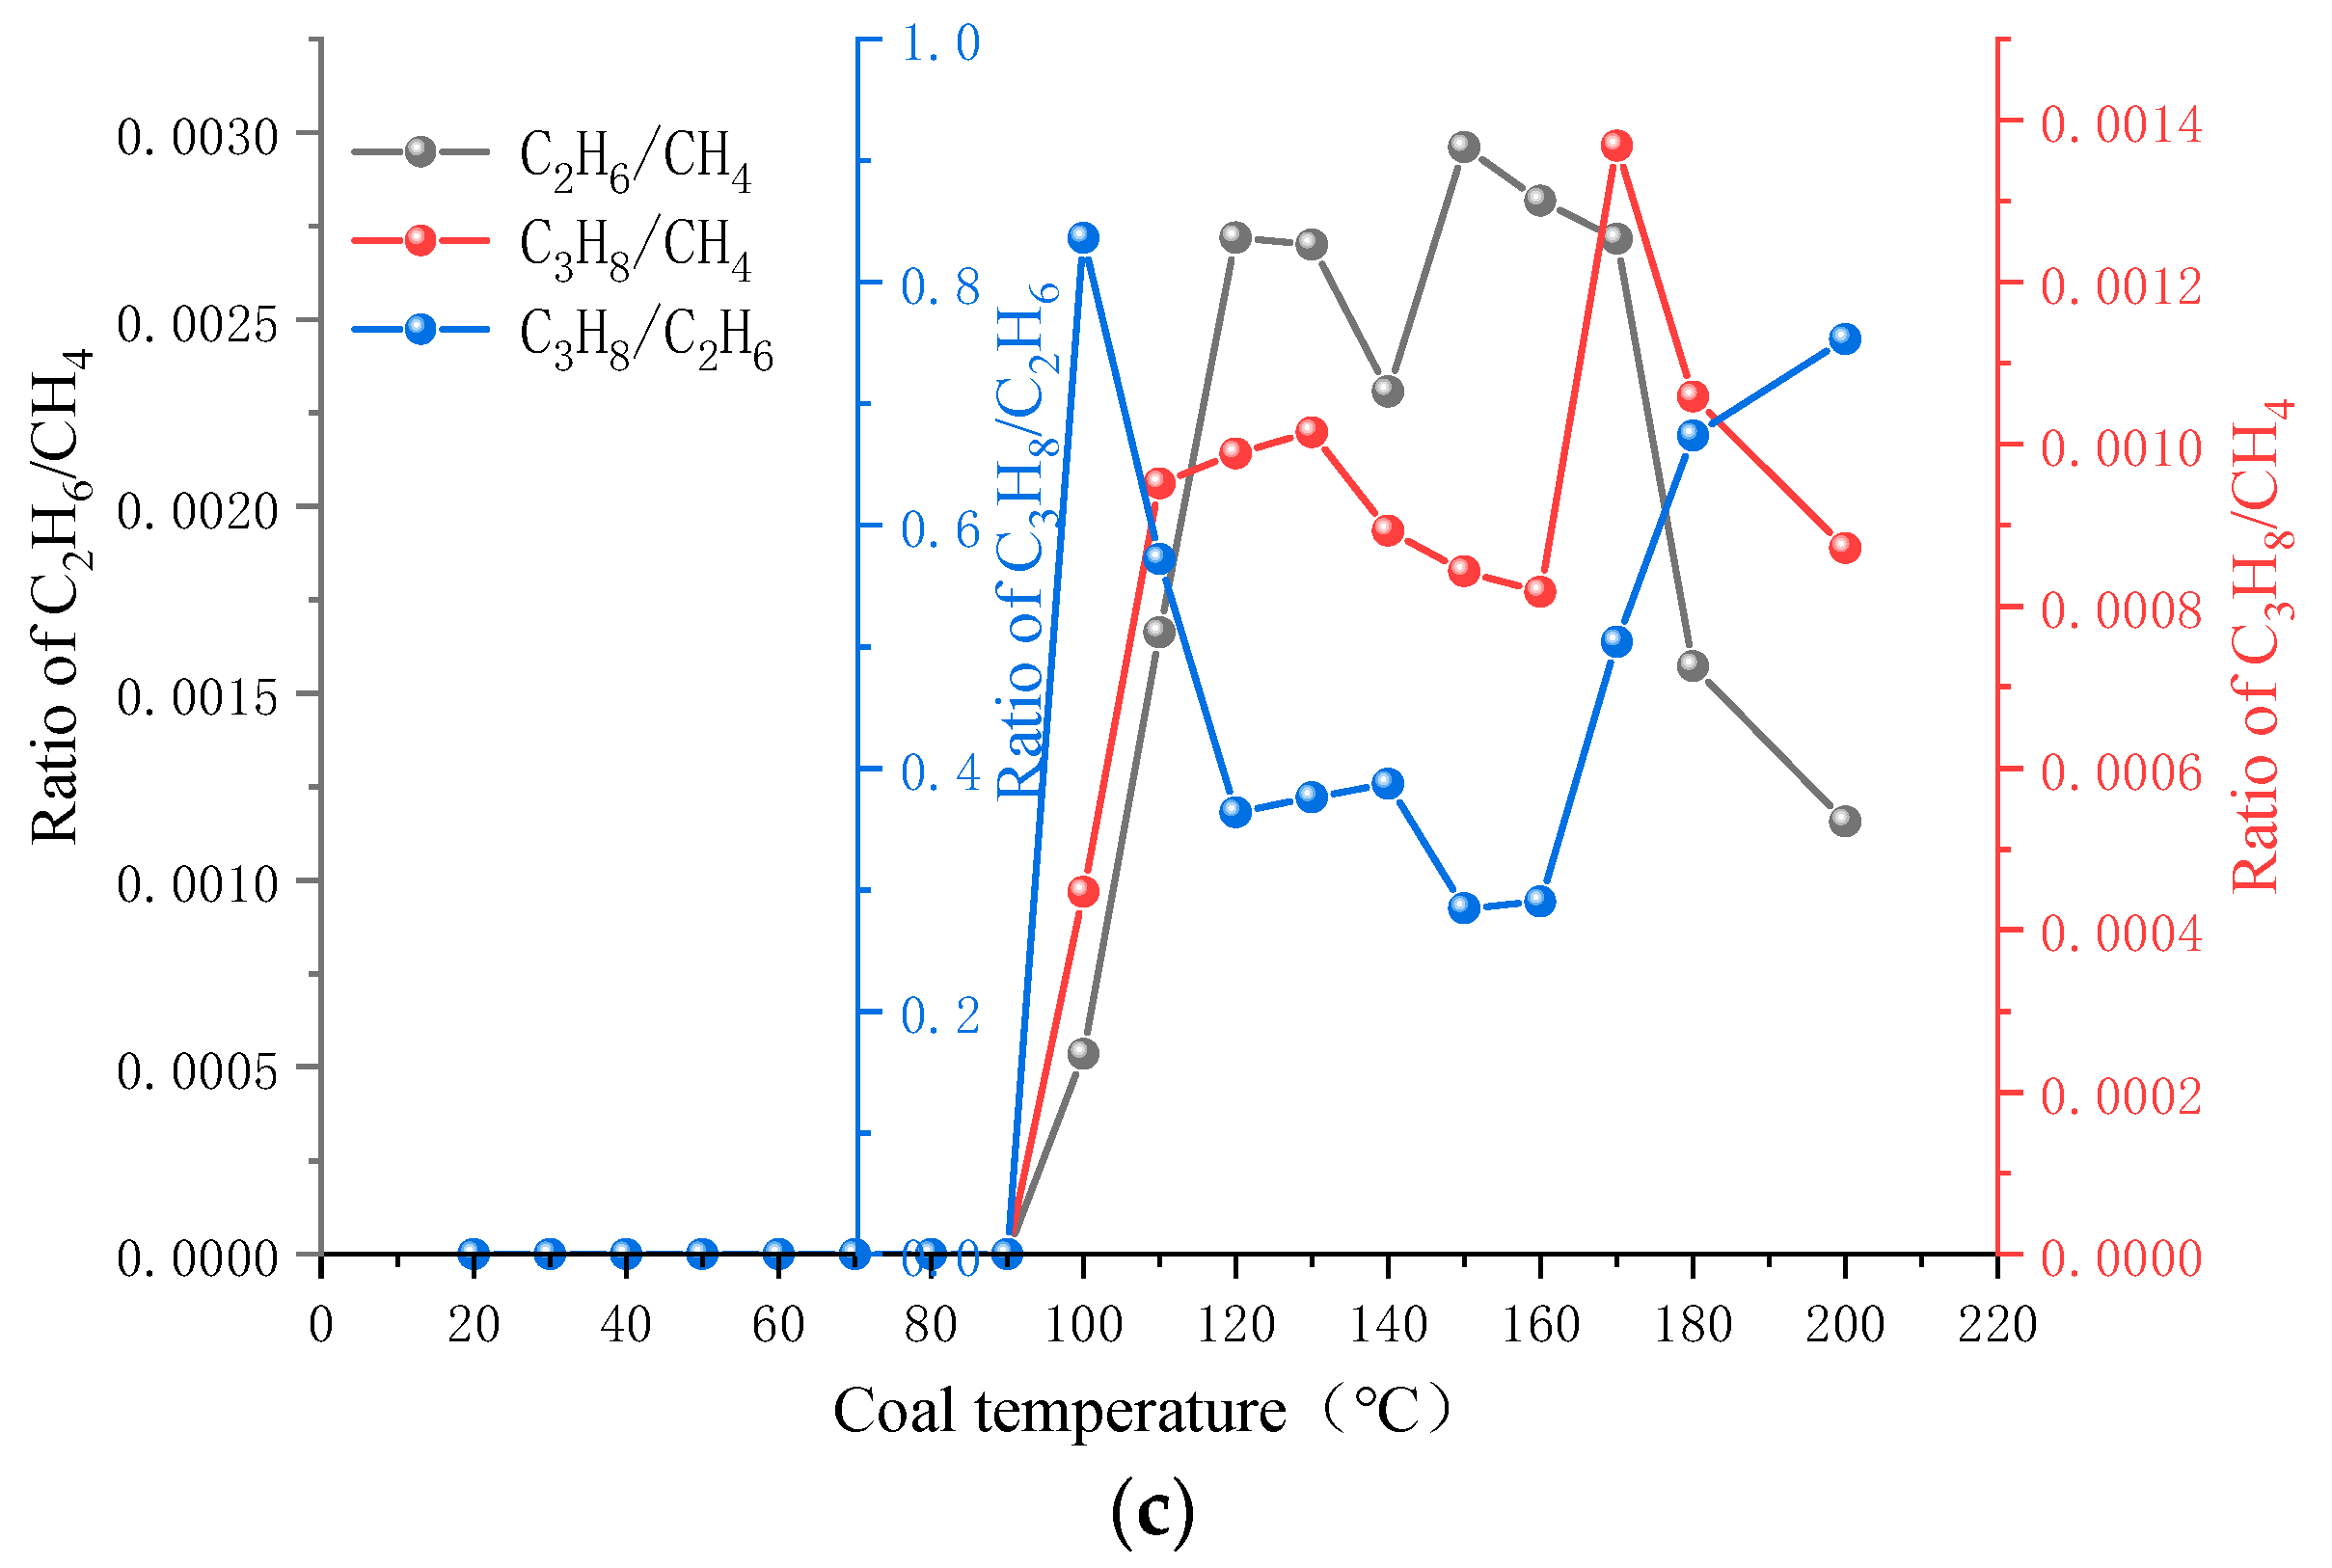
5.3.2. Gas Ratio Analysis
5.3.3. Optimization Analysis of Coal Seam SC Index in the Gas System
6. Conclusions
Funding
Acknowledgments
Conflicts of Interest
References
- Wang, K.; Tang, H.; Wang, F.; Miao, Y.; Liu, D. Research on complex air leakage method to prevent coal spontaneous combustion in longwall gob. PLoS ONE 2019, 14, e0213101. [Google Scholar] [CrossRef]
- Pan, R.; Fu, D.; Xiao, Z.; Chen, L. The inducement of coal spontaneous combustion disaster and control technology in a wide range of coal mine closed area. Environ. Earth Sci. 2018, 77, 375. [Google Scholar] [CrossRef]
- Liu, Y.; Wen, H.; Guo, J.; Jin, Y.; Wei, G.; Yang, Z. Coal spontaneous combustion and N2 suppression in triple goafs: A numerical simulation and experimental study. Fuel 2020, 271, 117625. [Google Scholar] [CrossRef]
- Gao, F.; Deng, C.-B.; Wang, X.-F.; Li, X.-M.; Dai, F.-W. Experimental study on adsorbing of flue gas and its application in preventing spontaneous combustion of coal. Adsorpt. Sci. Technol. 2018, 36, 026361741880711. [Google Scholar] [CrossRef] [Green Version]
- Wang, H.; Yang, X.; Du, F.; Wang, G.; Wang, Y.; Zhao, W.; Wang, H. Calculation of the diffusion coefficient of gas diffusion in coal: The comparison of numerical model and traditional analytical model. J. Pet. Sci. Eng. 2021, 205, 108931. [Google Scholar] [CrossRef]
- Wang, H.; Tan, B.; Shao, Z.; Guo, Y.; Zhang, Z.; Xu, C. Influence of different content of FeS2 on spontaneous combustion characteristics of coal. Fuel 2021, 288, 119582. [Google Scholar] [CrossRef]
- Gao, K.; Qi, Z.; Jia, J.; Li, S.; Liu, Z.; Liu, Z. Investigation of coupled control of gas accumulation and spontaneous combustion in the goaf of coal mine. AIP Adv. 2020, 10, 045314. [Google Scholar] [CrossRef]
- Pang, Y.H. Influence of coal cutting height on top-coal caving and drawing characteristics and rib spalling. Coal Sci. Technol. 2017, 45, 105–111. [Google Scholar] [CrossRef]
- Pang, Y.H.; Wang, G.F. Top-coal caving structure and technology for increasing recovery rate at extra-thick hard coal seam. J. China Coal Soc. 2017, 42, 817–824. [Google Scholar] [CrossRef]
- Jia, X.; Qi, Q.; Zhao, Y.; Dong, Z.; Li, X. CO emission regularity and its influencing factors in a fully mechanized caving face. AIP Adv. 2021, 11, 075111. [Google Scholar] [CrossRef]
- Deng, J.; Lei, C.; Xiao, Y.; Cao, K.; Ma, L.; Wang, W.; Laiwang, B. Determination and prediction on “three zones” of coal spontaneous combustion in a gob of fully mechanized caving face. Fuel 2018, 211, 458–470. [Google Scholar] [CrossRef]
- Li, Z.X.; Qin, S.Y.; Lv, D.Y. Numerical simulation study of fully mechanized caving coal face in the gob spontaneous combustion. J. China Coal Soc. 1999, 24, 494–497. [Google Scholar]
- Li, Z.X.; Wu, Q.; Wang, Z.Q. Distribution characteristic of remaining coal oxygen consumption and spontaneous combustion heating-up in gob. J. China Coal Soc. 2009, 34, 667–672. [Google Scholar]
- Li, Z.X.; Zu, D.P.; Liu, L.Q. Study on numerical simulation about the division of spontaneous ignition “three bands” in operation goaf. J. Liaoning Tech. Univ. 2002, 05, 545–548. [Google Scholar]
- Deng, J.; Chen, W.; Wang, C.; Wang, W. Study on prediction model of coal spontaneous combustion stage. J. China Coal Soc. 2004, 29, 569–571. [Google Scholar]
- Hao, M.; Li, Y.; Song, X.; Kang, J.; Su, H.; Zhou, F. Hazardous areas determination of coal spontaneous combustion in shallow-buried gobs of coal seam group: A physical simulation experimental study. Environ. Earth Ences 2019, 78, 39.1–39.11. [Google Scholar] [CrossRef]
- Gao, Z.C.; Deng, J.; Zhai, X.W. Prediction of Grey Model for Upper Corners CO Emission in Easily Spontaneous Combustion Coal Seam Face. Energy Sci. Technol. 2008, 6, 51–53. [Google Scholar]
- Zhai, X.W.; Ma, L.J.; Deng, J. Study and Application of CO Content Prediction Model to Upper Corner of Coal Mining Face. Coal Sci. Technol. 2011, 39, 59–62. [Google Scholar] [CrossRef]
- Lin, Q.; Wang, S.; Liang, Y.; Song, S.; Ren, T. Analytical prediction of coal spontaneous combustion tendency: Velocity range with high possibility of self-ignition. Fuel Processing Technol. 2017, 159, 38–47. [Google Scholar] [CrossRef]
- Qin, H.X.; Dai, G.L.; Zhang, S.C. Optimal selection and application of mark gas based on coal low temperature oxidation test. Coal Sci. Technol. 2015, 43, 65–70. [Google Scholar] [CrossRef]
- Zhu, L.Q.; Zhou, X.Q.; Xie, J.G. Analysis of indicator gas of spontaneous combustion and its optimal selection. J. Min. Saf. Eng. 2008, 25, 440–443+448. [Google Scholar]
- He, L.; Zhong, M.H.; Jiang, Z.A. High sulfur coal spontaneous combustion Mechanism in goaf and the application of new type gel inhibitor. J. Saf. Sci. Technol. 2007, 06, 52–55. [Google Scholar]
- Ma, L.; Zou, L.; Ren, L.-F.; Chung, Y.-H.; Zhang, P.-Y.; Shu, C.-M. Prediction indices and limiting parameters of coal spontaneous combustion in the Huainan mining area in China. Fuel 2020, 264, 116883. [Google Scholar] [CrossRef]
- Li, Y.F.; Wang, H.; Kang, H.Y. Optimization of coal spontaneous combustion landmark gas in isolated island fully mechanized top coal caving face. Saf. Coal Mines 2011, 42, 119–121. [Google Scholar]
- Zuo, Q.L.; Li, J.S.; Wang, Y.J. Distribution law for the danger area for spontaneous coal combustion in a dynamic goaf with low air leakage speed. Therm. Sci. 2020, 25, 3229–3237. [Google Scholar] [CrossRef]
- Tang, Y.; Li, Y.F.; Xue, S. Experimental investigation of long-term water immersion effect on spontaneous com-bustion parameters and microscopic characteristics of bituminous. J. China Coal Soc. 2017, 42, 2642–2648. [Google Scholar] [CrossRef]
- Song, W.X. Prediction of coal spontaneous combustion risk in high gas goaf under stereo gas drainage. China Saf. Sci. J. 2012, 22, 49–51. [Google Scholar] [CrossRef]
- Kang, J.Z. Experimental study on gas optimization of spontaneous combustion index of 4# coal in zhujiadian coal mine. Saf. Coal Mines 2012, 43, 21–24. [Google Scholar]
- Zhang, T.J.; Liu, N.; Pang, M.K.; Zhang, X.; Wang, X.; Zhang, X. Influence of temperature and stress on compaction deformation characteristics of broken coal and rock mass. Saf. Coal Mines 2021, 52, 58–64+71. [Google Scholar] [CrossRef]
- Liu, Z.; Wang, W.D.; Xu, W.B.; Yang, H.; Dong, B. Permeability model of coal seam water injection and numerical simulation study of hydraulic coupling influencing factors. J. Min. Saf. Eng. 2021, 38, 1250–1258. [Google Scholar] [CrossRef]


| Description | Parameter | Values and Units |
|---|---|---|
| Density of the gas | 0.85 kg/m3 | |
| Differential pressure of air flow | 98 Pa | |
| Dynamic viscosity of air flow | 1.79 × 10⁻⁵ Pa·s | |
| The tunnel air flow initial temperature | 28 °C | |
| Oxygen diffusion coefficient | 1.6 × 10⁻⁴ m2/s | |
| Average particle size of coal in the goaf | 15 mm | |
| Oxygen consumption coefficient | 0.16 mol/(m3·h) | |
| Initial oxygen concentration | 9.375 mol/m3 | |
| Temperature oxidation index | 2.4 × 10⁻⁵ K−1 | |
| Average dip angle | α | 8° |
| Fully mechanized top coal caving height | 2.5 m | |
| Fully mechanized coal drawing height | 3.4 m | |
| Direct top thickness | 2.9 m | |
| Gap between rock mass and roof in the collapse zone | 1.2 m | |
| Top coal recovery | 83% | |
| Residual coal crushing expansion coefficient | 1.05 | |
| Top control distance of the working face | 3.3 m | |
| periodic pressure step | 13 m | |
| Diffusion coefficient of air | 3.5 × 10⁻⁵ m2/s |
| Definite Conditions | Gas Flow | Convection Diffusion | |
|---|---|---|---|
| Initial condition | = 98 Pa | c(O2) = 0 | |
| Boundary condition | AB | c(O2)= 9.375 mol/m3 | |
| EF | Zero flux | ||
| DE | Zero flux | Zero flux | |
| BC | Zero flux | Zero flux | |
| AH | Zero flux | Zero flux | |
| FG | Zero flux | Zero flux | |
| CD | Zero flux | Zero flux | |
| GH | Convection flux | ||
| GJ | Zero flux | Zero flux | |
| HI | Zero flux | Zero flux | |
| IJ | Zero flux | Zero flux |
| Means | Location | Heat Dissipation Zone (m) | Oxidation Spontaneous Combustion Zone (m) | Suffocation Zone (m) | Maximum Width of the Oxidation Zone (m) |
|---|---|---|---|---|---|
| Field measurement | Inlet air side | <107 | 107–239 | >239 | 132 |
| Return air side | <13 | 13–189 | >189 | 176 | |
| Numerical simulation | Inlet air side | <109 | 109–228 | >228 | 119 |
| Middle part | <52 | 52–213 | >213 | 161 | |
| Return air side | <19 | 19–187 | >187 | 168 |
| Air Volume (m3/min) | Location | Heat Dissipation Zone (m) | Oxidation Spontaneous Combustion Zone (m) | Suffocation Zone (m) | Maximum Width of the Oxidation Zone (m) |
|---|---|---|---|---|---|
| 500 | A1 | <87 | 87–179 | >179 | 92 |
| A2 | <31 | 31–165 | >165 | 134 | |
| A3 | <10 | 10–159 | >159 | 149 | |
| 900 | A1 | <98 | 98–201 | >201 | 103 |
| A2 | <42 | 42–189 | >189 | 147 | |
| A3 | <12 | 12–168 | >168 | 156 | |
| 1300 | A1 | <109 | 109–228 | >228 | 119 |
| A2 | <52 | 52–213 | >213 | 161 | |
| A3 | <19 | 19–187 | >187 | 168 | |
| 1900 | A1 | <116 | 116–262 | >262 | 146 |
| A2 | <61 | 61–241 | >241 | 180 | |
| A3 | <27 | 27–210 | >210 | 183 |
| Serial Number | Temperature (°C) | O2 (%) | CO (ppm) | CH4 (ppm) | CO2 (ppm) | C2H4 (ppm) | C2H6 (ppm) | C3H8 (ppm) |
|---|---|---|---|---|---|---|---|---|
| 1 | 20 | 20.48 | 64.64 | 1131 | 767 | 0.00 | 0.00 | 0.00 |
| 2 | 30 | 20.07 | 138 | 8563 | 751 | 0.00 | 0.00 | 0.00 |
| 3 | 40 | 19.85 | 216 | 11,130 | 3492 | 0.00 | 0.00 | 0.00 |
| 4 | 50 | 18.82 | 344 | 12,840 | 11,610 | 0.00 | 0.00 | 0.00 |
| 5 | 60 | 17.74 | 653 | 15,290 | 12,960 | 0.00 | 0.00 | 0.00 |
| 6 | 70 | 17.05 | 792 | 16,100 | 23,570 | 0.00 | 0.00 | 0.00 |
| 7 | 80 | 16.84 | 985 | 17,100 | 54,350 | 0.00 | 0.00 | 0.00 |
| 8 | 90 | 16.52 | 1954 | 19,270 | 71,300 | 0.00 | 0.00 | 0.00 |
| 9 | 100 | 16.18 | 4179 | 28,330 | 79,620 | 0.00 | 15.15 | 12.67 |
| 10 | 110 | 15.44 | 6505 | 30,400 | 75,600 | 10.04 | 50.56 | 28.92 |
| 11 | 120 | 12.04 | 7895 | 39,500 | 78,140 | 39.75 | 107.40 | 39.04 |
| 12 | 130 | 9.820 | 8954 | 45,470 | 80,900 | 59.48 | 122.79 | 46.15 |
| 13 | 140 | 5.299 | 11,440 | 64,270 | 86,040 | 109.12 | 148.30 | 57.40 |
| 14 | 150 | 4.689 | 12,380 | 77,650 | 87,580 | 145.93 | 229.90 | 65.46 |
| 15 | 160 | 3.172 | 15,300 | 92,320 | 82,100 | 194.04 | 260.17 | 75.47 |
| 16 | 170 | 1.416 | 18,950 | 109,500 | 85,300 | 232.95 | 297.41 | 149.83 |
| 17 | 180 | 0.714 | 26,400 | 213,800 | 95,270 | 286.68 | 336.08 | 226.39 |
| 18 | 200 | 0.527 | 30,700 | 356,100 | 101,400 | 369.14 | 412.00 | 310.33 |
| Index Classification | Indicator Name | Initial Temperature (°C) | Concentration (Ratio) (ppm) | ||
|---|---|---|---|---|---|
| 20~60 °C | 60~100 °C | 100~200 °C | |||
| Main index | CO | 20 | 64.64~653 | 653~4179 | 4179~30,700 |
| C2H4 | 110 | 0 | 0~10.04 | 10.04~369.14 | |
| Auxiliary index | C2H6, C3H8, C2H4/C2H6 | ||||
Publisher’s Note: MDPI stays neutral with regard to jurisdictional claims in published maps and institutional affiliations. |
© 2022 by the author. Licensee MDPI, Basel, Switzerland. This article is an open access article distributed under the terms and conditions of the Creative Commons Attribution (CC BY) license (https://creativecommons.org/licenses/by/4.0/).
Share and Cite
Chai, J. Investigation of Spontaneous Combustion Zones and Index Gas Prediction System in Goaf of “Isolated Island” Working Face. Fire 2022, 5, 67. https://doi.org/10.3390/fire5030067
Chai J. Investigation of Spontaneous Combustion Zones and Index Gas Prediction System in Goaf of “Isolated Island” Working Face. Fire. 2022; 5(3):67. https://doi.org/10.3390/fire5030067
Chicago/Turabian StyleChai, Jiamei. 2022. "Investigation of Spontaneous Combustion Zones and Index Gas Prediction System in Goaf of “Isolated Island” Working Face" Fire 5, no. 3: 67. https://doi.org/10.3390/fire5030067
APA StyleChai, J. (2022). Investigation of Spontaneous Combustion Zones and Index Gas Prediction System in Goaf of “Isolated Island” Working Face. Fire, 5(3), 67. https://doi.org/10.3390/fire5030067