Abstract
Remotely piloted aircraft systems (RPAS) are providing fresh perspectives for the remote sensing of fire. One opportunity is mapping tree crown scorch following fires, which can support science and management. This proof-of-concept shows that crown scorch is distinguishable from uninjured canopy in point clouds derived from low-cost RGB and calibrated RGB-NIR cameras at fine resolutions (centimeter level). The Normalized Difference Vegetation Index (NDVI) provided the most discriminatory spectral data, but a low-cost RGB camera provided useful data as well. Scorch heights from the point cloud closely matched field measurements with a mean absolute error of 0.52 m (n = 29). Voxelization of the point cloud, using a simple threshold NDVI classification as an example, provides a suitable dataset worthy of application and further research. Field-measured scorch heights also showed a relationship to RPAS-thermal-camera-derived fire radiative energy density (FRED) estimates with a Spearman rank correlation of 0.43, but there are many issues still to resolve before robust inference is possible. Mapping fine-scale scorch in 3D with RPAS and SfM photogrammetry is a viable, low-cost option that can support related science and management.
1. Introduction
Damage to tree crowns via scorch from under-burning has been of interest to foresters since at least the late 1950′s when literature in the form of research notes and occasional papers began to appear [1,2]. Van Wagner [3] related lethal scorch height to the ⅔ power of fireline intensity and that model, which also incorporates wind speed and air temperature, remains in operational use to this day. Alexander and Cruz [4] suggested that scorch height-fireline intensity relations are influenced by fuelbed structure, for example, in masticated fuels where uncharacteristically high heat is generated from relatively low flame lengths. Molina et al. [5] were able to best model scorch height and volume by including a canopy base height metric. Other related research has focused on understanding [6,7] and modeling [8] the physiological changes resulting from crown injury [7].
Crown scorch is relatively easy to measure compared to other fire effects and remote sensing techniques have been developed for a number of scales and platforms. Landsat and Sentinel satellite imagery are common data sources [9,10], but a coarse spatial resolution combined with an inability to see into the forest canopy prevents measurement of scorch on individual and subcanopy vegetation layers [11]. Higher resolution satellite platforms, such as RapidEye, have been used to collect crown scorch observations at a 5 m resolution [12]. LiDAR has proven useful as a technology as well [7,13].
Remote Piloted Aircraft Systems (RPAS or drones) have also been used to estimate post-fire effects such as fire severity [10,13]. The use of RPAS to estimate fire effects has been typically confined to 2D gridded maps [14,15]. Structure-from-motion (SfM) photogrammetric techniques [16] can produce dense, finely-resolved 3D point clouds with RPAS imagery from which needle injury might be accurately mapped within individual tree crowns. For example, Näsi et al. [17] identified tree-level bark beetle damage with a hyperspectral camera, and cameras with lower radiometric resolution in the RGB and NIR bands also show promise [18]. The normalized difference vegetation index (NDVI) [19] has been used to identify scorch in other studies [20,21,22] and it is likely that the NDVI from SfM-derived data can be used similarly to classify and map scorched conifer foliage within individual tree crowns. In parallel, RPAS also allow for fine-scale fire behavior estimation [23], including with thermal imaging [24], and a logical step is to then relate radiant fire energy to post-fire scorch as observed from this close-range, overhead perspective. Collectively, these sensors and techniques offer powerful new methods to study the causes, patterns, and consequences of crown scorch phenomena.
The objective of this research note is to demonstrate the potential of remote sensing from RPAS for quantifying tree crown injury, conventionally described as scorch, and the linkage to fire behavior. The work specifically aims to: (1) evaluate the ability to distinguish scorch from both radiometric and non-radiometric RPAS imagery and to map it in 3D; (2) measure scorch heights within 3D point clouds co-located to field measurements; and (3) link radiative fire energy to scorch measurements.
2. Materials and Methods
A prescribed burn was implemented on 17 April 2021 on the Bandy Ranch located in Powell County, MT, which is owned and managed by the University of Montana’s Forest and Conservation Experiment Station. Data collection was centered on a square 1 ha forested plot in the southeast portion of the 45 ha burn unit (Latitude: 47.063 Longitude: −113.269). The plot had a dominant overstory of ponderosa pine (Pinus ponderosa var. scopulorum) as well as Douglas-fir (Pseudotsuga menziesii var. menziesii) and western larch (Larix occidentalis). Dominant tree heights were approximately 20–35 m with a varied clump-gap horizontal arrangement ranging from low to moderate canopy coverage and the understory was relatively open from past management activities. Surface fuels were typical of dry pine forest with a mix of native bunchgrasses, introduced pasture grass, needle litter, and downed coarse woody debris. The 1 ha plot was ignited by drip-torch at 4:38 PM MST with a single strip orthogonal to the wind direction, with the intention of having a free-burning strip-head fire without influence of other firelines typical of prescribed burning methods. Additional information on the prescribed burn is within Table 1. The following three sections are divided into imagery collection and processing methods, field collection methods, and analysis of field and remote sensing data.

Table 1.
Weather observations during the 16 min of thermal imagery collection. Readings were taken in a clear field unaffected by tree cover approximately 500 m upwind of the plot.
2.1. Imagery Collection and Processing
A DJI M100 (DJI, Shenzhen, China) aerial platform was used to collect thermal and post-fire RGB-NIR imagery. As the plot burned, a radiometric FLIR XT LWIR (Teledyne FLIR LLC, Wilsonville, OR, USA) sensor captured images at a 140 m altitude every 5 s equating to 0.2 Hz sampling resolution and a 26.7 cm pixel resolution. Collection and processing methods followed Moran et al. [24]. Raw image digital numbers (DNs) were stabilized to remove aircraft motion and georectified to seven, thermally-cold ground control points (GCPs) that were located with RTK-GPS locations (Emlid Reach RS2). These same GCPs were used for deriving the post-fire point cloud data and to co-rectifying the two datasets.
The image DNs were converted to calibrated radiant temperatures using developed equations from the manufacturer FLIR, verified in a laboratory setting [24], and converted to at-surface temperatures with a correction developed in a parallel experiment [25]. Temperatures were then integrated to fire radiative energy density (FRED) using the following Equation [26]:
where Ti is the temperature in K at time i, Tbi is the average background temperature, σ is the Stefan-Boltzmann constant (5.67 × 10⁻⁸ W m−2 K−4), and Δti is the imagery time interval (5 s).
The thermal data collection covered about 16 min and the entirety of the 1 ha plot was not burned during this time. The analysis relating scorch to FRED used only samples where the imagery captured the fireline spread through the area of scorch measurement but none of the FRED estimates include the post-frontal combustion profile due to the limited time of observation.
The post-fire data collection utilized two camera sensors, the DJI X3 RGB camera and the radiometric Micasense RedEdge (AgEagle Sensor Systems, Wichita, KS, USA) simultaneously on the same flight. The post-fire imagery was collected 131 days after the burn on 26 August 2021 under cloudy, diffuse lighting conditions with a grid flight pattern. A portion of scorched needles may have dropped between the burn and image collection dates along with potential needle regrowth. This could lead to underestimation of immediate post-fire scorch estimates. Other factors causing needle mortality in the interim could potentially impact results as well. The resolution and ground footprint of the X3 RGB and RedEdge RGB-NIR cameras differed as did the frequency of image collection in order to achieve the same image overlap (90%) and sidelap (90%). 126 images were collected with the X3 and 167 images for the RedEdge. The flying altitude was 93 m above ground resulting in 3.15 cm/pixel resolution for the X3 and 9.56 cm/pixel for the RedEdge cameras.
Point clouds were derived from each camera’s imagery using structure-from-motion photogrammetry with Agisoft Metashape (Version 1.8.0 build 13111) software. In general, the highest quality, slowest processing option was selected for each Metashape setting throughout the workflow, which also utilized calibration data from an onboard light sensor and manufacturer-supplied calibration target to calculate reflectance values for the RedEdge imagery. The same GCPs utilized for the thermal imagery processing were used to assist in the development and georectification of the two point clouds. X3 RGB imagery was kept in its native 16-bit scaled range. Point clouds were exported from Metashape and further processed and visualized using the R package lidR [27] and CloudCompare (version 2.12).
2.2. Field Data
Field measurements of scorch height were collected to assess the quality of remotely-sensed estimates (n = 31) on the same day that post-fire imagery was collected. Although samples were distributed arbitrarily across the plot, they were taken where scorch was most distinct and identifiable and where accurate GPS locations could be obtained, thus representing optimal locations for a proof-of-concept investigation.
Maximum scorch heights were measured using a Laser Tech TruPulse laser hypsometer with the ground location recorded directly under the height measurement with an RTK, dual-unit (rover and base) GPS system (Emlid Reach RS2). All GPS locations were collected while the GPS system was in fixed solution mode. Estimated lateral error from the GPS system was less than 3 cm for all locations collected. Thirty-one samples were collected within the 1 ha square plot roughly corresponding to the thermal imagery footprint. Areas of significant scorch near the original 1 ha plot were also documented.
2.3. Analysis of Field and Remote Sensing Data
To distinguish crown injury from healthy tree canopy, we created training polygons of injured vs. non-injured canopy from field-verified orthomosaics derived from the point clouds. Canopy points within these polygons were selected from the point cloud and the distribution of values of each spectral band and the NDVI were evaluated.
A basic classification of scorch points was developed using an NDVI threshold combined with a threshold ratio of scorch points within 1 m3 voxels. The classification and voxelization approach is an example of a simple method for 3D mapping of crown injury, and the parameter selection process was not exhaustive but rather intended as proof-of-concept with room for further refinement.
To assess the ability of RPAS-based SfM photogrammetry to map scorch heights, measurements were taken directly from the 3D point cloud using CloudCompare software (Figure 1) matching the process of visual estimation in the field. The GPS locations were used to navigate to the corresponding areas digitally and maximum scorch height was estimated by identifying the highest cluster of clearly scorched points and drawing a vertical line to the ground surface. These digital estimates were compared to the field measurements with linear regression and accuracy statistics.
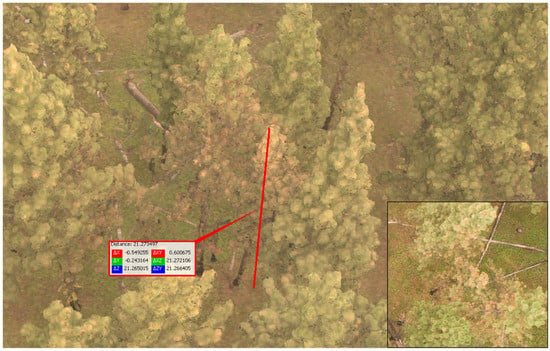
Figure 1.
Point cloud derived from structure-from-motion (SfM) photogrammetry using images taken by the DJI X3 RGB camera. The same location is shown using an original X3 image (inset bottom-right). The red line depicts the process of manually identifying and measuring scorch height within CloudCompare software. The digital measurements were taken at the same locations as the field measurements to assess the ability to accurately map scorch.
The thermal FRED estimates were then related to the field scorch measurements to evaluate if any obvious relationships existed. For each scorch measurement, the FRED estimates were averaged from pixels within a surrounding 4 m radius circle. The effects of canopy attenuation on FRED values were strong to the point of reducing measured energy to background values beneath tree canopies. To filter these affected pixels, a dynamic threshold temperature value was applied, developed by Moran et al. [24], to each image to define areas of flaming combustion. Only pixels that experienced flaming combustion by these criteria were used in the mean FRED calculation, which effectively excluded areas occluded by tree canopy.
Corrections to FRED were explored based on canopy density, such as the correction developed in Hudak et al. [28], but the FRED values did not exceed background values in many cases, also seen by Mathews et al. [29], which resulted in no existing signal to correct. Further complicating the potential use of canopy density corrections from point cloud data, the time-series of thermal images also suffered from radial displacement of tree crown shadows given the stationary collection location and close range (140 m altitude in this case). This displacement must be corrected for when attempting to align canopy-caused thermal signal attenuation. Interpolation from nearby unaffected pixels was also considered (e.g., [30]), but taking the mean of only pixels classified as flaming, which had little to no attenuation, produced nearly the same outcome as first interpolating and then calculating a mean.
3. Results and Discussion
The 3D point clouds produced easily visible differences in crown scorch in both the X3 and RedEdge image sets. With the X3′s higher resolution, the point cloud had nearly three times more data density (2107 points per m−2) than the RedEdge point cloud (707 points m−2). The spectral differences were most apparent in the red and near infrared bands of the RedEdge (Figure 2). NDVI was therefore the most discriminatory index for a classification scheme. Performance of the X3 camera-based point cloud, however, was impressive given the low-cost and simpler processing workflow. Though scorch was readily visible in the X3 point cloud, the separation of values was not as distinct as the RedEdge. The X3 showed more subcanopy vegetation overall, though both datasets underrepresented the subcanopy in dense canopy conditions. For scientific endeavors, the RedEdge produces more useful overstory canopy data but is more work in all phases from the cost to data collection to processing and analyzing. The use of standard RGB cameras for mapping scorch is a viable option in both scientific and management or monitoring settings.
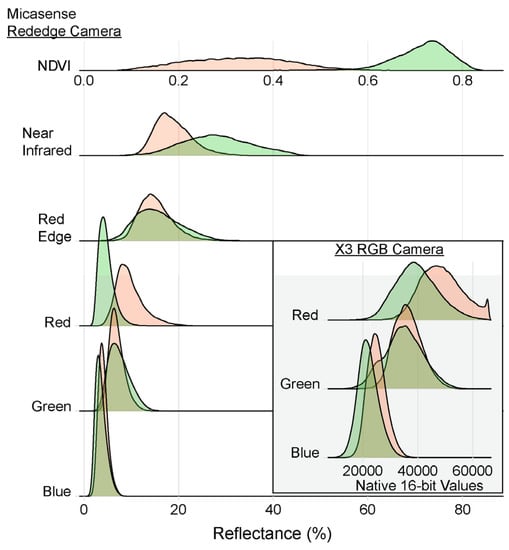
Figure 2.
Comparison of density distributions of band values for points identified as scorched needles (red) versus green needles (green) for the radiometric Micasense Rededge and standard RGB X3 cameras. The normalized differenced vegetation index (NDVI) was derived from the Rededge’s red and near infrared bands and used for subsequent classification of the point cloud.
The field-measured scorch heights had an excellent correlation to the point cloud-measured scorch heights with a mean absolute error of 0.53 m, a mean absolute percentage error of 8.6% and an r-squared of 0.98 estimated by a linear regression (n = 29, Figure 3). This result should be viewed as optimistic because the field samples were selected for their ease of visibility and GPS accuracy. An analyst identified the corresponding scorched areas within the point cloud, which reduced XY positional errors, and the height measures were also relative metrics (i.e., distance between ground and canopy points), which did not account for any vertical positional error. Of note, scorch could not be identified for one point, which is a fundamental problem in SfM photogrammetry, where features are ‘missed’ or not produced in the point cloud most often caused by not being identifiable in multiple images [14]. The use of highly-visible and accurately geolocated GCPs is suggested and has improved the point cloud in every instance we have encountered. Even with these caveats, the mapping of scorch is viable and accurate from RPAS and SfM photogrammetry.
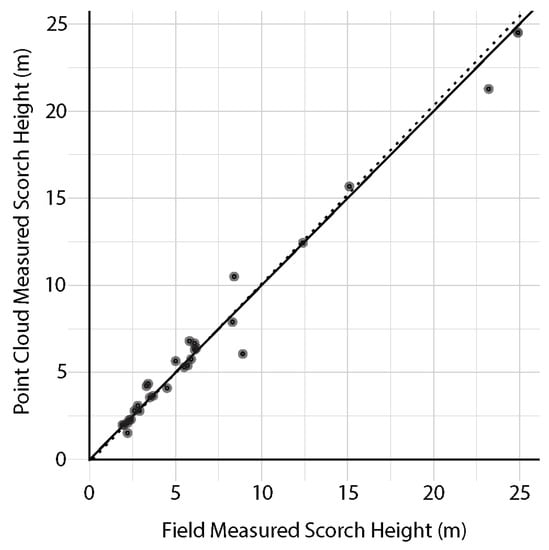
Figure 3.
Comparison of field and point cloud measurements of scorch height (n = 29). The solid line depicts a 1:1 field to point cloud relationship. Mean absolute error was 0.53 m. Mean absolute percentage error was 8.6% with an r-squared of 0.98 using a linear regression (dotted line).
Following the distributions seen in Figure 2 from the RedEdge, a 1 m3 classified voxel map of scorch was developed with scorched voxels defined as at least 20% of observed points < 0.5 NDVI (Figure 4). With this classification, 20.3% of the canopy (e.g., ≥2 m in height) voxels were considered scorched versus 9.4% of the individual points. The method used here does produce a reasonable match to observed scorch but an extensive analysis of performance and refinement of the classification is necessary for application. Distinguishing leaf data points from branches, boles, and other material before classifying scorch would likely improve the final product with an application of machine learning classifiers being the upper end of methodological complexity [18].
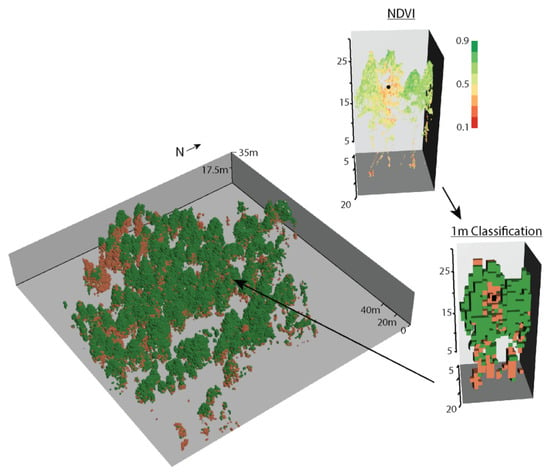
Figure 4.
Example of a classification and voxelization method for mapping scorch using NDVI values of individual points. Voxels with >20% of points < 0.5 NDVI were classified as scorched (red voxels). Following classification, 20.3% of the canopy voxels in the study area were considered scorched. The black point in the two insets was the location of the field-estimated scorch height measured using laser hypsometers and survey-grade GPS systems. Only points and voxels > 2 m in height above ground are shown.
Voxelization of the cloud helps fill in data gaps of unmapped vegetation, specifically inner and underside portions of trees, and significantly simplifies the process of generating useful canopy and scorch metrics beyond point measures of scorch height, such as volumes and proportions. High-resolution, repeat measures of the same area could provide longer-term assessment of fire effects and voxelization would reduce complexity while accounting for geolocational error and other variation in the sequential point clouds by grouping nearby points when aligning the temporal series.
The 4 m radius, mean FRED fire behavior estimates had a Spearman rank correlation of 0.43 with the field-measured scorch heights (Figure 5). The number of viable samples was low (n = 13) and therefore any conclusions about the relationship between radiation energy output and scorch are difficult to support. In Figure 5 the point size is scaled by the number of canopy points underneath the scorch height to account for the amount of absorptive biomass (594–41,868 points). Conversely, maximum scorch heights that match the height of the corresponding tree does not represent the maximum potential scorch height, which occurred in one of the samples here but was significant in other areas of the prescribed fire. This is another confounding forest structure variable to consider when relating fire energy to scorch heights.
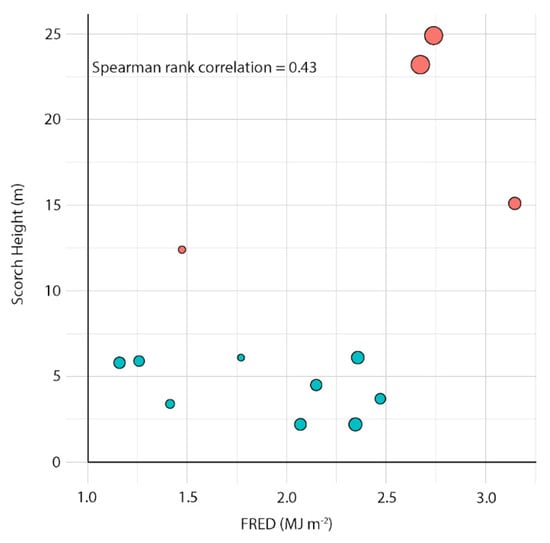
Figure 5.
Mean fire radiative energy density (FRED) within 4 m radius circles around field scorch height measurements (n = 13). Only measurements with complete fire front combustion profiles are shown, and post-frontal combustion is not included in any of the FRED estimates. Point size is scaled by the number of data points underneath the scorch height measurement (594–41,868 points) as a proxy for the amount of biomass available for energy absorption. Points shown as red have significant local Moran’s I spatial autocorrelation (p < 0.1).
It was hypothesized that measures of spatial autocorrelation might indirectly help to explain scorch caused by spatially-dependent processes such as convective heat transfer, and the samples with significant (p < 0.1) spatial autocorrelation using local Moran’s I (red points in Figure 5) [31] were indeed those with the highest scorch height measurements. Disentangling the effects of radiative and convective heat transfer, canopy structure, and spatial autocorrelation is a fruitful research direction that will be aided by 3D datasets such as those presented here. For example, canopy gaps have been identified as promoting scorch heights likely by directing and ventilating convective heat flow [5]. Collecting imagery over broader areas in mixed-severity burns would provide excellent datasets for this type of research.
4. Conclusions
Fine-scale mapping of scorch provides a useful dataset to support fire science and can also enhance the evaluation of management activities. This proof-of-concept shows that scorch is distinguishable in both uncalibrated RGB and calibrated RGB + NIR cameras and can be accurately mapped in 3D with low cost RPAS and photogrammetry. Voxelization of scorch points can simplify subsequent analysis, match the format of other 3D fuel datasets (e.g., [32]), account for variable data densities, and ease the spatial alignment of temporal series, for example in pre- and post-fire 3D datasets. Correction for canopy attenuation is crucial to deriving radiant energy and scorch linkages, which are already not expected to be robust relationships given convective heat transfer is not considered. Spatial analysis in conjunction with SfM-derived 3D forest structure metrics, such as vertical density and clump-gap arrangements, may be able to indirectly represent these convective flow patterns. RPAS can be a relatively low-cost platform for creating all of these datasets and is a keystone technology for future, spatially-explicit fire science.
Author Contributions
Conceptualization, C.J.M., V.H., L.P.Q. and C.A.S.; methodology C.J.M., V.H. and C.A.S.; investigation C.J.M., V.H., R.A.P. and C.A.S.; formal analysis, C.J.M. and V.H.; resources, C.A.S., L.P.Q. and R.A.P.; writing—original draft preparation, C.J.M., V.H. and C.A.S.; writing—reviewing and editing, C.J.M., V.H., C.A.S., L.P.Q. and R.A.P.; funding acquisition, C.J.M., C.A.S., L.P.Q. and R.A.P. All authors have read and agreed to the published version of the manuscript.
Funding
This research was funded by the Strategic Environmental Research and Development Program (SERDP), grant number RC20-1025. Funding also provided by the USDA Western Wildland Environmental Threat Assessment Center and the National Center for Landscape Fire Analysis at the University of Montana.
Data Availability Statement
Not applicable.
Acknowledgments
We thank all those involved in the prescribed burn who are too numerous to list and Sarah Flanary who assisted with initial data collection and plot layout. Three anonymous reviewers’ comments significantly improved the final manuscript.
Conflicts of Interest
The authors declare no conflict of interest. The funders had no role in the design of the study; in the collection, analyses, or interpretation of data; in the writing of the manuscript, or in the decision to publish the results.
References
- Byram, G.M. Some Basic Thermal Processes Controlling the Effects of Fire on Living Vegetation; Research Note SE-RN-114; USDA-Forest Service, Southeastern Forest Experiment Station: Asheville, NC, USA, 1959; Volume 114, p. 2.
- Hare, R.C. Heat Effects on Living Plants; Occasional Paper 183; USDA, Forest Service, Southern Forest Experiment Station: Asheville, NC, USA, 1961.
- Van Wagner, C.E. Height of Crown Scorch in Forest Fires. Can. J. For. Res. 1973, 3, 373–378. [Google Scholar] [CrossRef] [Green Version]
- Alexander, M.E.; Cruz, M.G. Interdependencies between Flame Length and Fireline Intensity in Predicting Crown Fire Initiation and Crown Scorch Height. Int. J. Wildland Fire 2011, 21, 95–113. [Google Scholar] [CrossRef]
- Molina, J.R.; Ortega, M.; Rodríguez y Silva, F. Scorch Height and Volume Modeling in Prescribed Fires: Effects of Canopy Gaps in Pinus Pinaster Stands in Southern Europe. For. Ecol. Manag. 2022, 506, 119979. [Google Scholar] [CrossRef]
- Sayer, M.A.S.; Tyree, M.C.; Kuehler, E.A.; Jackson, J.K.; Dillaway, D.N. Physiological Mechanisms of Foliage Recovery after Spring or Fall Crown Scorch in Young Longleaf Pine (Pinus Palustris Mill.). For. Trees Livelihoods 2020, 11, 208. [Google Scholar] [CrossRef] [Green Version]
- Varner, J.M.; Hood, S.M.; Aubrey, D.P.; Yedinak, K.; Hiers, J.K.; Jolly, W.M.; Shearman, T.M.; McDaniel, J.K.; O’Brien, J.J.; Rowell, E.M. Tree Crown Injury from Wildland Fires: Causes, Measurement and Ecological and Physiological Consequences. New Phytol. 2021, 231, 1676–1685. [Google Scholar] [CrossRef]
- Kavanagh, K.L.; Dickinson, M.B.; Bova, A.S. A Way Forward for Fire-Caused Tree Mortality Prediction: Modeling A Physiological Consequence of Fire. Fire Ecol. 2010, 6, 80–94. [Google Scholar] [CrossRef]
- French, N.H.F.; Kasischke, E.S.; Hall, R.J.; Murphy, K.A.; Verbyla, D.L.; Hoy, E.E.; Allen, J.L. Using Landsat Data to Assess Fire and Burn Severity in the North American Boreal Forest Region: An Overview and Summary of Results. Int. J. Wildland Fire 2008, 17, 443–462. [Google Scholar] [CrossRef]
- Pádua, L.; Guimarães, N.; Adão, T.; Sousa, A.; Peres, E.; Sousa, J.J. Effectiveness of Sentinel-2 in Multi-Temporal Post-Fire Monitoring When Compared with UAV Imagery. ISPRS Int. J. Geo-Inf. 2020, 9, 225. [Google Scholar] [CrossRef] [Green Version]
- Butler, B.W.; Dickinson, M.B. Tree Injury and Mortality in Fires: Developing Process-Based Models. Fire Ecol. 2010, 6, 55–79. [Google Scholar] [CrossRef]
- Arnett, J.T.T.R.; Coops, N.C.; Daniels, L.D.; Falls, R.W. Detecting Forest Damage after a Low-Severity Fire Using Remote Sensing at Multiple Scales. Int. J. Appl. Earth Obs. Geoinf. 2015, 35, 239–246. [Google Scholar] [CrossRef]
- Hillman, S.; Hally, B.; Wallace, L.; Turner, D.; Lucieer, A.; Reinke, K.; Jones, S. High-Resolution Estimates of Fire Severity—An Evaluation of UAS Image and LiDAR Mapping Approaches on a Sedgeland Forest Boundary in Tasmania, Australia. Fire 2021, 4, 14. [Google Scholar] [CrossRef]
- Shin, J.; Seo, W.; Kim, T.; Park, J.; Woo, C. Using UAV Multispectral Images for Classification of Forest Burn Severity-A Case Study of the 2019 Gangneung Forest Fire. Forests 2019, 10, 1025. [Google Scholar] [CrossRef] [Green Version]
- Hamilton, D.A.; Brothers, K.L.; Jones, S.D.; Colwell, J.; Winters, J. Wildland Fire Tree Mortality Mapping from Hyperspectral Imagery Using Machine Learning. Remote Sens. 2021, 13, 290. [Google Scholar] [CrossRef]
- Iglhaut, J.; Cabo, C.; Puliti, S.; Piermattei, L.; O’Connor, J.; Rosette, J. Structure from Motion Photogrammetry in Forestry: A Review. Curr. For. Rep. 2019, 5, 155–168. [Google Scholar] [CrossRef] [Green Version]
- Näsi, R.; Honkavaara, E.; Lyytikäinen-Saarenmaa, P.; Blomqvist, M.; Litkey, P.; Hakala, T.; Viljanen, N.; Kantola, T.; Tanhuanpää, T.; Holopainen, M. Using UAV-Based Photogrammetry and Hyperspectral Imaging for Mapping Bark Beetle Damage at Tree-Level. Remote Sens. 2015, 7, 15467–15493. [Google Scholar] [CrossRef] [Green Version]
- Onishi, M.; Ise, T. Explainable Identification and Mapping of Trees Using UAV RGB Image and Deep Learning. Sci. Rep. 2021, 11, 903. [Google Scholar] [CrossRef]
- Tucker, C.J. Red and photographic infrared linear combinations for monitoring vegetation. Remote Sens. Environ. 1979, 8, 127–150. [Google Scholar] [CrossRef] [Green Version]
- Hammill, K.A.; Bradstock, R.A. Remote Sensing of Fire Severity in the Blue Mountains: Influence of Vegetation Type and Inferring Fire Intensity. Int. J. Wildland Fire 2006, 15, 213–226. [Google Scholar] [CrossRef]
- Lentile, L.B.; Smith, A.M.S.; Hudak, A.T.; Morgan, P.; Bobbitt, M.J.; Lewis, S.A.; Robichaud, P.R. Remote Sensing for Prediction of 1-Year Post-Fire Ecosystem Condition. Int. J. Wildland Fire 2009, 18, 594–608. [Google Scholar] [CrossRef] [Green Version]
- Sparks, A.M.; Kolden, C.A.; Talhelm, A.F.; Smith, A.M.S.; Apostol, K.G.; Johnson, D.M.; Boschetti, L. Spectral Indices Accurately Quantify Changes in Seedling Physiology Following Fire: Towards Mechanistic Assessments of Post-Fire Carbon Cycling. Remote Sens. 2016, 8, 572. [Google Scholar] [CrossRef] [Green Version]
- Filkov, A.; Cirulis, B.; Penman, T. Quantifying Merging Fire Behaviour Phenomena Using Unmanned Aerial Vehicle Technology. Int. J. Wildland Fire 2020, 30, 197–214. [Google Scholar] [CrossRef]
- Moran, C.J.; Seielstad, C.A.; Cunningham, M.R.; Hoff, V.; Parsons, R.A.; Queen, L.; Sauerbrey, K.; Wallace, T. Deriving Fire Behavior Metrics from UAS Imagery. Fire 2019, 2, 36. [Google Scholar] [CrossRef] [Green Version]
- Moran, C.J.; Seielstad, C.A.; Marcozzi, A.; Hoff, V.; Parsons, R.A.; Johnson, J.; Queen, L. Fine-scale Pattern and Process Interactions: A Fuel Treatment, Prescribed Fire, and Modeling Experiment. Int. J. Wildland Fire, in review.
- Hudak, A.; Freeborn, P.; Lewis, S.; Hood, S.; Smith, H.; Hardy, C.; Kremens, R.; Butler, B.; Teske, C.; Tissell, R.; et al. The Cooney Ridge Fire Experiment: An Early Operation to Relate Pre-, Active, and Post-Fire Field and Remotely Sensed Measurements. Fire 2018, 1, 10. [Google Scholar] [CrossRef] [Green Version]
- Roussel, J.-R.; Auty, D.; Coops, N.C.; Tompalski, P.; Goodbody, T.R.H.; Meador, A.S.; Bourdon, J.-F.; de Boissieu, F.; Achim, A. lidR: An R Package for Analysis of Airborne Laser Scanning (ALS) Data. Remote Sens. Environ. 2020, 251, 112061. [Google Scholar] [CrossRef]
- Hudak, A.T.; Dickinson, M.B.; Bright, B.C.; Kremens, R.L.; Louise Loudermilk, E.; O’Brien, J.J.; Hornsby, B.S.; Ottmar, R.D. Measurements Relating Fire Radiative Energy Density and Surface Fuel Consumption—RxCADRE 2011 and 2012. Int. J. Wildland Fire 2016, 25, 25. [Google Scholar] [CrossRef] [Green Version]
- Mathews, B.J.; Strand, E.K.; Smith, A.M.S.; Hudak, A.T.; Dickinson, B.; Kremens, R.L. Laboratory Experiments to Estimate Interception of Infrared Radiation by Tree Canopies. Int. J. Wildland Fire 2016, 25, 1009. [Google Scholar] [CrossRef]
- Klauberg, C.; Hudak, A.T.; Bright, B.C.; Boschetti, L.; Dickinson, M.B.; Kremens, R.L.; Silva, C.A. Use of Ordinary Kriging and Gaussian Conditional Simulation to Interpolate Airborne Fire Radiative Energy Density Estimates. Int. J. Wildland Fire 2018, 27, 228–240. [Google Scholar] [CrossRef]
- Anselin, L. Local Indicators of Spatial Association-LISA. Geogr. Anal. 2010, 27, 93–115. [Google Scholar] [CrossRef]
- Rowell, E.; Loudermilk, E.L.; Hawley, C. Coupling Terrestrial Laser Scanning with 3D Fuel Biomass Sampling for Advancing Wildland Fuels Characterization. For. Ecol. Manag. 2020, 462, 117945. [Google Scholar] [CrossRef]
Publisher’s Note: MDPI stays neutral with regard to jurisdictional claims in published maps and institutional affiliations. |
© 2022 by the authors. Licensee MDPI, Basel, Switzerland. This article is an open access article distributed under the terms and conditions of the Creative Commons Attribution (CC BY) license (https://creativecommons.org/licenses/by/4.0/).