
Hydrological and Meteorological Controls on Large Wildfire Ignition and Burned Area in Northern California during 2017–2020


Abstract
:1. Introduction
2. Materials and Methods
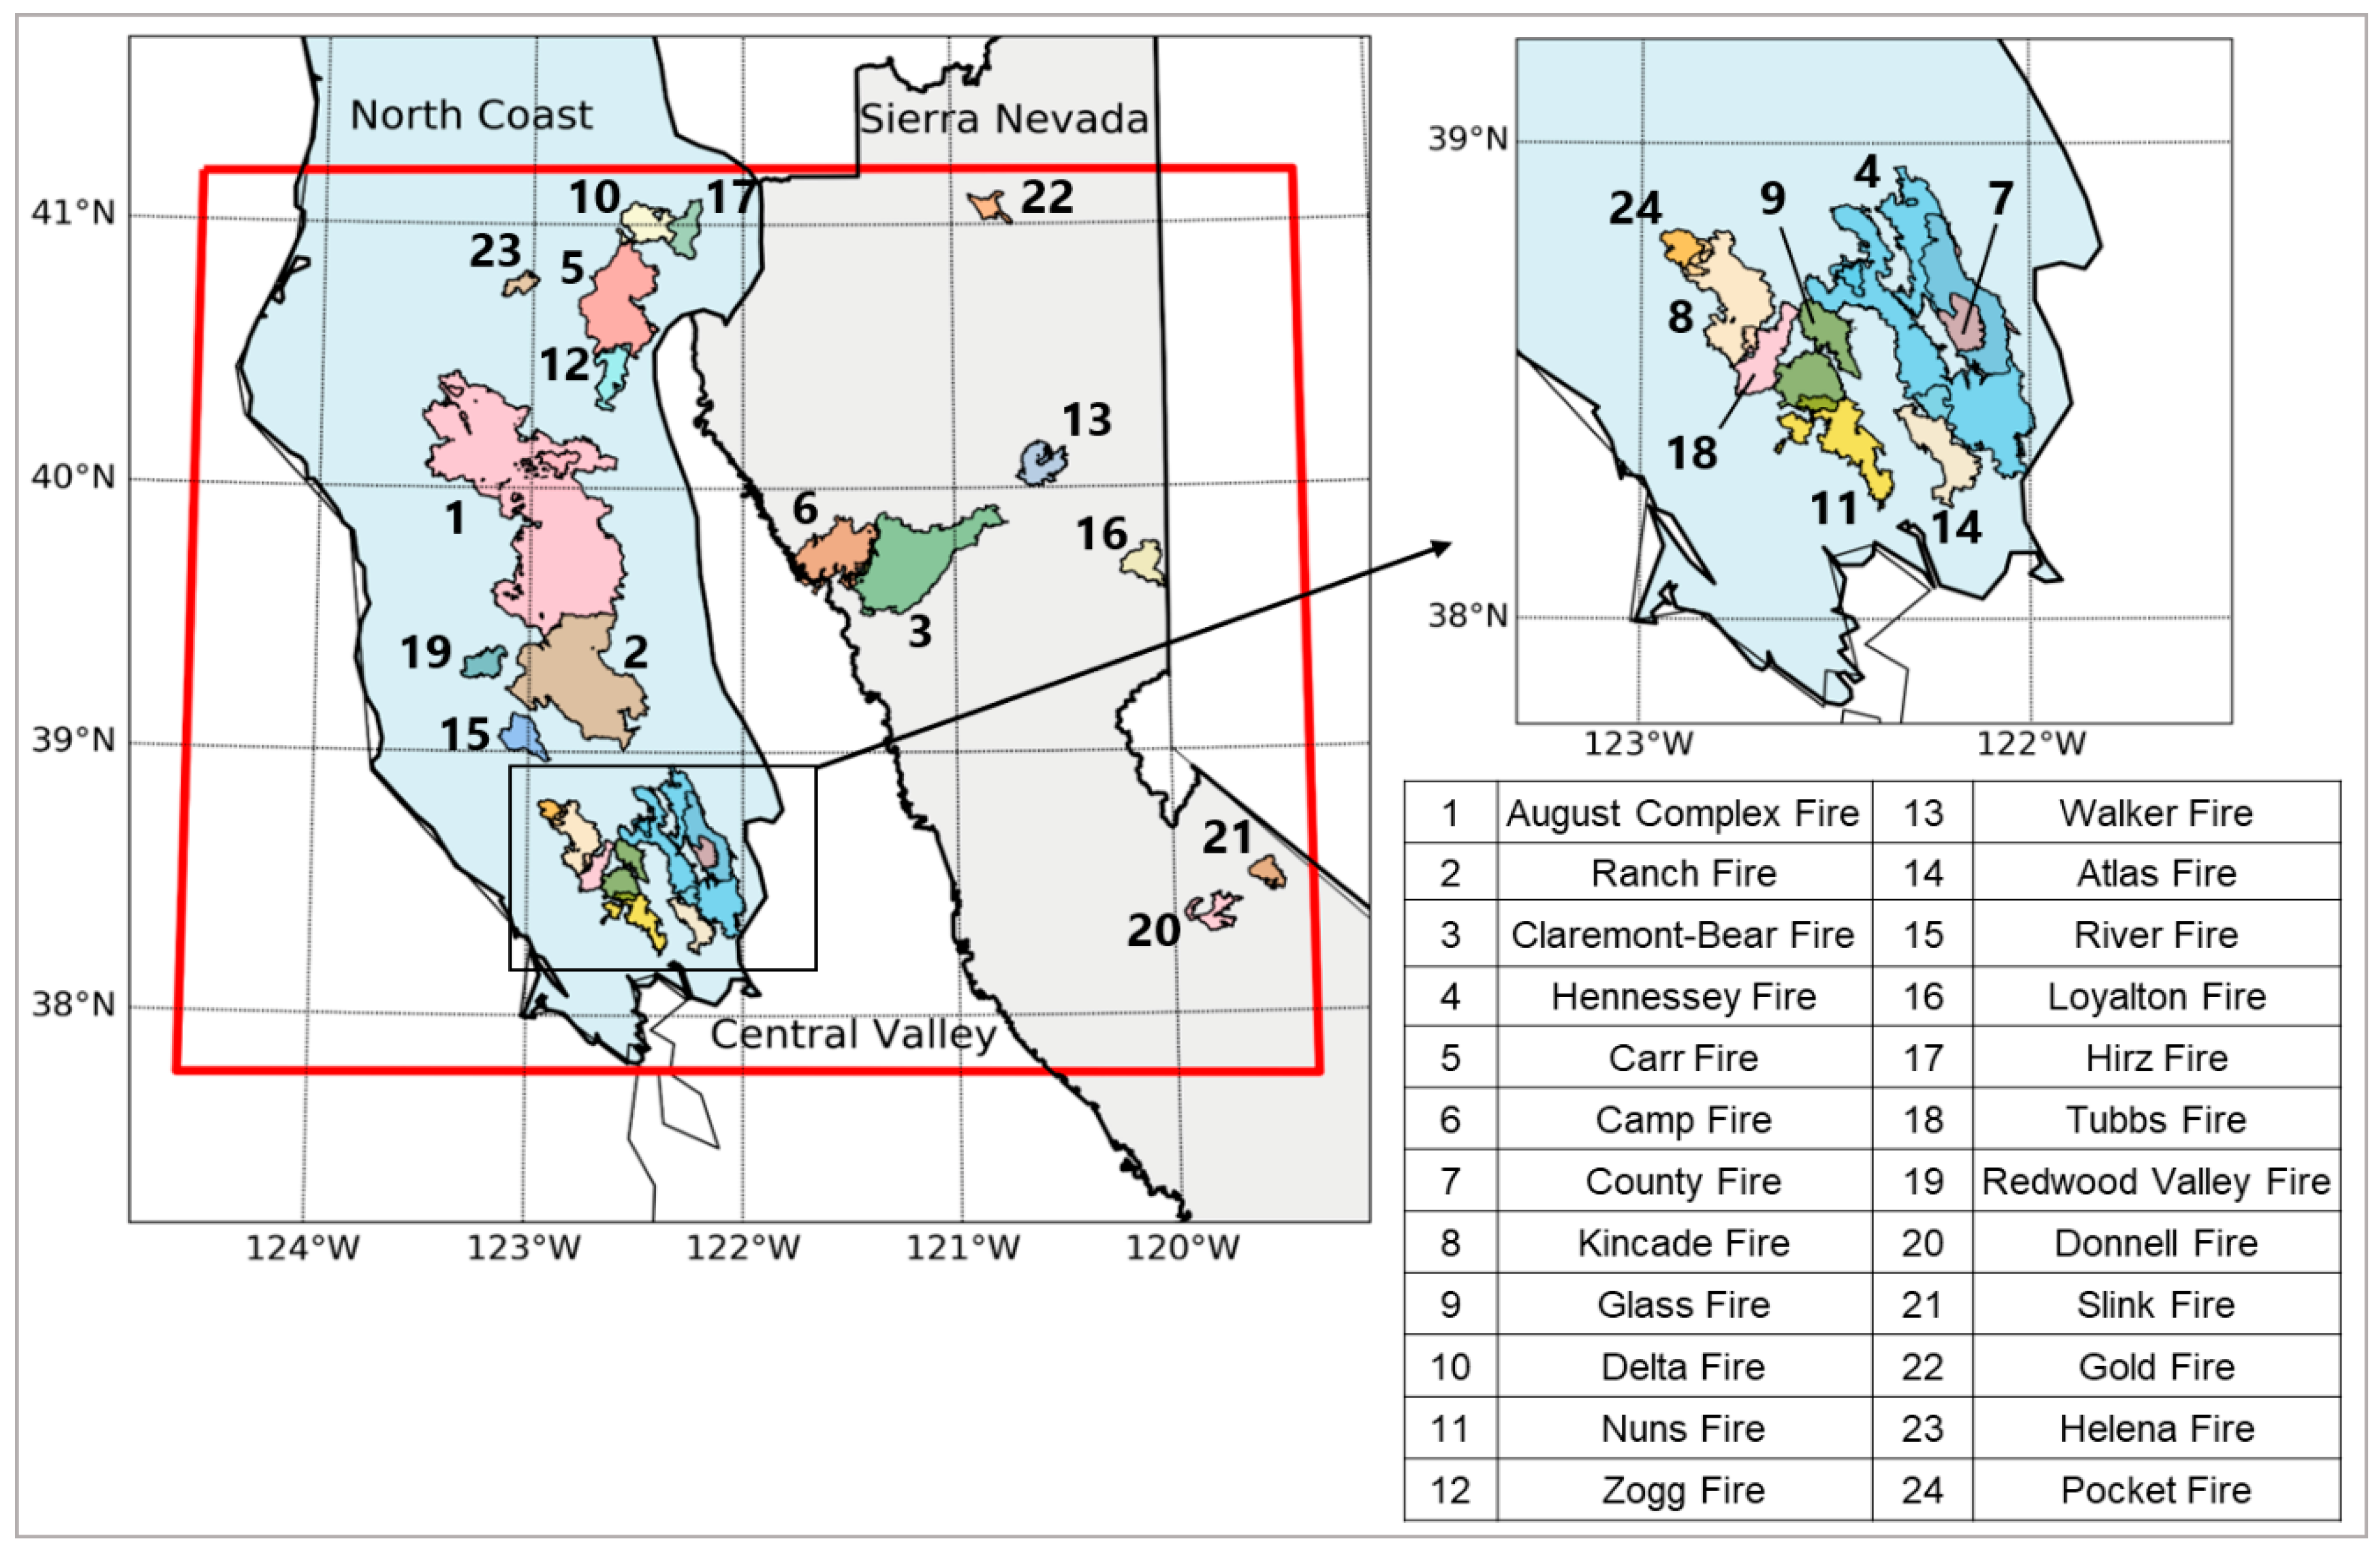
2.1. Study Area and Target Wildfire
2.2. Hydrological and Meteorological Data
- Moisture Deficit Index (MDI), which is computed by dividing VPD by soil moisture content;
- MDIWIND, which is computed by multiplying MDI by horizontal wind speed;
- MDIGUST, which is computed by multiplying MDI by wind gust speed.
2.3. Analysis
3. Results
3.1. Characteristics of Hydrological/Meteorological Variables and Indices at the Ignition Location on the Ignition Date for the Target Wildfires
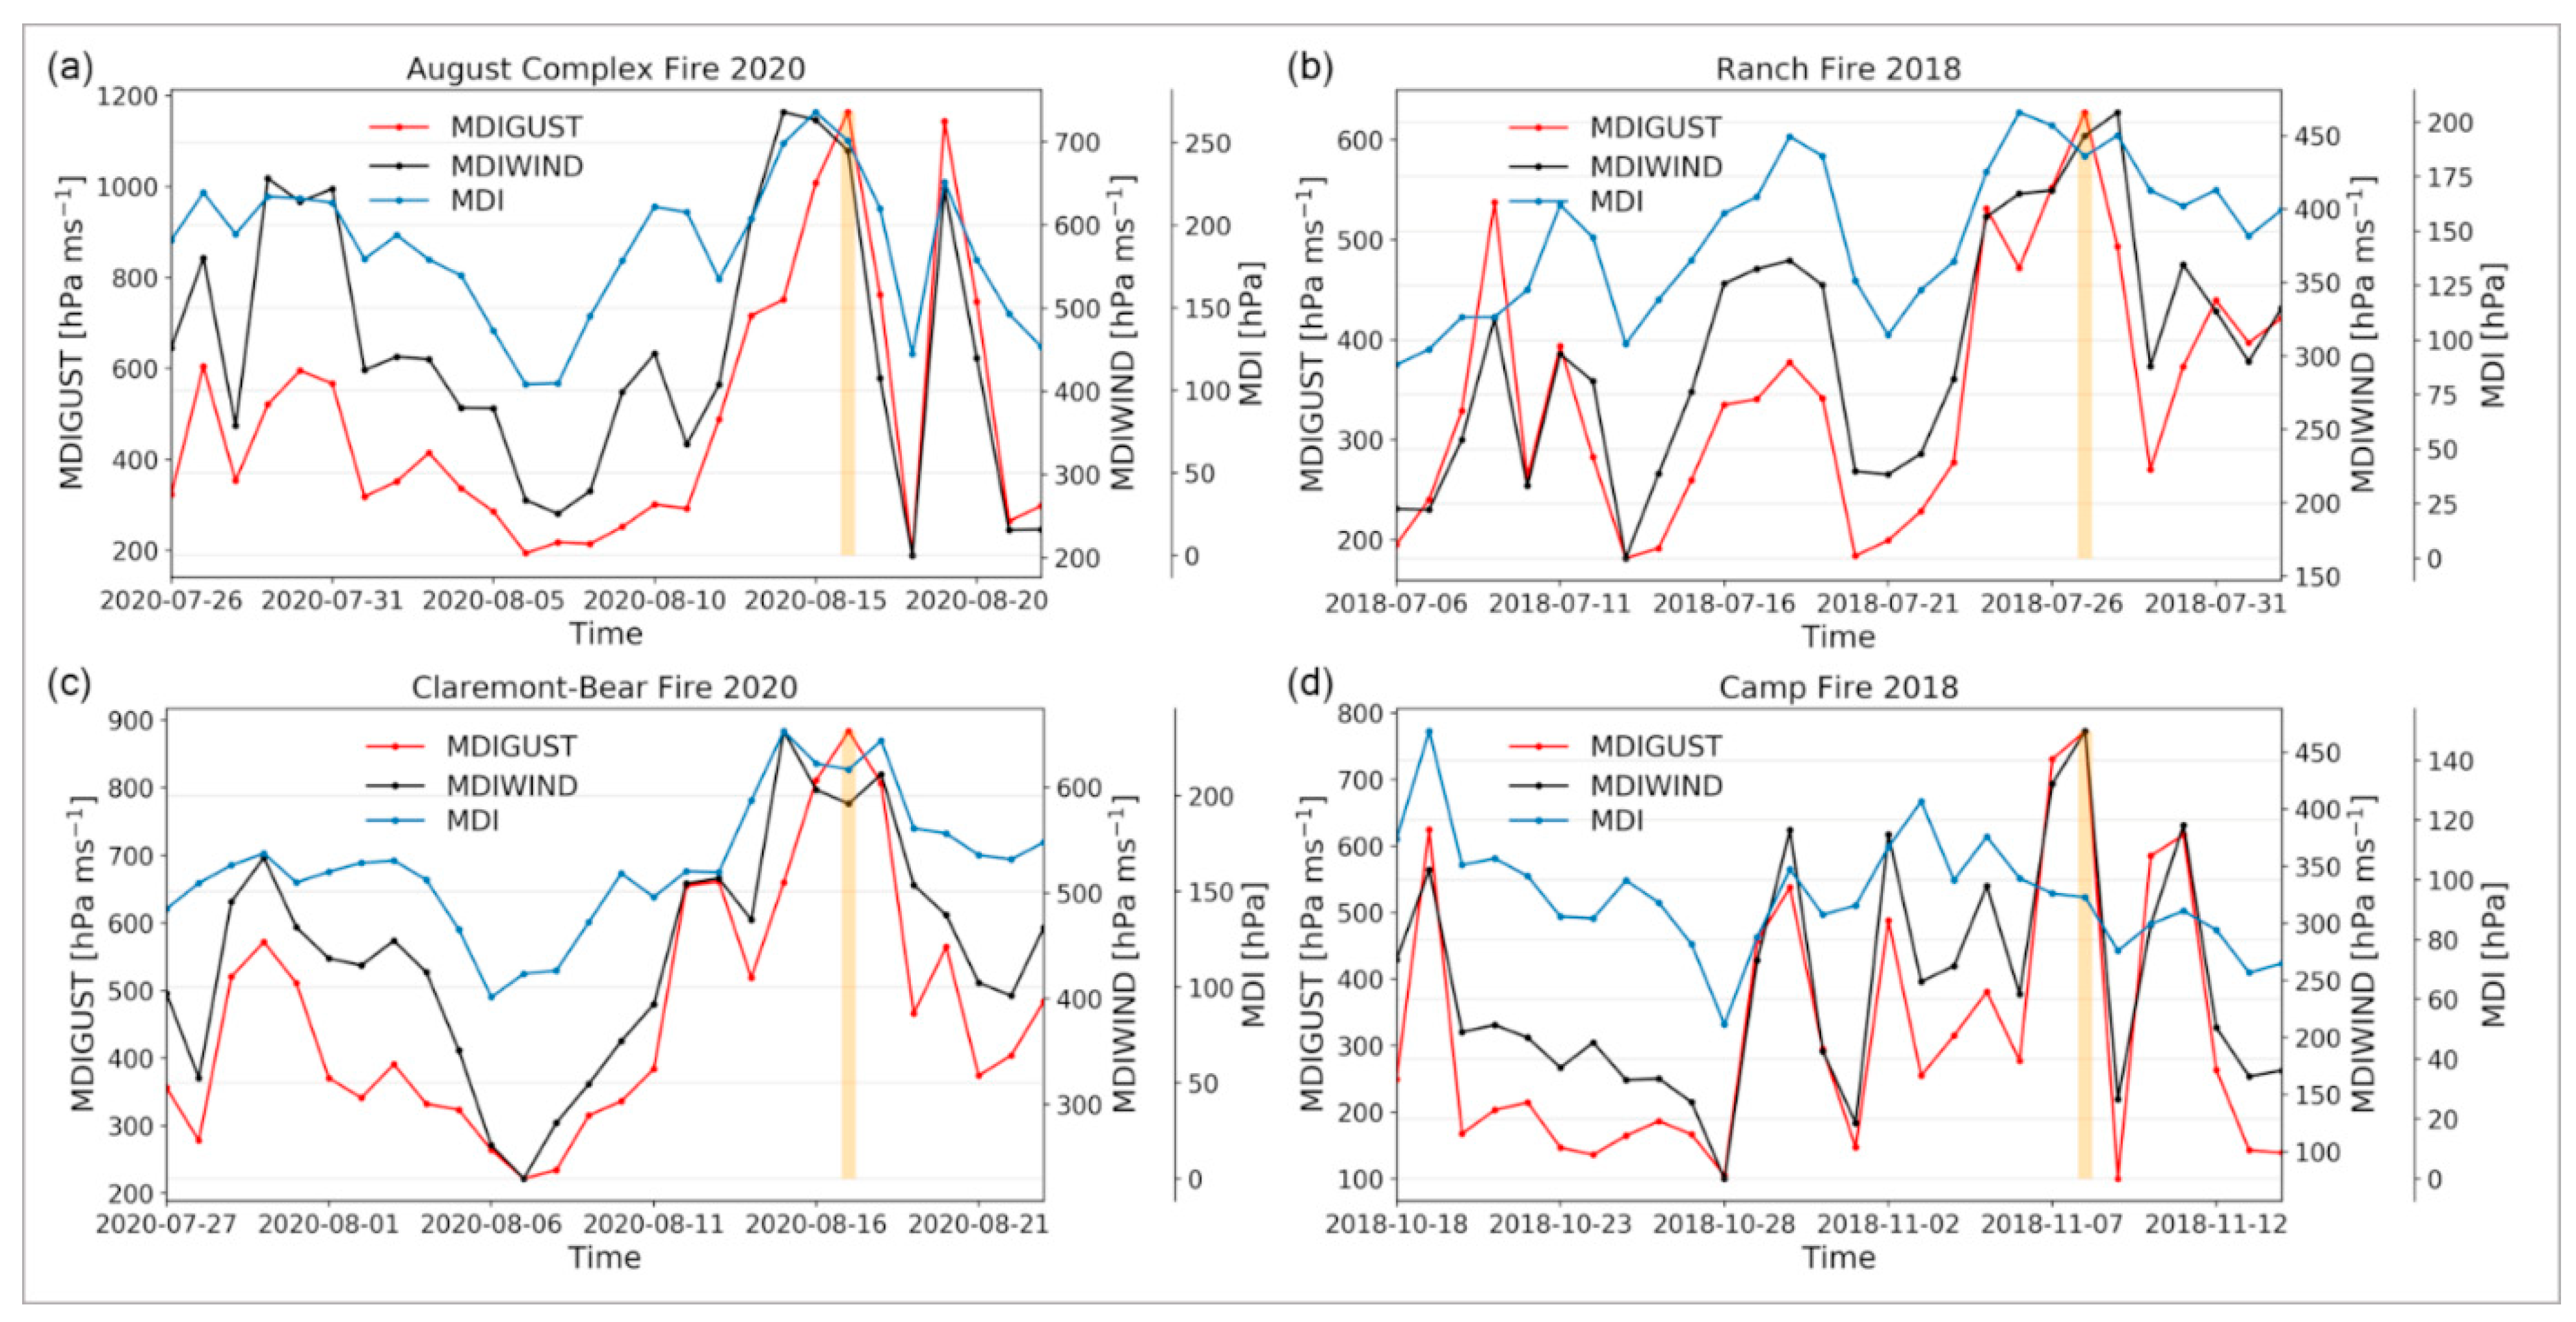
3.2. Time Series of Ignition Location Hydrological/Meteorological Indices for the Target Wildfires
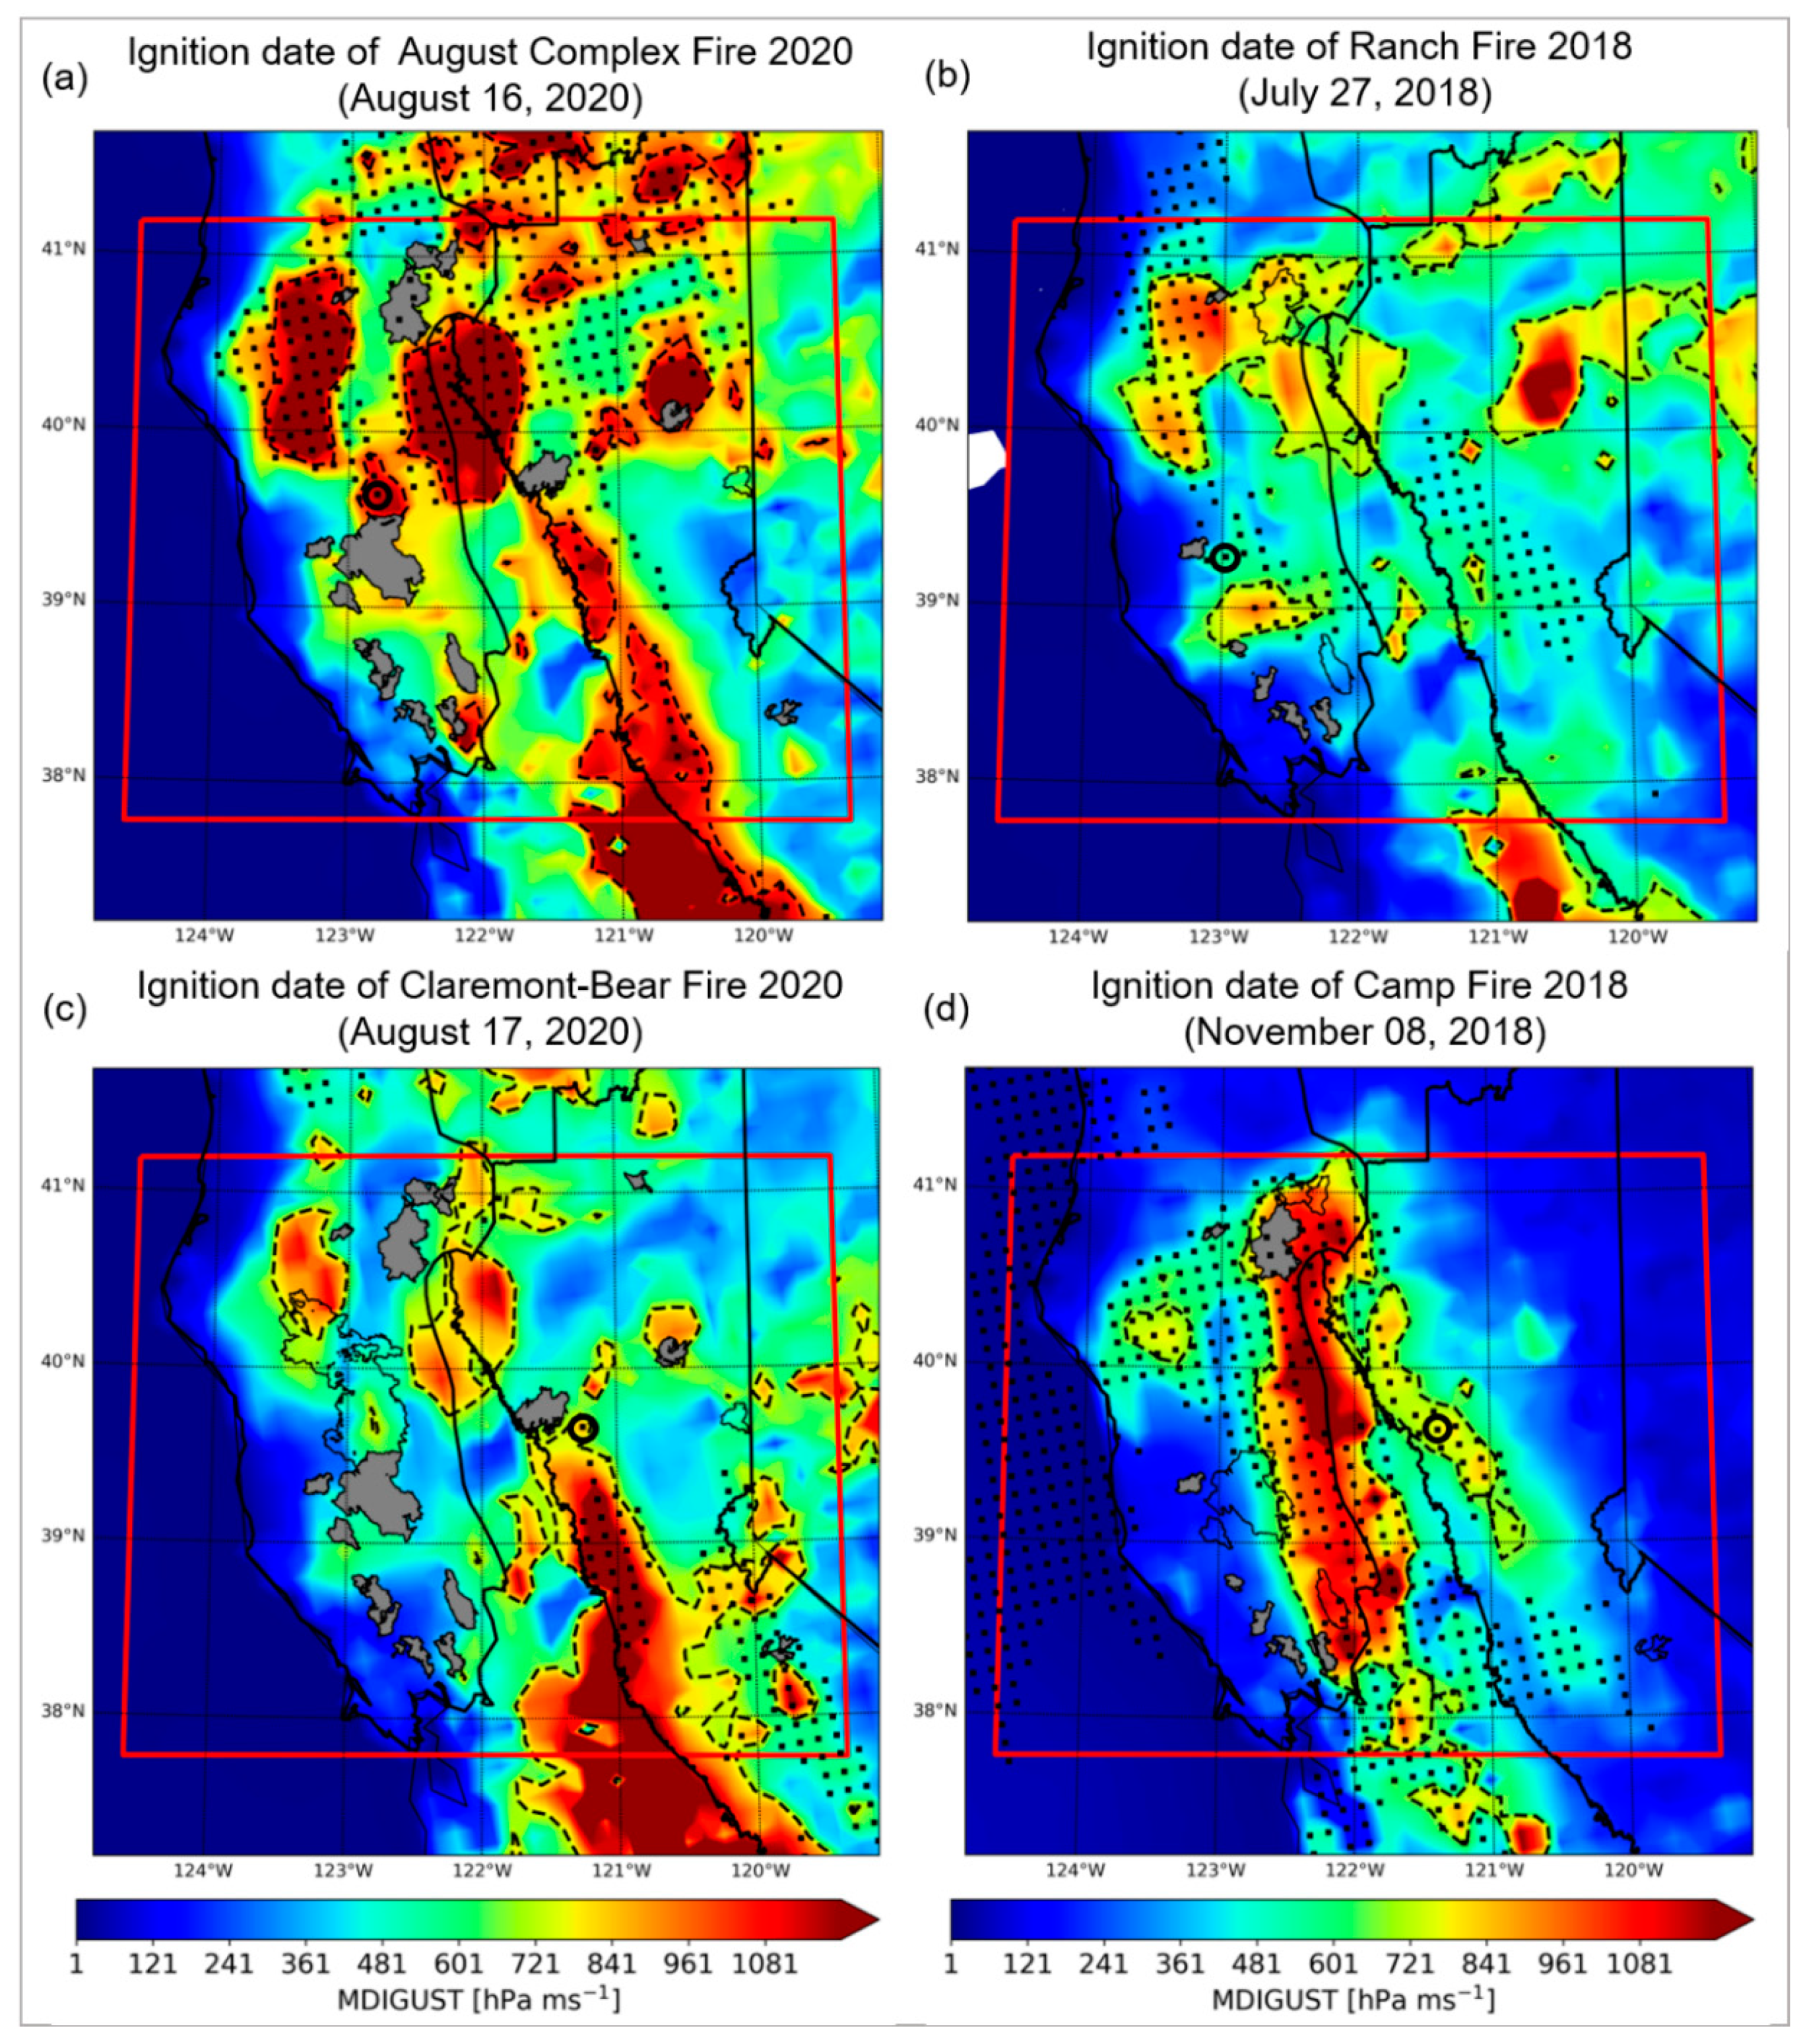
3.3. Spatial Distributions of Hydrological/Meteorological Index and Locations of the Target Wildfires
3.4. Relationships between Burned Area Sizes and Hydrological/Meteorological Variables and Indices for the Target Wildfires
4. Discussion and Conclusions
- (1)
- Our analysis showed that the ignition location grids of the target wildfires generally have moisture deficit tendencies in fire-years compared to non-fire-years (Table 2 and Table 3). Further, the ignition location MDIWIND and MDIGUST showed larger values in fire-years compared to non-fire-years for most of the target wildfires (95.8% and 91.7%, respectively). Other recent studies also reported that moisture deficits are strongly associated with wildfire regimes in the western United States [5,6].
- (2)
- It was shown that the indices that comprehensively evaluate the effects of moisture deficit and wind strength explain the ignition timings better than MDI, which evaluates moisture deficit degree (Figure 2). Specifically, the MDIGUST peak’s timing coincided with the ignition date for August Complex Fire 2020, Ranch Fire 2018, Claremont-Bear Fire 2020, and Camp Fire 2018. This finding suggests that when the risk of large wildfire occurrence becomes high at a certain location could be identified by using the comprehensive information of moisture deficit and of wind strength, which agrees with the finding of Srock et al. [22].
- (3)
- The analysis of the spatial distribution of MDIGUST showed that August Complex Fire 2020, Claremont-Bear Fire 2020, and Camp Fire 2018 occurred in the identified overlapping areas where MDIGUST becomes spatially and temporally high (Figure 3). Although this analysis did not identify the exact ignition locations of the selected wildfires, it may be used to narrow down, to some extent, the potential locations with high risks of disastrous wildfire occurrences. In other words, this analysis is expected to provide useful information for identifying the regions to be monitored for high risk of catastrophic wildfire occurrences in the study area.
- (4)
- We examined the correlation between the logarithms of burned area size and time-averaged daily spatial maximum/minimum variables and indices within the burned area during the 2 week period after the ignition date for target wildfires. We found strong relationships between burned area sizes of the target wildfires and VPD (R = 0.60, p = 0.003), MDI (R = 0.62, p = 0.002), MDIWIND (R = 0.72, p < 0.001; Figure 4f), and MDIGUST (R = 0.68, p < 0.001; Figure 4g). These results suggest that the combination of hot, dry, and windy weather and dry soil conditions strongly drive large wildfire activities in the study area. Similarly, Williams et al. [5] reported a strong correlation between burned area sizes and VPD (R = 0.72, p = 0.003) over the North Coast and the Sierra Nevada regions for summer wildfires during 1972–2018 in California.
Author Contributions
Funding
Data Availability Statement
Acknowledgments
Conflicts of Interest
References
- CALFIRE Incidents. California Department of Forestry and Fire Protection (CAL FIRE). Incident Archive. 2020. Available online: https://www.fire.ca.gov/incidents/ (accessed on 10 April 2021).
- Wang, D.; Guan, D.; Zhu, S.; Kinnon, M.M.; Geng, G.; Zhang, Q.; Zheng, H.; Lei, T.; Shao, S.; Gong, P.; et al. Economic footprint of California wildfires in 2018. Nat. Sustain. 2018, 4, 252–260. [Google Scholar] [CrossRef]
- Proctor, C.R.; Lee, J.; Yu, D.; Shah, A.D.; Whelton, A.J. Wildfire caused widespread drinking water distribution network contamination. AWWA Water Sci. 2020, 2, 1–14. [Google Scholar] [CrossRef]
- Williams, A.P.; Abatzoglou, J.T.; Gershunov, A. Observed Impacts of Anthropogenic Climate Change on Wildfire in California. Earth Future 2019, 7, 892–910. [Google Scholar] [CrossRef] [Green Version]
- Abatzoglou, J.T.; Williams, A.P. Impact of anthropogenic climate change on wildfire across western US forests. Proc. Natl. Acad. Sci. USA 2016, 113, 11770–11775. [Google Scholar] [CrossRef] [PubMed] [Green Version]
- Holden, Z.A.; Swanson, A.; Luce, C.H.; Jolly, W.M.; Maneta, M.; Oyler, J.W.; Warren, D.A.; Parsons, R.; Affleck, D. Decreasing fire season precipitation increased recent western US forest wildfire activity. Proc. Natl. Acad. Sci. USA 2018, 115, E8349–E8357. [Google Scholar] [CrossRef] [Green Version]
- Westerling, A.L.R. Increasing western US forest wildfire activity: Sensitivity to changes in the timing of spring. Philos. Trans. R. Soc. B Biol. Sci. 2016, 371, 20150178. [Google Scholar] [CrossRef]
- Westerling, A.L.; Hidalgo, H.G.; Cayan, D.R.; Swetnam, T.W. Warming and earlier spring increase Western U.S. forest wildfire activity. Science 2006, 313, 940–943. [Google Scholar] [CrossRef] [PubMed] [Green Version]
- Mass, C.F.; Ovens, D. The northern California wildfires of 8–9 October 2017. Bull. Am. Meteorol. Soc. 2019, 100, 235–256. [Google Scholar] [CrossRef]
- Nauslar, N.J.; Abatzoglou, J.T.; Marsh, P.T. The 2017 North Bay and Southern California Fires: A Case Study. Fire 2018, 1, 18. [Google Scholar] [CrossRef] [Green Version]
- Fovell, R.G.; Gallagher, A. Winds and Gusts during the Thomas Fire. Fire 2018, 1, 47. [Google Scholar] [CrossRef] [Green Version]
- Rolinski, T.; Capps, S.B.; Fovell, R.G.; Cao, Y.; D’Agostino, B.J.; Vanderburg, S. The Santa Ana wildfire threat index: Methodology and operational implementation. Weather Forecast 2016, 31, 1881–1897. [Google Scholar] [CrossRef]
- Smith, C.; Hatchett, B.J.; Kaplan, M. A Surface Observation Based Climatology of Diablo-Like Winds in California’s Wine Country and Western Sierra Nevada. Fire 2018, 1, 25. [Google Scholar] [CrossRef] [Green Version]
- Gedalof, Z.E.; Peterson, D.L.; Mantua, N.J. Atmospheric, climatic, and ecological controls on extreme wildfire years in the northwestern United States. Ecol. Appl. 2005, 15, 154–174. [Google Scholar] [CrossRef]
- Parisien, M.A.; Moritz, M.A. Environmental controls on the distribution of wildfire at multiple spatial scales. Ecol. Monogr. 2009, 79, 127–154. [Google Scholar] [CrossRef]
- Nunes, L.J.; Raposo, M.A.; Pinto Gomes, C.J. A Historical Perspective of Landscape and Human Population Dynamics in Guimarães (Northern Portugal): Possible Implications of Rural Fire Risk in a Changing Environment. Fire 2021, 4, 49. [Google Scholar] [CrossRef]
- Goss, M.; Swain, D.L.; Abatzoglou, J.T.; Sarhadi, A.; Kolden, C.A.; Williams, A.P.; Diffenbaugh, N.S. Climate change is increasing the likelihood of extreme autumn wildfire conditions across California. Environ. Res. Lett. 2020, 15, 094016. [Google Scholar] [CrossRef] [Green Version]
- Westerling, A.L.; Bryant, B.P.; Preisler, H.K.; Holmes, T.P.; Hidalgo, H.G.; Das, T.; Shrestha, S.R. Climate change and growth scenarios for California wildfire. Clim. Change 2011, 109, 445–463. [Google Scholar] [CrossRef]
- Di Giuseppe, F.; Vitolo, C.; Krzeminski, B.; San-Miguel, J. Fire weather index: The skill provided by ECMWF ensemble prediction system. Nat. Hazards Earth Syst. Sci. 2020, 2020, 1–18. [Google Scholar] [CrossRef] [Green Version]
- Van Wagner, C.E. The development and structure of the Canadian Forest Fire Weather Index System. In Forestry Technical Report; Canadian Forest Service: Ottawa, ON, Canada, 1987; Volume 35, p. 37. [Google Scholar]
- Westerling, A.L.; Cayan, D.R.; Brown, T.J.; Hall, B.L.; Riddle, L.G. Climate, santa ana winds and autumn wildfires in Southern California. Eos 2004, 85, 289–296. [Google Scholar] [CrossRef]
- Srock, A.F.; Charney, J.J.; Potter, B.E.; Goodrick, S.L. The Hot-Dry-Windy Index: A New Fire Weather Index. Atmosphere 2018, 9, 279. [Google Scholar] [CrossRef] [Green Version]
- McDonald, J.M.; Srock, A.F.; Charney, J.J. Development and application of a Hot-Dry-Windy Index (HDW) climatology. Atmosphere 2018, 9, 285. [Google Scholar] [CrossRef] [Green Version]
- Potter, B.; Charney, J.; Srock, A. The Hot-Dry-Windy Index: A New Tool for Forecasting Fire Weather. In Science Findings 227; US Department of Agriculture, Forest Service, Pacific Northwest Research Station: Portland, OR, USA, 2020; pp. 1–5. [Google Scholar]
- Hyoung, L.J. Prediction of Large-Scale Wildfires with the Canopy Stress Index Derived from Soil Moisture Active Passive. IEEE J. Sel. Top. Appl. Earth Obs. Remote Sens. 2021, 14, 2096–2102. [Google Scholar] [CrossRef]
- Krueger, E.S.; Ochsner, T.E.; Carlson, J.D.; Engle, D.M.; Twidwell, D.; Fuhlendorf, S.D. Concurrent and antecedent soil moisture relate positively or negatively to probability of large wildfires depending on season. Int. J. Wildl. Fire. 2016, 25, 657–668. [Google Scholar] [CrossRef]
- Krueger, E.S.; Ochsner, T.E.; Quiring, S.M.; Engle, D.M.; Carlson, J.D.; Twidwell, D.; Fuhlendorf, S.D. Measured Soil Moisture is a Better Predictor of Large Growing-Season Wildfires than the Keetch-Byram Drought Index. Soil Sci. Soc. Am. J. 2017, 81, 490–502. [Google Scholar] [CrossRef]
- Ambadan, J.T.; Oja, M.; Gedalof, Z.; Berg, A.A. Satellite-Observed Soil Moisture as an Indicator of Wildfire Risk. Remote Sens. 2020, 12, 1543. [Google Scholar] [CrossRef]
- Jensen, D.; Reager, J.T.; Zajic, B.; Rousseau, N.; Rodell, M.; Hinkley, E. The sensitivity of US wildfire occurrence to pre-season soil moisture conditions across ecosystems. Environ. Res. Lett. 2018, 13, 014021. [Google Scholar] [CrossRef]
- Schaefer, A.J.; Magi, B.I. Land-cover dependent relationships between fire and soil moisture. Fire 2019, 2, 55. [Google Scholar] [CrossRef] [Green Version]
- Rigden, A.J.; Powell, R.S.; Trevino, A.; McColl, K.A.; Huybers, P. Microwave Retrievals of Soil Moisture Improve Grassland Wildfire Predictions. Geophys. Res. Lett. 2020, 47, 1–8. [Google Scholar] [CrossRef]
- Sungmin, O.; Hou, X.; Orth, R. Observational evidence of wildfire-promoting soil moisture anomalies. Sci. Rep. 2020, 10, 1–8. [Google Scholar] [CrossRef]
- Waring, R.H.; Coops, N.C. Predicting large wildfires across western North America by modeling seasonal variation in soil water balance. Clim. Chang. 2016, 135, 325–339. [Google Scholar] [CrossRef] [Green Version]
- Kumar, V.; Dharssi, I. Evaluation and calibration of a high-resolution soil moisture product for wildfire prediction and management. Agric. For. Meteorol. 2019, 264, 27–39. [Google Scholar] [CrossRef]
- Balch, J.K.; Bradley, B.A.; Abatzoglou, J.T.; Chelsea Nagy, R.; Fusco, E.J.; Mahood, A.L. Human-started wildfires expand the fire niche across the United States. Proc. Natl. Acad. Sci. USA 2017, 114, 2946–2951. [Google Scholar] [CrossRef] [Green Version]
- InciWeb. Incident Information System. 2020. Available online: https://inciweb.nwcg.gov/incident/ (accessed on 10 April 2021).
- Eidenshink, J.; Schwind, B.; Brewer, K.; Zhu, Z.-L.; Quayle, B.; Howard, S. A Project for Monitoring Trends in Burn Severity. Fire Ecol. 2007, 3, 3–21. [Google Scholar] [CrossRef]
- California State Geoportal Wildfire Perimeters. California Department of Technology. 2020. Available online: https://gis.data.ca.gov/datasets/f72ebe741e3b4f0db376b4e765728339_0?geometry=-133.004%2C35.454%2C-110.547%2C41.470 (accessed on 10 April 2021).
- National Centers for Environmental Prediction (NCEP), National Weather Service (NWS)/NOAA/U.S. Department of Commerce (DOC). National Center for Atmospheric Research, Computational and Information Systems Laboratory, NCEP North American Mesoscale (NAM) 12 km Analysis. 2021. Available online: https://rda.ucar.edu/datasets/ds609.0/ (accessed on 10 April 2021).
- Bolton, D. The computation of equivalent potential temperature. Mon. Weather Rev. 1980, 111, 1859–1871. [Google Scholar] [CrossRef] [Green Version]
- Gutiérrez, A.; Fovell, R.G. A new gust parameterization for weather prediction models. J. Wind Eng. Ind. Aerodyn. 2018, 177, 45–59. [Google Scholar] [CrossRef]
- Running, S.W. Is global warming causing more, larger wildfires? Science 2006, 313, 927–928. [Google Scholar] [CrossRef] [PubMed] [Green Version]
- Westerling, A.L.; Bryant, B.P. Climate change and wildfire in California. Clim. Chang. 2008, 87, 231–249. [Google Scholar] [CrossRef]
- National Integrated Drought Information System (NIDIS). What Is Soil Moisture? 2021. Available online: https://www.drought.gov/topics/soil-moisture (accessed on 10 April 2021).
- National Weather Service (NWS). Changes to the Surface Wind Gust Speed Calculation in the NAM and DGEX. National Technical Imprementation Notice. 2012. Available online: http://www.nws.noaa.gov/os/notif.htm (accessed on 10 April 2021).
- Abatzoglou, J.T.; Brown, T.J. A comparison of statistical downscaling methods suited for wildfire applications. Int. J. Climatol. 2012, 32, 772–780. [Google Scholar] [CrossRef]
- Carvalho, A.C.; Carvalho, A.; Martins, H.; Marques, C.; Rocha, A.; Borrego, C.; Viegas, D.X.; Miranda, A.I. Fire weather risk assessment under climate change using a dynamical downscaling approach. Environ. Model. Softw. 2011, 26, 1123–1133. [Google Scholar] [CrossRef]
- Keeley, J.E.; Syphard, A.D. Twenty-first century California, USA, wildfires: Fuel-dominated vs. wind-dominated fires. Fire Ecol. 2019, 15, 24. [Google Scholar] [CrossRef] [Green Version]
- Littell, J.S.; Peterson, D.L.; Riley, K.L.; Liu, Y.; Luce, C.H. A review of the relationships between drought and forest fire in the United States. Glob. Chang. Biol. 2016, 22, 2353–2369. [Google Scholar] [CrossRef] [PubMed]
- Walker, X.J.; Rogers, B.M.; Veraverbeke, S.; Johnstone, J.F.; Baltzer, J.L.; Barrett, K.; Bourgeau-Chavez, L.; Day, N.J.; de Groot, W.J.; Dieleman, C.M.; et al. Fuel availability not fire weather controls boreal wildfire severity and carbon emissions. Nat. Clim. Chang. 2020, 10, 1130–1136. [Google Scholar] [CrossRef]
- Littell, J.S.; Mckenzie, D.; Peterson, D.L.; Westerling, A.L. Climate and wildfire area burned in western U.S. ecoprovinces, 1916–2003. Ecol. Appl. 2009, 19, 1003–1021. [Google Scholar] [CrossRef] [PubMed]
- Faivre, N.; Jin, Y.; Goulden, M.L.; Randerson, J.T. Controls on the spatial pattern of wildfire ignitions in Southern California. Int. J. Wildl. Fire 2014, 23, 799–811. [Google Scholar] [CrossRef] [Green Version]
- Yang, J.; He, H.S.; Shifley, S.R. Spatial controls of occurrence and spread of wildfires in the Missouri Ozark Highlands. Ecol. Appl. 2008, 18, 1212–1225. [Google Scholar] [CrossRef] [Green Version]


| Target Wildfires | Burned Area (Acres) | Ignition Date | Extinguished Date | Ignition Latitude | Ignition Longitude |
|---|---|---|---|---|---|
| August Complex Fire | 1,032,648 | 16 August 2020 | 11 November 2020 | 39.776 | −122.673 |
| Ranch Fire | 410,203 | 27 July 2018 | 4 January 2019 | 39.243 | −123.103 |
| Claremont−Bear Fire | 318,935 | 17 August 2020 | 30 November 2020 | 39.691 | −121.227 |
| Hennessey Fire | 317,909 | 17 August 2020 | 2 October 2020 | 38.482 | −122.149 |
| Carr Fire | 229,651 | 23 July 2018 | 30 August 2018 | 40.654 | −122.624 |
| Camp Fire | 153,336 | 8 November 2018 | 25 November 2018 | 39.813 | −121.435 |
| County Fire | 90,288 | 30 June 2018 | 4 January 2019 | 38.806 | −122.182 |
| Kincade Fire | 77,758 | 23 October 2019 | 6 November 2019 | 38.792 | −122.780 |
| Glass Fire | 67,484 | 27 September 2020 | 20 October 2020 | 38.563 | −122.497 |
| Delta Fire | 63,311 | 5 September 2018 | 4 January 2019 | 40.943 | −122.430 |
| Nuns Fire | 56,556 | 8 October 2017 | 9 February 2018 | 38.349 | −122.503 |
| Zogg Fire | 56,338 | 27 September 2020 | 13 October 2020 | 40.539 | −122.567 |
| Walker Fire | 54,612 | 4 September 2019 | 26 September 2019 | 40.061 | −120.681 |
| Atlas Fire | 51,624 | 8 October 2017 | 9 February 2018 | 38.392 | −122.244 |
| River Fire | 48,920 | 27 July 2018 | 4 January 2019 | 39.048 | −123.120 |
| Loyalton Fire | 47,029 | 14 August 2020 | 14 September 2020 | 39.702 | −120.143 |
| Hirz Fire | 46,150 | 9 August 2018 | 4 January 2019 | 40.896 | −122.219 |
| Tubbs Fire | 36,807 | 8 October 2017 | 9 February 2018 | 38.609 | −122.629 |
| Redwood Valley Fire | 36,523 | 8 October 2017 | 9 February 2018 | 39.249 | −123.166 |
| Donnell Fire | 36,450 | 1 August 2018 | 4 January 2019 | 38.349 | −119.929 |
| Slink Fire | 26,759 | 29 August 2020 | 9 October 2020 | 38.568 | −119.568 |
| Gold Fire | 22,634 | 20 July 2020 | 12 August 2020 | 41.110 | −120.923 |
| Helena Fire | 18,709 | 31 August 2017 | 9 January 2018 | 40.760 | −123.100 |
| Pocket Fire | 17,357 | 9 October 2017 | 9 February 2018 | 38.765 | −122.909 |
| Target Wildfires | Burned Area (Acres) | Vapor Pressure Deficit [hPa] | Ratio (%) | Soil Moisture (%) | Ratio (%) | Horizontal Wind Speed (m s−1) | Ratio (%) | Wind Gust Speed (m s−1) | Ratio (%) |
|---|---|---|---|---|---|---|---|---|---|
| August Complex Fire | 1,032,648 | 28.76 | 123.45 | 0.115 | 67.16 | 2.35 | 141.91 | 3.60 | 218.90 |
| Ranch Fire | 410,203 | 25.21 | 112.96 | 0.137 | 78.58 | 2.37 | 120.32 | 3.24 | 161.84 |
| Claremont-Bear Fire | 318,935 | 27.34 | 128.25 | 0.128 | 89.76 | 2.75 | 114.54 | 3.67 | 162.41 |
| Hennessey Fire | 317,909 | 31.17 | 214.30 | 0.122 | 99.15 | 1.62 | 64.70 | 1.67 | 66.23 |
| Carr Fire | 229,651 | 26.22 | 114.09 | 0.128 | 80.25 | 1.80 | 77.49 | 1.55 | 50.18 |
| Camp Fire | 153,336 | 11.42 | 252.97 | 0.121 | 64.04 | 5.12 | 172.54 | 8.16 | 152.36 |
| County Fire | 90,288 | 30.45 | 126.62 | 0.188 | 92.02 | 2.44 | 127.86 | 2.76 | 120.72 |
| Kincade Fire | 77,758 | 27.99 | 362.90 | 0.120 | 84.99 | 3.76 | 255.03 | 6.89 | 364.10 |
| Glass Fire | 67,484 | 20.36 | 158.83 | 0.126 | 81.09 | 2.79 | 163.06 | 4.44 | 215.93 |
| Delta Fire | 63,311 | 22.47 | 130.53 | 0.082 | 69.55 | 2.07 | 87.37 | 2.80 | 86.05 |
| Nuns Fire | 56,556 | 21.79 | 179.27 | 0.207 | 104.24 | 5.34 | 265.42 | 9.62 | 433.16 |
| Zogg Fire | 56,338 | 18.72 | 97.58 | 0.126 | 87.14 | 3.61 | 192.35 | 7.66 | 277.40 |
| Walker Fire | 54,612 | 14.25 | 98.88 | 0.060 | 69.18 | 1.07 | 52.32 | 2.98 | 83.76 |
| Atlas Fire | 51,624 | 21.00 | 153.37 | 0.091 | 99.89 | 6.56 | 311.03 | 11.70 | 484.32 |
| River Fire | 48,920 | 22.27 | 103.62 | 0.130 | 76.56 | 2.22 | 120.12 | 3.22 | 145.82 |
| Loyalton Fire | 47,029 | 16.36 | 97.71 | 0.139 | 83.60 | 3.04 | 131.65 | 3.42 | 121.98 |
| Hirz Fire | 46,150 | 32.66 | 138.43 | 0.116 | 74.06 | 1.54 | 90.28 | 2.04 | 89.34 |
| Tubbs Fire | 36,807 | 21.61 | 164.91 | 0.150 | 102.03 | 4.87 | 261.89 | 9.57 | 456.60 |
| Redwood Valley Fire | 36,523 | 18.69 | 157.03 | 0.142 | 102.73 | 3.20 | 165.77 | 4.70 | 189.12 |
| Donnell Fire | 36,450 | 15.73 | 115.93 | 0.192 | 89.38 | 2.55 | 107.80 | 2.66 | 96.35 |
| Slink Fire | 26,759 | 13.88 | 100.15 | 0.197 | 101.51 | 2.76 | 97.79 | 2.49 | 53.16 |
| Gold Fire | 22,634 | 24.28 | 147.03 | 0.160 | 99.82 | 2.49 | 97.92 | 2.96 | 79.28 |
| Helena Fire | 18,709 | 29.55 | 191.36 | 0.126 | 107.71 | 1.72 | 99.48 | 1.75 | 70.85 |
| Pocket Fire | 17,357 | 15.36 | 127.74 | 0.138 | 99.03 | 1.38 | 82.84 | 1.73 | 83.47 |
| Target Wildfires | Burned Area (Acres) | MDI (hPa) | Ratio (%) | MDIWIND (hPa m s−1) | Ratio (%) | MDIGUST (hPa m s−1) | Ratio (%) |
|---|---|---|---|---|---|---|---|
| August Complex Fire | 1,032,648 | 251.12 | 181.75 | 689.41 | 258.95 | 1163.61 | 449.75 |
| Ranch Fire | 410,203 | 184.43 | 142.60 | 449.78 | 161.64 | 627.40 | 226.94 |
| Claremont-Bear Fire | 318,935 | 213.80 | 141.52 | 584.40 | 162.45 | 883.62 | 250.60 |
| Hennessey Fire | 317,909 | 254.67 | 212.94 | 363.33 | 108.10 | 413.25 | 114.27 |
| Carr Fire | 229,651 | 205.12 | 143.08 | 398.40 | 118.64 | 342.16 | 74.75 |
| Camp Fire | 153,336 | 94.19 | 378.28 | 468.40 | 839.02 | 772.60 | 1021.12 |
| County Fire | 90,288 | 161.62 | 133.22 | 448.32 | 189.40 | 505.13 | 177.86 |
| Kincade Fire | 77,758 | 234.25 | 402.39 | 893.63 | 991.89 | 1665.33 | 1667.50 |
| Glass Fire | 67,484 | 161.90 | 192.95 | 527.13 | 322.17 | 910.47 | 464.44 |
| Delta Fire | 63,311 | 274.03 | 186.33 | 630.44 | 186.15 | 901.47 | 191.67 |
| Nuns Fire | 56,556 | 105.47 | 173.97 | 563.86 | 372.21 | 986.66 | 600.56 |
| Zogg Fire | 56,338 | 148.61 | 104.98 | 505.38 | 190.91 | 1113.06 | 334.52 |
| Walker Fire | 54,612 | 236.66 | 130.07 | 301.53 | 72.79 | 898.50 | 131.15 |
| Atlas Fire | 51,624 | 230.13 | 154.21 | 1520.95 | 419.85 | 2593.35 | 645.94 |
| River Fire | 48,920 | 171.85 | 134.49 | 431.45 | 160.31 | 592.11 | 217.68 |
| Loyalton Fire | 47,029 | 117.70 | 113.74 | 447.49 | 154.31 | 529.74 | 144.75 |
| Hirz Fire | 46,150 | 280.96 | 185.98 | 469.02 | 182.74 | 585.65 | 172.26 |
| Tubbs Fire | 36,807 | 143.71 | 163.51 | 690.65 | 350.05 | 1294.55 | 597.46 |
| Redwood Valley Fire | 36,523 | 131.60 | 153.87 | 430.17 | 253.28 | 622.89 | 308.12 |
| Donnell Fire | 36,450 | 81.94 | 128.24 | 243.79 | 135.24 | 256.76 | 122.56 |
| Slink Fire | 26,759 | 70.62 | 98.04 | 201.82 | 104.37 | 196.66 | 53.50 |
| Gold Fire | 22,634 | 151.42 | 147.51 | 458.43 | 151.44 | 502.67 | 120.39 |
| Helena Fire | 18,709 | 234.68 | 174.20 | 413.19 | 146.12 | 483.70 | 125.54 |
| Pocket Fire | 17,357 | 111.48 | 130.10 | 195.27 | 115.54 | 231.50 | 114.92 |
| MDI (hPa) | MDIWIND (hPa m s−1) | MDIGUST (hPa m s−1) | |
|---|---|---|---|
| 1. Average value for wildfires > 50,000 acres (standard deviation) | 196.86 (55.83) | 596.07 (304.8) | 984.04 (573.22) |
| 2. Average value for wildfires < 50,000 acres (standard deviation) | 149.60 (65.52) | 398.13 (150.0) | 529.62 (312.32) |
| Ratio of increase from 2 to 1 (%) | 31.6 | 49.7 | 85.8 |
| p-value in the difference between 1 and 2 | p = 0.082 | p = 0.048 | p = 0.021 |
Publisher’s Note: MDPI stays neutral with regard to jurisdictional claims in published maps and institutional affiliations. |
© 2021 by the authors. Licensee MDPI, Basel, Switzerland. This article is an open access article distributed under the terms and conditions of the Creative Commons Attribution (CC BY) license (https://creativecommons.org/licenses/by/4.0/).
Share and Cite
Hiraga, Y.; Kavvas, M.L. Hydrological and Meteorological Controls on Large Wildfire Ignition and Burned Area in Northern California during 2017–2020. Fire 2021, 4, 90. https://doi.org/10.3390/fire4040090
Hiraga Y, Kavvas ML. Hydrological and Meteorological Controls on Large Wildfire Ignition and Burned Area in Northern California during 2017–2020. Fire. 2021; 4(4):90. https://doi.org/10.3390/fire4040090
Chicago/Turabian StyleHiraga, Yusuke, and M. Levent Kavvas. 2021. "Hydrological and Meteorological Controls on Large Wildfire Ignition and Burned Area in Northern California during 2017–2020" Fire 4, no. 4: 90. https://doi.org/10.3390/fire4040090