Article

Ignition of Fuel Beds by Cigarettes: A Conceptual Model to Assess Fuel Bed Moisture Content and Wind Velocity Effect on the Ignition Time and Probability

1
Department of Mechanical Engineering, University of Coimbra, ADAI, Rua Luís Reis Santos, Pólo II, 3030-788 Coimbra, Portugal
2
Institute of Geography and Spatial Planning, Rua Branca Edmée Marques, Cidade Universitária, 1600-276 Lisboa, Portugal
3
Department of Fire Safety Engineering, Jeonju University, Jeonju 55069, Korea
4
International Institute for Applied Systems Analysis (IIASA), A-2361 Laxenburg, Austria
*
Author to whom correspondence should be addressed.
Submission received: 1 June 2021 / Revised: 21 June 2021 / Accepted: 29 June 2021 / Published: 6 July 2021
(This article belongs to the Special Issue Advances in the Measurement of Fuels and Fuel Properties)

Abstract

:
A conceptual model based on the balance of energy in a system composed of a burning cigarette, ambient flow and a porous fuel bed is proposed to study the burning of a single cigarette and the process of fuel bed dehydration, pyrolysis and its eventual ignition or combustion extinction. Model predictions of time to ignition and of the probability of ignition as a function of fuel bed moisture content and ambient flow velocity are compared with results obtained in laboratory ignition tests of straw fuel beds for various ambient conditions. According to this study, the main parameters influencing the models developed are the fuel bed and tobacco moisture content, as well as the flow velocity.

1. Introduction

Cigarettes have always been listed among the various human-related causes of forest fires in practically all fire-prone countries. Although not all cigarettes that are thrown into potential fuels recipients produce ignitions, there are many fire events that were reportedly initiated by cigarettes [1]. For example, in Portugal, some highway fires started by cigarettes thrown out by careless drivers have been observed and reported on several occasions [2]. Even if the probability of having a fire ignition may be low, the fact that there are many realizations of throwing still burning cigarettes into fine fuels, the possibility of having cigarette caused fires is sufficiently high to justify its prohibition in many countries. The data presented in Table 1 summarizing fire events caused by smoking activities indicate that the wildfire ignition probability due to smoking activity, including cigarette dropping, in various parts of the World cannot be neglected.
A review of publications dealing with the problem of forest fires ignition by cigarettes is given below. References [7,8] reports partially results from extensive research on fire starting capability of cigarettes, namely cigarette burning temperatures and combustion rates for a large number of cigarette brands and of ignition laboratory tests with cigarettes dropped on a fuel sample consisting of fine, medium or coarse particles with various orientations in relation to wind flow of 0.7 or 1.3 m.s−1 and fuel moisture content values ranging from 1.8 to 14.7%. Reference [9] studied the probability of ignition of fires by cigarette butts in laboratory and field conditions for various fuel bed types and moisture ranges. This author stated that the probability of ignition increased when fuel moisture decreased, or when ambient wind increased from 0 to 1 m.s−1 or when the degree of contact between the burning part of the cigarette and fuel bed particles increases. Reference [10] performed field tests to assess the probability of ignition of various fuels by cigarettes and found that atmospheric conditions and moisture were very important, concluding that the probability of having cigarette-caused fires was very low and that possibly its importance was overestimated. Reference [11] studied the effect of wind near the ground on the displacement of a cigarette. In the scope of project Fire Paradox [12] ignition of various types of fuels by cigarettes was analysed among several other ignition sources. Reference [6] performed a large number of tests with cigarettes placed on two types of fuel beds in the presence of wind and proposed a model of ignition of foliage by a cigarette. Reference [13] performed a very extensive experimental study on the ignition of Mongolian Oak Leaves fuel beds by cigarette buds, looking in particular at the role of fuel moisture content, packing ratio and wind velocity on the probability of ignition. They found that the packing ratio of the fuel bed had a small influence and that there were no ignitions in the FMC was above 15%. They also found a non-monotonic dependence on the wind velocity, with the probability of ignition being larger for a given range of values of the flow velocity above the fuel bed. These authors propose two statistical models to estimate the probability of ignition of the fuel bed as a function mainly of the flow velocity and FMC. They found that the self-built model performs better than the logistic model.
Some countries adopted regulations to impose the use of cigarettes with Lower Ignition Propensity (LIP) or reduced ignition propensity (RIP) as recommended by [1,14,15] so the present study started as a comparative analysis of LIP cigarettes and the other cigarettes without the reduced propensity (N/LIP). Combustion of single cigarettes under various environmental conditions was analysed and the ignition process of straw fuel beds was studied quite extensively. Contrary to other authors like [7,9] we consider an ignition of the fuel bed only when sustained flaming combustion was attained. A conceptual model based on the balance of energy in a system composed of the burning cigarette, ambient flow and the porous fuel bed to study the process of fuel bed dehydration, pyrolysis and eventual ignition or extinction is proposed. The model is used to estimate time and the probability of ignition as a function of wind flow and fuel bed moisture content. Laboratory experimental data were used to develop and validate the proposed model.
Although cigarettes can be considered an important potential source of ignition to justify the present study it is felt that the proposed approach can be extended to other types of burning particles like embers produced during a fire, landing on a fuel bed with similar characteristics.

2. Physical Processes and Conceptual Model

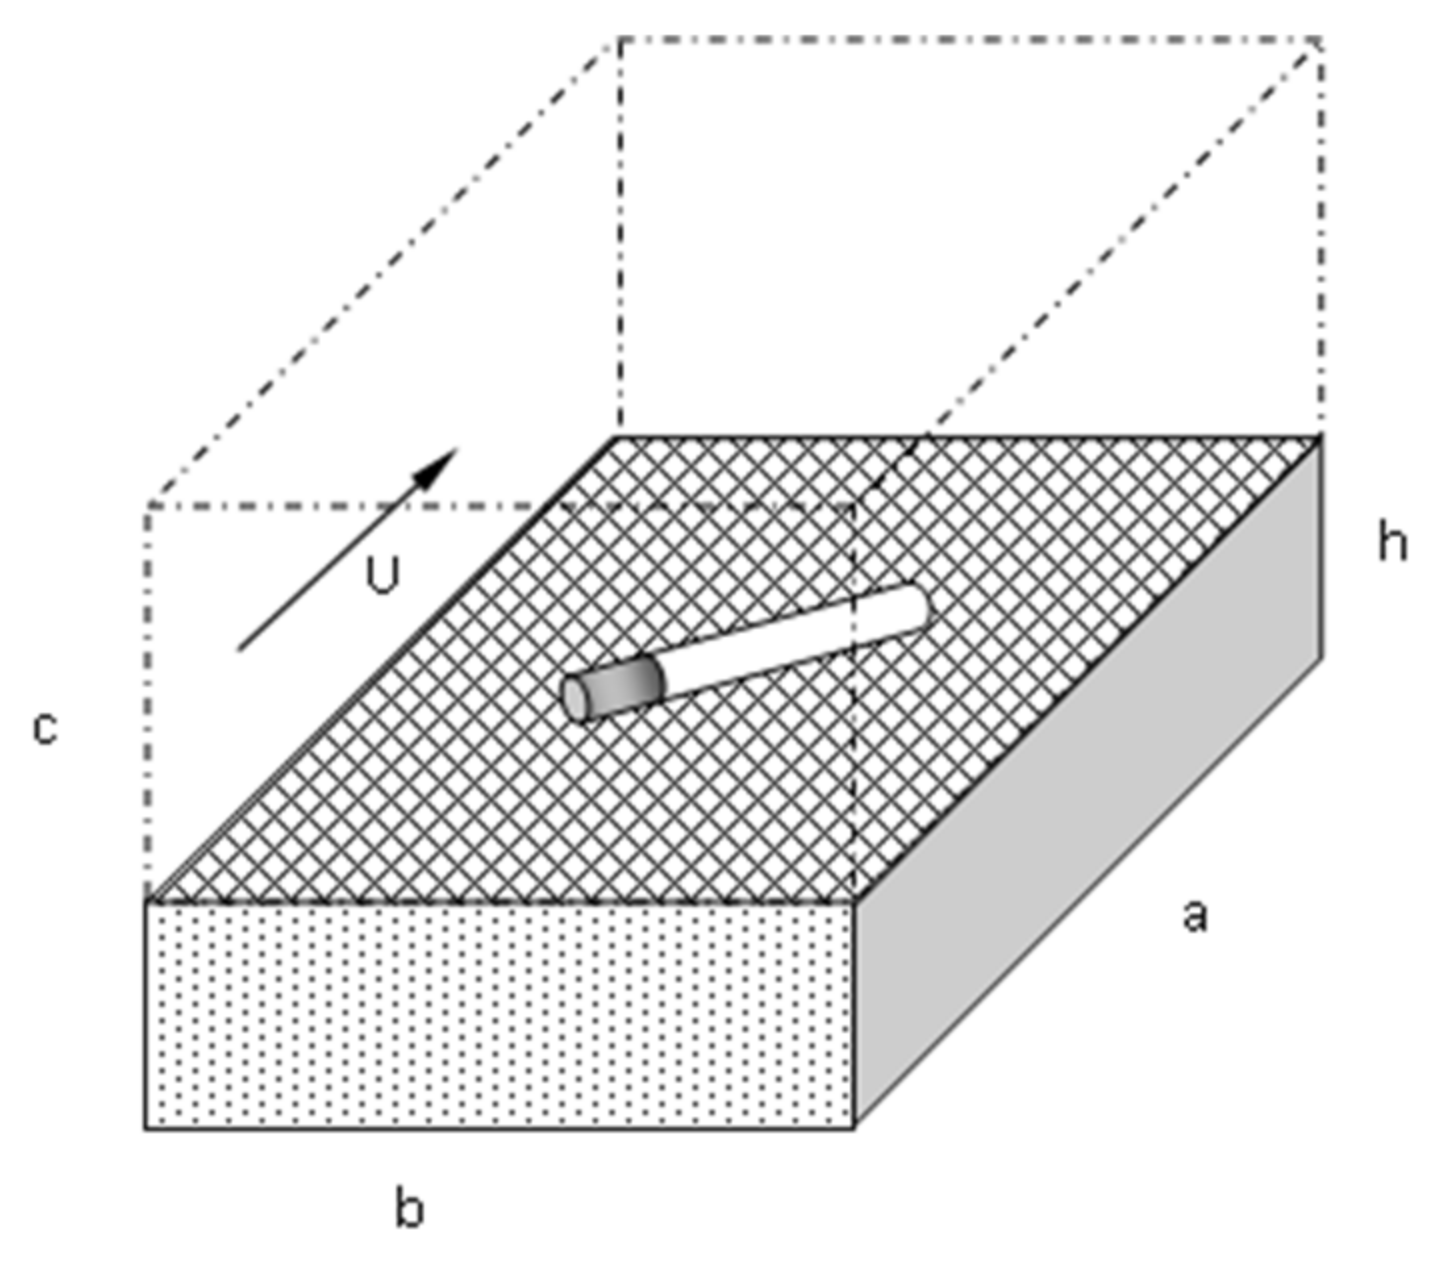
2.1. Definition of the Problem

Let us consider a cigarette burning without suction placed above or inside a fuel bed composed of grass, litter or foliage that is exposed to a wind flow with a characteristic velocity U.
For the sake of simplicity, we assume that the fuel bed is placed over a flat horizontal surface and that the fuel bed in the area of analysis is homogeneous and uniform.
In Figure 1, we consider a control volume that contains the cigarette, ambient air and the fuel bed. Its dimensions—a*b*c—are left unspecified but are considered to be sufficiently large to satisfy the conditions given below. This volume is limited by the ground that is considered an adiabatic wall with no transfer of energy; the same happens to the four vertical walls of the control volume assuming that no heat is transferred across these walls to adjacent fuel or air. As a consequence, the main transfer of enthalpy between the volume and its surrounding is performed through its upper horizontal wall.
We consider also that all boundary conditions remain uniform and constant throughout the duration of the process. As the ignition process may take several minutes some properties may change even in controlled laboratory conditions. For example, it was observed that fuel bed moisture content changed during tests that lasted for several minutes in days of high values of ambient humidity. In real conditions, it could rain or the wind velocity might vary during the process which would change the initial test conditions. In our study, we exclude such changes or if they occur, we take the average values of the control parameters.
In this paper, we use mainly MKS or CGS units but for convenience, some parameters are given in millimetre (mm) or in milligram (mg) as units of length or mass respectively.

2.2. Physical Processes of Cigarette Burning and Fuel Bed Ignition

We consider the following physical process that may lead to the ignition of the fuel bed by a burning cigarette, in order to estimate the probability of having a successful ignition:
  • The global energy balance of the system described above;
  • The process of burning of an individual cigarette without suction or puffing, in various positions, under the influence of a flow of varying velocity and direction;
  • The heating of a portion of the fuel bed by a cigarette, producing its dehydration (Phase 1); after this process, we have either process 4 or 5:
  • Process of cigarette or fuel bed combustion extinction (Phase 2a);
  • Process of pyrolysis and partial combustion of the fuel bed leading to its ignition as flaming combustion (Phase 2b).

2.3. Energy Balance

The rate of change of total enthalpy inside the control volume is given by the following equation:
d E G d t = E G ˙ = V c E t . d V + S c . d S = E ˙ C E ˙
In this equation, the volume integral corresponds to the change of energy due to cigarette and fuel bed combustion E ˙ C while the second term E ˙ is the net flux of energy ∅ through the surface of the control volume.
The energy of combustion E C ˙ in the control volume is essentially positive and is associated with the energy that is released by the cigarette and eventually by the fuel bed combustion.
Supported by experimental results shown below, we assume that it has a linear dependence on wind velocity as:
E ˙ C = V c E t . d V = a c + b c . U
The heat fluxes E ˙ in Equation (1) are due both to radiation E ˙ r and to convection E ˙ u .
E ˙ = E ˙ r + E ˙ u
The radiation flux is given by the net flux of solar radiation as that is positive during daytime if the fuel bed is exposed to sunshine and by a heat loss br from the high-temperature reaction zone to the environment:
E ˙ r = a s b r
The flow produced by wind with a characteristic velocity U over the fuel bed has the character of a turbulent boundary layer. This flow is well characterized by the wall shear stress τw that it produces on the top of the fuel bed and is associated with heat and mass transfer between the flow and the fuel bed [16]. By definition, τw is proportional to uτ2, the so-called friction velocity that is a characteristic velocity of the boundary layer [16]. We can consider that U is proportional to uτ and therefore the convective heat transfer will be given by:
E ˙ u = a u . U 2
Replacing these terms in Equation (1) the overall energy balance will be:
E G ˙ = a c + b c . U + a s b r a u . U 2
Combining the terms of Equation (5) that do not depend explicitly on wind velocity we can write:
a G = a c + a s b r
And
E G ˙ = a G + b c . U a u . U 2
According to this equation, the energy balance is a non-monotonic function of wind velocity and has a maximum value for:
d E G ˙ d U = b c 2 . a u . U = 0 U 1 = b c 2 . a u
Some authors like [9] assume that low-frequency fluctuations of flow velocity, like those created by passing vehicles at the border of a motorway, can be beneficial to fuel bed ignition. In the present study, such fluctuations are not considered.
We assume that there exists a critical value of the flow velocity Uc above which the cooling of the combustion zone is sufficient to extinguish combustion reaction either at the cigarette tip or in the fuel bed. Our experimental results seem to support this assumption although we cannot generalize it.

2.4. Cigarette Burning

In the first step, we shall analyse the burning of a cigarette in a steady-state regime without interacting with the fuel bed. According to Figure 2a, a normal cigarette is composed of a filter and a cylinder of special paper filled with tobacco with the dimensions indicated in the figure.
The total mass of the cigarette is given by:
M C = M F + M T
In this study, we consider that the filter, with a mass MF, is incombustible. The mass of tobacco MT includes the paper envelope that is considered here as having the same combustibility properties as the tobacco itself [17]. Tobacco contains moisture x T   that can be defined by:
x T = M T M T s M T s
In this equation, M T s is the dry mass of the tobacco fraction. Assuming that the tobacco is evenly distributed in the cigarette volume we can define the following two “densities”.
-
Apparent density (tobacco mass per unit volume) ρT, given by:
ρ T = M T V c = 4 . M T π . d 2 . T
-
Linear density (tobacco mass per unit length) γT, given by:
γ T = M T T
The value of γ T for some cigarettes that were tested was around 0.066 g.cm−1. If the cigarette is burning at a constant rate, we can characterize this process either by a mass loss rate m T ˙ (g.s−1) or by a rate of advance R c (cm.s−1) of the glowing front.
m T ˙ = d M T d t
R c = d T d t = 1 γ T . d M T d t = T M T . m T ˙
The energy released by the cigarette combustion is then given by:
E ˙ c = m T ˙ . H T
In this equation HT (J/g) is the combustion yield of tobacco (15.74 J.g−1 according to [17]). A typical value of Rc was of the order of 0.01 cm.s−1 and so E ˙ c is of the order of 0.01 J.s−1. It is noted that the presence of ashes may limit the access of oxygen to the reaction zone and therefore may affect the value of Rc. As this parameter was not controlled during our experiments, we shall not consider its effect on the combustion rate.
Assuming that the cigarette with a length T burns entirely (excluding the filter) the maximum duration of its combustion will be:
t c = T R c
In the general case for a given type of cigarette, the combustion rate R c for a single cigarette without puffing will depend on the following parameters:
R c = f x T ,   U ,   α ,   φ
In this equation, α is the inclination of the cigarette with the horizontal datum (Figure 2b) and φ the angle between the flow velocity and the axis of the cigarette (Figure 2c). The role of these parameters will be discussed below.

2.5. Fuel Bed Properties

The fuel bed is considered a porous solid fuel composed of a single layer of homogeneous dead fine particles that are either standing like herbaceous leaves or laying on the ground, as litter composed of twigs or dead leaves. The fuel bed can be characterized by its height hf (cm), its load (on dry basis) Mf (g.cm−2), its porosity and the average value of the surface to volume ratio of its particles. For example, [8] found that reduced fuel bed height increased the probability of ignition. In the present study, these properties will be considered constant.
Two very important properties of fuel particles are their temperature and moisture content x expressed as a fraction of dry weight. This aspect may be relevant for fuel beds exposed to sunlight which can reach temperatures much above ambient air temperature. In this study, we shall assume that the initial temperature of the fuel particles is the same as the ambient air and only x is left as a variable parameter.
Phase 1: Heating and Dehydration
Assuming that the burning zone of the cigarette is in contact with the fuel bed, part of the released heat will affect a mass m1 of the fuel. The amount of “effective” mass m1 affected by the cigarette will depend on the position of the cigarette in relation to the fuel bed and on its contact with the fuel particles. A cigarette dropped on the top of a foliage layer will affect less mass than one that is placed somehow in the middle or at the bottom of the fuel bed, surrounded or even covered by fuel particles. In the present study, we do not investigate these conditions as in the experimental program the cigarettes were only placed on the top of the fuel bed and no other conditions were tested.
In this phase, the fuel mass m1 will undergo a temperature increase from its initial value T o (ambient temperature) to a value of the order of water ebullition temperature ( T w = 373 K). The energy E 1 that is required in this phase is given by:
E 1 = 0 t 1 E G ˙ 1 . d t = m 1 . C p . T w T o + x . H w
According to [17], the values of C p and H w are respectively of the order of 2.5 J.g−1.K−1 and 2445 J.g−1. We define Δ T w as:
Δ T w = T w T o
Assuming an ambient temperature of 20 °C (293 K) we have Δ T w 80   K . The energy flux that appears in this equation is a fraction or part of the energy E G ˙ released by the combustion of the cigarette available in the control volume. Due to water evaporation, the combustion reaction may be affected by the emitted water vapour to the point that it may even be extinguished.
First, we shall neglect the damping effect and assume that the energy release rate is constant. This corresponds to a situation in which the cigarette is burning with very small interaction with the fuel bed. In these conditions of constant heat flux, the duration t o 1 of Phase 1 is given by:
t o 1 = m 1 . C p . Δ T w + x . H w E G ˙
Using the average values that were given above we can estimate the order of magnitude of the terms in Equation (20). We obtain that:
t o 1 100 × m 1 × 200 + x × 2445 s
Experimental values of to1 are in the range of 100 to 500 s. For a value of x = 0.1, Equation (21) provides a value of m1 in the range of 0.005 to 0.02 g which indicates that the “effective” mass of fuel affected in this phase is quite small. We shall use the value of to1 as a reference since by principle t1to1. In order to simplify, we assume that the moisture damping effect on the flux of energy is given by the following function:
E G ˙ 1 = 1 α o . t . E G ˙
The damping coefficient α o will depend on the level of fuel moisture content x. Assuming that there is a critical value x1 above which no ignition is possible we propose the following dependence between these two parameters:
α o = x x 1 α 2 = α 1 . x α 2 = 1 t o e
The parameter α o is the inverse of a reference time of extinction t o e that, according to the present model, corresponds to the extinction of the combustion due to moisture damping ( E G ˙ 1 = 0 ) . The parameters of Equation (23) must depend on each pair fuel bed/cigarette, in the sense that for a given fuel bed, type of cigarette and contact conditions, the parameters α 1 , α 2 and x 1 should be the same. Replacing these functions in Equation (18) and integrating, we obtain:
0 t 1 1 α 1 . x α 2 . t . E G ˙ . d t = t 1 α 1 . x α 2 2 . t 1 2 . E G ˙ = m 1 . C p . Δ T w + x . H w
Solving this equation in order to t 1 and using the definitions given by (20) and (23) we obtain the following two solutions for the duration of the dehydration period:
t 1 = t o e . 1 ± 1 2 . t o 1 t o e
Only the negative sign solution is valid and therefore we retain that:
t 1 = t o e . 1 1 2 . t o 1 t o e
Phase 2a: Combustion extinction
It is observed that in several cases the combustion process finishes before reaching the stage of fuel bed ignition. We analyse this situation here because it tends to occur basically during or at the end of Phase 1—heating and dehydration—although sometimes it may occur at the beginning of Phase 2b—pyrolysis and ignition.
We consider two forms of combustion extinction: (i) Primary extinction, due to cigarette burnout and (ii) Secondary extinction, due to moisture damping effect, either from the cigarette or from the fuel bed.
(i) Primary extinction
For a cigarette of a given length burning at a constant rate Rc, the time t c for its extinction due to burnout is given by Equation (16). If t c is smaller than t 1 then the fuel bed ignition will not occur and so t e   =   t c .
(ii) Secondary extinction
When water vapour is released from the fuel bed it may contribute to reducing the combustion reaction of the cigarette by cooling and in the limit to extinguish it. This process will occur more probably near the end of Phase 1, when water vapour release is more intense. This is observed in the tests by the release of white smoke that precedes extinction or eventual ignition.
Combustion extinction corresponds to a negative ignition test in which the cigarette did not start a new fire under the given circumstances. Although extinction was observed in a large number of cases, we do not have enough information to propose a detailed model for combustion extinction. Based on the considerations that were made, we will assume that t o e t 1 . This problem will be discussed more in detail below when presenting the experimental results.
Phase 2b: Pyrolysis and Ignition
In this phase, we consider that the effective mass m 2 of fuel involved in the process of fuel bed ignition is dry and that part of it begins to ignite although its overall average temperature is below the critical temperature for ignition with flaming combustion. The energy required in Phase 2b will be:
E 2 = t 1 t i E G ˙ 2 . d t = m 2 . C p . T i T w
We define the duration t 2 of Phase 2b by:
t 2 = t i t 1
The limits of integration in Equation (27) will then become:
E 2 = 0 t 2 E G ˙ 2 . d t
We define Δ T i as:
Δ T i = T i T w
Assuming an ignition temperature of 500 °C we have Δ T i 400   K . Given the involvement of an increasing fraction of fuel bed particles in the combustion process, the available flux of energy for ignition will change in the course of time.
As we did in the analysis of Phase 1, we shall consider a reference process in which the heat flux released by the cigarette is constant and that no additional fuel is involved in the combustion process before fuel bed ignition. In these conditions the reference duration t o 2 of Phase 2a is given by:
t o 2 = m 2 . C p . Δ T i E G ˙
This value is used as a reference as in principle we have t2to2. The form of involvement of fuel particles in the combustion process must be better studied. However, as a first approach, we propose a linear increase of the energy flux with time. This assumption is based on the experimental results obtained in ignition tests in which a constant fuel bed mass loss rate is achieved in many cases.
Accordingly, we propose that:
E G ˙ 2 = β . E G ˙ = 1 + β 1 . t . E G ˙
Replacing these definitions in Equation (27) we get:
0 t 2 1 + β 1 . t . d t = t o 2
t 2 + β 1 2 . t 2 2 t o 2 = 0
The relevant solution of this equation yields the value of t2:
t 2 = 1 β 1 1 + 2 . β 1 . t o 2 1
Introducing the definition:
t i 2 = 1 β 1
Equation (35) can be written as:
t 2 = t i 2 . 1 + 2 . t o 2 t i 2 1

2.6. Time to Ignition

The total duration of the process of ignition of the fuel bed is given by:
t i = t 1 + t 2 = t o e . 1 1 2 . t o 1 t o e + t i 2 . 1 + 2 . t o 2 t i 2 1
This equation can be written in an explicit form as:
t i = x 1 x α 2 . 1 1 2 . m 1 . C p . Δ T w + x . H w a G + b c . U a u . U 2 . x 1 x α 2 + 1 β 1 . 1 + 2 . β 1 . m 2 . C p . Δ T i a G + b c . U a u . U 2 1
In principle, the value of ti has no upper limit. Although in our experimental program it was always below 15 min. In [6], values greater than 20 min for ignition delay were reported.
It is well known that a smoldering fire can remain active for days or weeks and rekindle as a flaming fire even several days after it was initiated. For example, in Tavira (Portugal) a burning tree in the area of a large fire extinguished on the 23 July 2012 rekindled as a flaming fire on the 12th September almost fifty days later [18]. Although this particular ignition is not related to a cigarette it illustrates the potential of glowing fires to remain active for very long periods before initiating a flaming fire.

2.7. Probability of Ignition

At this stage, we consider the aspects related to the possibility of having a successful ignition. Given the large number of influencing parameters, the ignition process can be considered stochastic. Indeed, even in the controlled conditions of laboratory experiments, a large dispersion of ignition results is observed even in nominally similar conditions. As the present study is centred on the analysis of the role of wind velocity and fuel bed moisture content on the probability of ignition, we shall deal with the parameters that are more relevant in this process.
Thus, according to the previous description, we consider the following possibilities of non-ignition of the fuel bed by the cigarette:
  • Fuel bed moisture content—we assume that there is a critical value x1 above which ignition is not possible because of the damping caused by fuel moisture that will extinguish the cigarette.
  • Wind velocity—we assume that there is a critical value Uc above which cigarette combustion will be extinguished and therefore ignition is not possible.
  • Cigarette burnout—as was explained above cigarette combustion may be extinguished before the dehydration process is concluded corresponding to t 1 > t c and therefore ignition will not occur.
  • Moisture damping—water vapor released during the dehydration and pyrolysis processes may damp or even extinguish cigarette or fuel bed combustion hampering fuel bed ignition. In this case, we have t 1 > t e .
We assume that the longer it takes for ignition to occur there are more possibilities of having perturbations that may interfere with the ignition process and eventually suppress it. Therefore, we propose that the probability of ignition is inversely proportional to the ignition time:
P i = k t i
According to this definition, we consider that each condition that necessarily leads to no ignition corresponds to a value of t i = . We summarize ignition conditions, which correspond to a probability of ignition different from zero as:
P i 0   t i x x 1 U U c t 1 t c t 1 t e
If any of the previously defined conditions are not fulfilled the probability of ignition is considered to be zero. It must be held in mind that the above conditions are necessary but not sufficient to have a successful ignition. We can eventually express the probability of ignition as a conditional probability, provided that the above four conditions are fulfilled.

3. Materials and Methods

An extensive experimental program was carried out by the authors, with more than 400 cigarettes being tested, with the measurement of several control and output parameters. As the experiments were carried out in parallel with model development and the test equipment was not available in all phases of the experiments, some parameters were not measured in all cases. For this reason, in spite of a large amount of w produced we consider that our experimental program is preliminary as it was oriented mainly to support the development and validation of the proposed model, leaving many aspects to be explored.

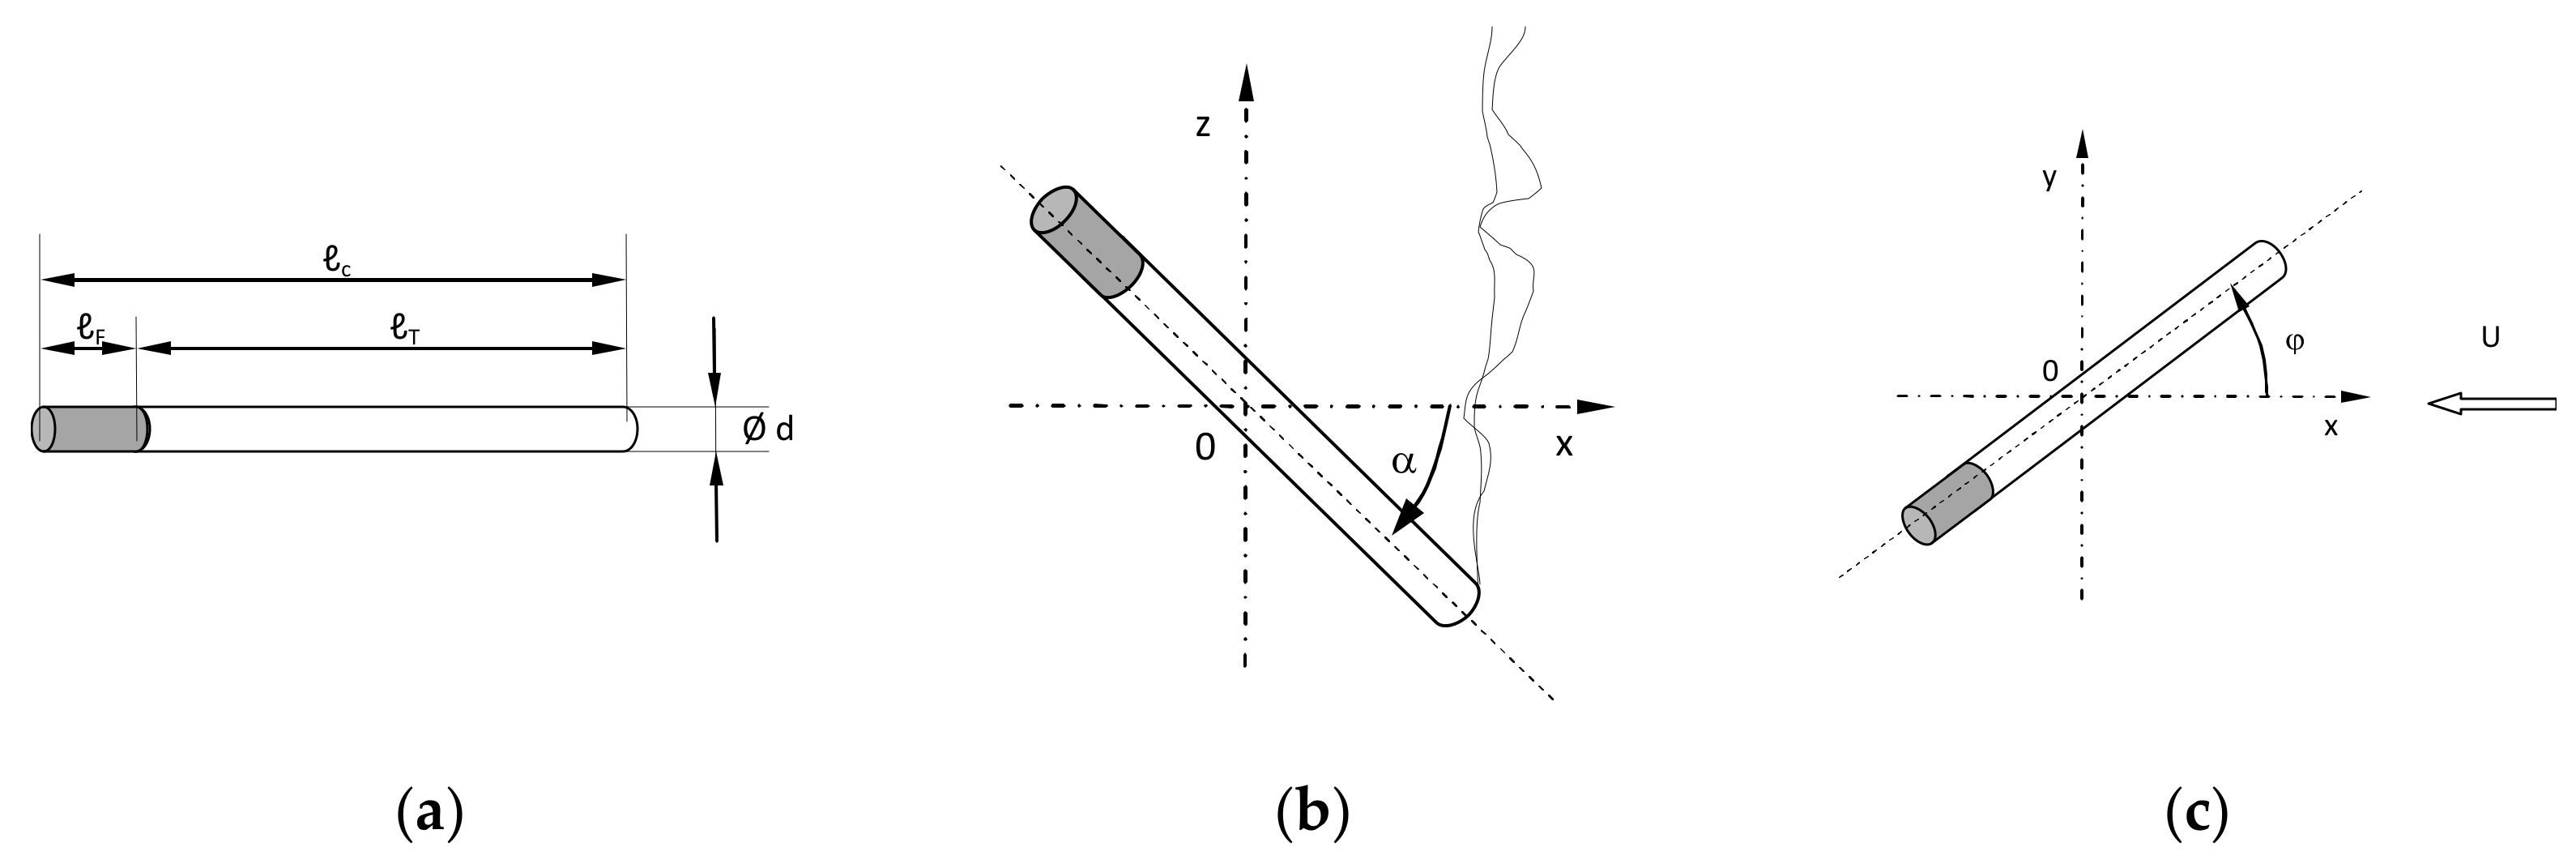
3.1. Cigarette Properties

In the present experimental program, two types of cigarettes were tested: with and without Lower Ignition Propensity (LIP and N/LIP) treatment. Given the reduced number of tests performed with N/LIP cigarettes, we consider that the comparative results presented below are only partial. In some experiments, cigarette butts were tested as well; these were obtained from new cigarettes that were cut in order to obtain a shorter cigarette. The following brands were used in our tests: Fortuna (LIP and N/LIP), Elixyr (LIP) and Winston (LIP).
The average properties of the tested cigarettes are given in Table 2. Relevant parameters of tests with single cigarettes and of ignition tests are given in Table 3 and Table 4.

3.2. Rate of Combustion

Tests to evaluate the rate of combustion of single cigarettes without sucking were performed in a wind tunnel (TC1) at the Forest Fire Research Laboratory of the University of Coimbra (ADAI). This device was described in [16] and consists of a channel open on its top that is 1.75 m long, 0.55 m wide and 0.50 m high. The flow velocity that could increase up to 5 m.s−1 was measured with a hot-film anemometer Flow Master (Dantec) Type 54 N 62 with a precision of ±0.05 m.s−1.
In these tests, cigarettes were placed on a support at the centre of the combustion tunnel with a pre-defined angle in relation to flow direction (Figure 2c), above). Length rate of combustion was measured counting the time needed to burn marks made at 5 mm or 10 mm intervals on the cigarettes.
The mass loss was obtained by use of an electronic AND GX3000 balance with a precision of 0.01 g in no wind conditions for a cigarette placed at various inclination angles in relation to a horizontal plane (Figure 2b), above).

3.3. Ignition Tests

Ignition tests were performed by lighting a cigarette and letting it burn for a few seconds and then placing it on a fuel bed composed of dry straw. The characteristics of these tests are presented in Table 4. The fuel bed, with a load of 0.6 kg.m−2 and an average height of 5.2 cm, was placed at the centre of the combustion tunnel. The horizontal dimensions of the fuel bed were 20 × 33 cm2. The Fuel Moisture Content (FMC) was measured in each test in an AND Model Mf-50 Balance with an error below 1%. The FMC values were in the range 0.05 < x < 0.15.
As found by several authors namely [6,9], the contact between the cigarette and the fuel bed is of great importance in the process of ignition. In order to minimize the uncertainty associated with the process of throwing randomly the cigarette on the fuelbed, the procedure of placing the cigarette with its burning end contacting, but not inside, the fuel bed was adopted
The time delay to ignition ti or to extinction te was measured when it occurred. Photos were taken and most tests were recorded using a video camera Sony Handycam DCR-68HD and an infrared camera FLIR Systems model SC 640.

4. Results and Discussion

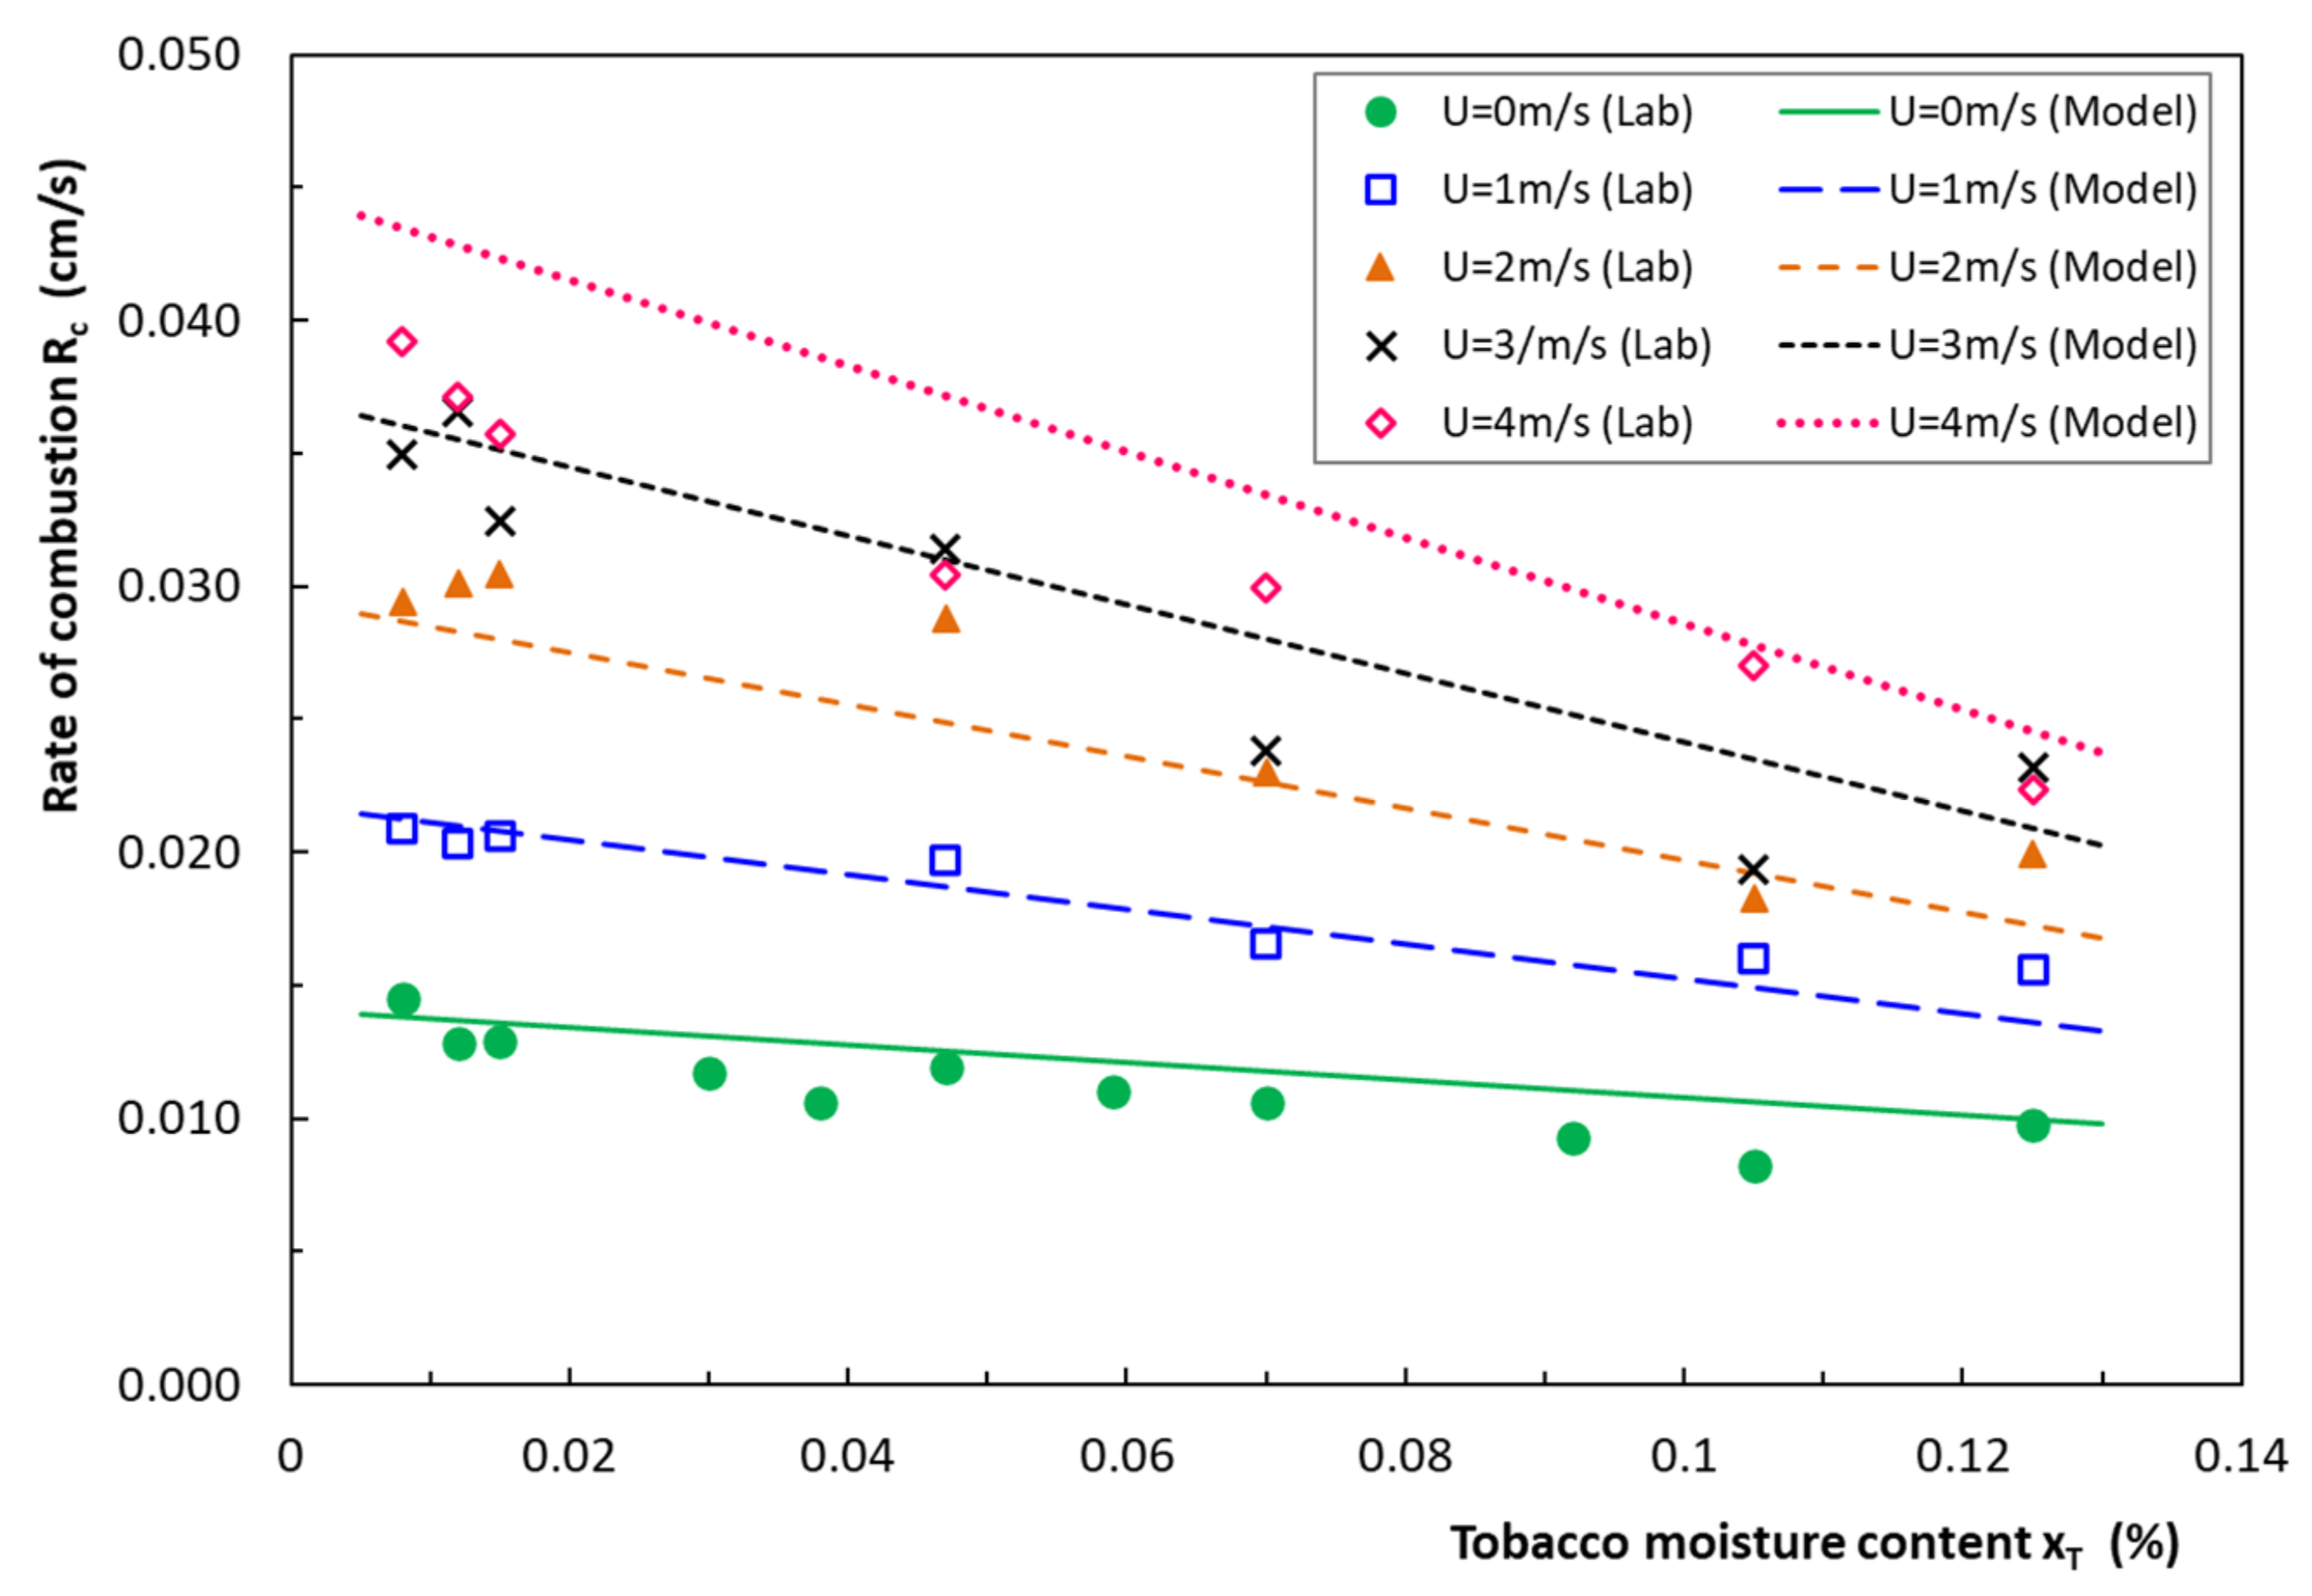
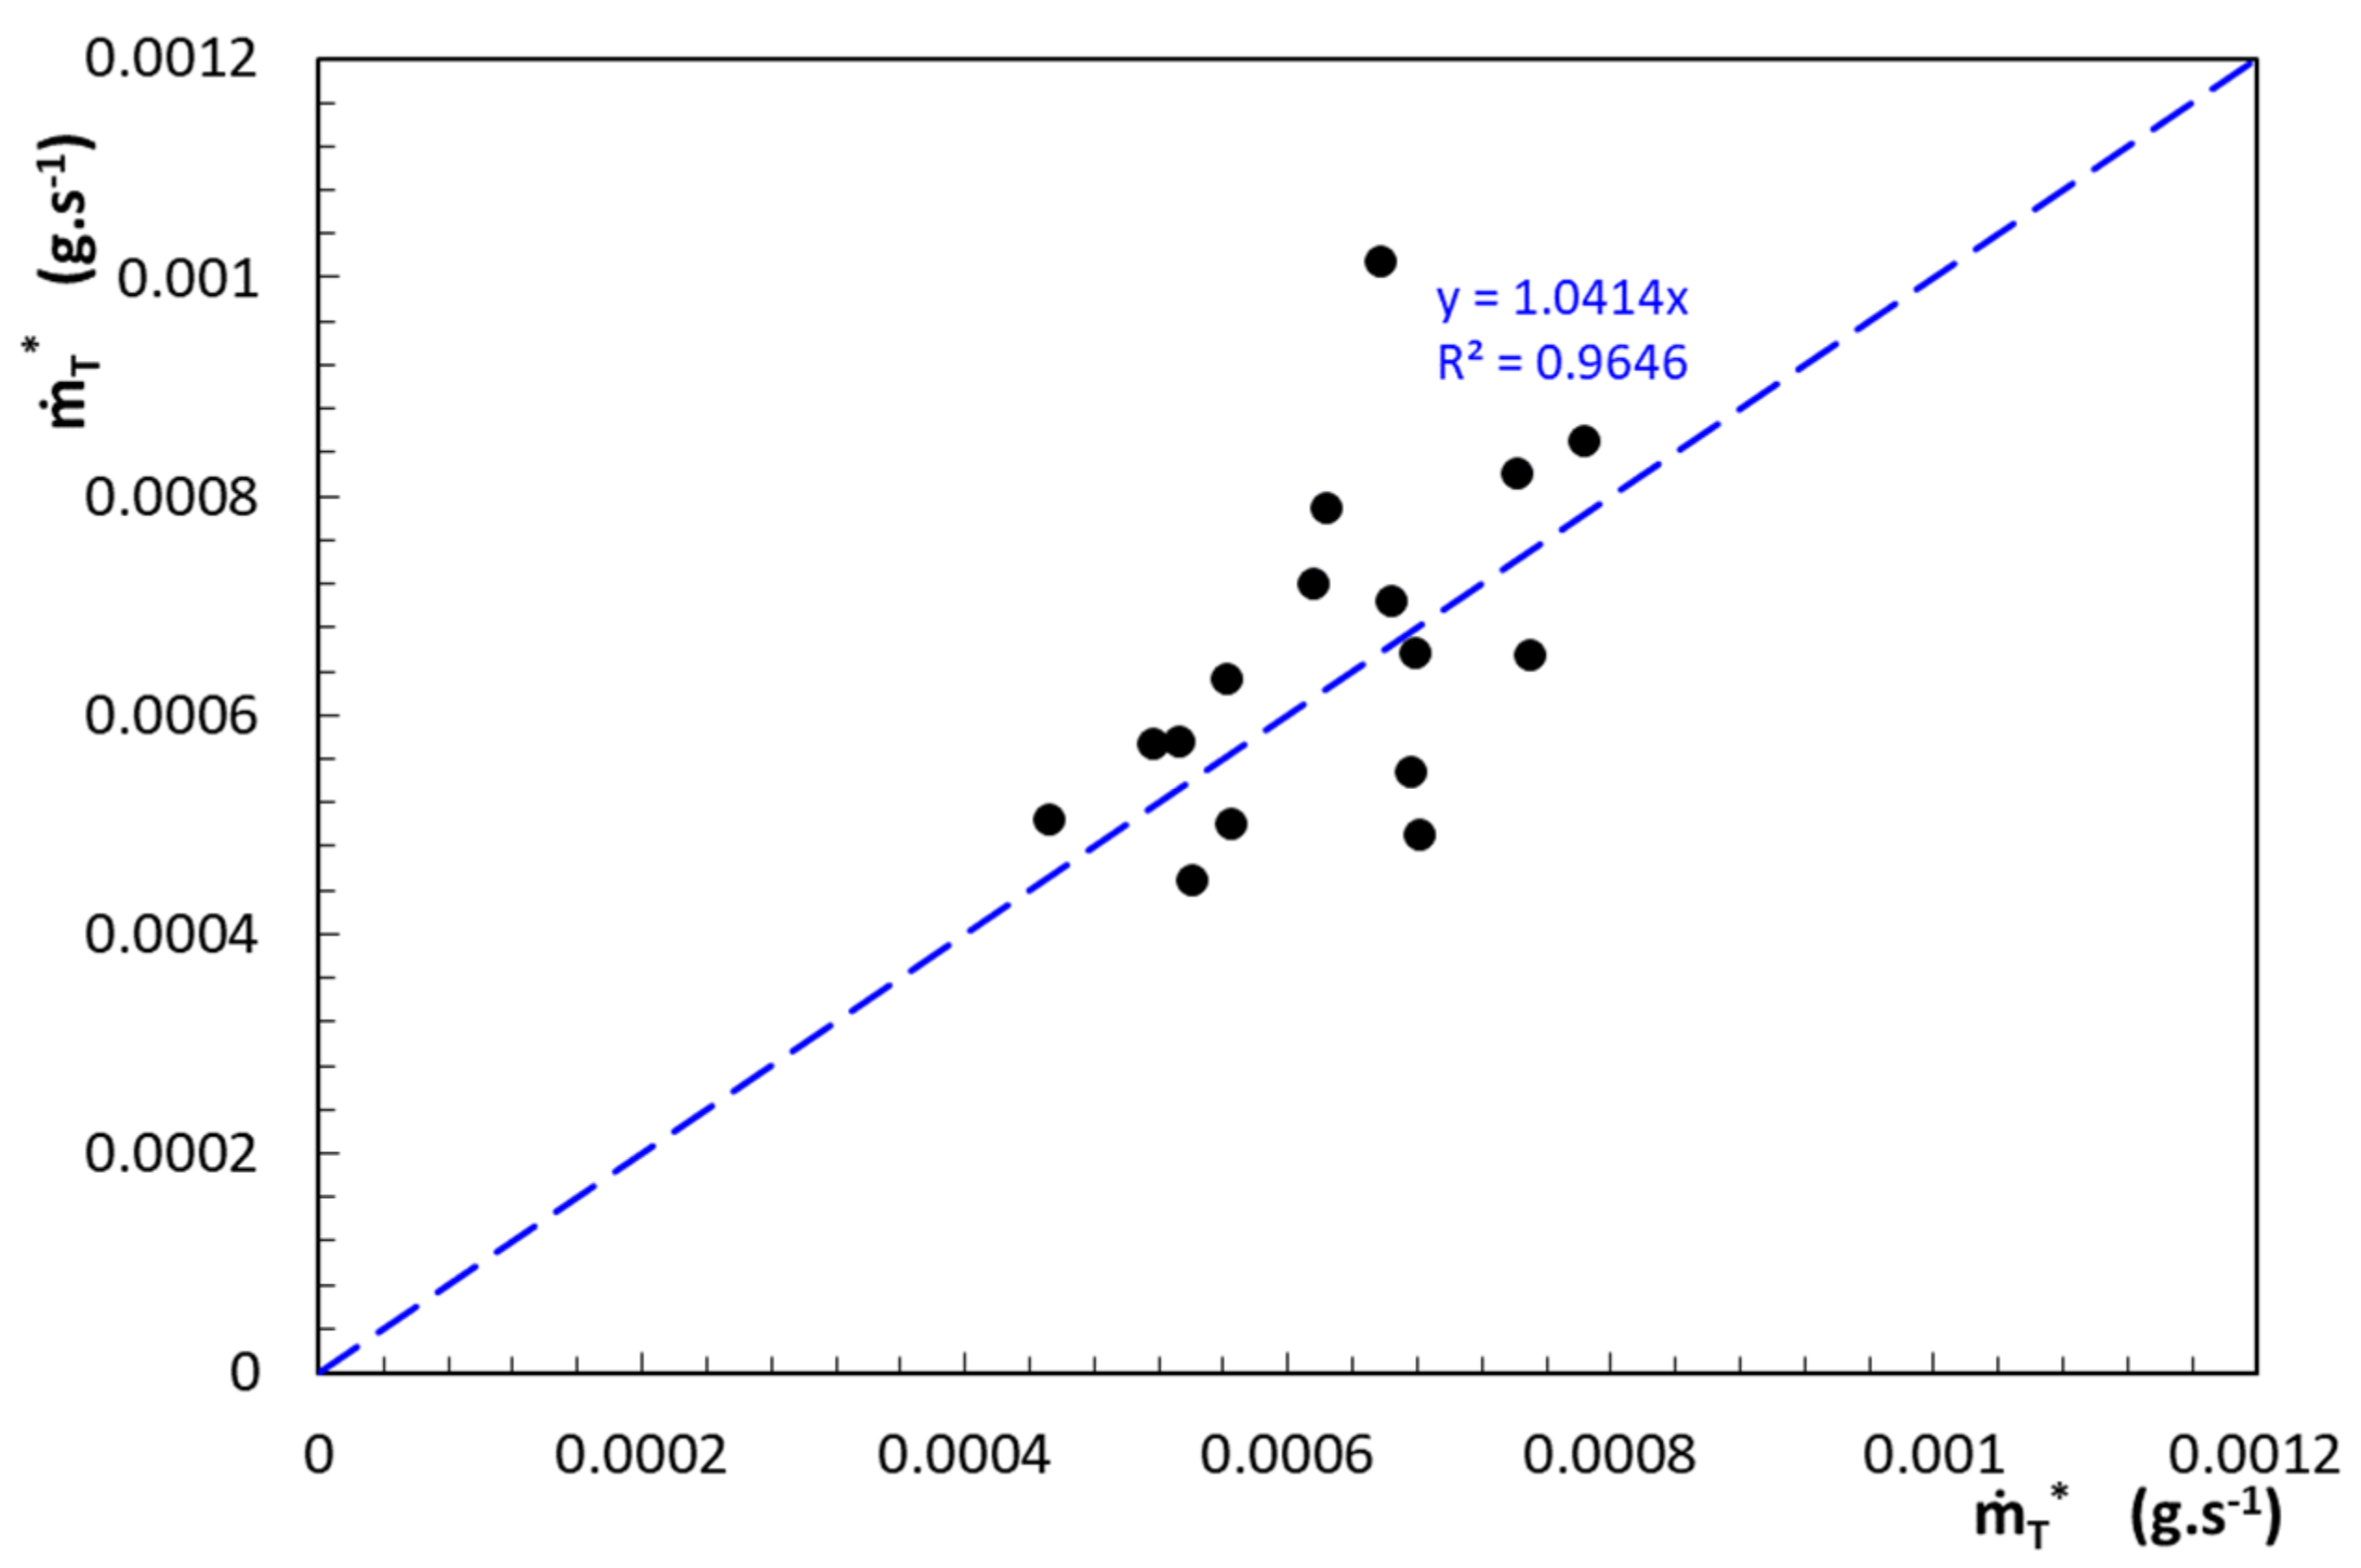
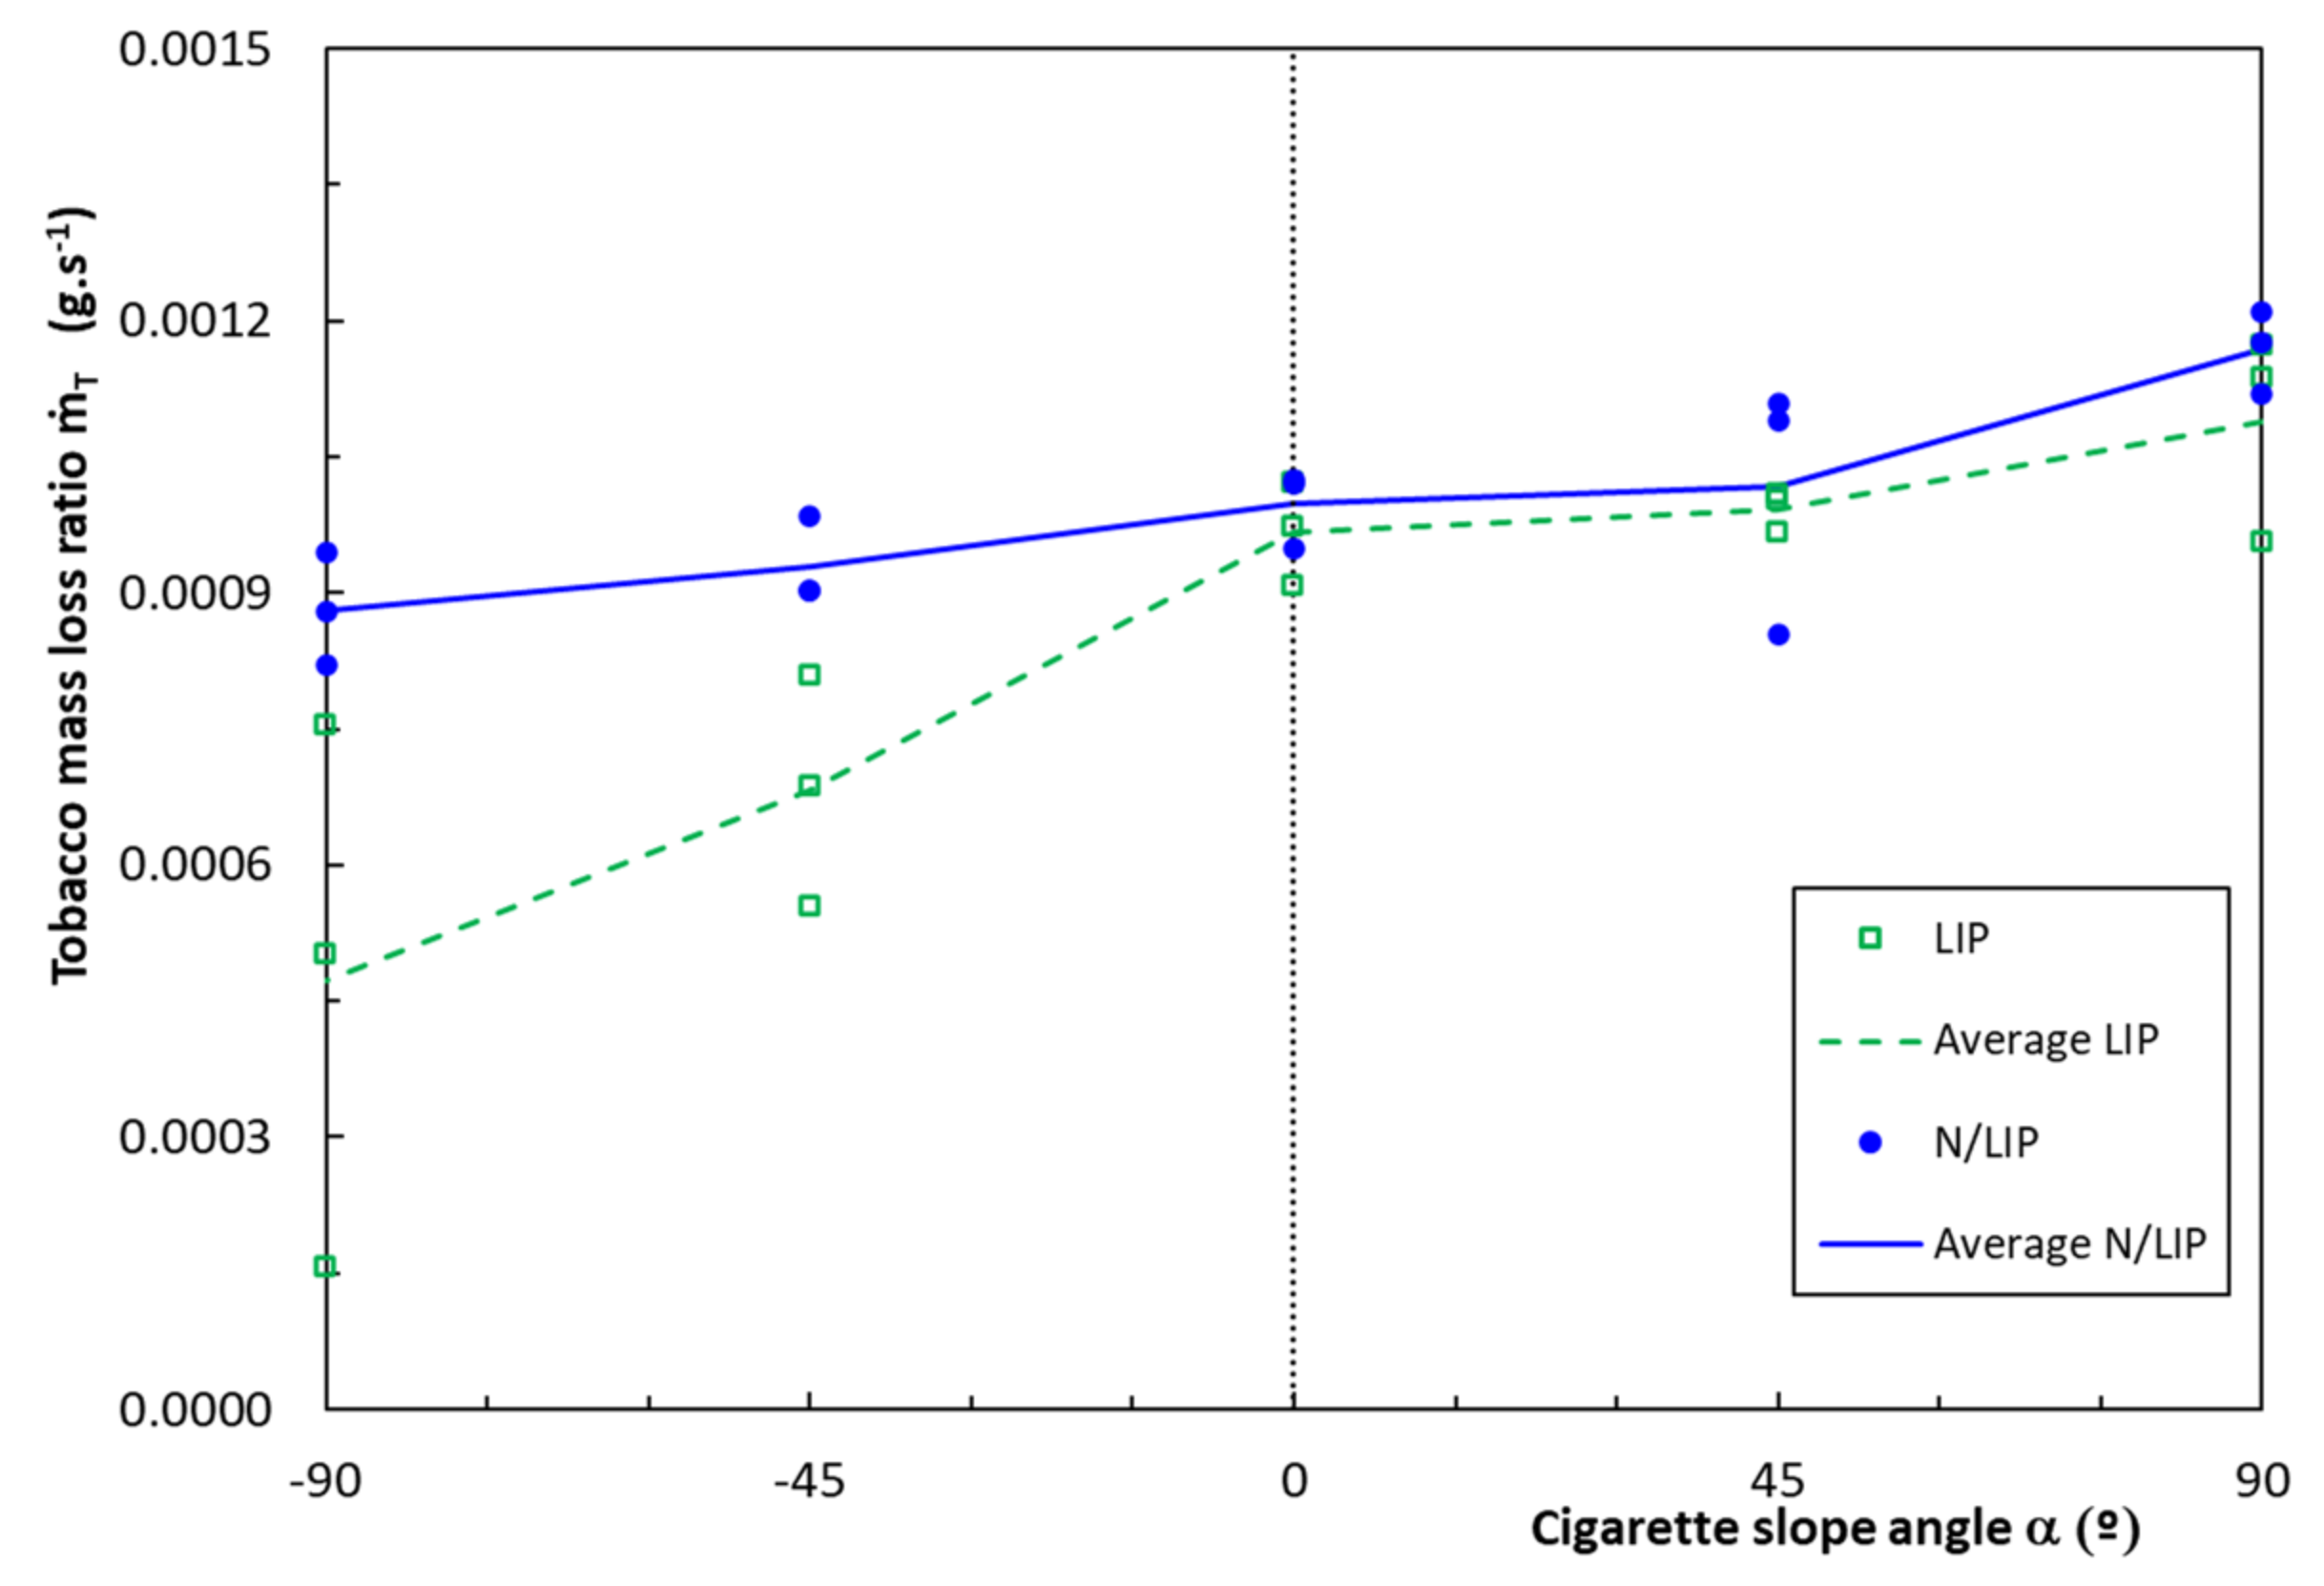
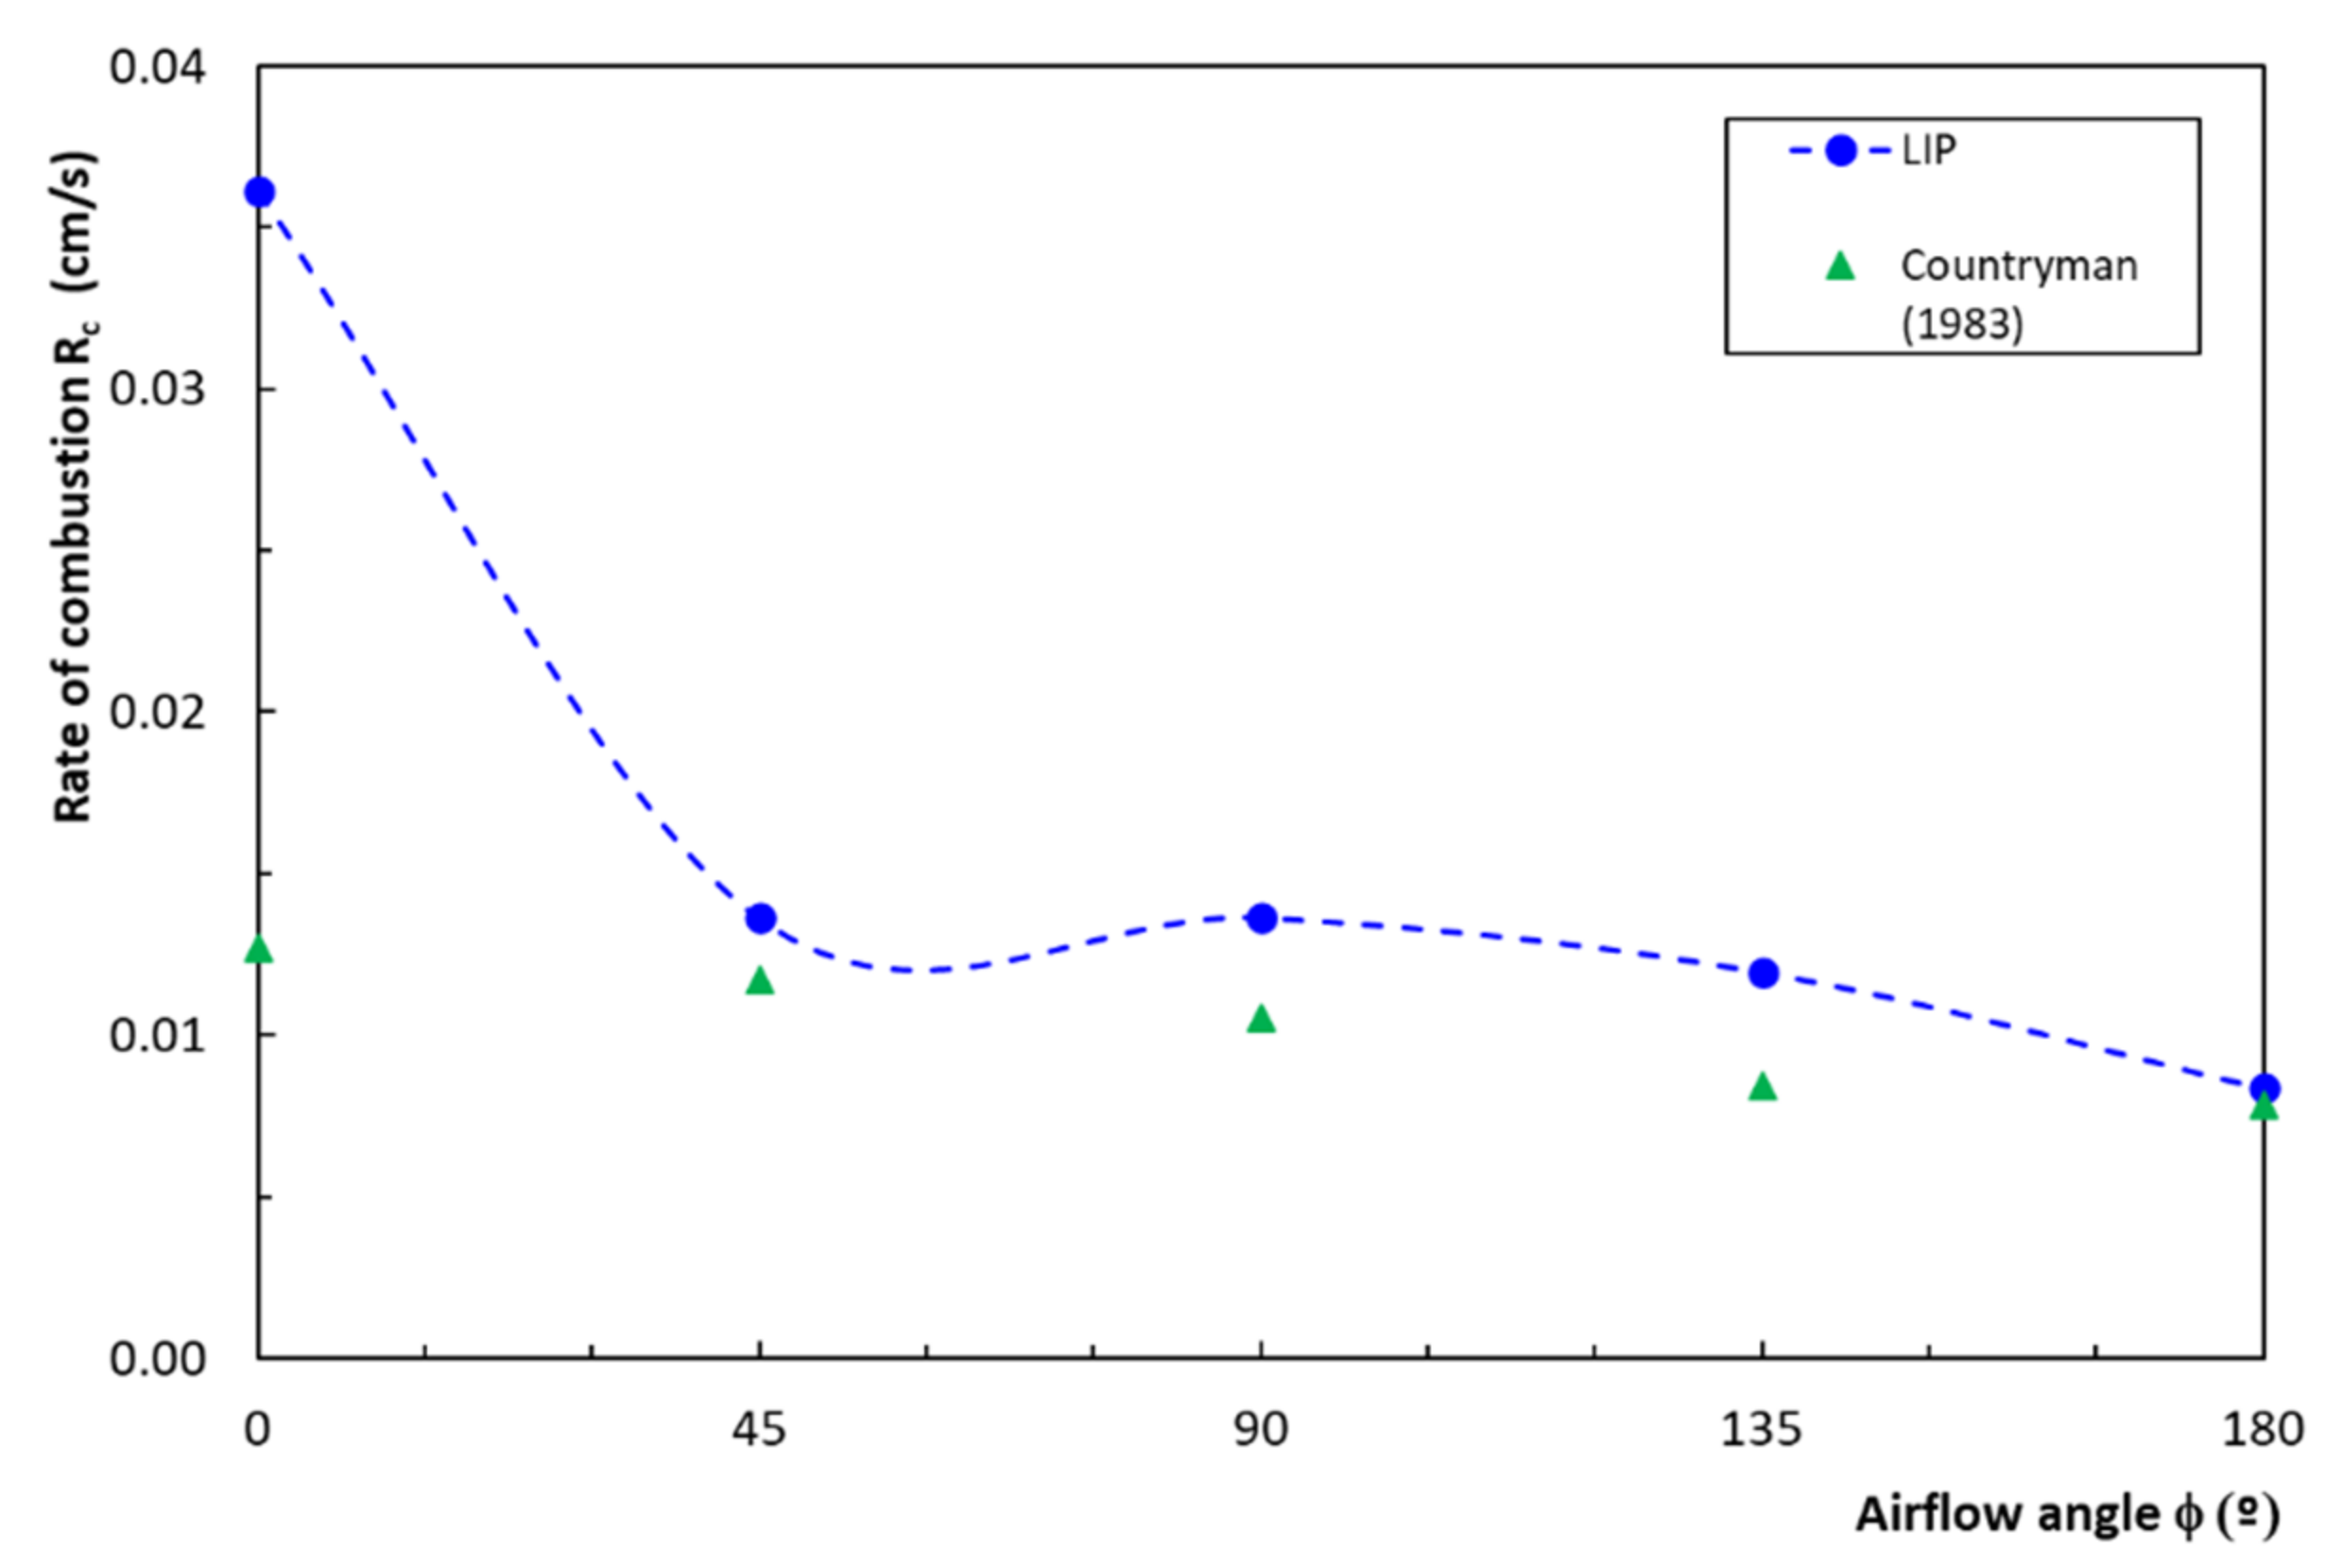
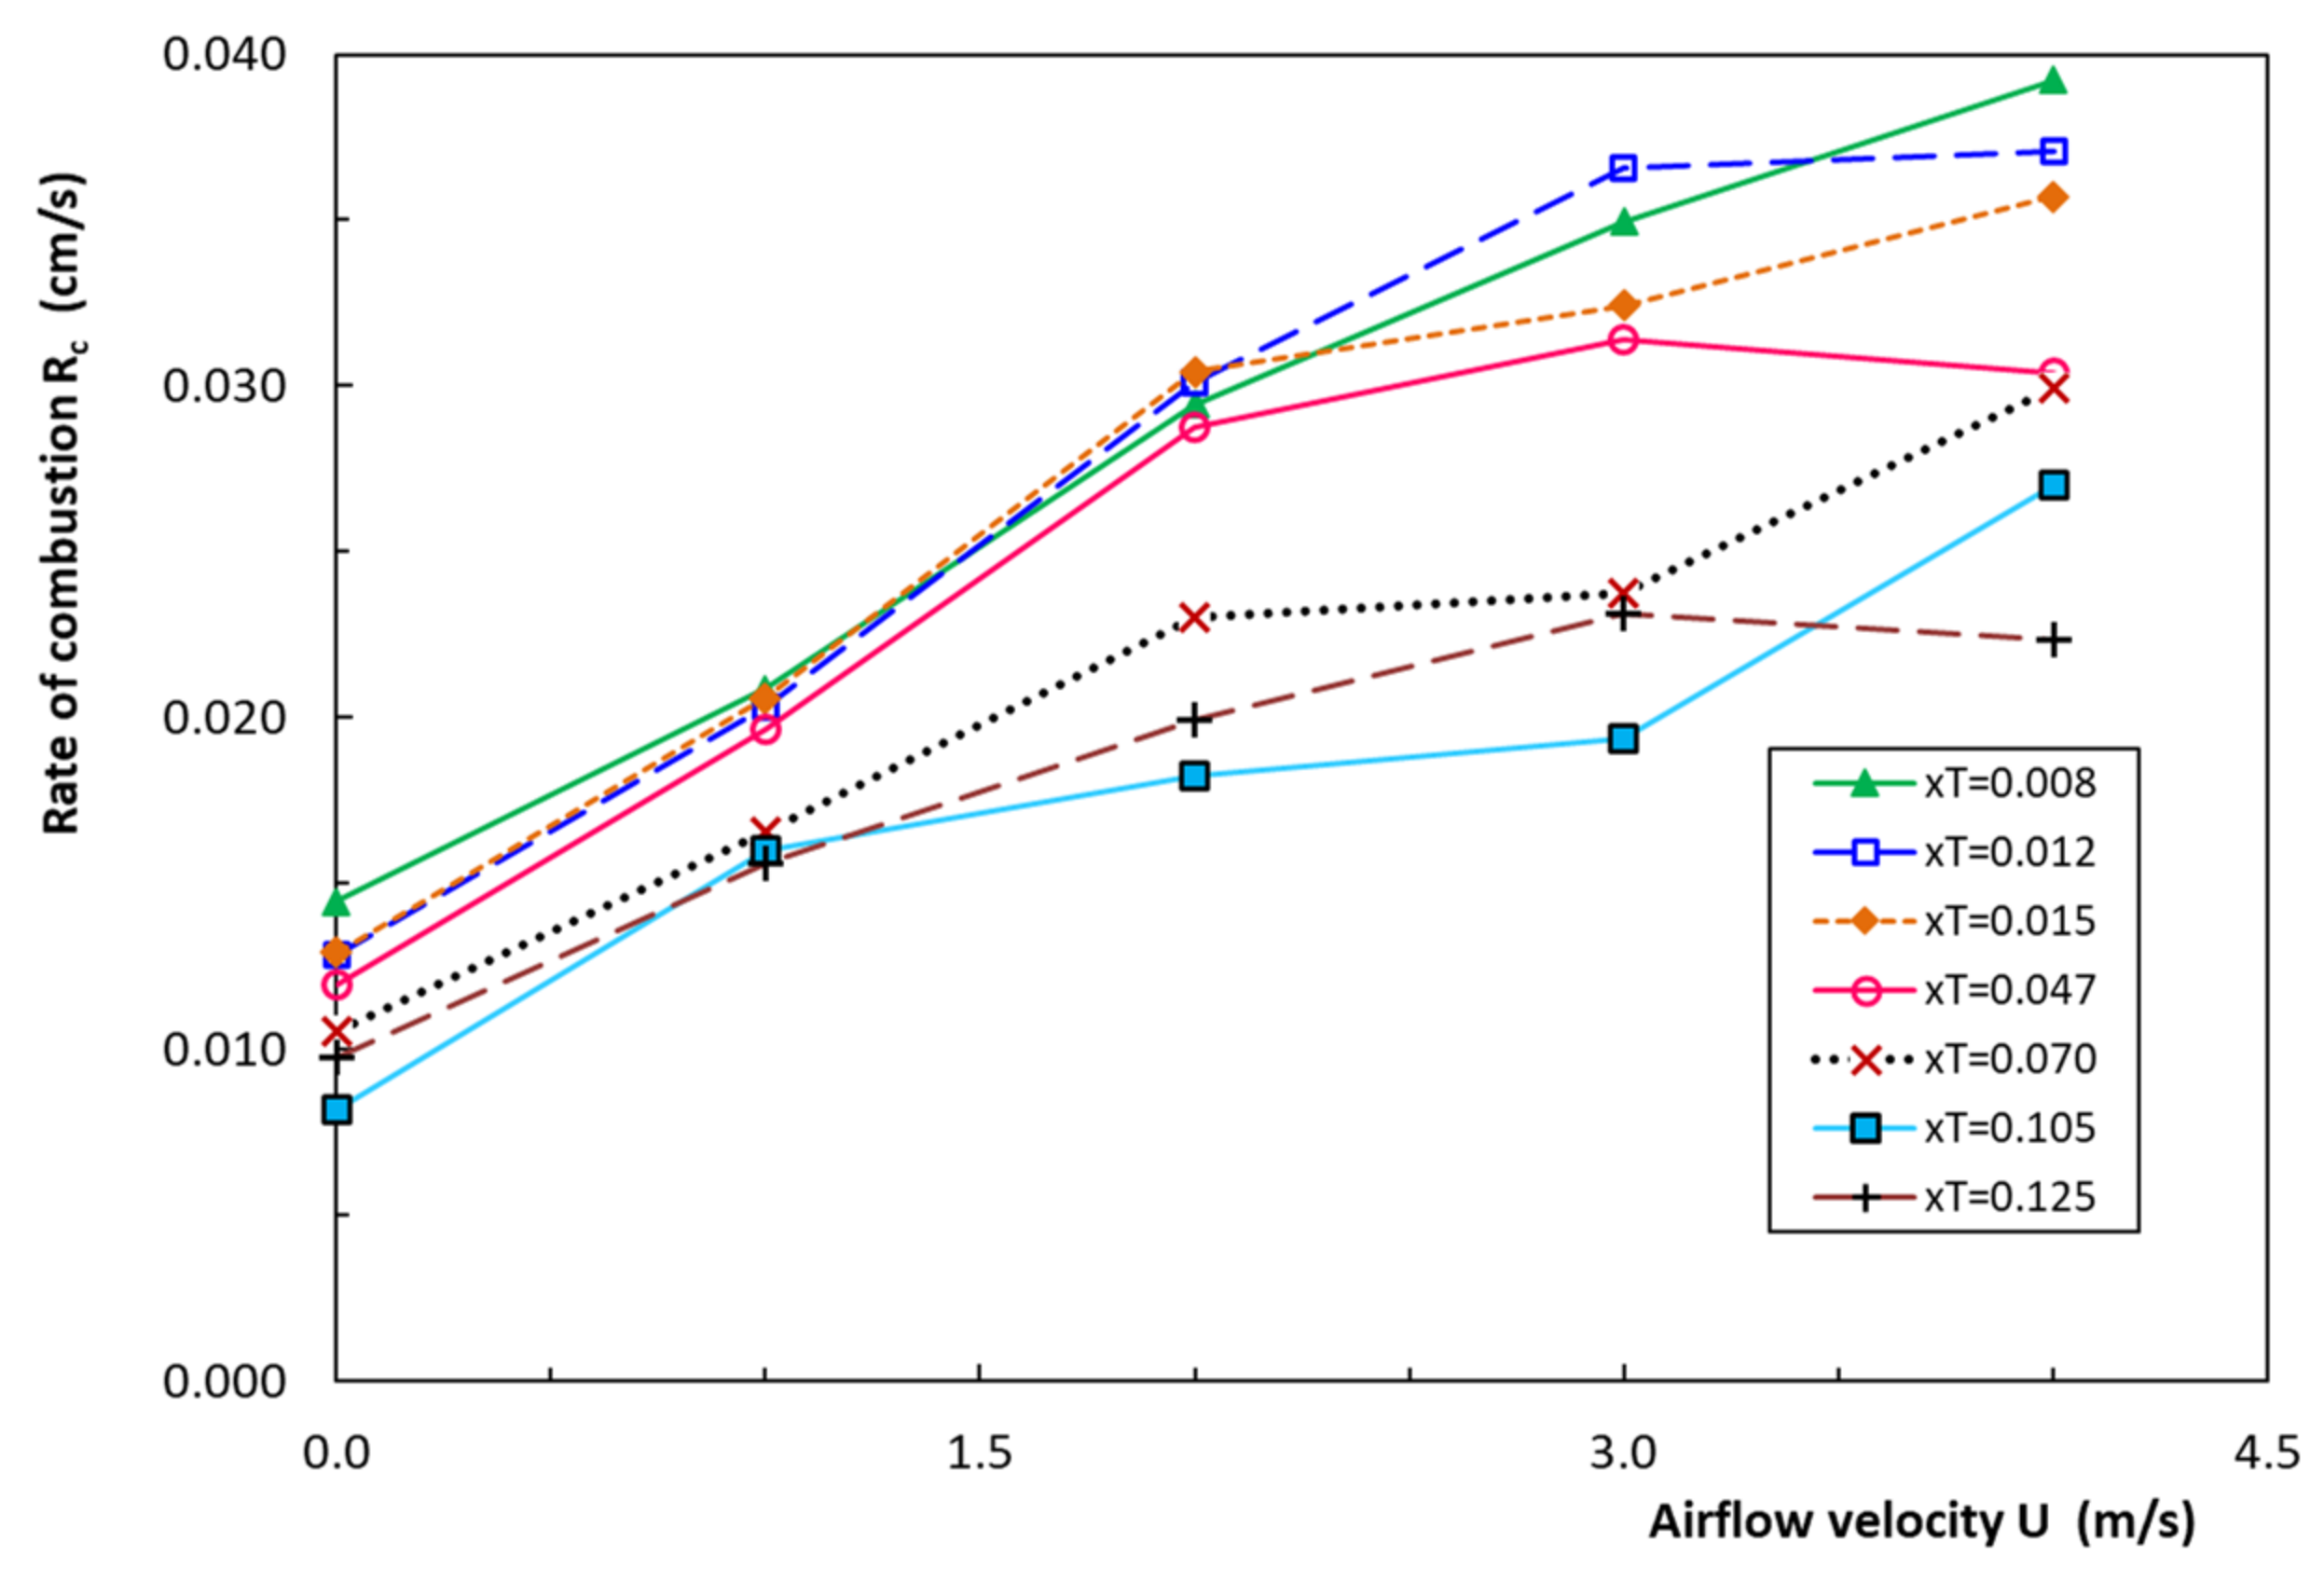
4.1. Rate of Combustion of Cigarettes

A series of 16 tests (Series C1) with cigarettes in horizontal position without wind (α = 0 and U = 0) were performed measuring the variation of mass and the rate of combustion of each cigarette for a range of values of xT. The results are shown in Figure 3 in which direct values of mass loss rate m ˙ T are compared with the corresponding parameter m ˙ T * estimated using Equation (14) and the measured values of combustion rate of the cigarette Rc, derived from the evaluation of the variation of the cigarette length during the experiment based on video frames. As can be seen, the fit between both sets of values, indicated by the correlation coefficient of 0.965, is not perfect. As the analysis of cigarette length variation is the only method that we have to estimate the mass loss ratio in tests of single cigarettes with wind or in ignition tests, in these cases, we shall characterize m ˙ c using Rc.
Results of the rate of combustion of cigarettes, expressed as mass loss rate, as a function of angle α with the horizontal plane in no wind conditions are shown in Error! Figure 4 As can be seen m ˙ T increases with the inclination angle and LIP cigarettes show larger dependence on this angle in comparison to N/LIP cigarettes. For positive values of α (burning end pointing to the ground) the rate of mass loss is larger than for α ≤ 0º. This statement can be justified because for α > 0º flow convection is favourable to combustion spread Figure 4 also shows that LIP cigarettes have a lower rate of combustion than N/LIP cigarettes.
The influence of orientation angle φ in relation to wind velocity U = 2 m.s−1 on Rc for a horizontal cigarette (α = 0º) is shown in Figure 5. If the flow impinges directly on the burning edge of the cigarette (φ = 0º), Rc is about three times larger than for φ = 45º. Moreover, Rc does not vary significantly for 45º < φ < 180º. Similar results were obtained by [19] in studies about the effect of flow orientation on the combustibility of firebrand material. Results from [7] in tests with a flow velocity of 1.4 m.s−1 for the same values of φ shown Figure 5 indicate that the values of Rc are very similar to the present ones for φ ≥ 45º but much smaller for φ = 0º.
Results of tests with cigarettes for different xT values and for a set of wind velocities were performed for α = 0º and φ = 0º (Figure 6). As can be seen in this figure, Rc increases with a linear trend with the wind velocity, at least in the range of 0 ≤ U < 3 m.s1.
The dependence of Rc on x T for tests with φ = 0º and for constant airflow velocity U is shown in Figure 7 indicating a linear trend dependence in the range of tests. From these results and in accordance with Equation (3) we can estimate Rc as a linear function of both xT and U. The parameters ac and bc are a function of xT according to:
a c = 0.0141 0.0329 . x T
b c = 0.00766 0.0322 . x T
Therefore we have:
R c = 0.0141 0.0329 . x T + 0.00766 0.0322 . x T . U
The straight lines shown in Figure 7 computed using Equation (44) for values of U equal to 0, 1, 2, 3 and 4 m.s1 show a reasonable agreement with experimental data. Applying the Equation (45) to calculate the average relative deviation RAD between the experimental data (Lab) and the modelled values (Model), we obtain a variation of 8%, 5%, 8%, 9% and 13% for U = 0, 1, 2, 3 and 4 m.s1, respectively. The maximum duration tc of cigarette burning can be calculated using Equations (44) and (16).
R A D = L a b M o d e l L a b

4.2. Model Validation

Although there is evidence of cigarette ignited fires unfortunately in real cases we do not have detailed data to ascertain the conditions under which a given cigarette or but started a fire. In some cases, it is possible to estimate the moisture content of the fuel bed or even to assess the general wind conditions, but in order to validate our model, we will use the carefully controlled conditions and parameters determined in the laboratory experiments. As was described above, given the large number of factors that affect the fuelbed ignition, besides the fixed fuelbed properties, the present model was limited to the following primary parameters: aG, bc, au, x1, α2, β1, m1 and m2. The process that was used to determine or estimate each parameter to validate the model with experimental data is now described. Given the uncertainties and scatter of some measurements, this analysis is approximate and serves only the purpose of testing the conceptual model.
Parameters aG = ac and bc were obtained as a function of xT from (42) and (43). If the value of U1 that maximizes the heat release is known, au can be obtained using (8). In the present tests, it was found that the minimum values of ti were obtained for 1.5 < U < 2.5 m.s1 (this will be described below in Figure 14). Therefore, a value of U1 = 2.0 m.s−1 was adopted for U1. In the cases for which the value of xT was not measured an average value xT = 0.06 was used in the numerical model.
In tests in which combustion extinction was observed, the values of te were registered. As will be described below with Figure 11, the data corresponding to combustion extinction due to moisture damping can be used to assess toe, according to (23) and therefore to estimate the values of x1 and α2. For the set of tests reported, the values x1 = 0.22 α2 = 8 were estimated, and it was assumed that these parameters were the same in all cases.
The time constant 1/β1 that corresponds to the period required for the energy flux to become double its initial value can be measured in principle, but this was not done in the present study. In the numerical model, a constant value β1 = 0.10 s−1 was adopted. It was found that this parameter affected not only the value of t2 but also its dependence in relation to U, as can be judged from Equations (31) and (35).
The measurement of the values of m1 and m2 would require high accuracy equipment that was not available, so we provide an estimate of their order of magnitude. These parameters reflect the degree of contact between the burning part of the cigarette and fuelbed particles. As the positioning of the cigarette was made in similar conditions in the present study it can be expected that the values of m1 and m2 must be of the same order of magnitude in the various experiments. These masses affect almost linearly t1 and t2 and were left free to obtain an overall good adjustment of data. According to the model m2m1, but given the present uncertainty, we assume that m2 = m1.

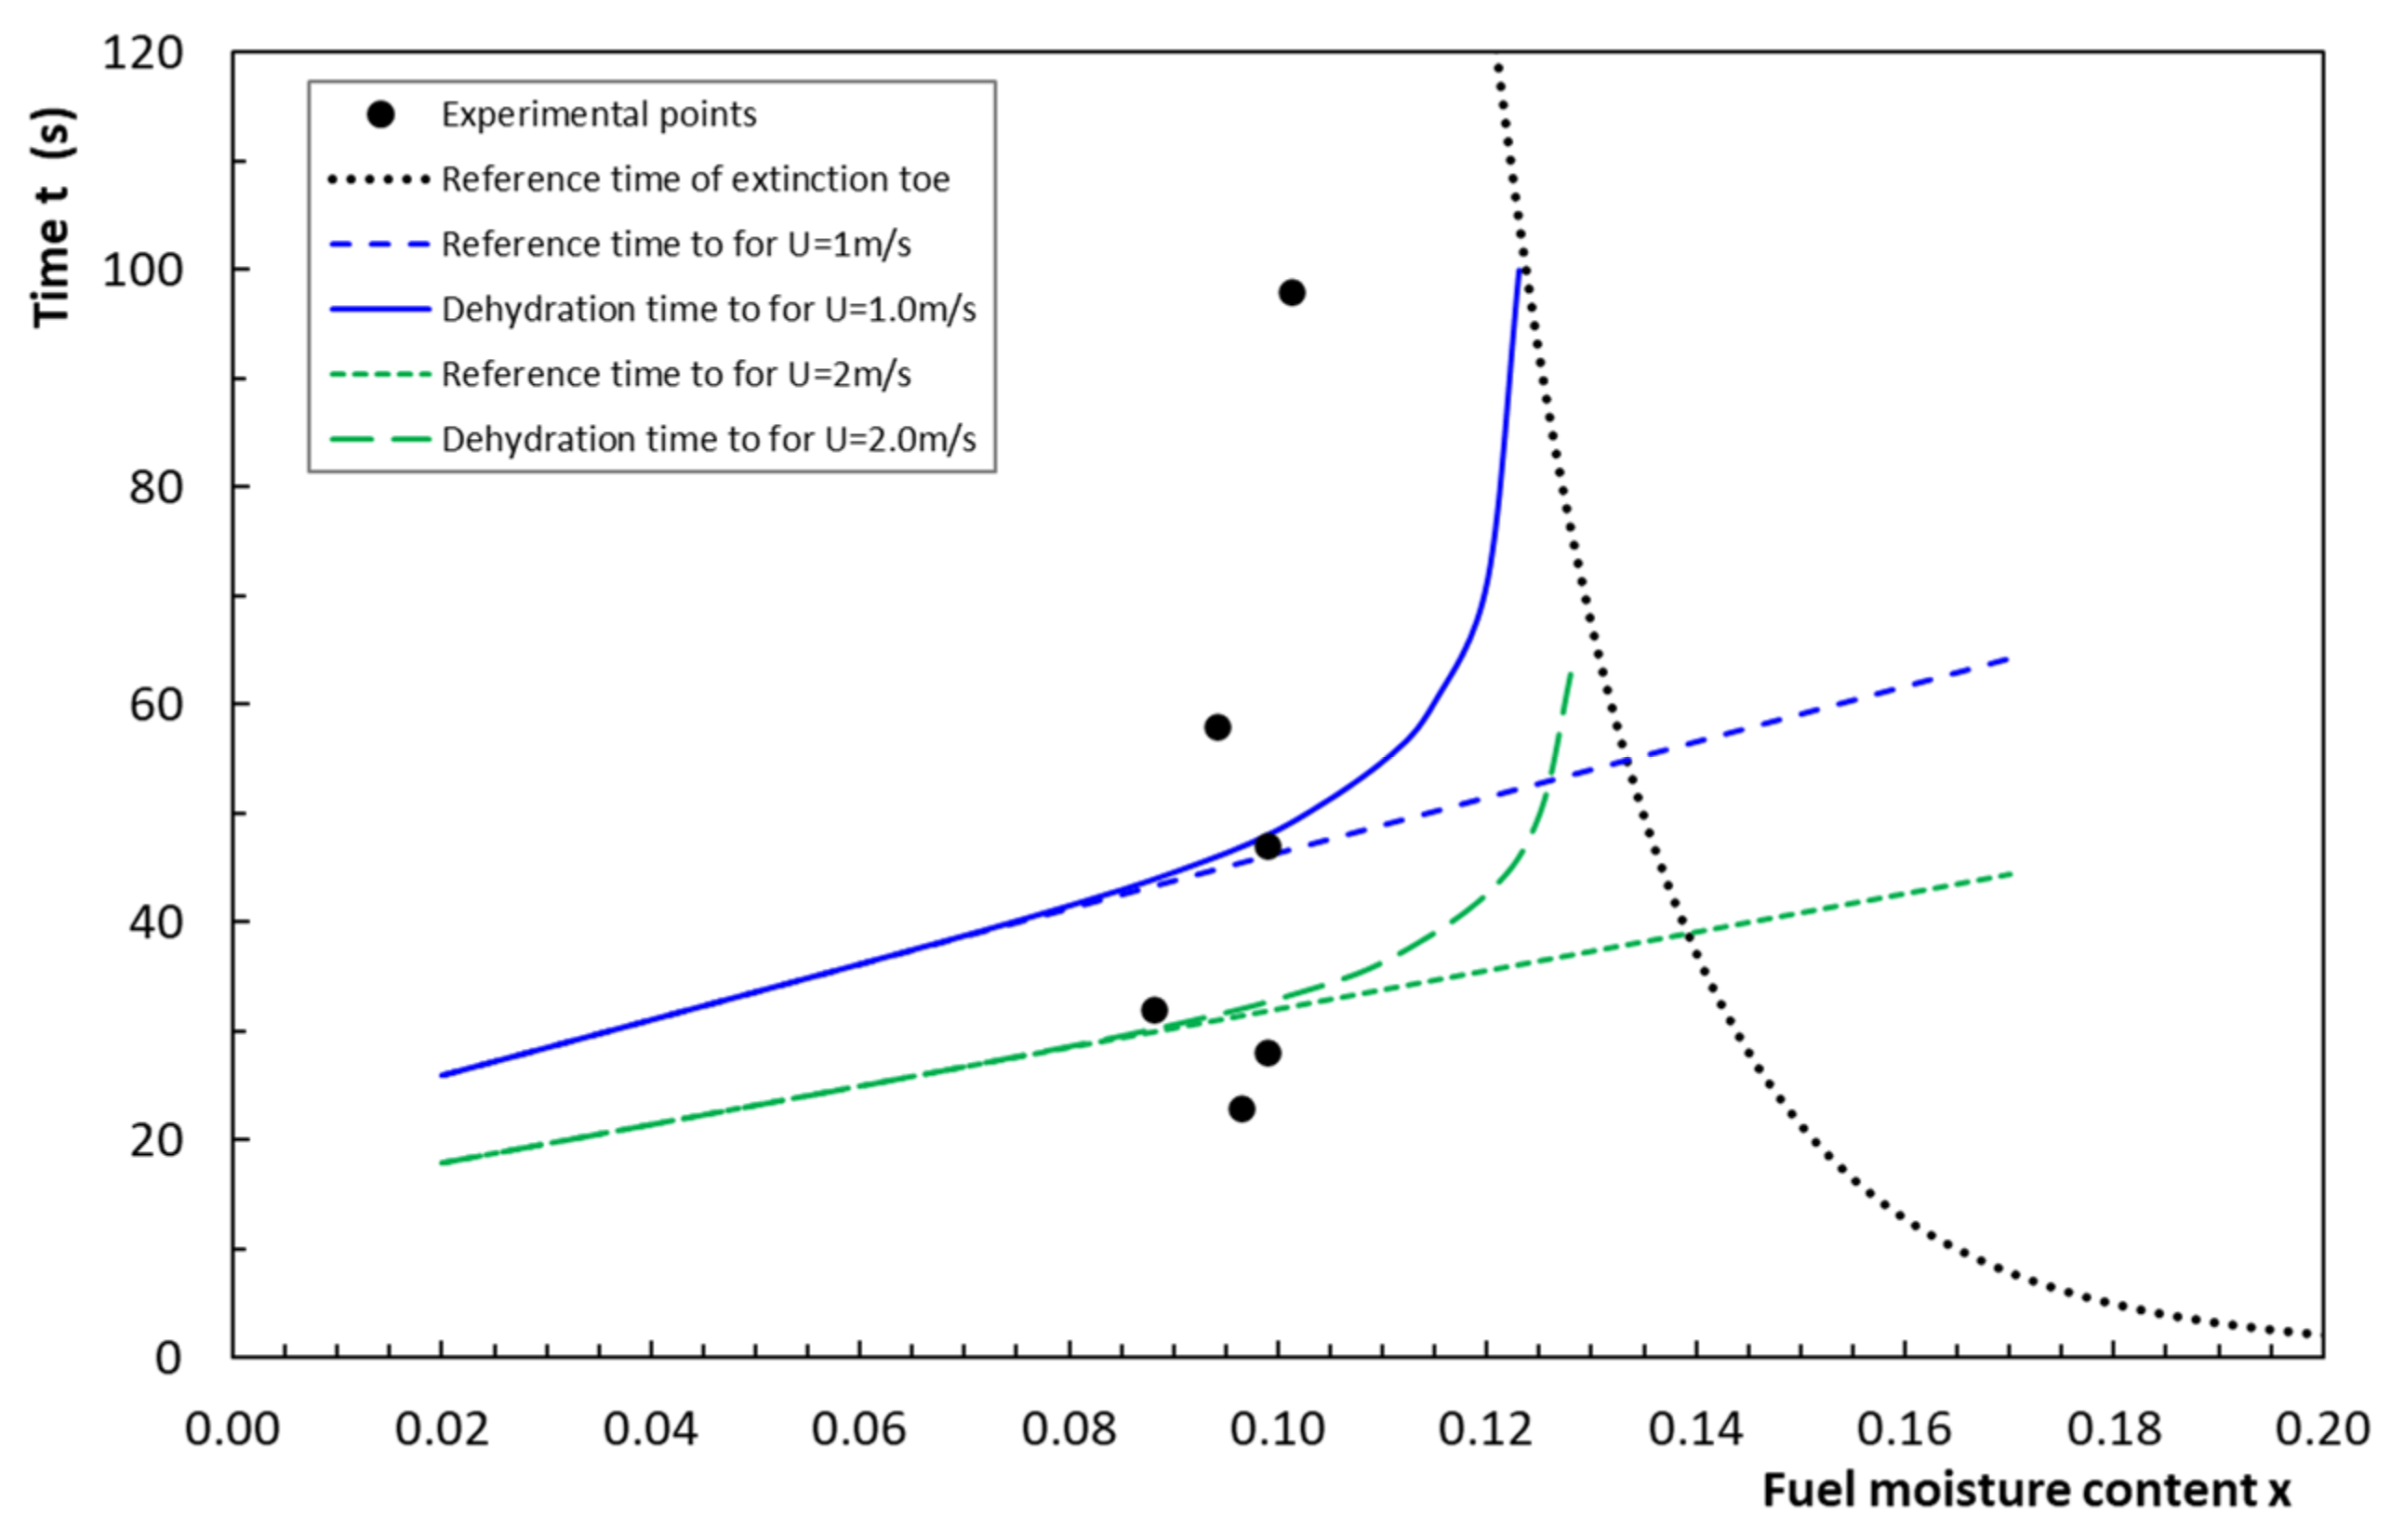
4.3. Dehydration Time

Unfortunately the duration of dehydration time t1 was not measured in most tests. It was realized that the end of this period is characterized by the emission of white smoke due to water vapour so using the video recording of six tests that had fuelbed ignition in which wind velocity varied between 1 and 2 m.s1 the corresponding values of t1 were estimated. The corresponding results are shown in Figure 8. In spite of the narrow range of x, we use this figure to illustrate the behaviour of the proposed model to estimate to1 and t1. The corresponding values of E G ˙ and m1 are given in Table 5. A smaller value of m1 was used for the higher flow velocity in agreement with the results that are shown below. The monotonic increase of t1 with x that is predicted by the model can be observed in Figure 8 namely its rapid increase for higher values of x due to the moisture damping effect. The reference time of the ignition curve shown in Figure 8 corresponds to Equation (23).

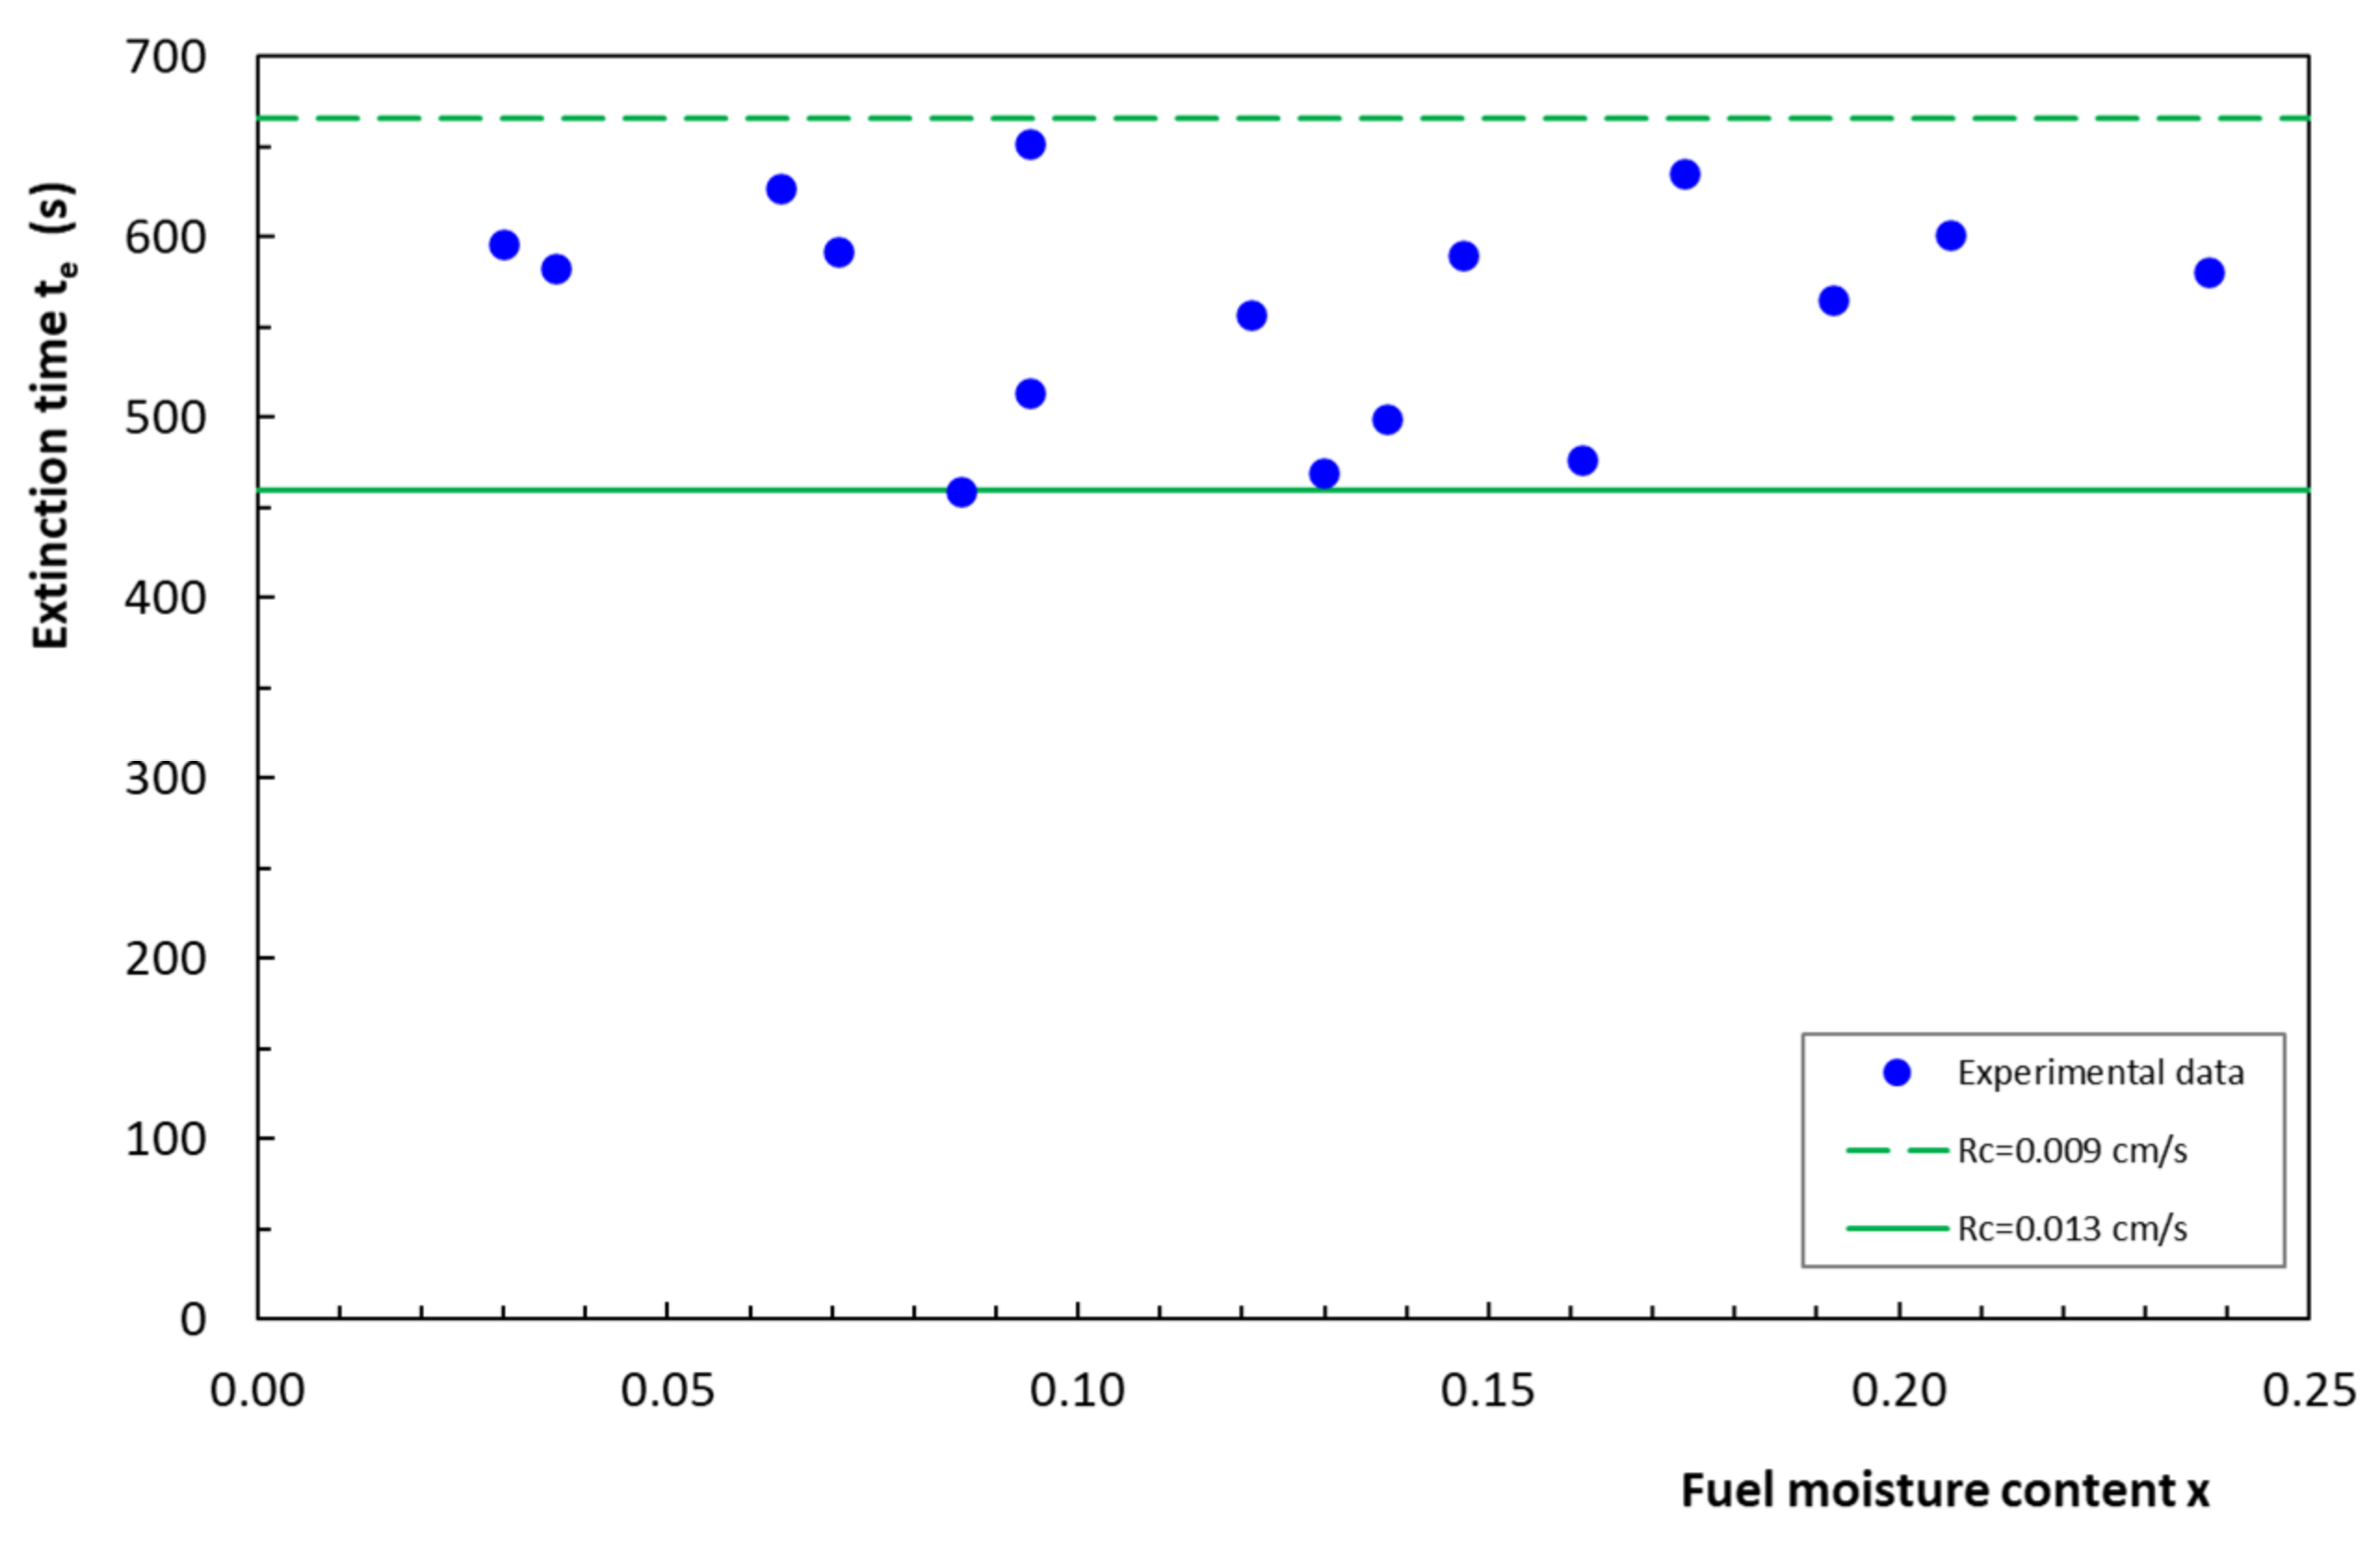
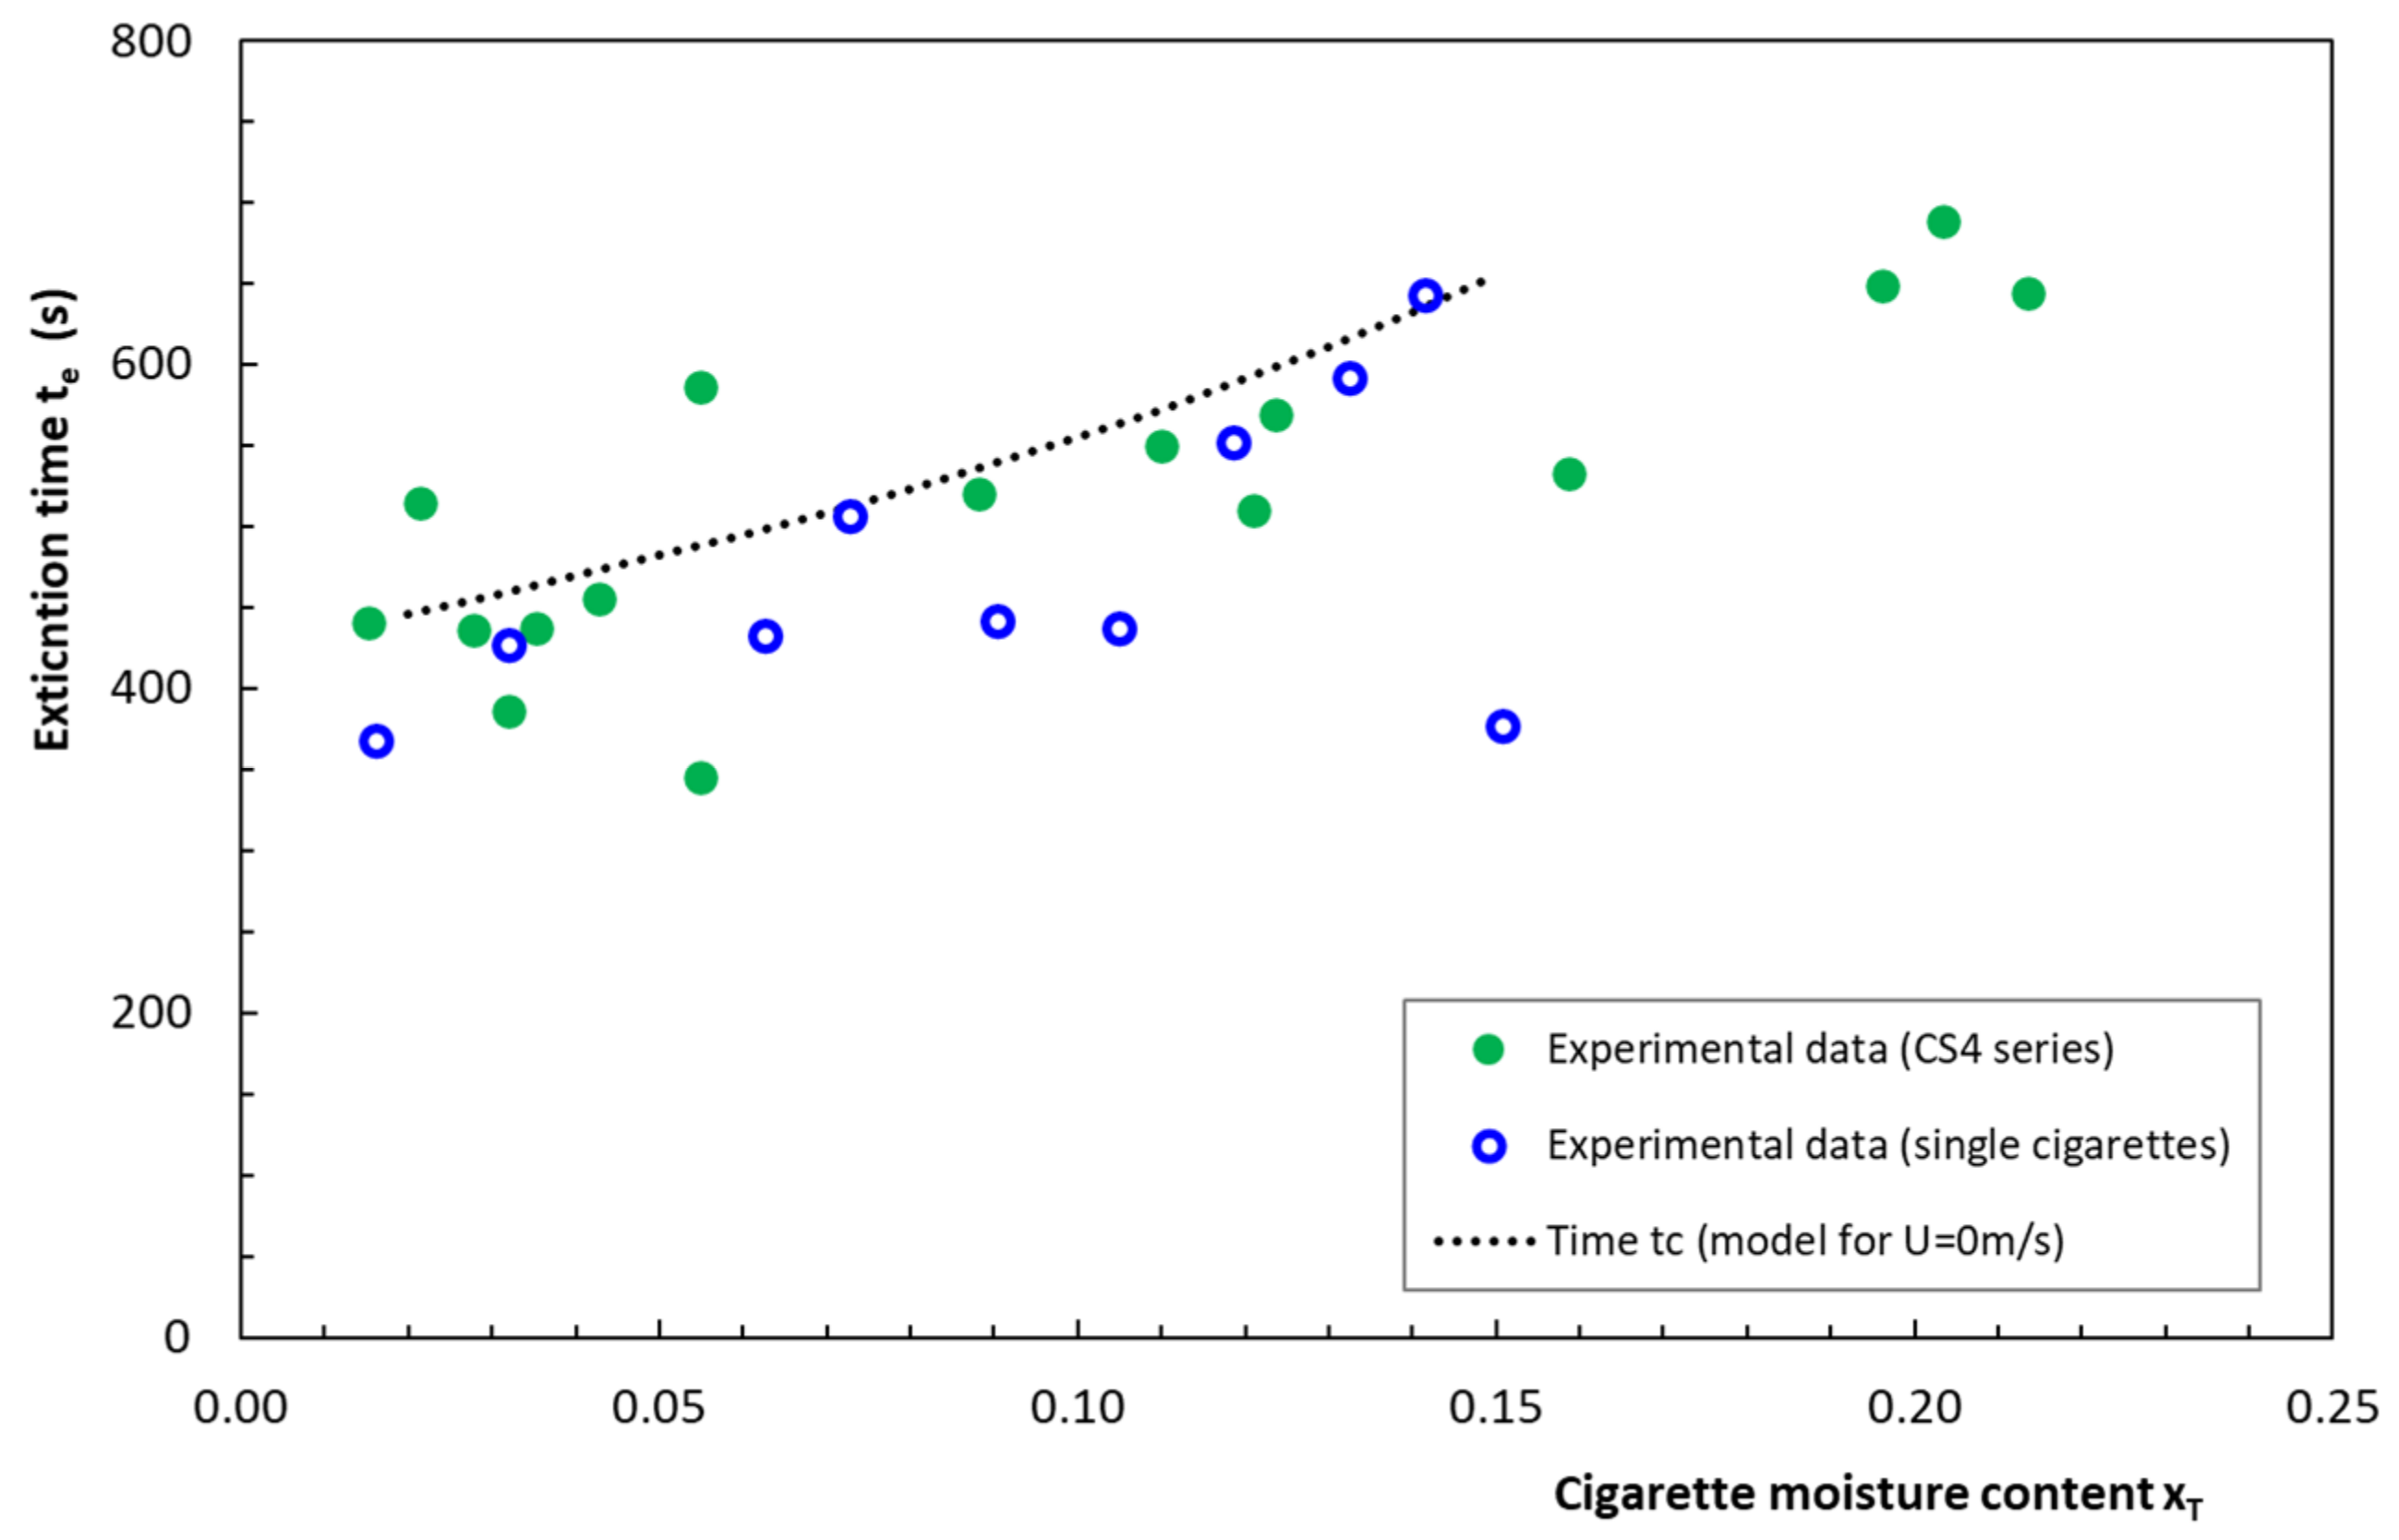
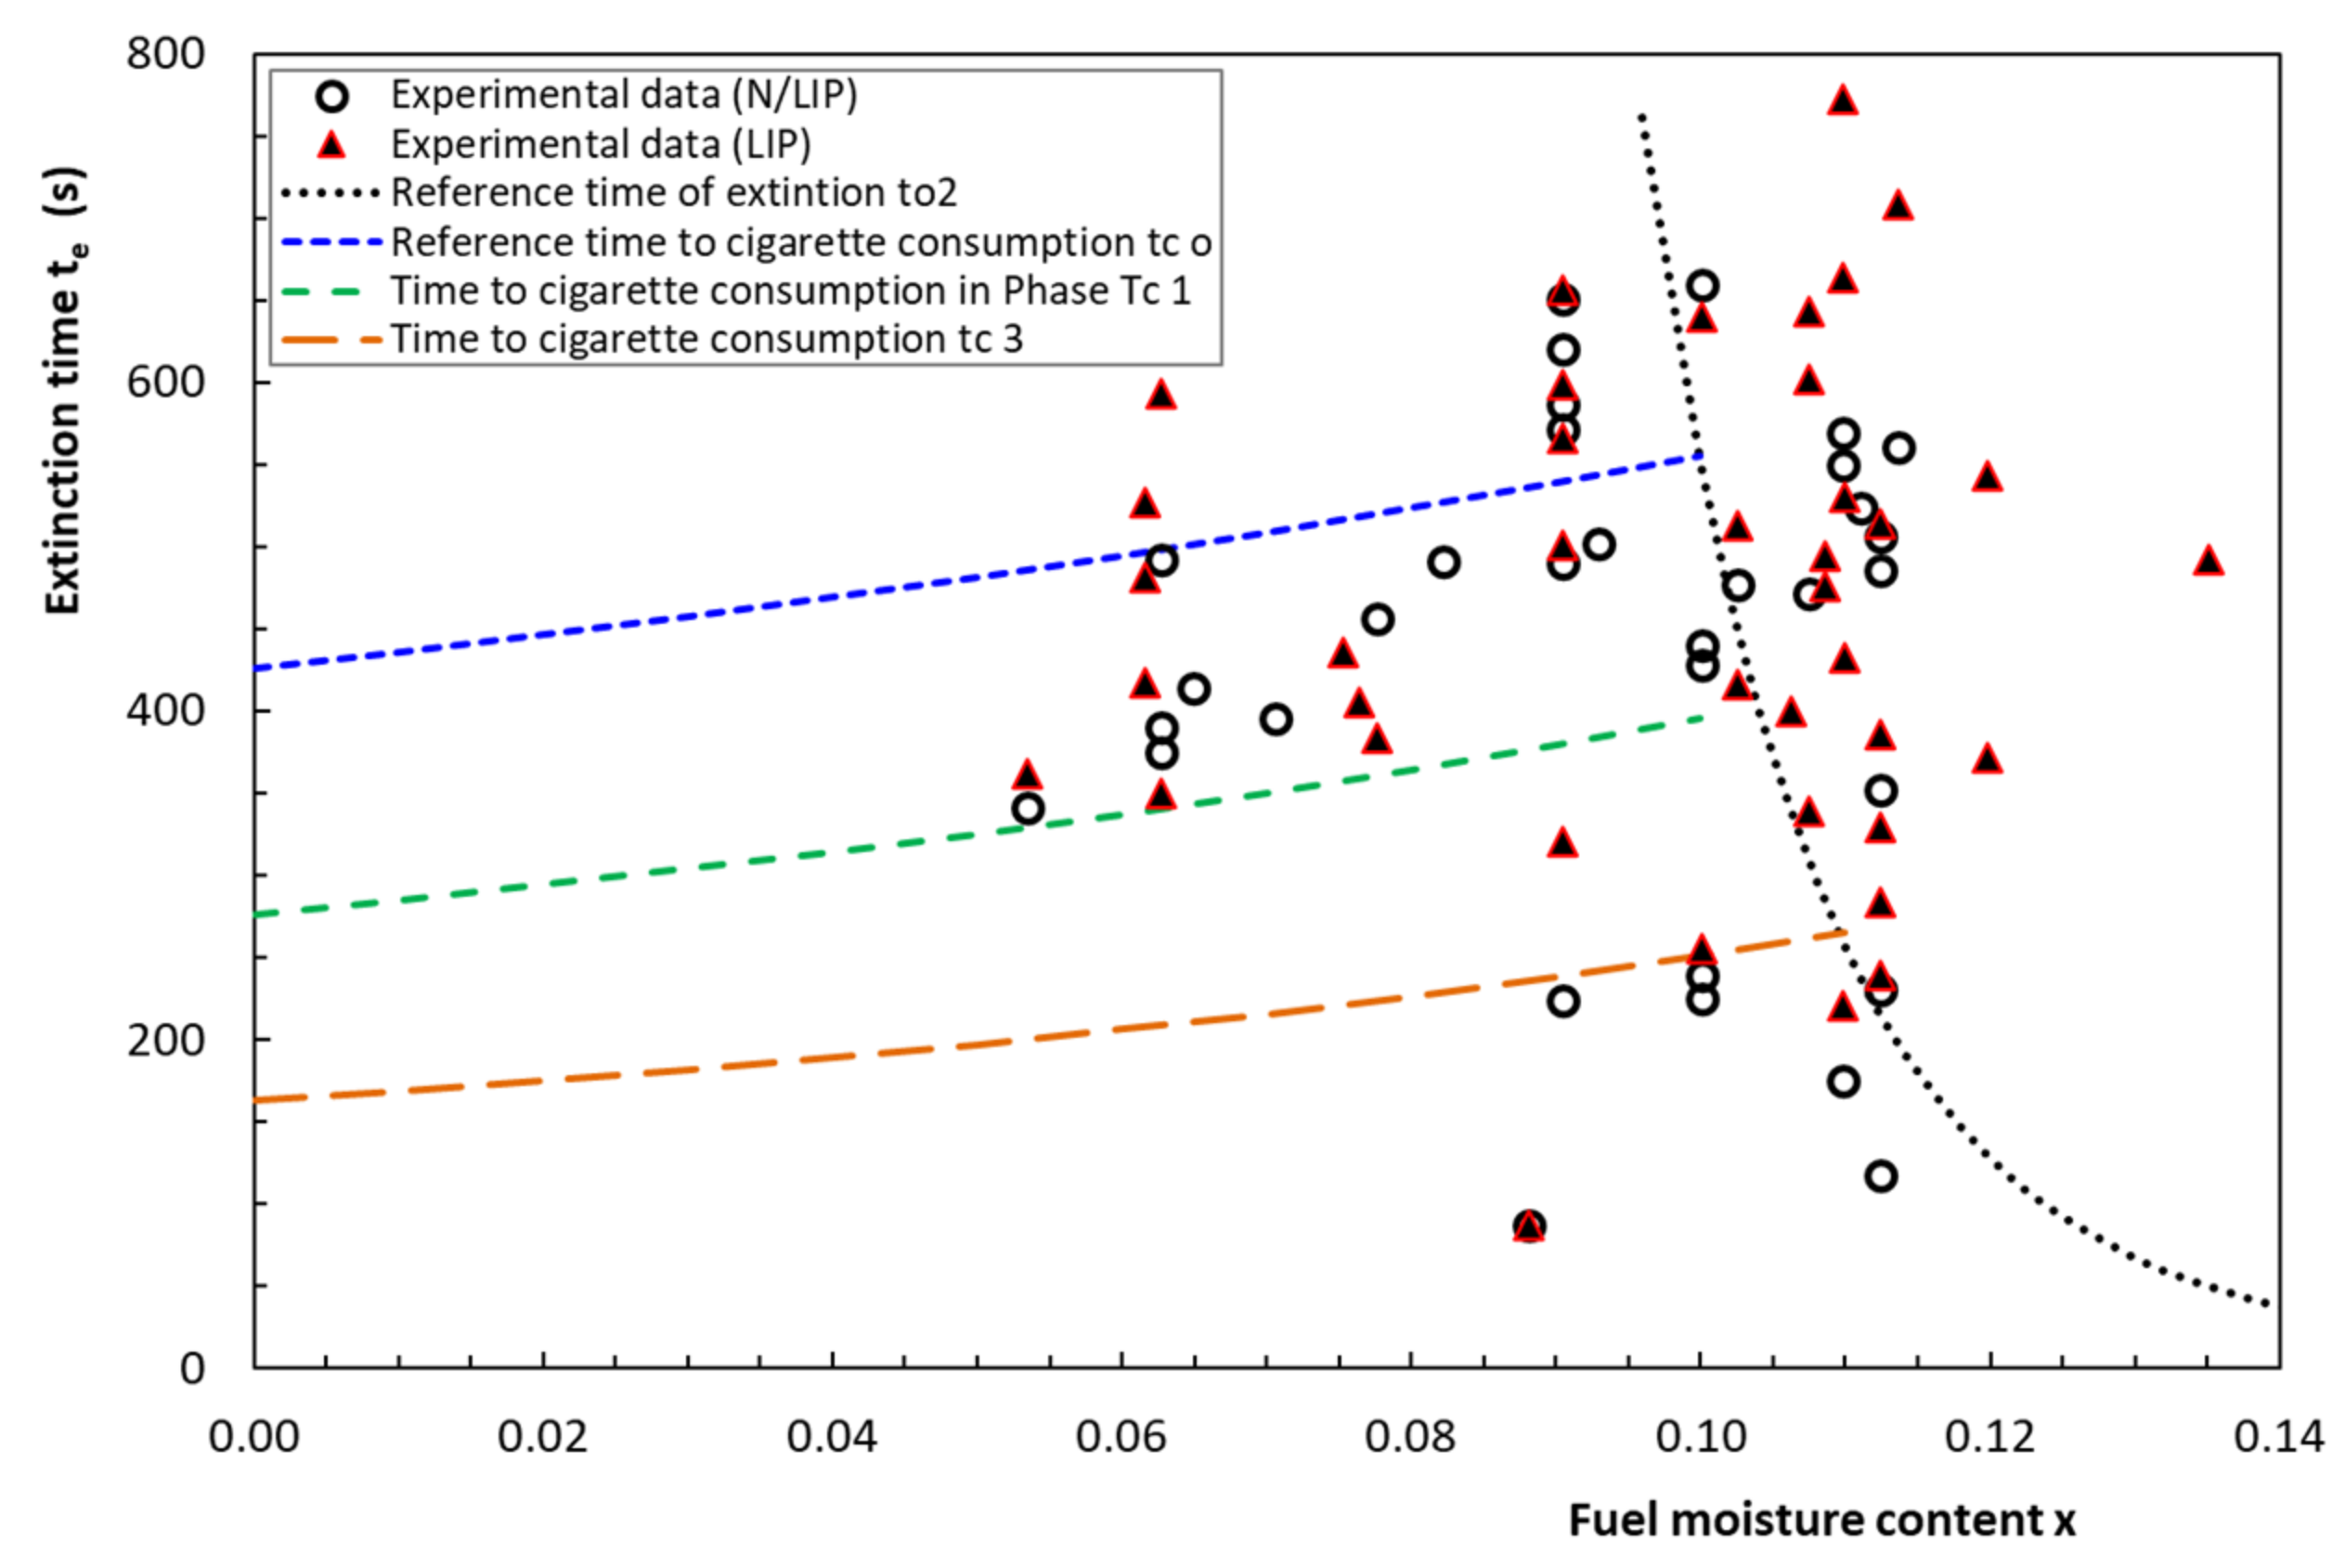
4.4. Extinction Time

The duration of tests in which no ignition occurred was considered as the extinction time te. In order to assess the influence of the moisture content of the tobacco (xT) and of the fuel bed (x), a series of tests was carried out with the purpose of measuring te in the cases for which either xT or x were kept practically constant. In Figure 9 the results of 16 tests (Series CS5) performed with cigarettes with 0.101 < xT < 0.110 and different x values are shown. These results indicate that the time te for the cigarette extinction by primary extinction or burnout is virtually independent of x, which is understandable. This can be judged by the horizontal lines that are shown in that figure corresponding to cigarette burnout times for Rc equal to 0.009 and 0.013 cm.s−1 that are in the range of values measured during those tests.
The results of 16 tests (Series CS4) in which x = 0.095 and 0.094 < xT < 0.16 are shown in Figure 10. The open dots correspond to burnout times of isolated cigarettes in the same range of values of xT confirming that we are in the presence of a primary extinction. The dotted line in this figure corresponds to estimated values of tc for single cigarettes using Equation (44) for U = 0 m.s−1.
The extinction time te as a function of FMC (x) for similar tests (series CS1 and CS2) with LIP and N/LIP cigarettes are shown in Figure 11. In spite of data scatter in these tests that cover a range of wind conditions and possibly of xT values, no major differences between LIP and N/LIP cigarettes regarding the time of combustion extinction can be observed. Two different tendencies are found in this figure. For x < 0.1, te seems to increase following a tendency similar to that of t1 line, according to the present model as shown in Figure 8. but combustion extinction may be mainly due to cigarette burnout. The curves of burnout time values tc for cigarettes using Equation (44) for three airflow velocities—U: 0, 1 and 3 m.s−1—were plotted in Figure 11 assuming that xT = x. In spite of the weakness of this condition, these curves indicate that the values of tc and te are of the same order, supporting the previous assumptions.
On the other side, for x > 0.11, te decreases very rapidly in agreement with the proposed concept of secondary extinction due to fuelbed moisture damping. As was mentioned before, these data points were used to estimate the parameters of Equation (23): x1 = 0.22 and α2 = 8.

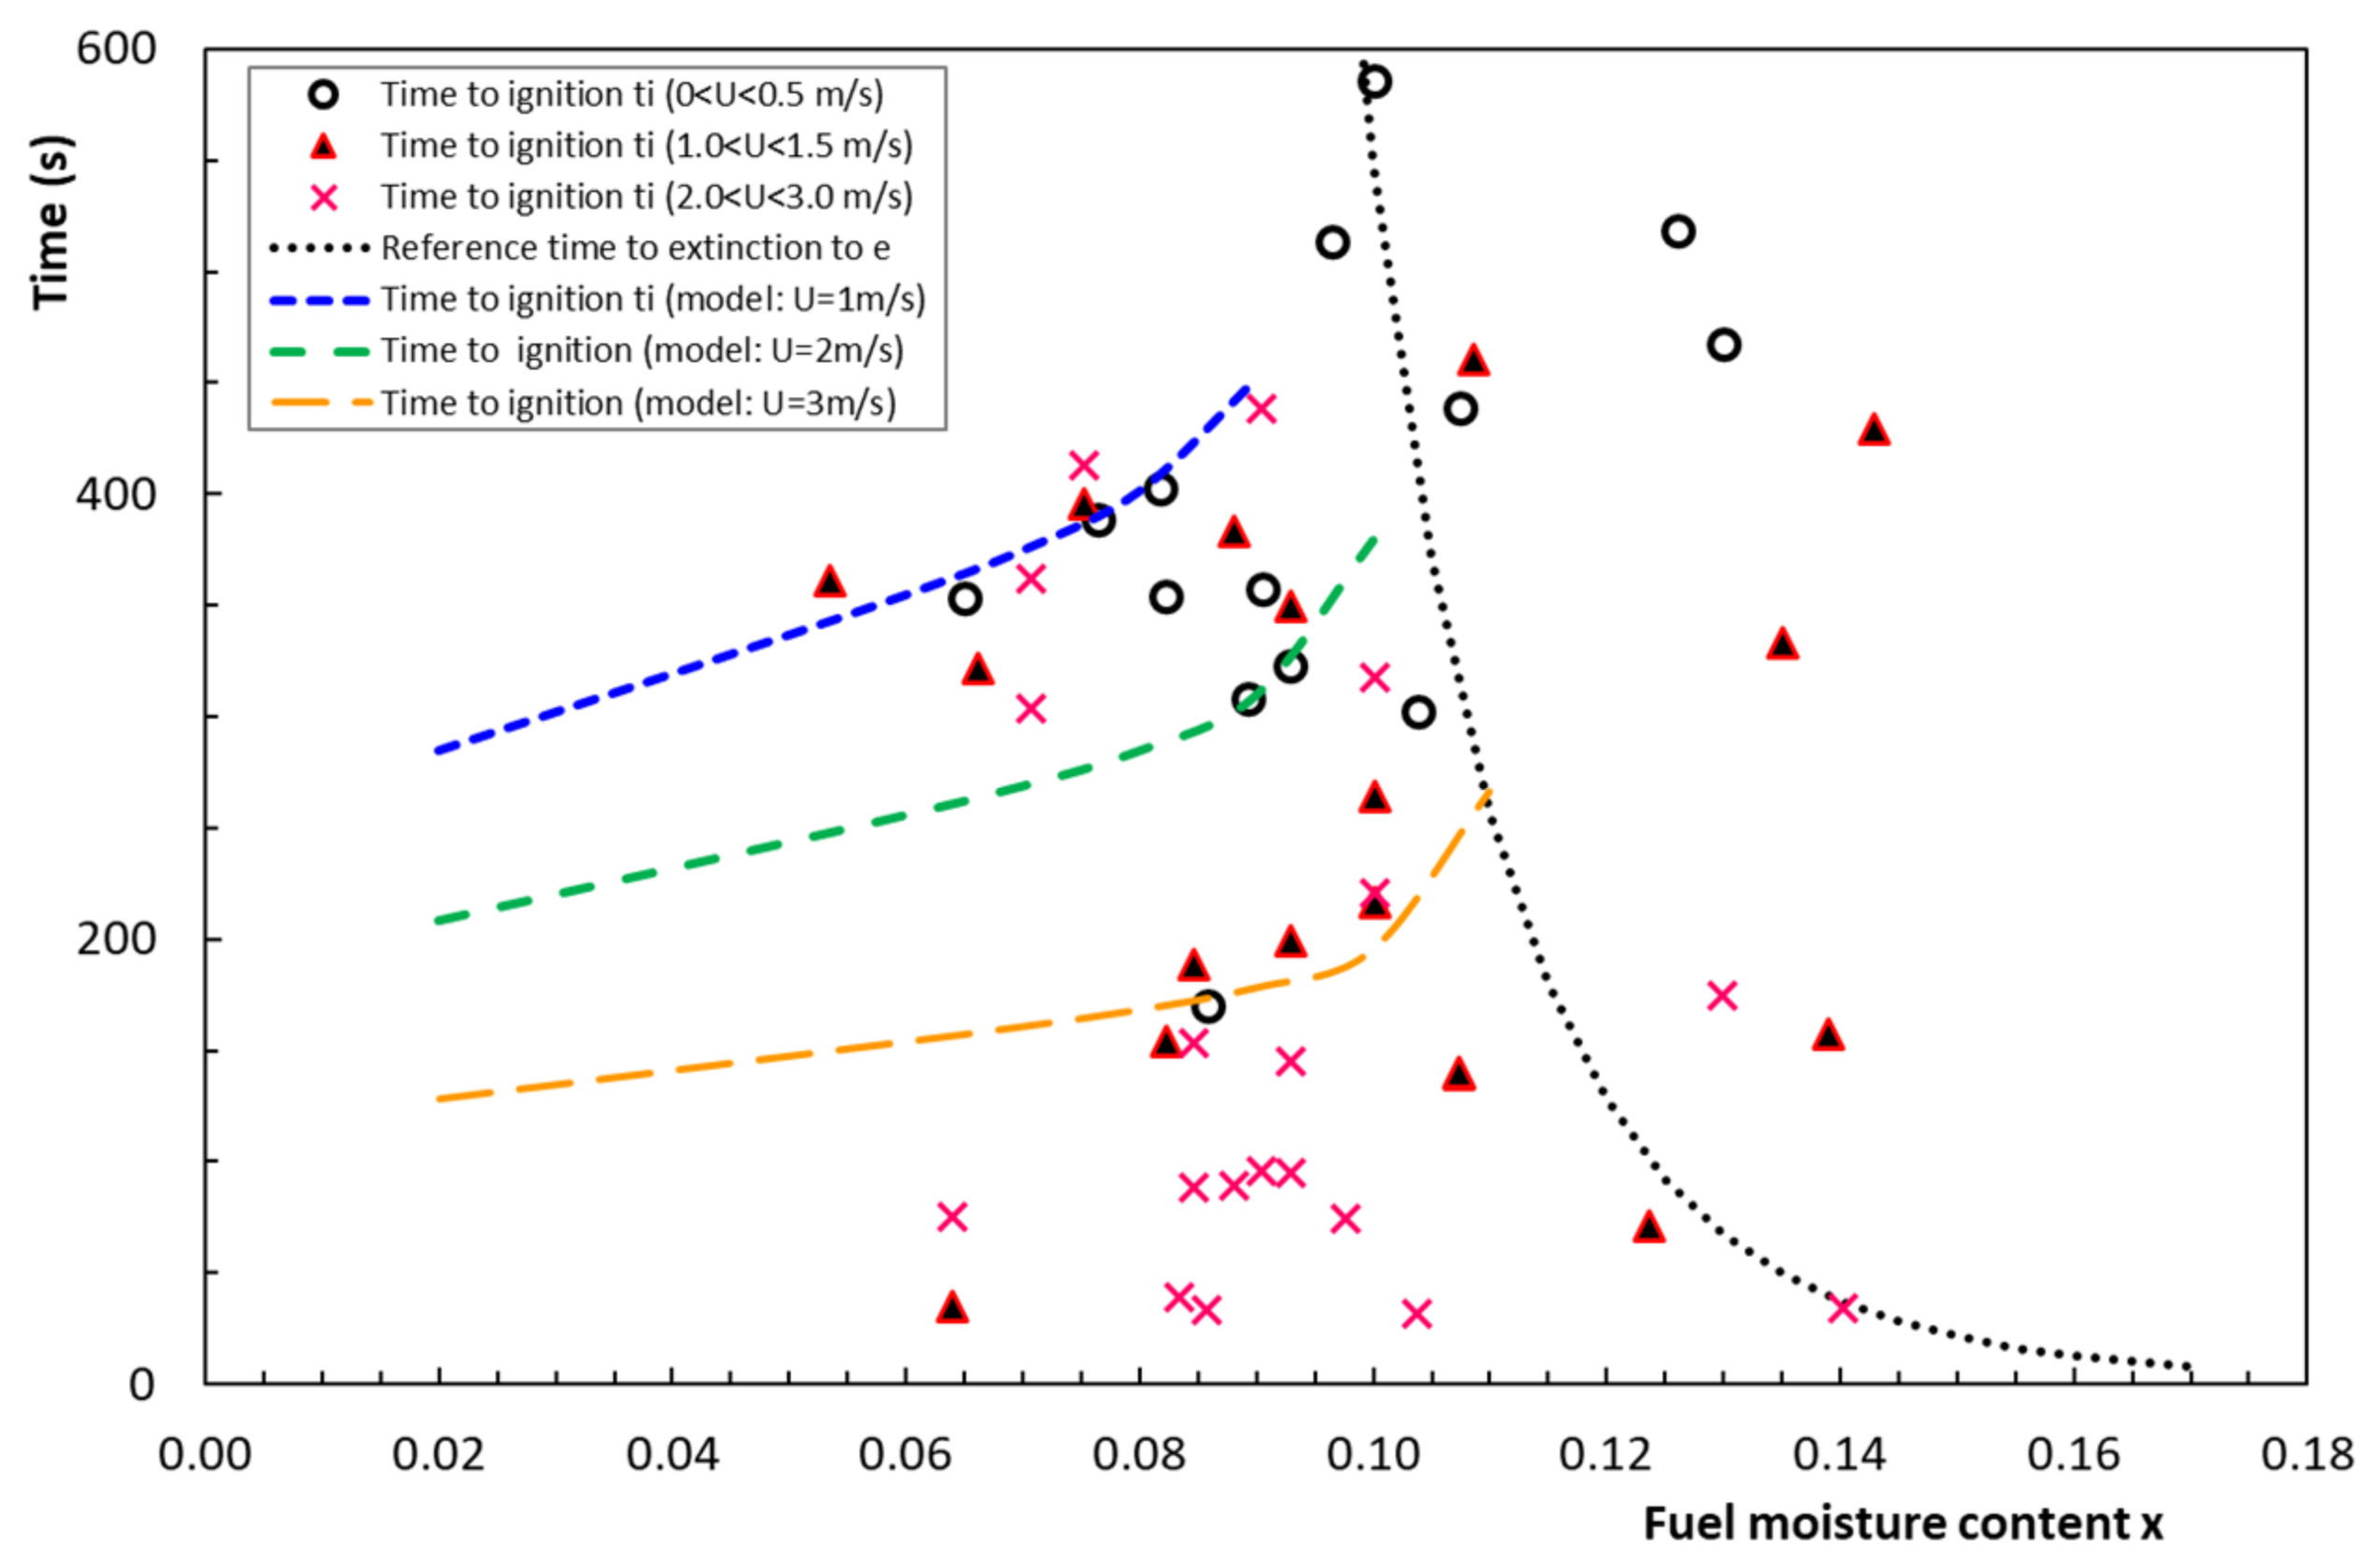
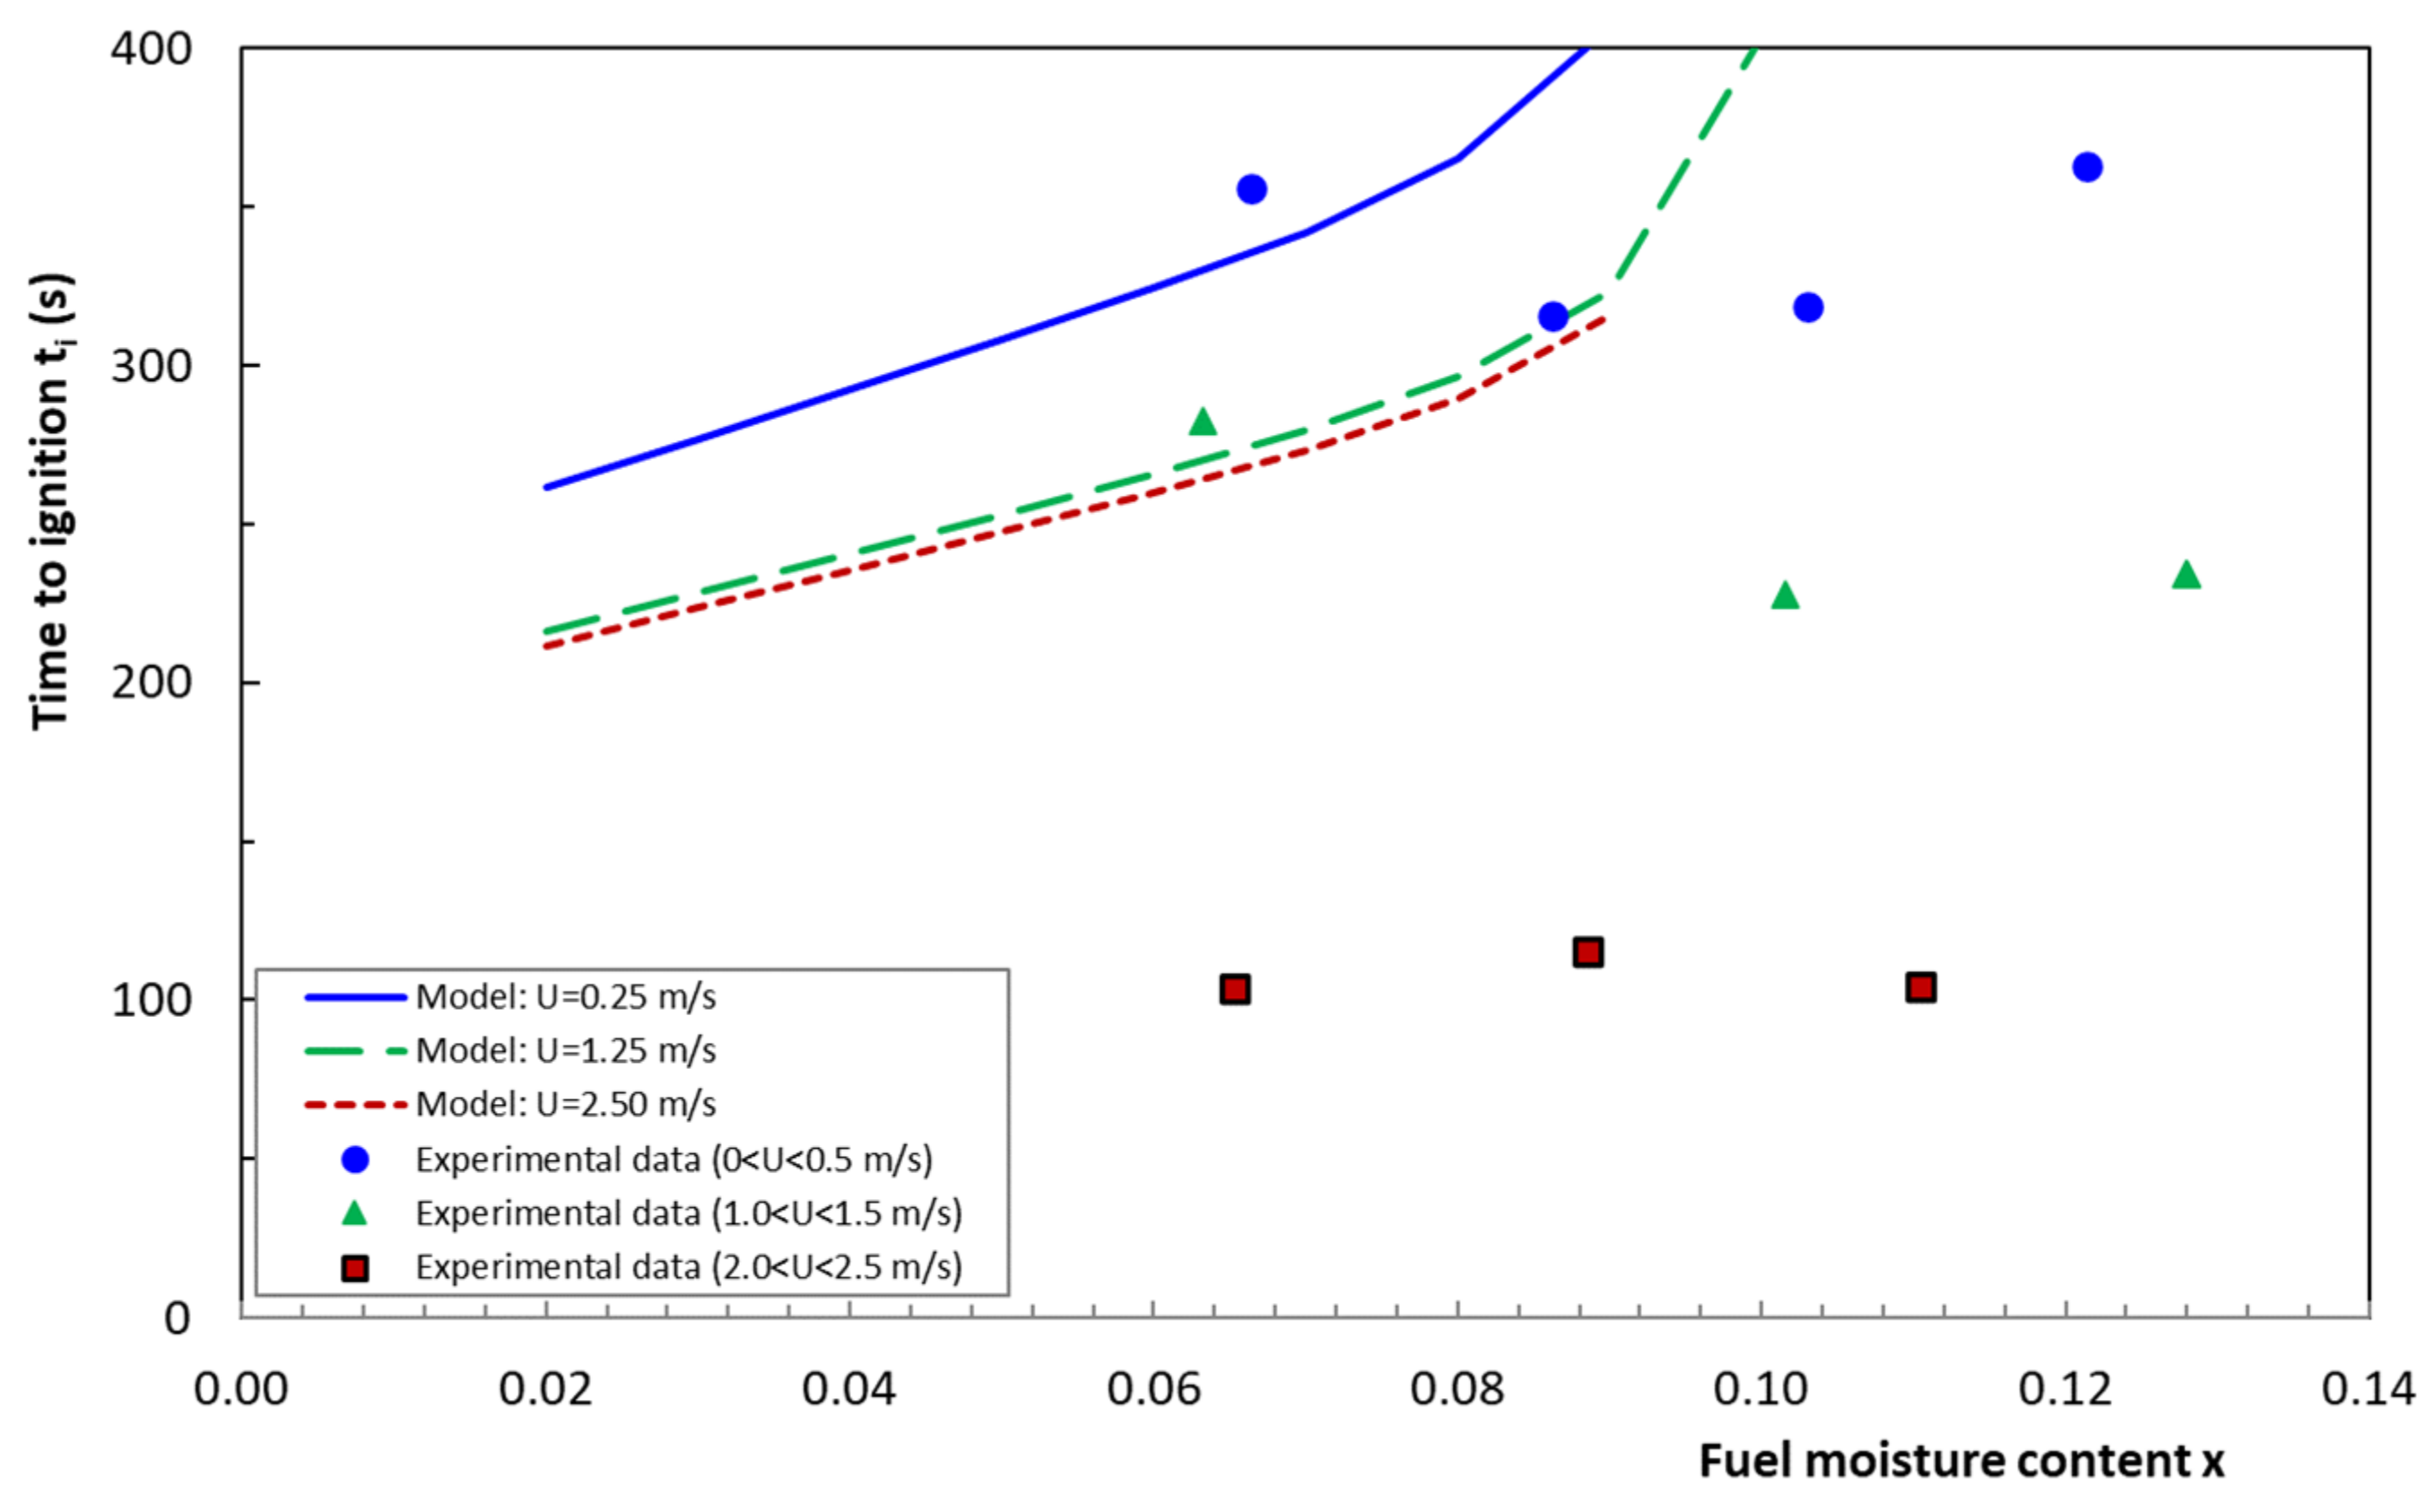
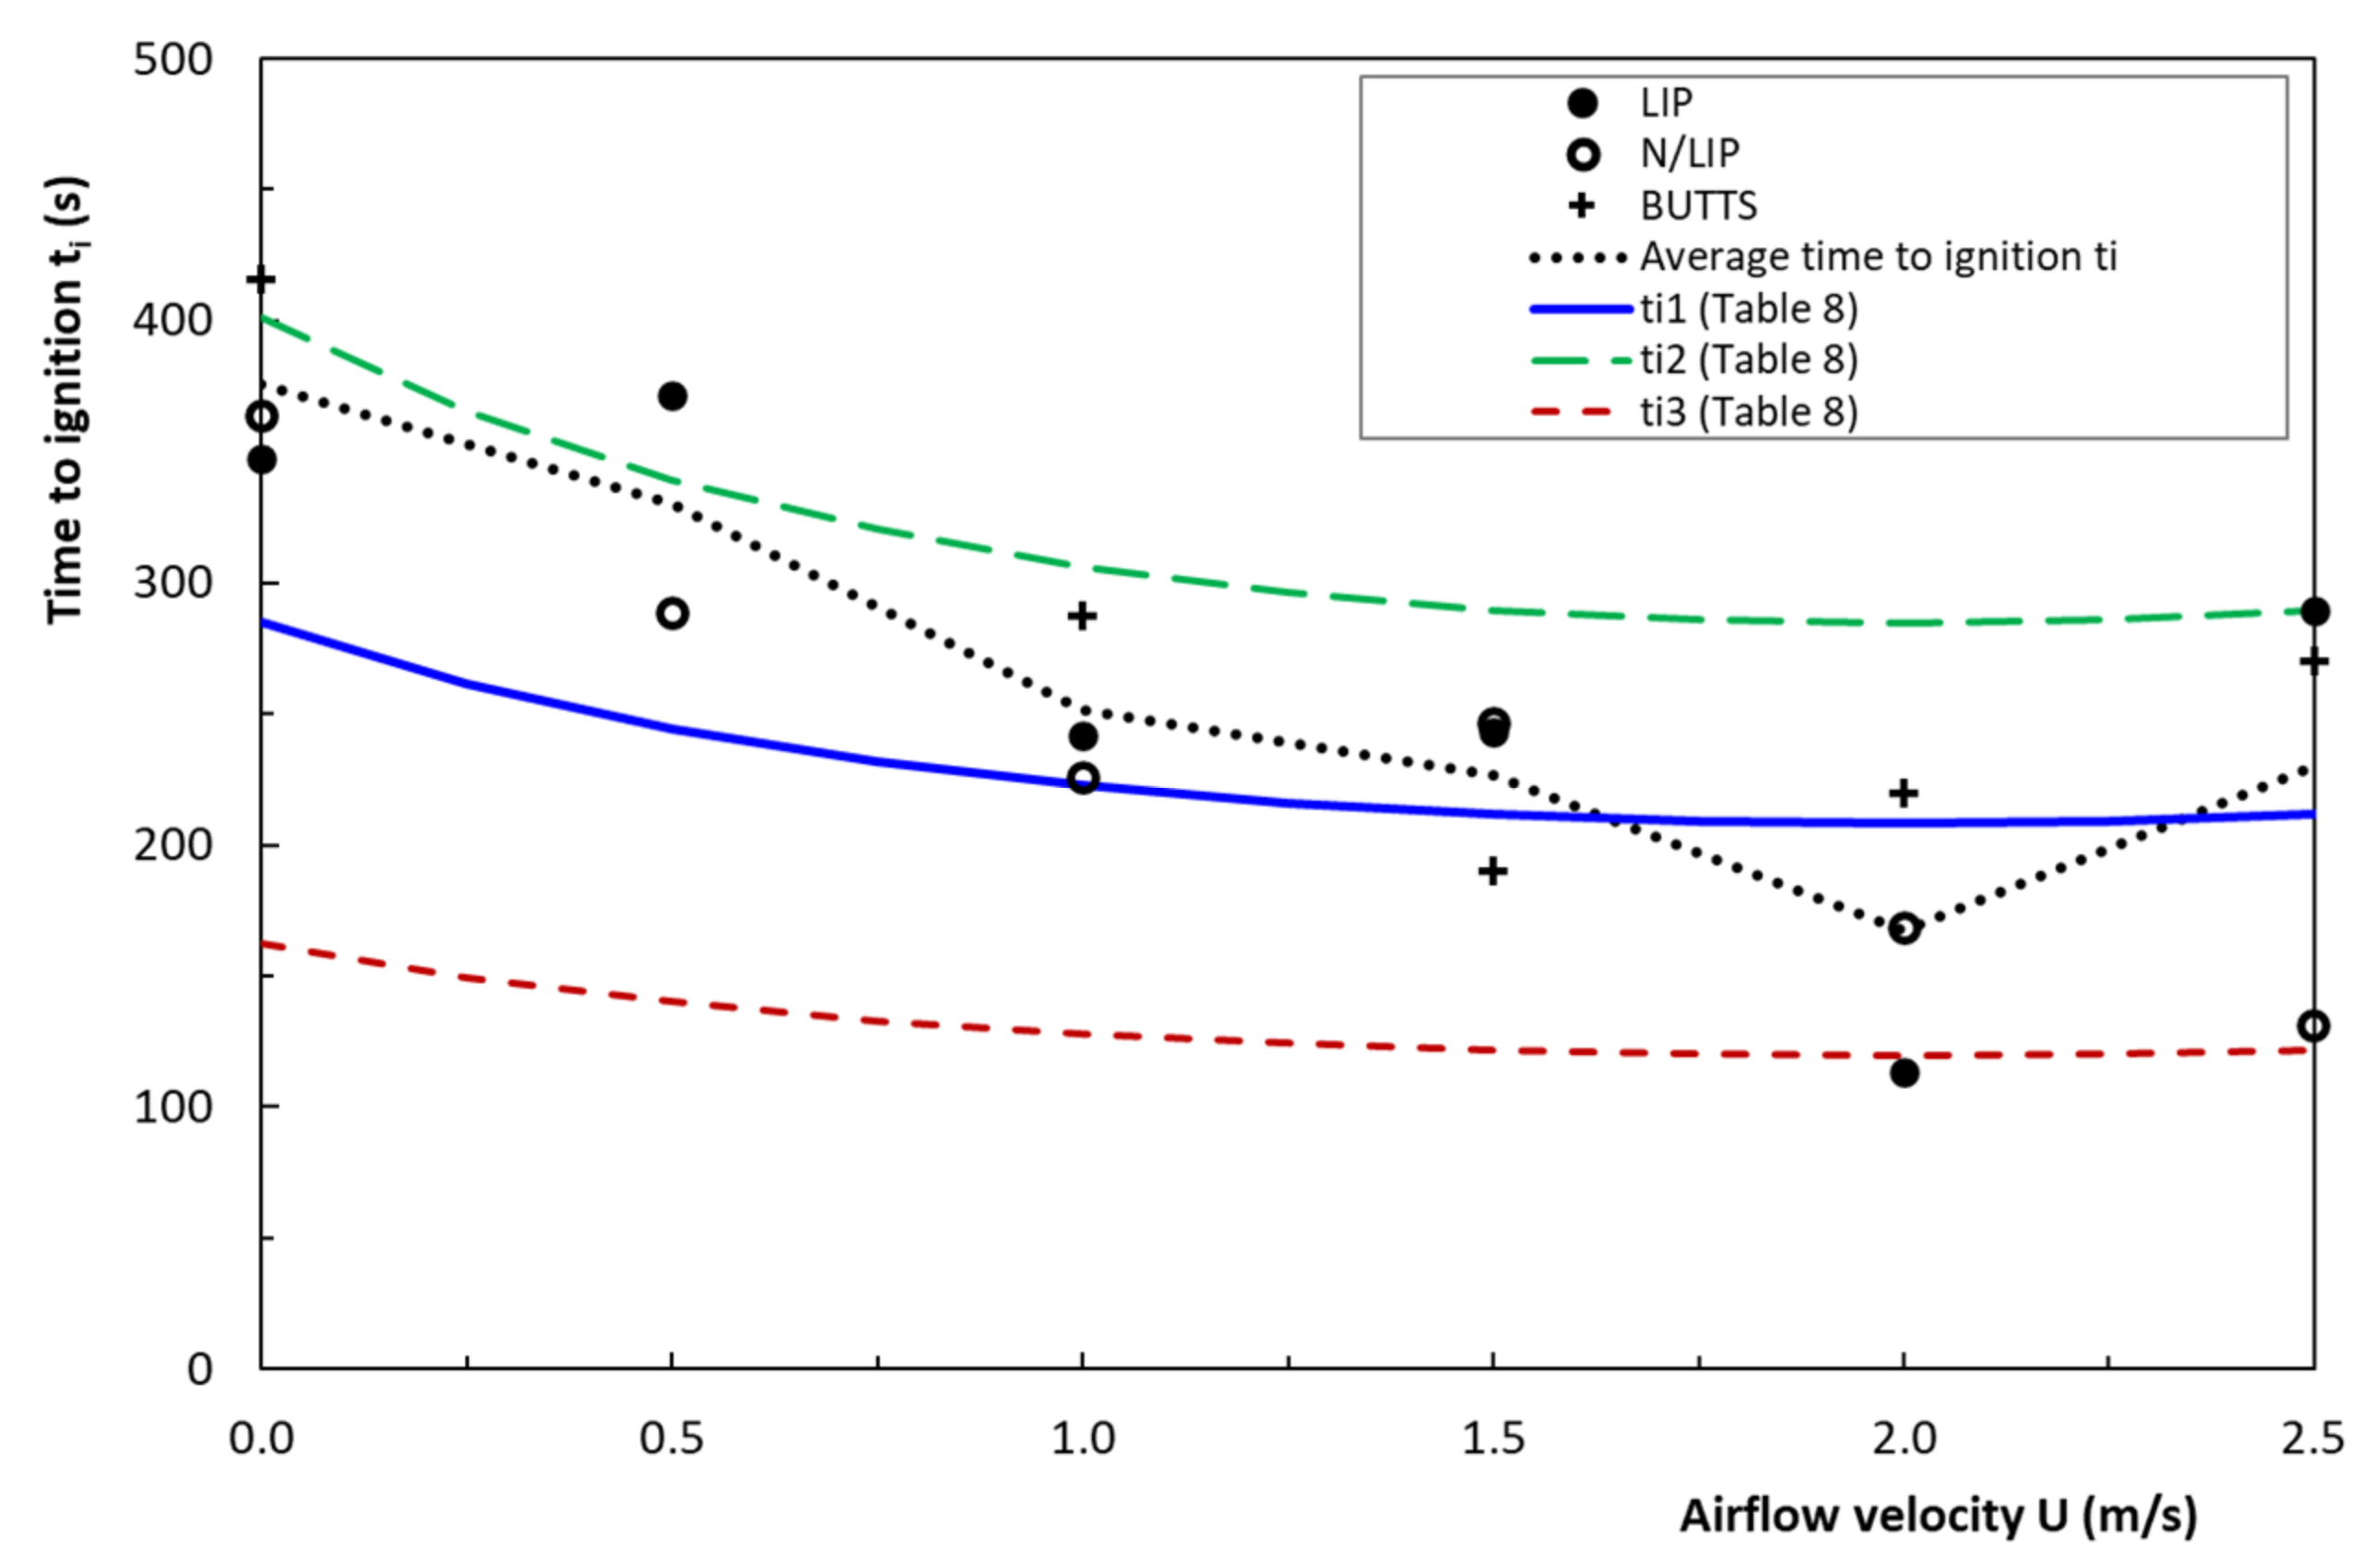
4.5. Time to Ignition

Time to ignition measured in tests (series CS1, CS2 and CS3) in which fuelbed ignited is shown in Figure 12. as a function of x. In this figure, model lines for toe and ti for three values of flow velocity are shown as well. The parameters of these lines are given Table 6 These curves seem to follow the trend of experimental results, although lower values of ti were registered.
Several authors, namely [13], agree that under zero wind conditions or above a certain fuel bed moisture content value, cigarettes are not likely to cause fire ignitions. In order to assess better the roles of x and U separately, the previous tests were grouped by ranges of constant values of U or x and average values of ti were calculated for each group. In Figure 13 average values of ti for groups of tests with constant values of U are shown as a function of x. The ranges of U were 0.0–0.5 m.s−1; 1.0–1.5 m.s−1 and 2–3 m.s−1 with average reference values of 0.25 m.s−1, 1.25 m.s−1 and 2.5 m.s−1, respectively, as indicated in the legend of the figure. Model predictions using the parameters given in Table 7 are plotted Figure 13 Although the agreement is not perfect the model provides an indication of the trend of these two parameters.
As the values of ti showed a low dependence on x, the results of average values of ti for all tests were grouped in three sets depending on the type of cigarette as plotted in Figure 14 As mentioned before, these results were used to determine the value of U1 ≈ 2 m.s−1 that minimizes ti. The model predictions for x = 0.02 and 0.08 were plotted in Figure 14 with label ti1 and ti2, respectively (Table 8). Although these curves include most data points between them, there are some outlier ti values that are better described by the line ti3 computed for x = 0.02 and m1 = m2 = 0.005 g. This result suggested that possibly for low values of x and for UU1 the effective mass of straw that is required for ignition to occur is less than for other situations.

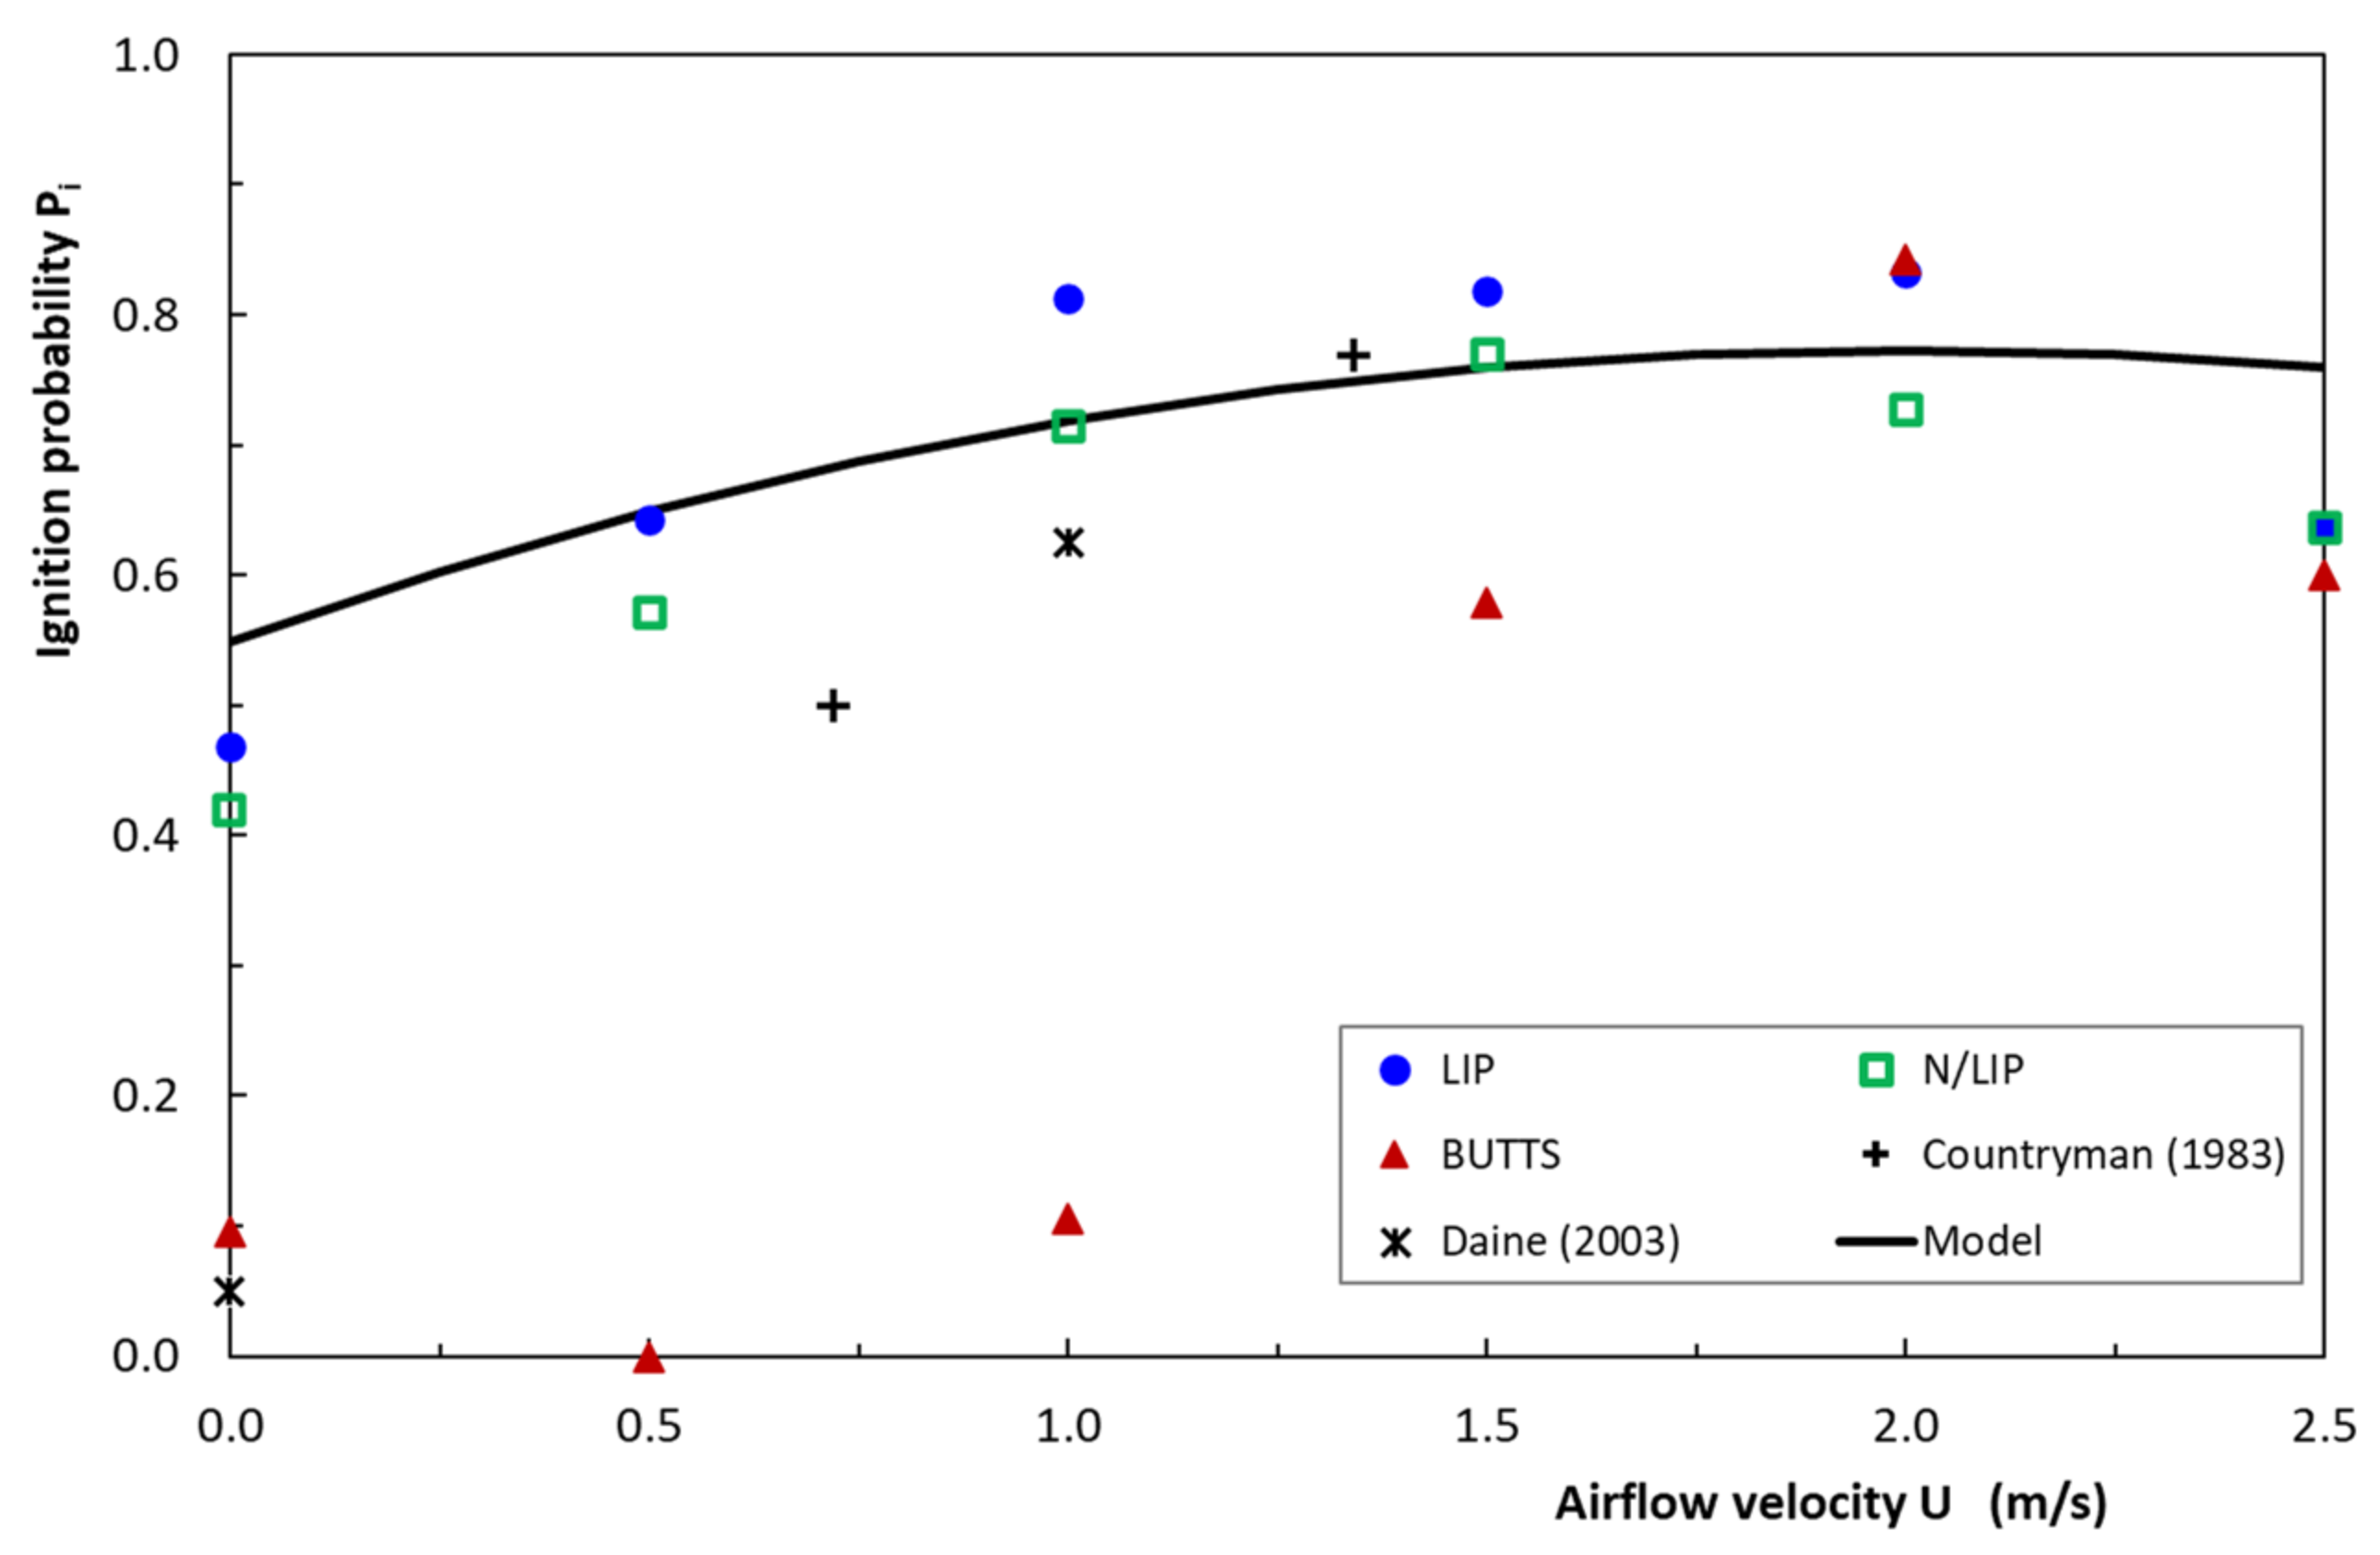
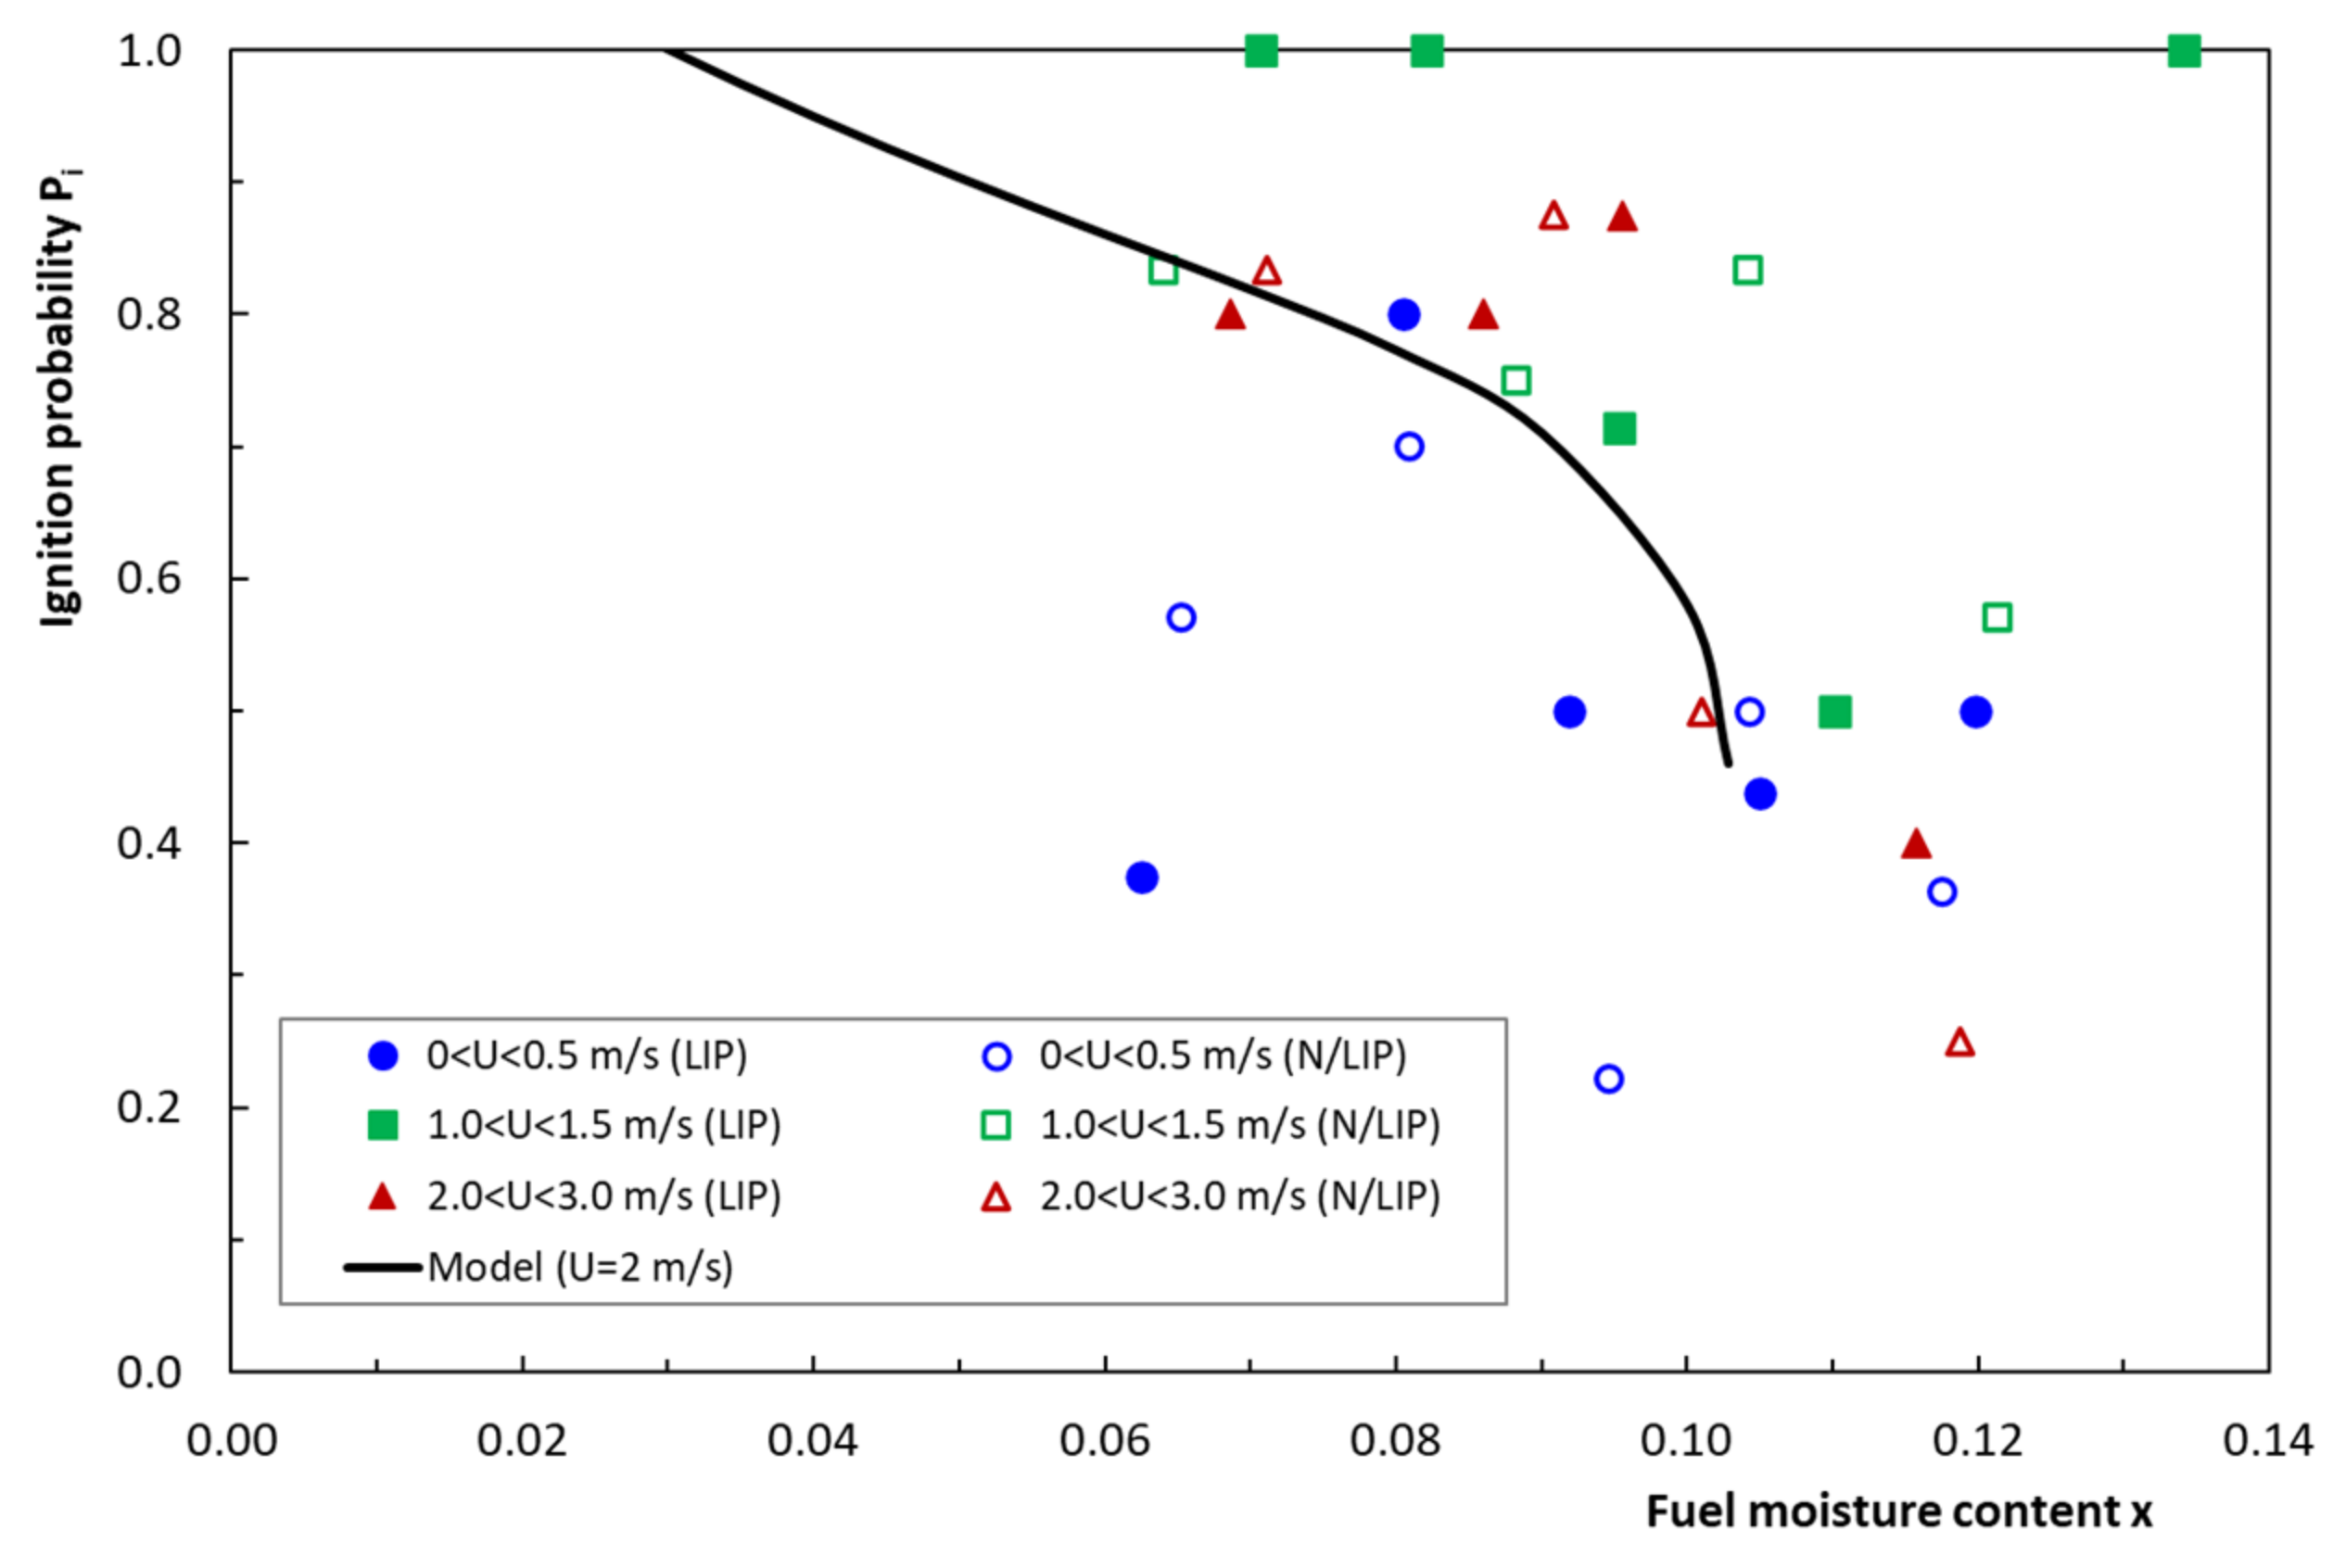
4.6. Ignition Probability

The occurrence of ignition is the opposite of having extinction and the result of each experiment according to this parameter was therefore binary. In order to smooth data and to make its analysis more meaningful, average values of the number of ignitions divided by the total number of tests in a given range of parameters was used as a measure of the ignition probability Pi for those test conditions.
In Figure 15, the average values of Pi for the three types of cigarettes tested are shown as a function of U. As can be seen, there is no major difference between the entire cigarettes LIP and N/LIP. Cigarette butts with 4 cm present a very low or zero probability of ignition for values of U ≤ 1.5 m.s−1. Some data points from [7,9] are shown in that figure as well. In spite of the fact that the reference flow velocity is not the same in the three sets of experiments, the data points follow the same trend. The full line shown in Figure 15 corresponds to the prediction model for Pi. The following set of values of model parameters were used: x = 0.08; m1 = 0.01 g and k = 220. Is it possible to verify a reasonable fit between the model and the experimental data. Reference [13] found a similar dependence on the probability of ignition with flow velocity, although their reference values are much higher than the present ones possibly due to the different forms those authors used to build and characterize their flow.
The values of Pi for LIP and N/LIP cigarettes in tests for different ranges of U are shown in Figure 16 as a function of x. Our results are similar to those of [13] and show that in the present test conditions the probability of having an ignition is very high for x < 0.08 and decreases rapidly with practically no ignitions for x > 0.13. The full line shown in this figure is the present model prediction of Pi for the following set of parameters: U = 2.0 m.s−1; m1 = 0.01 g and k = 220. Once again, we find a good agreement between experimental results and the trends of the model showing that in spite of the simplifications that were made and the crude estimation of some parameters, the prediction of relevant parameters can be made.

5. Conclusions

A conceptual model to estimate the physical process of ignition of a porous fuel bed by a burning cigarette was proposed. This model is based on the analysis of an integrated burning process comprehending two paths of two stages: (1) fuel bed dehydration, (2a) extinction or (2b) pyrolysis and ignition with flaming combustion. The possibility of cigarette extinction that can be observed in any stage, but mostly during the dehydration stage, was also analysed.
The model puts in evidence the main parameters involved in these processes—x, xT, U—and assumes some simplified relationships between them in order to overcome the lack of detailed knowledge about the various processes and to provide an analytical solution for the evaluation of the duration of dehydration and ignition periods. Original models of moisture damping in the dehydration phase and of combustion enhancement in the pyrolysis phase are proposed and seem to be supported well by the extensive experimental program that was performed. A simple concept of estimating the probability of ignition as being inversely proportional to the time to ignition is also supported by experimental data.
The laboratory results showed that there was no relevant difference in the ignition probability between LIP and non-LIP cigarettes. This results from the fact that the conception of the LIP cigarettes took into account indoor conditions without the presence of wind. It appears that this fire risk reduction is not extended to the outdoor conditions of wildfires which are the central focus of this study.
This study should be extended to other types of cigarettes and forest fuels and a better evaluation of the intermediate relationships between the involved parameters in order to extend the validation of the model. The influence of cigarette and fuel types and some mechanisms like the type of contact between the cigarette and the fuel bed, or the position of the cigarette in relation to the fuel bed surface and to wind direction should be more deeply studied. The present model should also be tested with other burning particles like those that occur in spot fire, initiating mechanism as the process of ignition must be very similar.

Author Contributions

D.X.V. coordinated the paper, conceptualising it in terms of original idea and methodology. He led the writing and developed the models presented. R.O. performed the laboratory tests, participating in the data analisys. M.A. was deeply involved in the conceptualisation of the original idea, methodology definition, data analysis, reviewing and editing of the paper. D.K. was involved in the original conceptualisation of the work presented. All authors have read and agreed to the published version of the manuscript.

Funding

This research was funded by the European Commission through the project FirEUrisk, (Grant agreement ID: 101003890).

Acknowledgments

The authors wish to express their gratitude to their colleagues Jorge Raposo and Nuno Luís for their support in the experimental program.

Conflicts of Interest

The authors declare no conflict of interest.

Symbols

SymbolUnitsDescription
φ-Angle of cigarette in relation to wind velocity
α-Angle of cigarette with horizontal plane
αos−1Damping coefficient in Equation (22)
α1s−1Coefficient in Equation (23)
α2-Exponent in Equation (23)
β-Coefficient in Equation (32)
β1s−1Time constant in fuel combustion process
γTkg.m1Mass of tobacco and paper per unit of length
ΔTiKCharacteristic temperature elevation for particle ignition
ΔTwKCharacteristic temperature elevation for water evaporation
τwPaWall shear stress
ρTkg.m3Apparent density of the cigarette
Flux of energy
amHorizontal dimension of control volume
acJ.s1Parameter in Equation (2)
aGJ.s1Parameter in Equation (7)
asJ.s−1Parameter in Equation (3)
auJ.s.m−2Parameter in Equation (4)
bmHorizontal dimension of control volume
bcJ.m−1Parameter in Equation (2)
brJ.s−1Parameter in Equation (3)
cmVertical dimension of control volume
CpJ.g−1.K−1Heat capacity of fuelbed particles
dmDiameter of the cigarette
EJEnergy of combustion of fuelbed
E1JEnergy absorbed by fuelbed in Phase 1
E2JEnergy absorbed by fuelbed in Phase 2a
EGJTotal enthalpy in the control volume
E c ˙ J.s−1Gain of energy due to combustion
E G ˙ J.s−1Global energy balance
E G ˙ 1 J.s−1Modified energy balance during Phase 1
E G ˙ J.s−1Modified energy balance
E G ˙ 2 J.s−1Modified energy balance during Phase 2a
E G ˙ 1 J.s−1Modified energy balance during Phase 1
E G ˙ 2 J.s−1Modified energy balance during Phase 2a
E r ˙ J.s−1Loss of energy due to radiation
E u ˙ J.s−1Loss of energy due to convection
hfmFuelbed height
HTJ.kg−1combustion yield of tobacco
HwJ.g−1Latent heat of evaporation of water in the fuelbed particles
F mLength of the filter
t mTotal length of cigarette
T mLength of the tobacco filled part of the cigarette
LIP-Lower ignition propensity
ks−1Parameter in Equation (40)
m1kgEffective mass of the fuelbed affected by the cigarette in Phase 1
m2kgEffective mass of the fuelbed affected by the cigarette in Phase 2a
MckgInitial mass of the cigarette
Mfg.m−2Fuelbed load
MFgMass of the filter of the cigarette
MKS-System of units based on the three mechanical units meter, kilogram, and second
MTkgMass of tobacco and paper contents of the cigarette
MTSkgMass of tobacco and paper without water content
m T ˙ kg.s−1Mass loss rate of cigarette
N/LIP-No LIP (Lower ignition propensity)
Pi-Probability of ignition of the fuelbed by a cigarette
Rcm.s−1Rate of combustion of the cigarette
RAD Average relative deviation
RIP-Reduced ignition propensity
Sm−2Surface
Scm−2Surface of the control volume
tsTime measured since drop of cigarette on fuelbed
ToKAmbient gas temperature
to1sReference time in Phase 1
to2sReference time in Phase 2
toesReference time of extinction
t1sTime required to end Phase 1
t2sTime required since the end of Phase 1 to achieve ignition
tcsTime to cigarette consumption or burn out
tesTime to cigarette and overall combustion extinction
tisTime to fuelbed ignition
ti2sTime to fuelbed ignition in Phase 2a
T0KInitial value of ambient temperature
TwKTemperature of water evaporation
TiKTemperature of particle ignition
T’iKCharacteristic temperature of particle ignition
T’wKCharacteristic temperature of water evaporation
Um.s−1Reference wind or flow velocity
U1m.s−1Flow velocity that maximizes heat release
Ucm.s−1Critical flow velocity
uτm.s−1Friction velocity
Vm3Volume
Vcm3Volume control
x-Fraction of water in the fuelbed referred to its dry mass
x1-Fraction of water in the fuelbed referred to its dry mass after Phase 1
xT-Fraction of water in the cigarette referred to its dry mass

References

  1. Chapman, S.; Balmain, A. Time to legislate for fire-safe cigarettes in Australia. Med. J. Aust. 2004, 181, 292–293. [Google Scholar] [CrossRef] [PubMed]
  2. Loureiro, M. Ignição de Combustíveis Florestais por Partículas com Elevada Temperatura. Master’s Thesis, University of Coimbra, 2008. Available online: https://www.academia.edu/44971705/_Igni%C3%A7%C3%A3o_de_Combust%C3%ADveis_Florestais_por_Part%C3%ADculas_com_Elevada_Temperatura_por_M%C3%A1rio_Loureiro_UC_Igni%C3%A7%C3%A3o_de_Combust%C3%ADveis_Florestais_por_Part%C3%ADculas_com_Elevada_Temperatura (accessed on 19 May 2021). (In Portuguese).
  3. Galante, M. As Causas dos Incêndios Florestais em Portugal Continental. In Proceedings of the 5th Congresso Florestal Nacional, Lisboa, Portugal, 16–19 May 2005; Galante, M., Ed.; Direcção-Geral dos Recursos Florestais, Divisão de Defesa da Floresta Contra Incêndios, DGRF: Lisboa, Portugal, 2005. (In Portuguese). [Google Scholar]
  4. Fire Program Statistics. U.S. Fish and Wildlife Service. Available online: www.fws.gov/fire/program_statistics/ (accessed on 19 May 2021).
  5. Seccion de Estadisticas Historicas CONAF (Chile). Available online: http://www.conaf.cl/proteccion/seccion-estadisticas-historicas.html (accessed on 19 May 2021).
  6. Kim, D.H.; Lee, M.B.; Viegas, D.X. Ignition of Surface Fuels by Cigarette in Forest Fire. In VI International Conference on Forest Fire Research, 1st ed.; Viegas, D.X., ADAI-CEIF, Eds.; ADAI-CEIF; University of Coimbra: Coimbra, Portugal, 2010; ISBN 978-989-20-2157-7. [Google Scholar]
  7. Countryman, C.M. Cigarette Temperatures and Burning Rates; USDA Forest Service; Pacific Southwest Forest; Range Experiment Station; US Forest Service: Riverside, CA, USA, 1982. Available online: http://legacy.library.ucsf.edu/tid/kvr81b00 (accessed on 19 May 2021).
  8. Countryman, C.M. Ignition of Grass Fuels by Cigarettes, Fire Management Notes; USDA Forest Service; Pacific Southwest Forest; Range Experiment Station: Riverside, CA, USA, 1983; Volume 44, pp. 3–7. Available online: http://books.google.pt/books/about/Ignition_of_Grass_Fuels_by_Cigarettes.html?id=8w3oHAAACAAJ&redir_esc=yAuthor (accessed on 19 May 2021).
  9. Dainer, J. Can Cigarette Butts Start Bushfires? Ph.D. Thesis, Forensic Science, University of Technology, Sydney, Australia, 2003. [Google Scholar]
  10. Galtié, J.F. Quantifying the propensity of cigarettes to initiate wildland fire in Mediterranean environment. For. Ecol. Manag. 2006, 234, S237–S265. [Google Scholar] [CrossRef]
  11. Xanthopoulos, G.; Ghosn, D.; Kazakis, G. Investigation of the wind speed threshold above which discarded cigarettes are likely to be moved by the wind. Int. J. Wildland Fire 2006, 15, 567–576. [Google Scholar] [CrossRef]
  12. Project Fire Paradox. D3.1–5 Probability of Ignition Modelling in Forest Fuels—First Results. 2006. Available online: http://fireintuition.efi.int/metadata-browser.fire?i=6181ea5733188d27624eeae341b96ff7 (accessed on 19 May 2021).
  13. Sun, P.; Zhang, Y.; Sun, L.; Hu, H.; Guo, F.; Wang, G.; Zhang, H. Influence of Fuel Moisture Content, Packing Ratio and Wind Velocity on the Ignition Probability of Fuel Beds Composed of Mongolian Oak Leaves via Cigarette Butts. Forests 2018, 9, 507. [Google Scholar] [CrossRef] [Green Version]
  14. McRae, D.D.; Kellogg, D.S.; Waymack, B.E.; Fournier, L.G.; Dwyer, R.W. Modification of the NIST Test for measuring the Ignition Propensity of Cigarettes. J. Fire Sci. 2000, 18, 215–241. [Google Scholar] [CrossRef]
  15. Baker, R.R.; Coburn, S.; Liu, C.; McAdam, K.G. The science behind the development and performance of reduced ignition propensity cigarettes. Fire Sci. Rev. 2016, 5, 2. [Google Scholar] [CrossRef] [Green Version]
  16. Viegas, D.X.; Neto, L.P. Wall shear-stress as a Parameter to Correlate the Rate of Spread of a Wind Induced Forest Fire. Int. J. Wildland Fire 1991, 1, 177–188. [Google Scholar] [CrossRef]
  17. Costa, F.S. Natural Smouldering of Cigarettes. In Proceedings of the HT2003 ASME Summer Heat Transfer Conference, Las Vegas, NV, USA, 21–23 July 2003. [Google Scholar] [CrossRef]
  18. Viegas, D.X.; Gabbert, W.; Figueiredo, A.R.; Almeida, M.A.; Reva, V.; Ribeiro, L.M.; Viegas, M.T.; Oliveira, R.; Raposo, J.R. Relatório do Incêndio Florestal de Tavira/São Brás de Alportel, 18–22 Julho 2012; Centro de Estudos sobre Incêndios Florestais, ADAI/LAETA, Universidade de Coimbra: Coimbra, Portugal, 2012. Available online: http://www.portugal.gov.pt/pt/os-ministerios/ministerio-da-administracao-interna/documentos-oficiais/20121010-rel-incendio-florestal-tavira-jul2012.aspx (accessed on 19 May 2021).
  19. Almeida, M.A.; Viegas, D.X.; Miranda, A.I.; Reva, V. Effect of particle orientation and of flow velocity on the combustibility of Pinus pinaster and Eucalyptus globulus firebrand material. Int. J. Wildland Fire 2011, 20, 946–962. [Google Scholar] [CrossRef]
Figure 1. General view of the control volume of the system composed of a cigarette, the fuel bed and the surrounding flow.
Fire 04 00035 g001
Figure 2. (a) Geometric properties of a cigarette; (b) Definition of inclination angle α; (c) Definition of angle φ for a cigarette in the horizontal plane (α = 0º) subject to a flow with characteristic velocity U.
Fire 04 00035 g002
Figure 3. Comparison between direct measurements of mass loss ratio T of a cigarette with estimated values T* derived from the rate of combustion from Equation (14).
Fire 04 00035 g003
Figure 4. Variation of mass loss ratio with slope angle α of the cigarette for Ignition Propensity (LIP) cigarettes and No Lower Ignition Propensity (N/LIP) cigarettes.
Fire 04 00035 g004
Figure 5. Variation of rate of combustion as a function of flow angle φ for LIP cigarettes for U = 2 m.s−1.
Fire 04 00035 g005
Figure 6. Rate of combustion of lower ignition propensity cigarettes as a function of flow velocity U (m.s−1) for tests with inclination α = 0º and orientation φ = 0º, and different values of tobacco moisture content xT.
Fire 04 00035 g006
Figure 7. Rate of combustion of Lower Ignition Propensity (LIP) cigarettes as a function of moisture content xT for different values of flow velocity U (m.s−1). The dashed lines correspond to the application of the model (Equation (44)) for values of airflow velocity U = 0, 1, 2, 3 and 4 m.s−1.
Fire 04 00035 g007
Figure 8. Values of t1 (dehydration time) as a function of fuel moisture content x in tests with fuel bed ignition. The curves correspond to model predictions for: Case (a) U = 1 m.s−1 and Case (b) U = 2 m.s−1.
Fire 04 00035 g008
Figure 9. Values of extinction time te of cigarettes with constant moisture value xT as a function of fuel moisture content x (Series CS5). The horizontal lines correspond to burnout times of cigarettes with Rc values that are indicated in the legend.
Fire 04 00035 g009
Figure 10. Values of cigarettes extinction time te as a function of cigarettes moisture value xT on fuel beds with constant value of fuel moisture content x (Series CS4). The dotted line corresponds to tc computed for single cigarettes using Equation (45) for U = 0 m.s−1).
Fire 04 00035 g010
Figure 11. Values of extinction time te as a function of fuel moisture content x for cigarettes under various test conditions (Series CS1 and CS2). The lines correspond to present model prediction of toe and burnout times of cigarettes tc.
Fire 04 00035 g011
Figure 12. Time delay to ignition by cigarettes as a function of fuel bed moisture content x for various values of flow velocity. The curves correspond to model predictions of toe (Equation (23)) and ti (Equation (39)), for three values of flow velocity.
Fire 04 00035 g012
Figure 13. Average values of time delay to ignition ti as a function of fuel bed moisture content x for tests with constant values of wind velocity. The curves correspond to model predictions of ti (Equation (39)), for the parameters given Table 7.
Fire 04 00035 g013
Figure 14. Average values of time to ignition ti as a function of airflow velocity U for tests with Lower Ignition Propensity (LIP), No Lower Ignition Propensity (N/LIP) and butts compared with the model predictions of ti (Equation (39)), for the parameters given in Table 8.
Fire 04 00035 g014
Figure 15. Average values of the ignition probability Pi as a function of the airflow velocity for tests with Lower Ignition Propensity (LIP), No Lower Ignition Propensity (N/LIP) and butts. Results obtained by other authors area also presented and used to be compared with the model prediction (Equation (40)).
Fire 04 00035 g015
Figure 16. Average values of probability of ignition Pi as a function of the fuel bed moisture content x for different values of airflow velocity U for tests with Lower Ignition Propensity (LIP), No Lower Ignition Propensity (N/LIP) and butts; comparison with model prediction (Equation (40)).
Fire 04 00035 g016
Table 1. Statistics of wildfires originated by smoking activity in the period 2000–2009.
CountryTotal Number of WildfiresFires Caused by SmokingPercentage (%)
Portugal [3]611,1117842.27
USA [4]50419117.73
Chile [5]53,3472995.01
Republic of S. Korea [6]570519.8
Table 2. Properties of the cigarettes used in the rate of combustion and fuel bed ignition tests.
Ref.Description Total   Length   c
(mm)
Filter   Length   F
(mm)
Diameter d
(mm)
Initial Mass Mc
(g)
Tobacco Mass MT
(g)
1NO LIP822780.8850.660
2LIP822780.8150.615
3BUTTS402780.3900.195
Table 3. Main parameters of tests with single Lower Ignition Propensity (LIP) cigarettes and No Lower Ignition Propensity (N/LIP).
SeriesCig. TypeNumber of Testsα
(º)
ϕ
(º)
U
(m.s−1)
xT
-
tc
(s)
Rc
(cm.s−1)
mc
(g.s−1)
C1LIP170000.02/0.15351/6670.007/0.130.4/0.8
C2LIP15−90/9000-405/672-0.4/1.1
C3N/LIP15−90/9000-368/618-0.9/1.2
C4LIP39000/40.01/0.13130/5300.08/0.4-
C5LIP1200/1800/30.05/0.11160–4000.08/0.36-
Table 4. Main parameters of the ignition tests with cigarettes and straw fuel beds.
SeriesCig. TypeNumber of TestsU
(m.s−1)
xT
-
x
-
ti
(s)
te
(s)
Pi
-
CS1LIP1040/2.5-0.05/0.1432/65931.5/7720.69
CS2N/LIP840/2.5-0.05/0.1434/62733.6/6590.62
CS3LIP Butts1150/2.5-0.06/0.1548/35048/4990.37
CS4LIP1600.01/0.170.095246/6880
CS5LIP1600.0950.03/0.23459/6520
Table 5. Model parameters used in the cases illustrated in Figure 13.
CaseU (m.s−1)ĖG′ (J.s−1)m1 (g)
to a and t1 a10.01920.0020
to b and t1 a20.02080.0015
Table 6. Model parameters used in the cases illustrated in Figure 12.
CaseU (m.s−1)ĖG’ (J. s−1)m1 (g)
ti 100.01420.01
ti 220.02080.01
ti 330.01920.005
Table 7. Model parameters used in the cases illustrated in Figure 13.
CaseU
(m.s−1)
ĖG
(J.s−1)
m1 (g)
ti 10.250.01570.006
ti 21.250.01990.006
ti 32.250.02070.004
Table 8. Model parameters used in the cases illustrated in Figure 14.
Casexm1 (g)
ti10.020.010
ti20.080.010
ti30.020.005
Publisher’s Note: MDPI stays neutral with regard to jurisdictional claims in published maps and institutional affiliations.

