The Role of Previous Fires in the Management and Expenditures of Subsequent Large Wildfires


Abstract
1. Introduction
2. Conceptual Model of Previous Fire Effects on Subsequent Fires
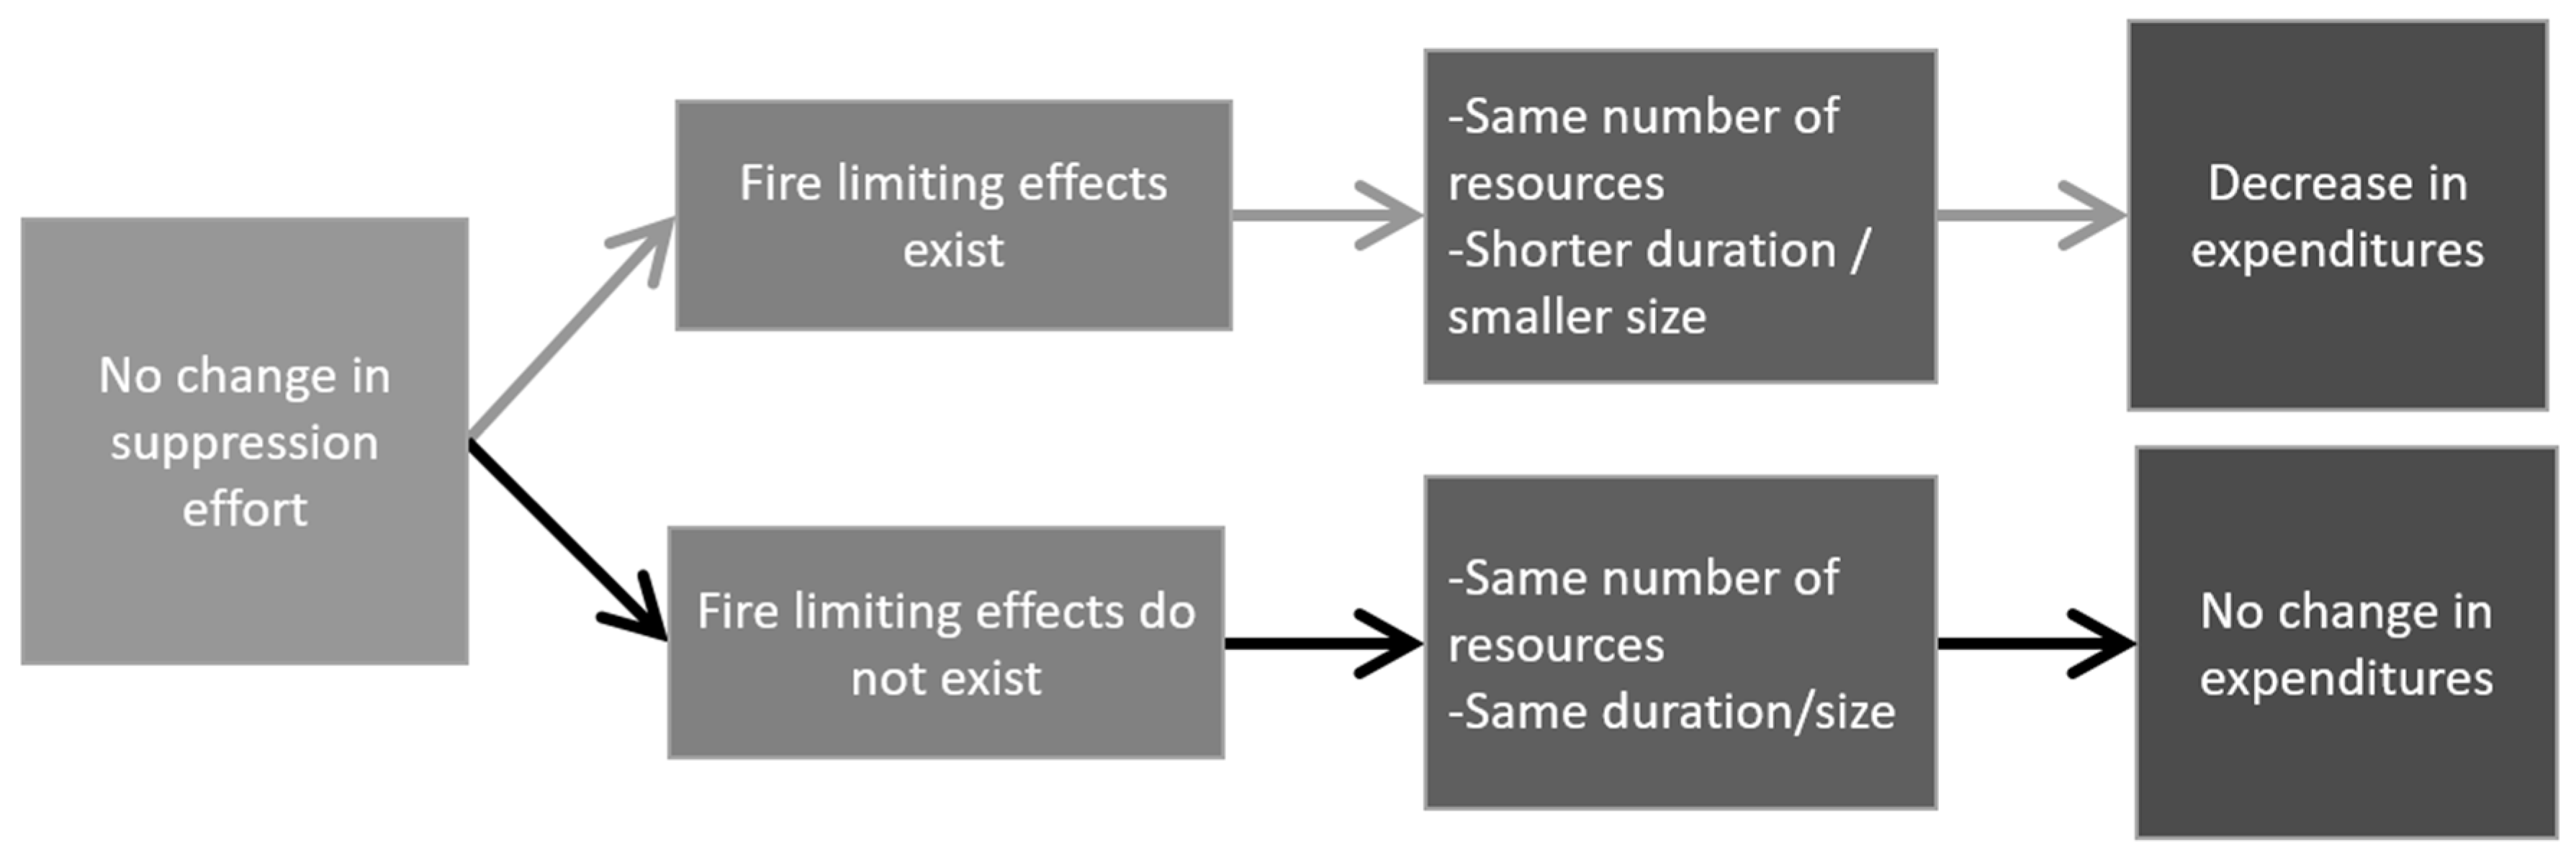
2.1. Fire Limiting Effect, No Change in Suppression Effort
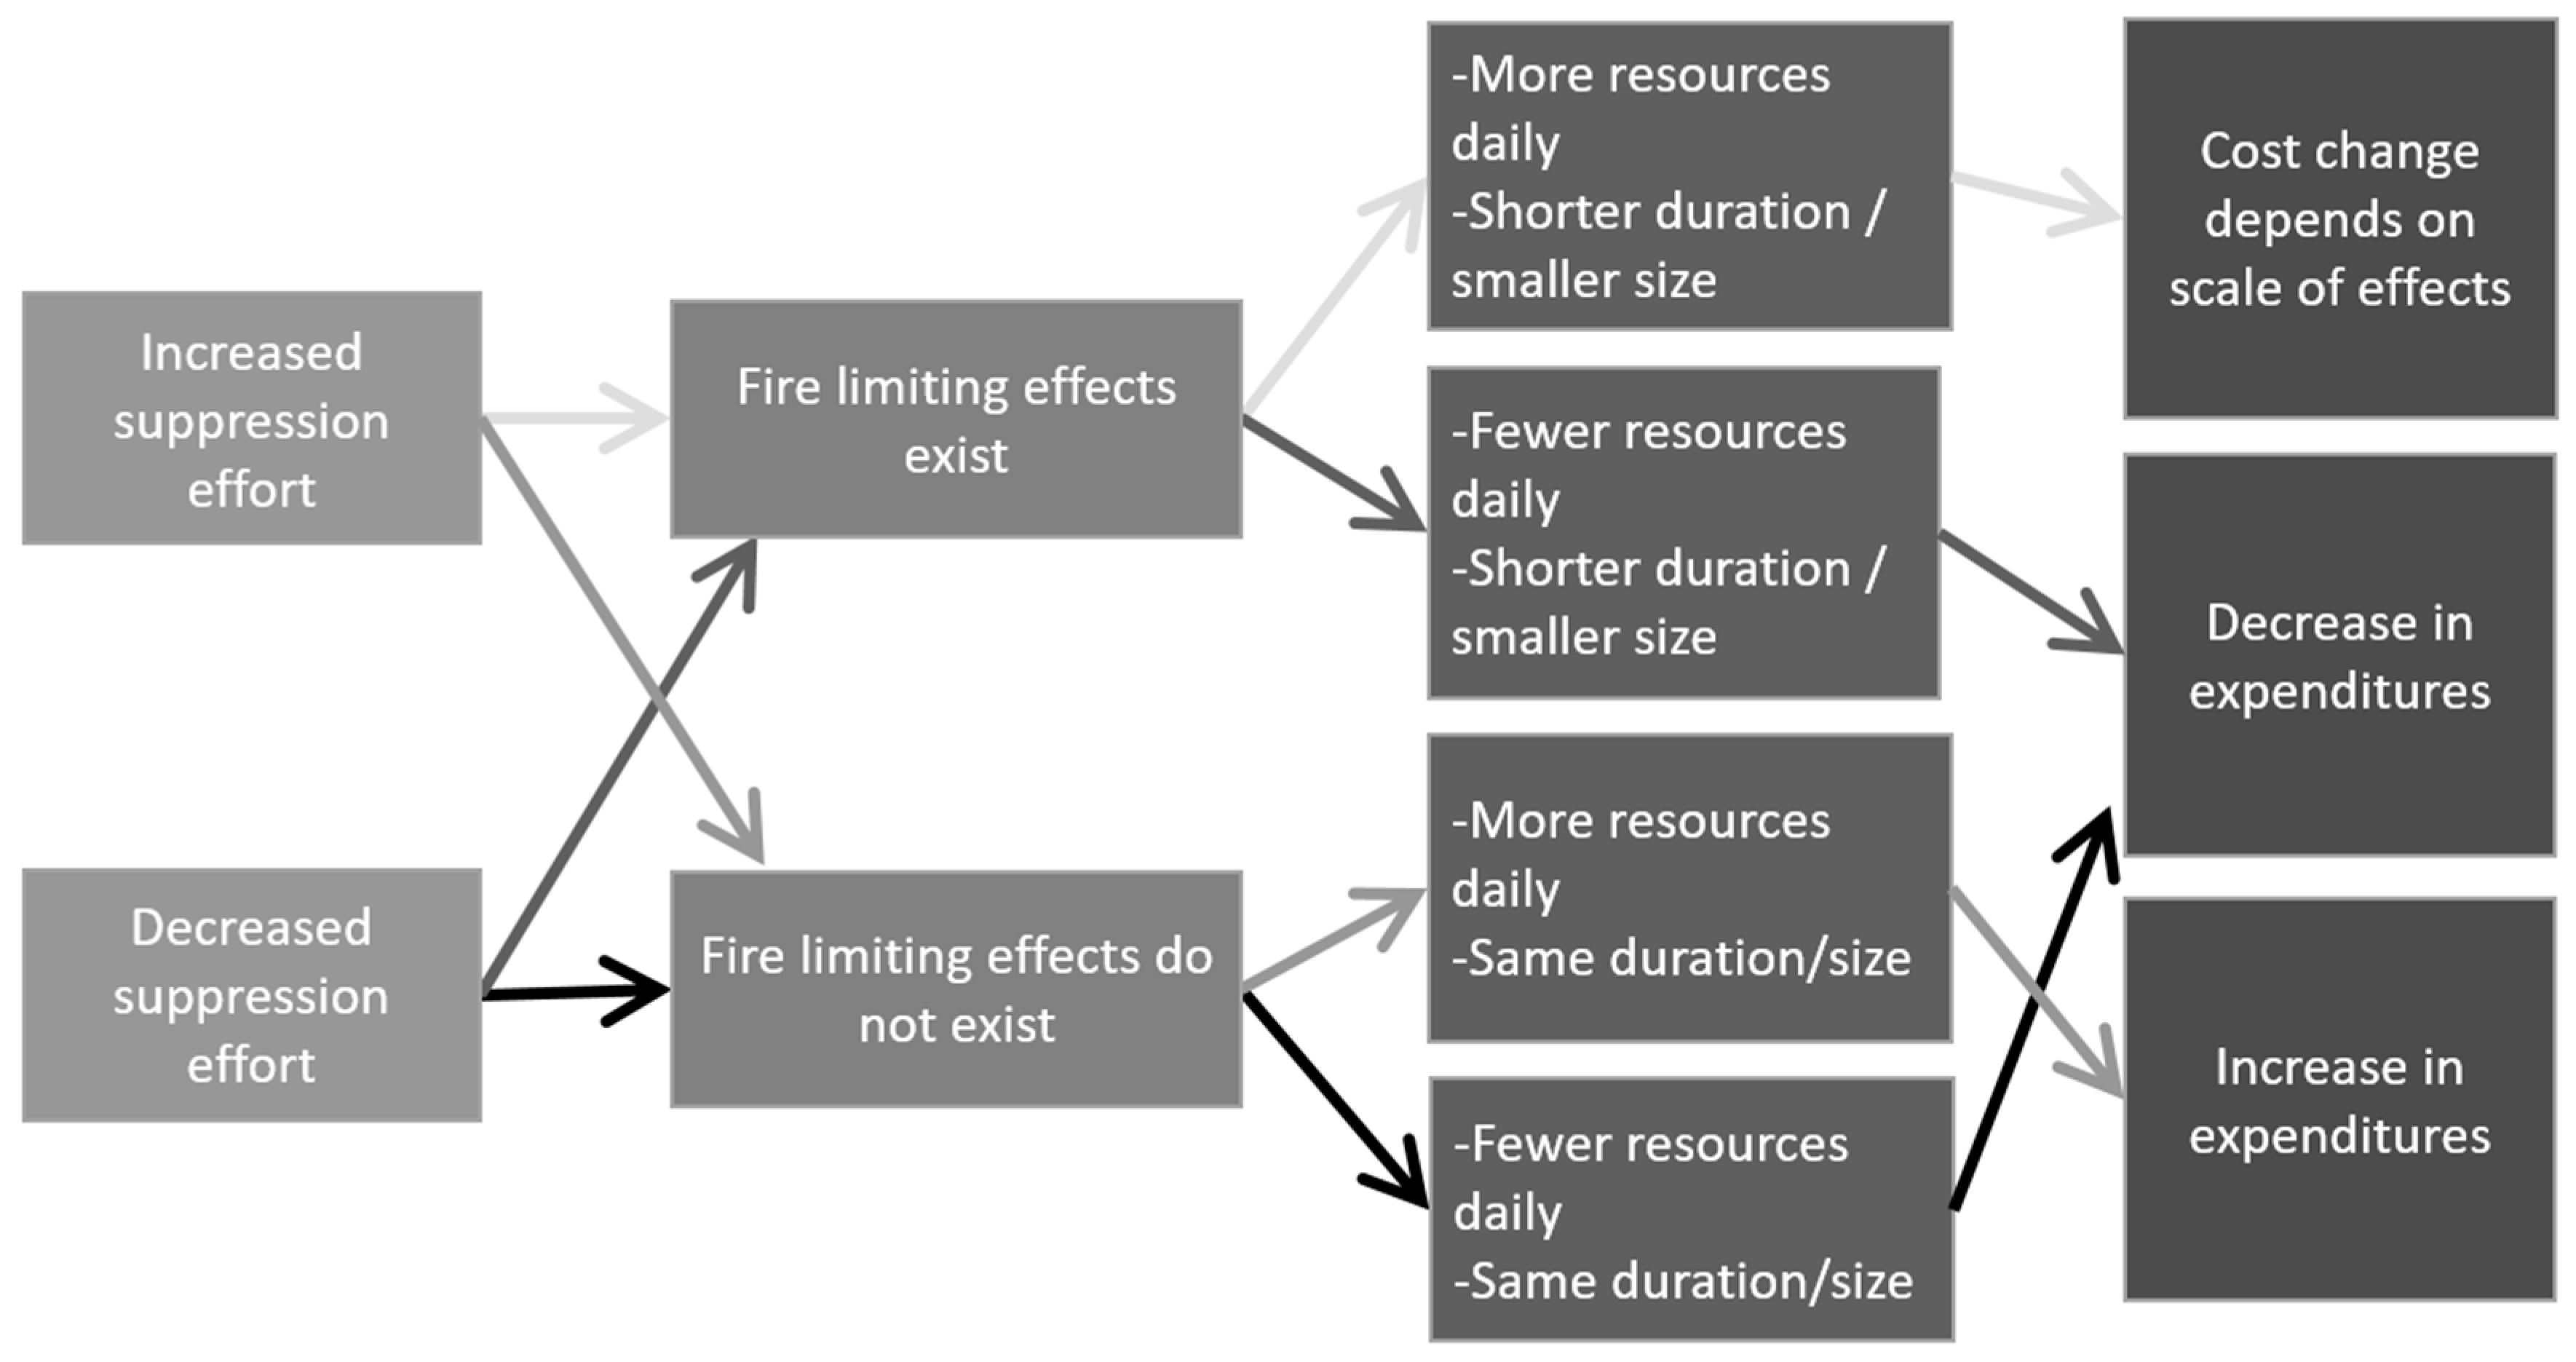
2.2. Increase or Decrease in Suppression Effort, No Effect of Suppression Effort on Fire Size or Duration
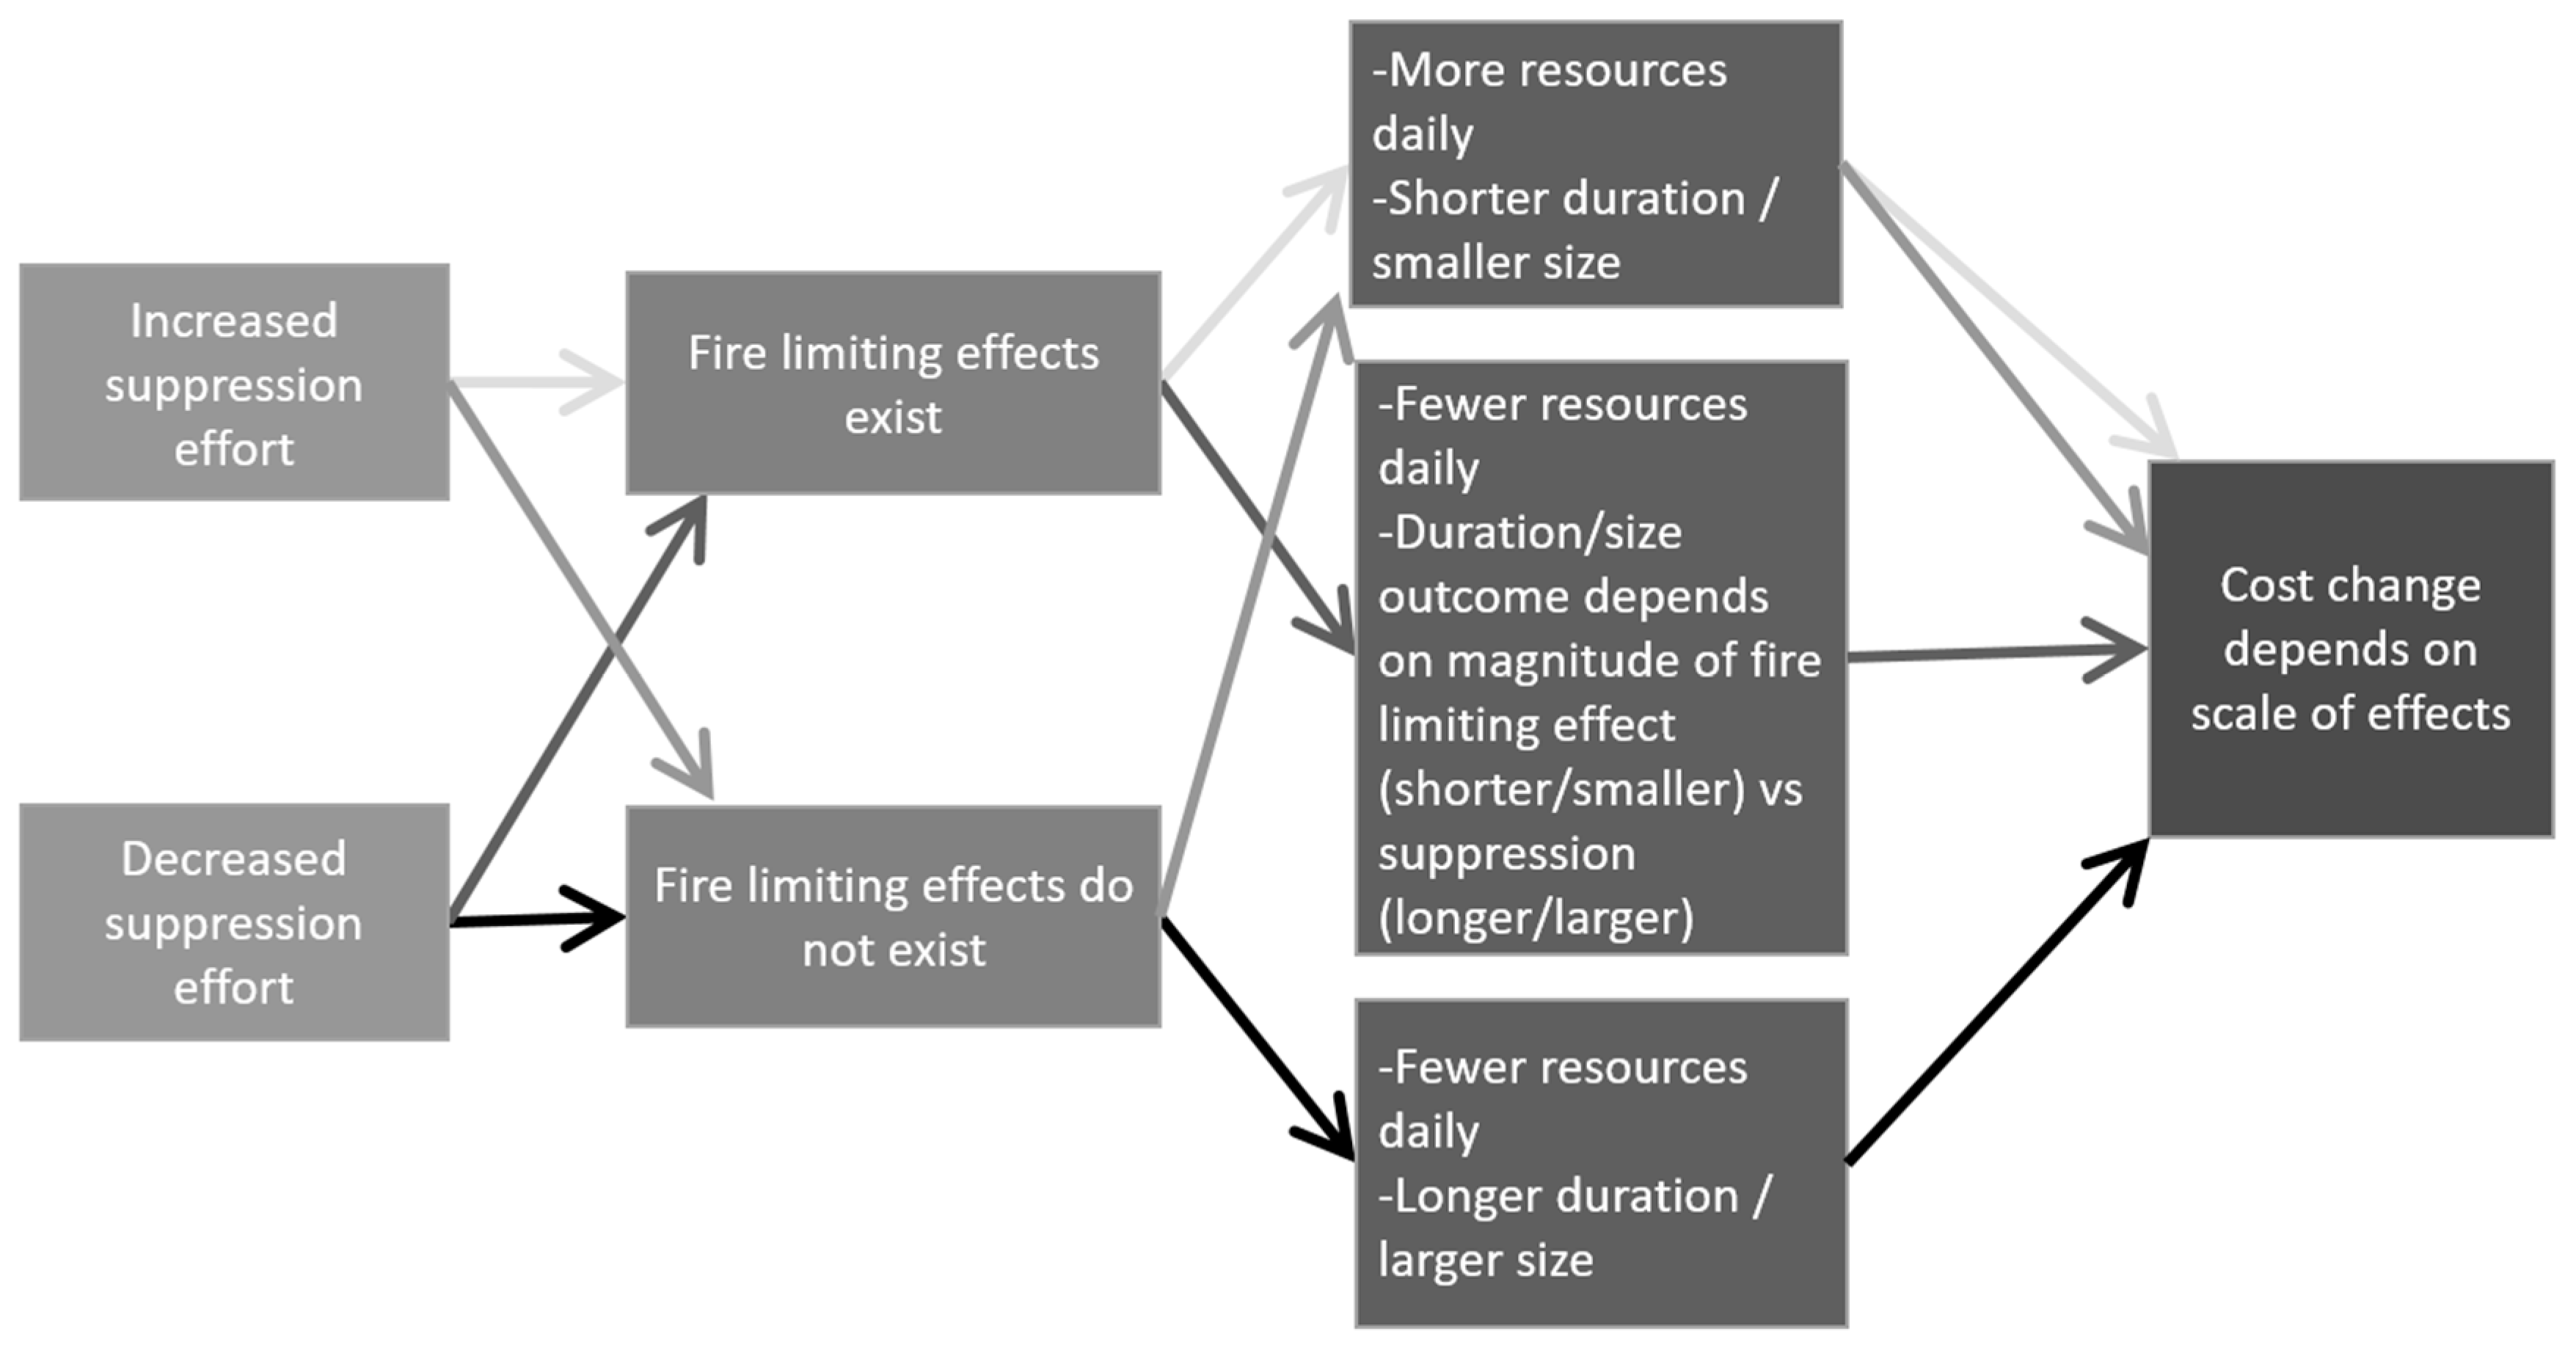
2.3. Increase or Decrease in Suppression Effort, Suppression Efforts are Effective at Limiting Fire Size and Duration
2.4. Summary of Conceptual Model Pathways and Hypotheses about Expenditures
3. Materials and Methods
3.1. Models
3.2. Spatial Data Preparation
4. Results
4.1. Regression Parameters
4.2. Statistical Analysis of Fires that Interacted with Previous Fire
5. Discussion
Supplementary Materials
Author Contributions
Funding
Acknowledgments
Conflicts of Interest
Appendix A

| Fire Size OLS | Fire Expenditures 2SLS | |||
|---|---|---|---|---|
| Variable | Coefficient | Standard Error | Coefficient | Standard Error |
| ln_hectares | 0.894 *** | 0.195 | ||
| erc_max | 0.024 *** | 0.005 | 0.033 *** | 0.011 |
| erc_std | 0.002 | 0.006 | −0.021 ** | 0.009 |
| ln_elevation | −0.170 | 0.116 | 0.798 *** | 0.177 |
| wild_burn | 0.483 ** | 0.215 | −0.142 | 0.248 |
| wild_share | −0.365 * | 0.220 | −0.933 *** | 0.334 |
| ira_burn | 0.976 *** | 0.124 | 0.204 | 0.251 |
| ira_share | −0.769 *** | 0.169 | −0.417 | 0.261 |
| other_burn | 1.260 *** | 0.208 | −0.369 | 0.417 |
| other_share | −2.805 | 2.323 | 1.864 | 2.366 |
| slp_20_40 | −0.161 | 0.344 | 0.882 * | 0.531 |
| slp_40_60 | −0.028 | 0.375 | 0.480 | 0.447 |
| slp_60_80 | 0.356 | 0.776 | 1.182 ** | 0.590 |
| slp_80_100 | −1.682 | 1.346 | 1.180 | 1.103 |
| usfs_share | −0.316 | 0.248 | 0.829 *** | 0.287 |
| doi_share | 0.670 | 0.452 | 0.131 | 0.394 |
| brush_share | −0.221 | 0.234 | 0.622 * | 0.333 |
| timber_slash_share | −0.376 * | 0.215 | 0.951 *** | 0.344 |
| ln_house_val_in | 0.103 *** | 0.016 | −0.027 | 0.030 |
| ln_house_val_5 | 0.009 | 0.008 | 0.029 *** | 0.008 |
| ln_house_val_10 | 0.011 | 0.008 | 0.023 *** | 0.009 |
| ln_house_val_20 | −0.012 | 0.010 | 0.030 ** | 0.014 |
| asp_N_E | −0.010 | 0.289 | 0.449 | 0.434 |
| asp_SE_SW | −1.010 *** | 0.241 | 0.740 | 0.515 |
| region2 | 0.460 ** | 0.194 | −0.155 | 0.353 |
| region3 | 0.693 *** | 0.167 | −0.155 | 0.291 |
| region4 | 0.343 *** | 0.119 | 0.161 | 0.341 |
| region5 | 0.264 | 0.170 | 1.424 *** | 0.308 |
| region6 | 0.218 | 0.139 | 1.167 *** | 0.320 |
| %_area_0_to_5 | −1.288 * | 0.758 | 0.862 | 0.828 |
| %_area_6_to_10 | −1.239 | 1.096 | 1.045* | 0.611 |
| %_area_11_to_20 | −0.611 | 0.756 | 1.317 | 0.899 |
| %_perim_0_to_5 | −0.749 | 0.545 | 0.843 ** | 0.365 |
| %_perim_6_to_10 | −0.442 | 0.550 | 0.034 | 0.512 |
| %_perim_11_to_20 | −0.778 | 0.529 | 0.183 | 0.608 |
| binary_fire_interaction | 0.873 *** | 0.117 | −0.420 * | 0.224 |
| fire_days | 0.016 *** | 0.002 | ||
| burned_in_2007 | −0.035 | 0.119 | ||
| burned_in_2008 | −0.180 | 0.117 | ||
| burned_in_2009 | −0.661 *** | 0.143 | ||
| burned_in_2010 | −0.761 *** | 0.108 | ||
| burned_in_2011 | −0.328 ** | 0.136 | ||
| SON | 0.053 | 0.190 | ||
| SON_region5 | −0.214 | 0.358 | ||
| ln_dist_250k | −0.000 | 0.000 | ||
| constant | 5.580 *** | 0.715 | −4.131 ** | 1.653 |
| R2 | 0.5308 | 0.5846 | ||
| Root MSE | 1.0954 | 1.2699 | ||
| F-statistic p-value | <0.0001 | chi-sq statistic p-value | <0.0001 | |
References
- Cochrane, M.A.; Moran, C.J.; Wimberly, M.C.; Baer, A.D.; Finney, M.A.; Beckendorf, K.L.; Eidenshink, J.; Zhu, Z. Estimation of wildfire size and risk changes due to fuels treatments. Int. J. Wildland Fire 2012, 21, 357. [Google Scholar] [CrossRef]
- Collins, B.M.; Miller, J.D.; Thode, A.E.; Kelly, M.; van Wagtendonk, J.W.; Stephens, S.L. Interactions Among Wildland Fires in a Long-Established Sierra Nevada Natural Fire Area. Ecosystems 2009, 12, 114–128. [Google Scholar] [CrossRef]
- Harris, L.; Taylor, A.H. Previous burns and topography limit and reinforce fire severity in a large wildfire. Ecosphere 2017, 8, e02019. [Google Scholar] [CrossRef]
- Hoff, V.; Teske, C.C.; Riddering, J.P.; Queen, L.P.; Gdula, E.G.; Bunn, W.A. Changes in Severity Distribution after Subsequent Fires on the North Rim of Grand Canyon National Park, Arizona, USA. Fire Ecol. 2014, 10, 48–63. [Google Scholar] [CrossRef]
- Holden, Z.A.; Morgan, P.; Hudak, A.T. Burn Severity of Areas Reburned by Wildfires in the Gila National Forest, New Mexico, USA. Fire Ecol. 2010, 6, 77–85. [Google Scholar] [CrossRef]
- Parks, S.A.; Miller, C.; Nelson, C.R.; Holden, Z.A. Previous Fires Moderate Burn Severity of Subsequent Wildland Fires in Two Large Western US Wilderness Areas. Ecosystems 2014, 17, 29–42. [Google Scholar] [CrossRef]
- Parks, S.A.; Holsinger, L.M.; Miller, C.; Nelson, C.R. Wildland fire as a self-regulating mechanism: The role of previous burns and weather in limiting fire progression. Ecol. Appl. 2015, 25, 1478–1492. [Google Scholar] [CrossRef]
- Parks, S.A.; Miller, C.; Holsinger, L.M.; Baggett, L.S.; Bird, B.J. Wildland fire limits subsequent fire occurrence. Int. J. Wildland Fire 2016, 25, 182. [Google Scholar] [CrossRef]
- Prichard, S.J.; Stevens-Rumann, C.S.; Hessburg, P.F. Tamm Review: Shifting global fire regimes: Lessons from reburns and research needs. For. Ecol. Manag. 2017, 396, 217–233. [Google Scholar] [CrossRef]
- Yocom, L.L.; Jenness, J.; Fulé, P.Z.; Thode, A.E. Previous fires and roads limit wildfire growth in Arizona and New Mexico, U.S.A. For. Ecol. Manag. 2019, 449, 117440. [Google Scholar] [CrossRef]
- Beverly, J.L. Time since prior wildfire affects subsequent fire containment in black spruce. Int. J. Wildland Fire 2017, 26, 919. [Google Scholar] [CrossRef]
- Butry, D.T. Fighting fire with fire: Estimating the efficacy of wildfire mitigation programs using propensity scores. Environ. Ecol. Stat. 2009, 16, 291–319. [Google Scholar] [CrossRef]
- Salazar, L.A.; González-Cabán, A. Spatial relationship of a wildfire, fuelbreaks, and recently burned areas. West. J. Appl. For. 1987, 2, 55–58. [Google Scholar] [CrossRef]
- Thompson, M.P.; Freeborn, P.; Rieck, J.D.; Calkin, D.E.; Gilbertson-Day, J.W.; Cochrane, M.A.; Hand, M.S. Quantifying the influence of previously burned areas on suppression effectiveness and avoided exposure: A case study of the Las Conchas Fire. Int. J. Wildland Fire 2016, 25, 167. [Google Scholar] [CrossRef]
- Barros, A.M.G.; Ager, A.A.; Day, M.A.; Krawchuk, M.A.; Spies, T.A. Wildfires managed for restoration enhance ecological resilience. Ecosphere 2018, 9, e02161. [Google Scholar] [CrossRef]
- Boisramé, G.F.S.; Thompson, S.E.; Kelly, M.; Cavalli, J.; Wilkin, K.M.; Stephens, S.L. Vegetation change during 40 years of repeated managed wildfires in the Sierra Nevada, California. For. Ecol. Manag. 2017, 402, 241–252. [Google Scholar] [CrossRef]
- Calkin, D.E.; Thompson, M.P.; Finney, M.A. Negative consequences of positive feedbacks in US wildfire management. For. Ecosyst. 2015, 2, 9. [Google Scholar] [CrossRef]
- Ingalsbee, T. Whither the paradigm shift? Large wildland fires and the wildfire paradox offer opportunities for a new paradigm of ecological fire management. Int. J. Wildland Fire 2017, 26, 557. [Google Scholar] [CrossRef]
- North, M.P.; Stephens, S.L.; Collins, B.M.; Agee, J.K.; Aplet, G.; Franklin, J.F.; Fule, P.Z. Reform forest fire management. Science 2015, 349, 1280–1281. [Google Scholar] [CrossRef]
- Stephens, S.L.; Collins, B.M.; Biber, E.; Fulé, P.Z. U.S. federal fire and forest policy: Emphasizing resilience in dry forests. Ecosphere 2016, 7, e01584. [Google Scholar] [CrossRef]
- US Forest Service. The Rising Cost of Wildfire Operations: Effects on the Forest Service’s Non-Fire Work; USDA: Washington, DC, USA, 2015.
- U.S. Government Accountability Office. Federal Agencies Have Taken Important Steps Forward, but Additional Action Is Needed to Address Remaining Challenges; US GAO Testimony before the Committee on Energy and Natural Resources, US Senate.GAO-09-906T; U.S. Government Accountability Office: Washington, DC, USA, 21 July 2009.
- Booz Allen Hamilton. 2014 Quadrennial Fire Review; USDA Forest Service Fire & Aviation Management and DOI Office of Wildland Fire: Washington, DC, USA, 2015.
- U.S. Secretary of Agriculture. Secretary Perdue Applauds Fire Funding Fix in Omnibus; USDA: Washington, DC, USA, 2018.
- Clark, A.M.; Rashford, B.S.; McLeod, D.M.; Lieske, S.N.; Coupal, R.H.; Albeke, S.E. The Impact of Residential Development Pattern on Wildland Fire Suppression Expenditures. Land Econ. 2016, 92, 656–678. [Google Scholar] [CrossRef]
- Donovan, G.H.; Prestemon, J.P.; Gebert, K. The Effect of Newspaper Coverage and Political Pressure on Wildfire Suppression Costs. Soc. Nat. Resour. 2011, 24, 785–798. [Google Scholar] [CrossRef]
- Gebert, K.; Calkin, D.E.; Yoder, J. Estimating suppression expenditures for individual large wildland fires. West. J. Appl. For. 2007, 22, 188–196. [Google Scholar] [CrossRef]
- Gude, P.H.; Jones, K.; Rasker, R.; Greenwood, M.C. Evidence for the effect of homes on wildfire suppression costs. Int. J. Wildland Fire 2013, 22, 537. [Google Scholar] [CrossRef]
- Hand, M.S.; Thompson, M.P.; Calkin, D.E. Examining heterogeneity and wildfire management expenditures using spatially and temporally descriptive data. JFE 2016, 22, 80–102. [Google Scholar] [CrossRef]
- Liang, J.; Calkin, D.E.; Gebert, K.M.; Venn, T.J.; Silverstein, R.P. Factors influencing large wildland fire suppression expenditures. Int. J. Wildland Fire 2008, 17, 650–659. [Google Scholar] [CrossRef]
- Yoder, J.; Gebert, K. An econometric model for ex ante prediction of wildfire suppression costs. JFE 2012, 18, 76–89. [Google Scholar] [CrossRef]
- Preisler, H.K.; Westerling, A.L.; Gebert, K.M.; Munoz-Arriola, F.; Holmes, T.P. Spatially explicit forecasts of large wildland fire probability and suppression costs for California. Int. J. Wildland Fire 2011, 20, 508. [Google Scholar] [CrossRef]
- Thompson, M.P.; Anderson, N.M. Modeling fuel treatment impacts on fire suppression cost savings: A review. Calif. Agric. 2015, 69, 164–170. [Google Scholar] [CrossRef]
- Kalies, E.L.; Yocom Kent, L.L. Tamm Review: Are fuel treatments effective at achieving ecological and social objectives? A systematic review. For. Ecol. Manag. 2016, 375, 84–95. [Google Scholar] [CrossRef]
- Schwilk, D.W.; Keeley, J.E.; Knapp, E.E.; McIver, J.; Bailey, J.D.; Fettig, C.J.; Fiedler, C.E.; Harrod, R.J.; Moghaddas, J.J.; Outcalt, K.W.; et al. The national Fire and Fire Surrogate study: Effects of fuel reduction methods on forest vegetation structure and fuels. Ecol. Appl. 2009, 19, 285–304. [Google Scholar] [CrossRef] [PubMed]
- Fitch, R.A.; Kim, Y.S.; Waltz, A.E.M.; Crouse, J.E. Changes in potential wildland fire suppression costs due to restoration treatments in Northern Arizona Ponderosa pine forests. For. Policy Econ. 2018, 87, 101–114. [Google Scholar] [CrossRef]
- Taylor, M.H.; Rollins, K.; Kobayashi, M.; Tausch, R.J. The economics of fuel management: Wildfire, invasive plants, and the dynamics of sagebrush rangelands in the western United States. J. Environ. Manag. 2013, 126, 157–173. [Google Scholar] [CrossRef] [PubMed]
- Taylor, M.H.; Sanchez Meador, A.J.; Kim, Y.-S.; Rollins, K.; Will, H. The Economics of Ecological Restoration and Hazardous Fuel Reduction Treatments in the Ponderosa Pine Forest Ecosystem. For. Sci. 2015, 61, 988–1008. [Google Scholar] [CrossRef]
- Thompson, M.P.; Vaillant, N.M.; Haas, J.R.; Gebert, K.M.; Stockmann, K.D. Quantifying the Potential Impacts of Fuel Treatments on Wildfire Suppression Costs. J. For. 2013, 111, 49–58. [Google Scholar] [CrossRef]
- Thompson, M.; Riley, K.; Loeffler, D.; Haas, J. Modeling Fuel Treatment Leverage: Encounter Rates, Risk Reduction, and Suppression Cost Impacts. Forests 2017, 8, 469. [Google Scholar] [CrossRef]
- Houtman, R.M.; Montgomery, C.A.; Gagnon, A.R.; Calkin, D.E.; Dietterich, T.G.; McGregor, S.; Crowley, M. Allowing a wildfire to burn: Estimating the effect on future fire suppression costs. Int. J. Wildland Fire 2013, 22, 871. [Google Scholar] [CrossRef]
- Rideout, D.B.; Ziesler, P.S. Three Great Myths of Wildland Fire Management. In the Second International Symposium on Fire Economics, Planning and Policy: A World View; CD only; Pacific Southwest Research Station, Forest Service, U.S. Department of Agriculture: Albany, CA, USA; Gordoba, Spain, 22 April 2004. [Google Scholar]
- Naughton, H.T.; Barnett, K. Spatiotemporal Evaluation of Fuel Treatment and Previous Wildfire Effects on Suppression Costs; JFSP: Missoula, MT, USA, 2017; p. 34. [Google Scholar]
- Gebert, K.M.; Black, A.E. Effect of Suppression Strategies on Federal Wildland Fire Expenditures. J. For. 2012, 110, 65–73. [Google Scholar] [CrossRef]
- MTBS Data Access: Fire Level Geospatial Data. Available online: https://mtbs.gov/direct-download2017 (accessed on 6 October 2017).
- Noonan-Wright, E.K.; Opperman, T.S.; Finney, M.A.; Zimmerman, G.T.; Seli, R.C.; Elenz, L.M.; Calkin, D.E.; Fiedler, J.R. Developing the US Wildland Fire Decision Support System. J. Combust. 2011. [Google Scholar] [CrossRef]
- Plucinski, M.P. Contain and Control: Wildfire Suppression Effectiveness at Incidents and Across Landscapes. Curr. For. Rep. 2019, 5, 20–40. [Google Scholar] [CrossRef]
- Stata Statistical Software. Available online: https://www.stata.com/ (accessed on 1 October 2019).
- Abatzoglou, J.T. Development of gridded surface meteorological data for ecological applications and modelling. Int. J. Climatol. 2013, 33, 121–131. [Google Scholar] [CrossRef]
- ArcMap; ESRI Inc: Redlands, CA, USA, 2015.
- Python; Python Software Foundation. Available online: https://www.python.org/ (accessed on 1 October 2019).
- Connor, C.D.O.; Calkin, D.E.; Thompson, M.P. An empirical machine learning method for predicting potential fire control locations for pre-fire planning and operational fire management. Int. J. Wildland Fire 2017, 26, 587. [Google Scholar] [CrossRef]
- Barnett, K.; Parks, S.; Miller, C.; Naughton, H. Beyond Fuel Treatment Effectiveness: Characterizing Interactions between Fire and Treatments in the US. Forests 2016, 7, 237. [Google Scholar] [CrossRef]
- Connor, C.D.O.; Calkin, D.E. Engaging the fire before it starts: A case study from the 2017 Pinal Fire (Arizona). Wildfire 2019, 28, 14–18. [Google Scholar]
- Dunn, C.J.; O’Connor, C.D.; Reilly, M.J.; Calkin, D.E.; Thompson, M.P. Spatial and temporal assessment of responder exposure to snag hazards in post-fire environments. For. Ecol. Manag. 2019, 441, 202–214. [Google Scholar] [CrossRef]


| Variable | Description | Source | Instrumental variable |
|---|---|---|---|
| lnexp | Natural log of total federal suppression expenditures in constant 2012 $ (Dep. Var.) | FFIS | |
| ln_hectares | Natural log of area (in hectares) within final fire perimeter | NIFC FTP | |
| erc_max | Maximum relative ERC percentile observed during the fire within the final perimeter | GIS calculation of data from [49] | |
| erc_std | Standard deviation of relative ERC observed during the fire within the final perimeter | GIS calculation of data from [49] | |
| ln_elevation | Natural log of the average elevation within the final perimeter | LANDFIRE | |
| wild_burn | Burned within Wilderness area (binary) | WFDSS | |
| wild_share | Share of final burned area within a Wilderness area | WFDSS | |
| IRA_burn | Burned within an Inventoried Roadless Area (binary) | WFDSS | |
| IRA_share | Share of final burned area within an IRA | WFDSS | |
| SDA_burn | Burned within other specially designated area (binary) | WFDSS | |
| SDA_share | Share of final burned area within a SDA | WFDSS | |
| slope_0_20 | Share of final burned area with slope less than 20% (omitted reference category) | LANDFIRE | |
| slope_20_40 | Share of final burned area with slope between 20% and 40% | LANDFIRE | |
| slope_40_60 | Share of final burned area with slope between 40% and 60% | LANDFIRE | |
| slope_60_80 | Share of final burned area with slope between 60% and 80% | LANDFIRE | |
| slope_80_100 | Share of final burned area with slope greater than 80% | LANDFIRE | |
| usfs_share | Share of final burned area in USFS ownership | WFDSS | |
| doi_share | Share of final burned area in Dept. of Interior ownership | WFDSS | |
| grass_share | Share of final burned area with grass fuels | LANDFIRE | |
| brush_share | Share of final burned area with brush fuels | LANDFIRE | |
| timber_share | Share of final burned area with timber fuels | LANDFIRE | |
| slash_share | Share of final burned area with slash fuels | LANDFIRE | |
| ln_house_val_in | Natural log of housing value within the final perimeter in constant 2012 $1000 | U.S. Census | |
| ln_house_val_5 | Natural log of housing value within 5 miles of final perimeter in constant 2012 $1000 | U.S. Census | |
| ln_house_val_10 | Natural log of housing value between 5 and 10 miles from perimeter in constant 2012 $1000 | U.S. Census | |
| ln_house_val_20 | Natural log of housing value between 10 and 20 miles from perimeter in constant 2012 $1000 | U.S. Census | |
| aspect_N_E | Share of final burned area with North, Northeast, or East aspect | LANDFIRE | |
| aspect_SE_SW | Share of final burned area with Southeast, South, or Southwest aspect | LANDFIRE | |
| aspect_W_NW | Share of final burned area in West or Northwest aspect (omitted reference category) | LANDFIRE | |
| duration (top-code) | Fire duration top-coded at 90 days | NIFMID | Instrumental variable |
| region1 | Northern region identifier (binary, omitted reference category) | NIFMID | |
| region2 | Rocky Mountain region indicator (binary) | NIFMID | |
| region3 | Southwest region indicator (binary) | NIFMID | |
| region4 | Great Basin region indicator (binary) | NIFMID | |
| region5 | California region indicator (binary) | NIFMID | |
| region6 | Northwest region indicator (binary) | NIFMID | |
| year06 | Year 2006 indicator (binary, omitted reference category) | NIFMID | Instrumental variable |
| year07 | Year 2007 indicator (binary) | NIFMID | Instrumental variable |
| year08 | Year 2008 indicator (binary) | NIFMID | Instrumental variable |
| year09 | Year 2009 indicator (binary) | NIFMID | Instrumental variable |
| year10 | Year 2010 indicator (binary) | NIFMID | Instrumental variable |
| year11 | Year 2011 indicator (binary) | NIFMID | Instrumental variable |
| SON | Fire ignition during September, October, or November (binary) | NIFMID | Instrumental variable |
| ln_neardist | Natural log of distance to the nearest city with a population of more than 250,000 | U.S. Census | Instrumental variable |
| Variable Category | Time since Previous Fire Occurred | Variable Type (Range) | Variable Name |
|---|---|---|---|
| % area | 0–5 years | Continuous (0–1) | % area 0–5 yrs |
| % area | 6–10 years | Continuous (0–1) | % area 6–10 yrs |
| % area | 11–20 years | Continuous (0–1) | % area 11–20 yrs |
| % perimeter overlap | 0–5 years | Continuous (0–1) | % perimeter 0–5 yrs |
| % perimeter overlap | 6–10 years | Continuous (0–1) | % perimeter 6–10 yrs |
| % perimeter overlap | 11–20 years | Continuous (0–1) | % perimeter 11–20 yrs |
| Any previous fire interaction | 0–20 years | Binary (0/1) | Prev fire (binary) |
| % Area 0–5 yrs | % Area 6–10 yrs | % Area 6–10 yrs | % Area 0–5 yrs | % Area 6–10 yrs | % Area 6–10 yrs | |
|---|---|---|---|---|---|---|
| % Area 0–5 yrs | 1.00 | 0.46 | −0.07 | −0.08 | −0.11 | −0.05 |
| % Area 6–10 yrs | 0.46 | 1.00 | −0.04 | −0.04 | −0.11 | −0.09 |
| % Area 11–20 yrs | −0.07 | −0.04 | 1.00 | 0.32 | −0.08 | 0.02 |
| % Perimeter 0–5 yrs | −0.08 | −0.04 | 0.32 | 1.00 | −0.10 | 0.05 |
| % Perimeter 6–10 yrs | −0.11 | −0.11 | −0.08 | −0.10 | 1.00 | 0.62 |
| % Perimeter 11–20 yrs | −0.05 | −0.09 | 0.02 | 0.05 | 0.62 | 1.00 |
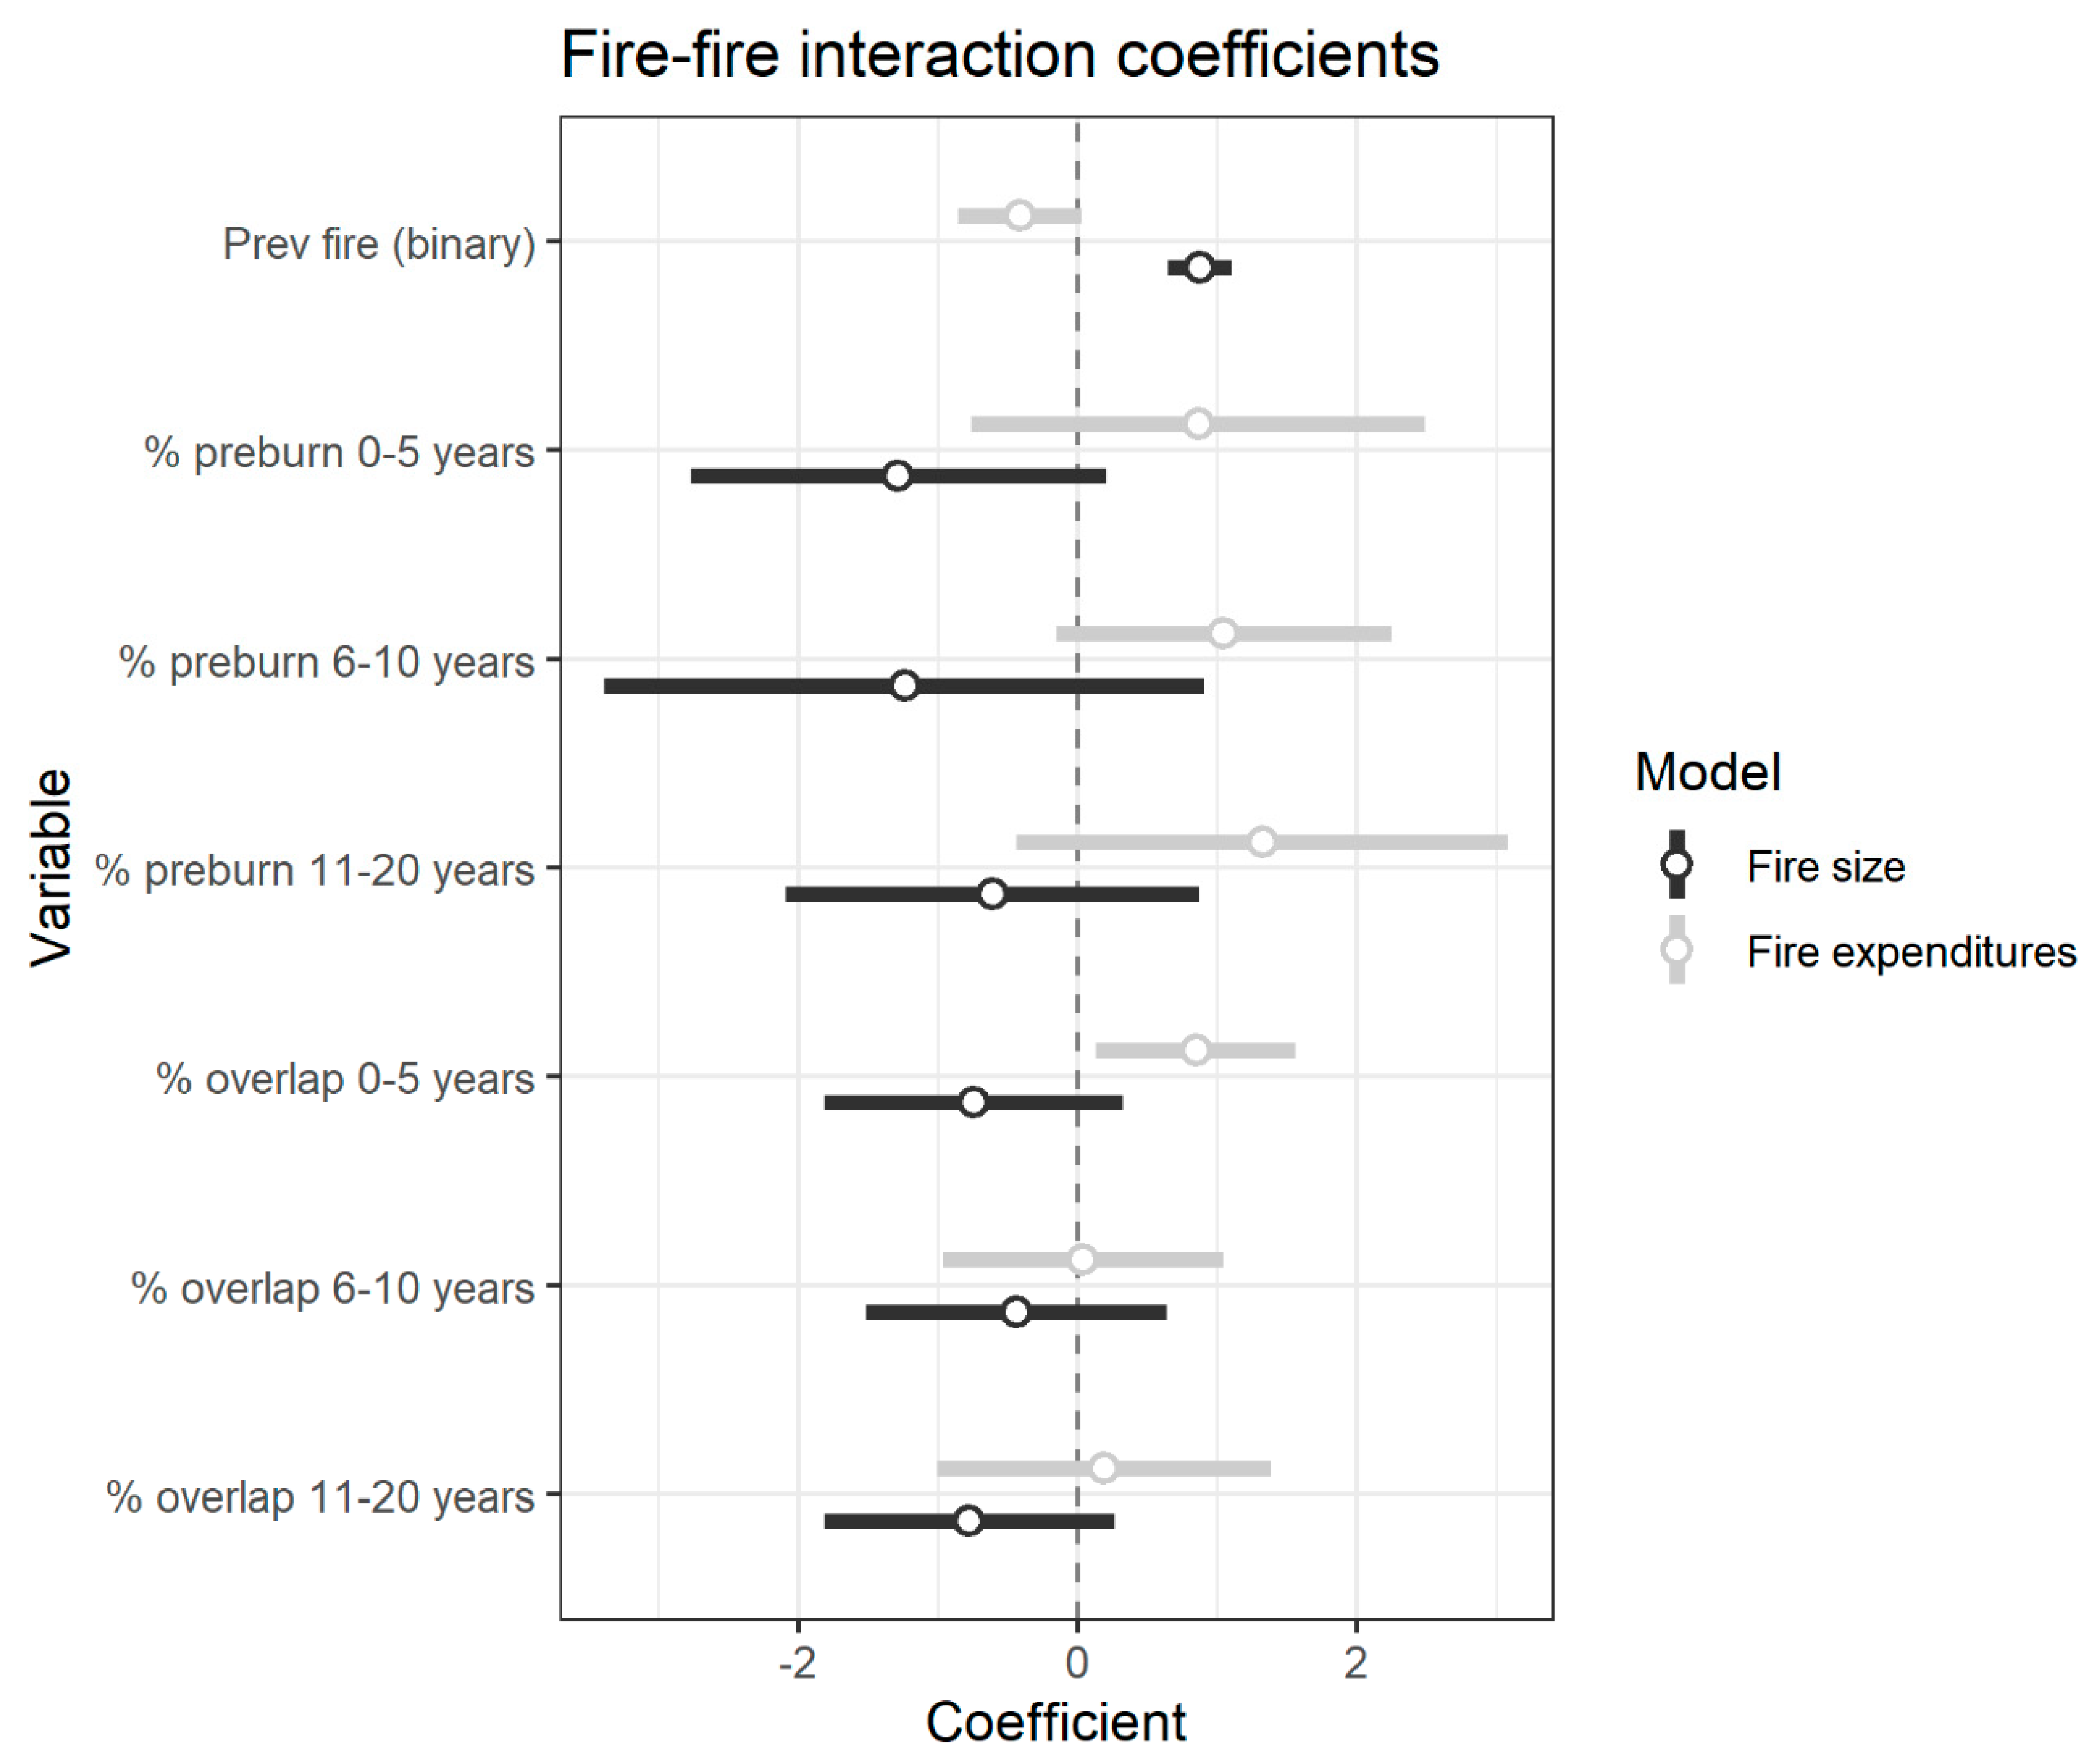
| Fire Size OLS | Fire Expenditures 2SLS | |||
|---|---|---|---|---|
| Variable | Coefficient | Standard Error | Coefficient | Standard Error |
| %_area_0_to_5 | −1.288 * | 0.758 | 0.862 | 0.828 |
| %_area_6_to_10 | −1.239 | 1.096 | 1.045 * | 0.611 |
| %_area_11_to_20 | −0.611 | 0.756 | 1.317 | 0.899 |
| %_perim_0_to_5 | −0.749 | 0.545 | 0.843 ** | 0.365 |
| %_perim_6_to_10 | −0.442 | 0.550 | 0.034 | 0.512 |
| %_perim_11_to_20 | −0.778 | 0.529 | 0.183 | 0.608 |
| binary_fire_interaction | 0.873 *** | 0.117 | −0.420 * | 0.224 |
| R2 | 0.5308 | 0.5846 | ||
| Root MSE | 1.0954 | 1.2699 | ||
| F-statistic p-value | < 0.0001 | χ2 p-value | < 0.0001 | |
© 2019 by the authors. Licensee MDPI, Basel, Switzerland. This article is an open access article distributed under the terms and conditions of the Creative Commons Attribution (CC BY) license (http://creativecommons.org/licenses/by/4.0/).
Share and Cite
Belval, E.J.; O’Connor, C.D.; Thompson, M.P.; Hand, M.S. The Role of Previous Fires in the Management and Expenditures of Subsequent Large Wildfires. Fire 2019, 2, 57. https://doi.org/10.3390/fire2040057
Belval EJ, O’Connor CD, Thompson MP, Hand MS. The Role of Previous Fires in the Management and Expenditures of Subsequent Large Wildfires. Fire. 2019; 2(4):57. https://doi.org/10.3390/fire2040057
Chicago/Turabian StyleBelval, Erin J, Christopher D O’Connor, Matthew P Thompson, and Michael S Hand. 2019. "The Role of Previous Fires in the Management and Expenditures of Subsequent Large Wildfires" Fire 2, no. 4: 57. https://doi.org/10.3390/fire2040057
APA StyleBelval, E. J., O’Connor, C. D., Thompson, M. P., & Hand, M. S. (2019). The Role of Previous Fires in the Management and Expenditures of Subsequent Large Wildfires. Fire, 2(4), 57. https://doi.org/10.3390/fire2040057