Article

Severe Fire Danger Index: A Forecastable Metric to Inform Firefighter and Community Wildfire Risk Management

Missoula Fire Sciences Laboratory, Rocky Mountain Research Station, USDA Forest Service, 5775 Hwy 10 W, Missoula, MT 59808, USA
*
Author to whom correspondence should be addressed.
Submission received: 22 May 2019 / Revised: 9 August 2019 / Accepted: 12 August 2019 / Published: 27 August 2019

Abstract

:
Despite major advances in numerical weather prediction, few resources exist to forecast wildland fire danger conditions to support operational fire management decisions and community early-warning systems. Here we present the development and evaluation of a spatial fire danger index that can be used to assess historical events, forecast extreme fire danger, and communicate those conditions to both firefighters and the public. It uses two United States National Fire Danger Rating System indices that are related to fire intensity and spread potential. These indices are normalized, combined, and categorized based on a 39-yr climatology (1979–2017) to produce a single, categorical metric called the Severe Fire Danger Index (SFDI) that has five classes; Low, Moderate, High, Very High, and Severe. We evaluate the SFDI against the number of newly reported wildfires and total area burned from agency fire reports (1992–2017) as well as daily remotely sensed numbers of active fire pixels and total daily fire radiative power for large fires (2003–2016) from the Moderate-Resolution Imaging Spectroradiometer (MODIS) across the conterminous United States. We show that the SFDI adequately captures geographic and seasonal variations of fire activity and intensity, where 58% of the eventual area burned reported by agency fire records, 75.2% of all MODIS active large fire pixels, and 81.2% of all fire radiative power occurred when the SFDI was either Very High or Severe (above the 90th percentile). We further show that SFDI is a strong predictor of firefighter fatalities, where 97 of 129 (75.2%) burnover deaths from 1979 to 2017 occurred when SFDI was either Very High or Severe. Finally, we present an operational system that uses short-term, numerical weather predictions to produce daily SFDI forecasts and show that 76.2% of all satellite active fire detections during the first 48 h following the ignition of nine high-profile case study fires in 2017 and 2018 occurred under Very High or Severe SFDI conditions. The case studies indicate that the extreme weather events that caused tremendous damage and loss of life could be mapped ahead of time, which would allow both wildland fire managers and vulnerable communities additional time to prepare for potentially dangerous conditions. Ultimately, this simple metric can provide critical decision support information to wildland firefighters and fire-prone communities and could form the basis of an early-warning system that can improve situational awareness and potentially save lives.

1. Introduction

Wildland fires are a common global disturbance critical to maintaining healthy, fire-dependent, and fire-adapted ecosystems [1]. Despite their ecological importance, wildfires also threaten life and property when they occur in or near populated areas. Wildland firefighters are tasked with engaging and extinguishing these types of fires to protect natural resources and infrastructure, sometimes at the threat of losing their own lives [2]. A rise in the severity of global fire weather conditions during the last four decades [3] has led to wildfires that burn longer and spread across larger areas, particularly in the United States (US) [4,5,6,7,8,9,10], which increases firefighter exposure and affects firefighter safety [11]. Firefighters would therefore benefit from simple, streamlined decision support tools that can inform them of the current and future state of the weather, fuels and potential fire behavior so that they can develop operational plans that simultaneously minimize exposure and risk while meeting the complex objectives of reducing life loss and property damage.
The threats that wildfires pose to communities are significant, particularly those in the Wildland-Urban Interface (WUI) [12]. The WUI presents both an increased exposure of populated areas to wildfires and an increased likelihood of human-caused wildfire ignitions [13]. A dramatic example comes from the US state of California, which has recently witnessed an increase in area classified as WUI [13] and abnormally warm and dry weather that spread drought conditions across much of the state [14]. This combination led to the occurrence of seven of the most destructive, four of the largest, and five of the deadliest fires in California’s history in 2017 and 2018 [15,16,17]. These changes are not confined to California and are being seen across much of the US and the rest of the world [18,19]. Therefore, a predictive, or early-warning system that could anticipate the conditions that promote large, high intensity fires would be beneficial by providing advanced notice to communities adjacent to wildlands.
Spatial numerical weather prediction can be used to forecast changes in fire weather and subsequent changes in wildland fire danger across landscapes if surface weather conditions can be coherently translated into metrics related to fire activity. Fire danger rating systems worldwide fill this role by ingesting and integrating information about the fire environment (i.e., fuels, weather and topography) and generating indices that correspond to physical fire characteristics such as spread rate, intensity, or flame length [20,21,22]. Advantageously, fire danger rating systems and their indices are often incorporated into wildland firefighter training curricula, thereby increasing their familiarity and use among firefighters and fire managers to improve situational awareness and support decision-making. Since firefighters are already comfortable interpreting fire danger indices inside decision support tools, it makes sense that numerical weather forecasts that produce familiar fire danger indices would be more readily adopted by the larger fire management community.
In the US, the National Fire Danger Rating System (USNFDRS) has evolved to provide daily guidance to support both preparedness and response decisions [20]. It is used broadly to inform fire management decisions and the public about changing conditions. Since 1978, indices from the USNFDRS such as the Energy Release Component (ERC) and the Burning Index (BI) have permeated US fire management culture and their application is taught nationwide through standardized training [20,23]. Operationally, ERC and BI are used to support over 99% of all wildland fire preparedness and response decisions throughout the country for most federal and many state firefighting organizations. Currently, operational fire danger applications rely on data from Remote Automated Weather Stations (RAWS) measured at single points across landscapes and do not leverage available gridded weather data, such as that available from the US National Weather Service National Digital Forecast Database (NDFD) [24]. A new system that builds off the existing use of common fire danger indices and uses gridded data to expand its spatial application would be highly beneficial.
Here we present the development, evaluation and application of a Severe Fire Danger Index (SFDI) that can be used to guide fire management and community preparedness decision-making. Surface weather variables across the conterminous US (CONUS) from a 39-year (1979–2017) gridded climatology are input into the USNFDRS to calculate daily ERC and BI indices at 4-km grid spacing. These two fire danger indices are normalized relative to their long-term site-specific climatology, merged, and categorized to yield the SFDI. The SFDI is compared against daily variations in both new fire activity, as reported by fire management agencies, as well as ongoing fire activity as detected by the Moderate-Resolution Imaging Spectroradiometer (MODIS). We also show that the SFDI is a strong predictor of firefighter entrapments and fatalities over the last 39 years. Finally, we demonstrate how forecast maps of categorical fire danger conditions could provide the basis for a much-needed early-warning system by examining nine extreme wildfire events in California in 2017 and 2018.

2. Materials and Methods

2.1. Gridded Fire Danger Climatology
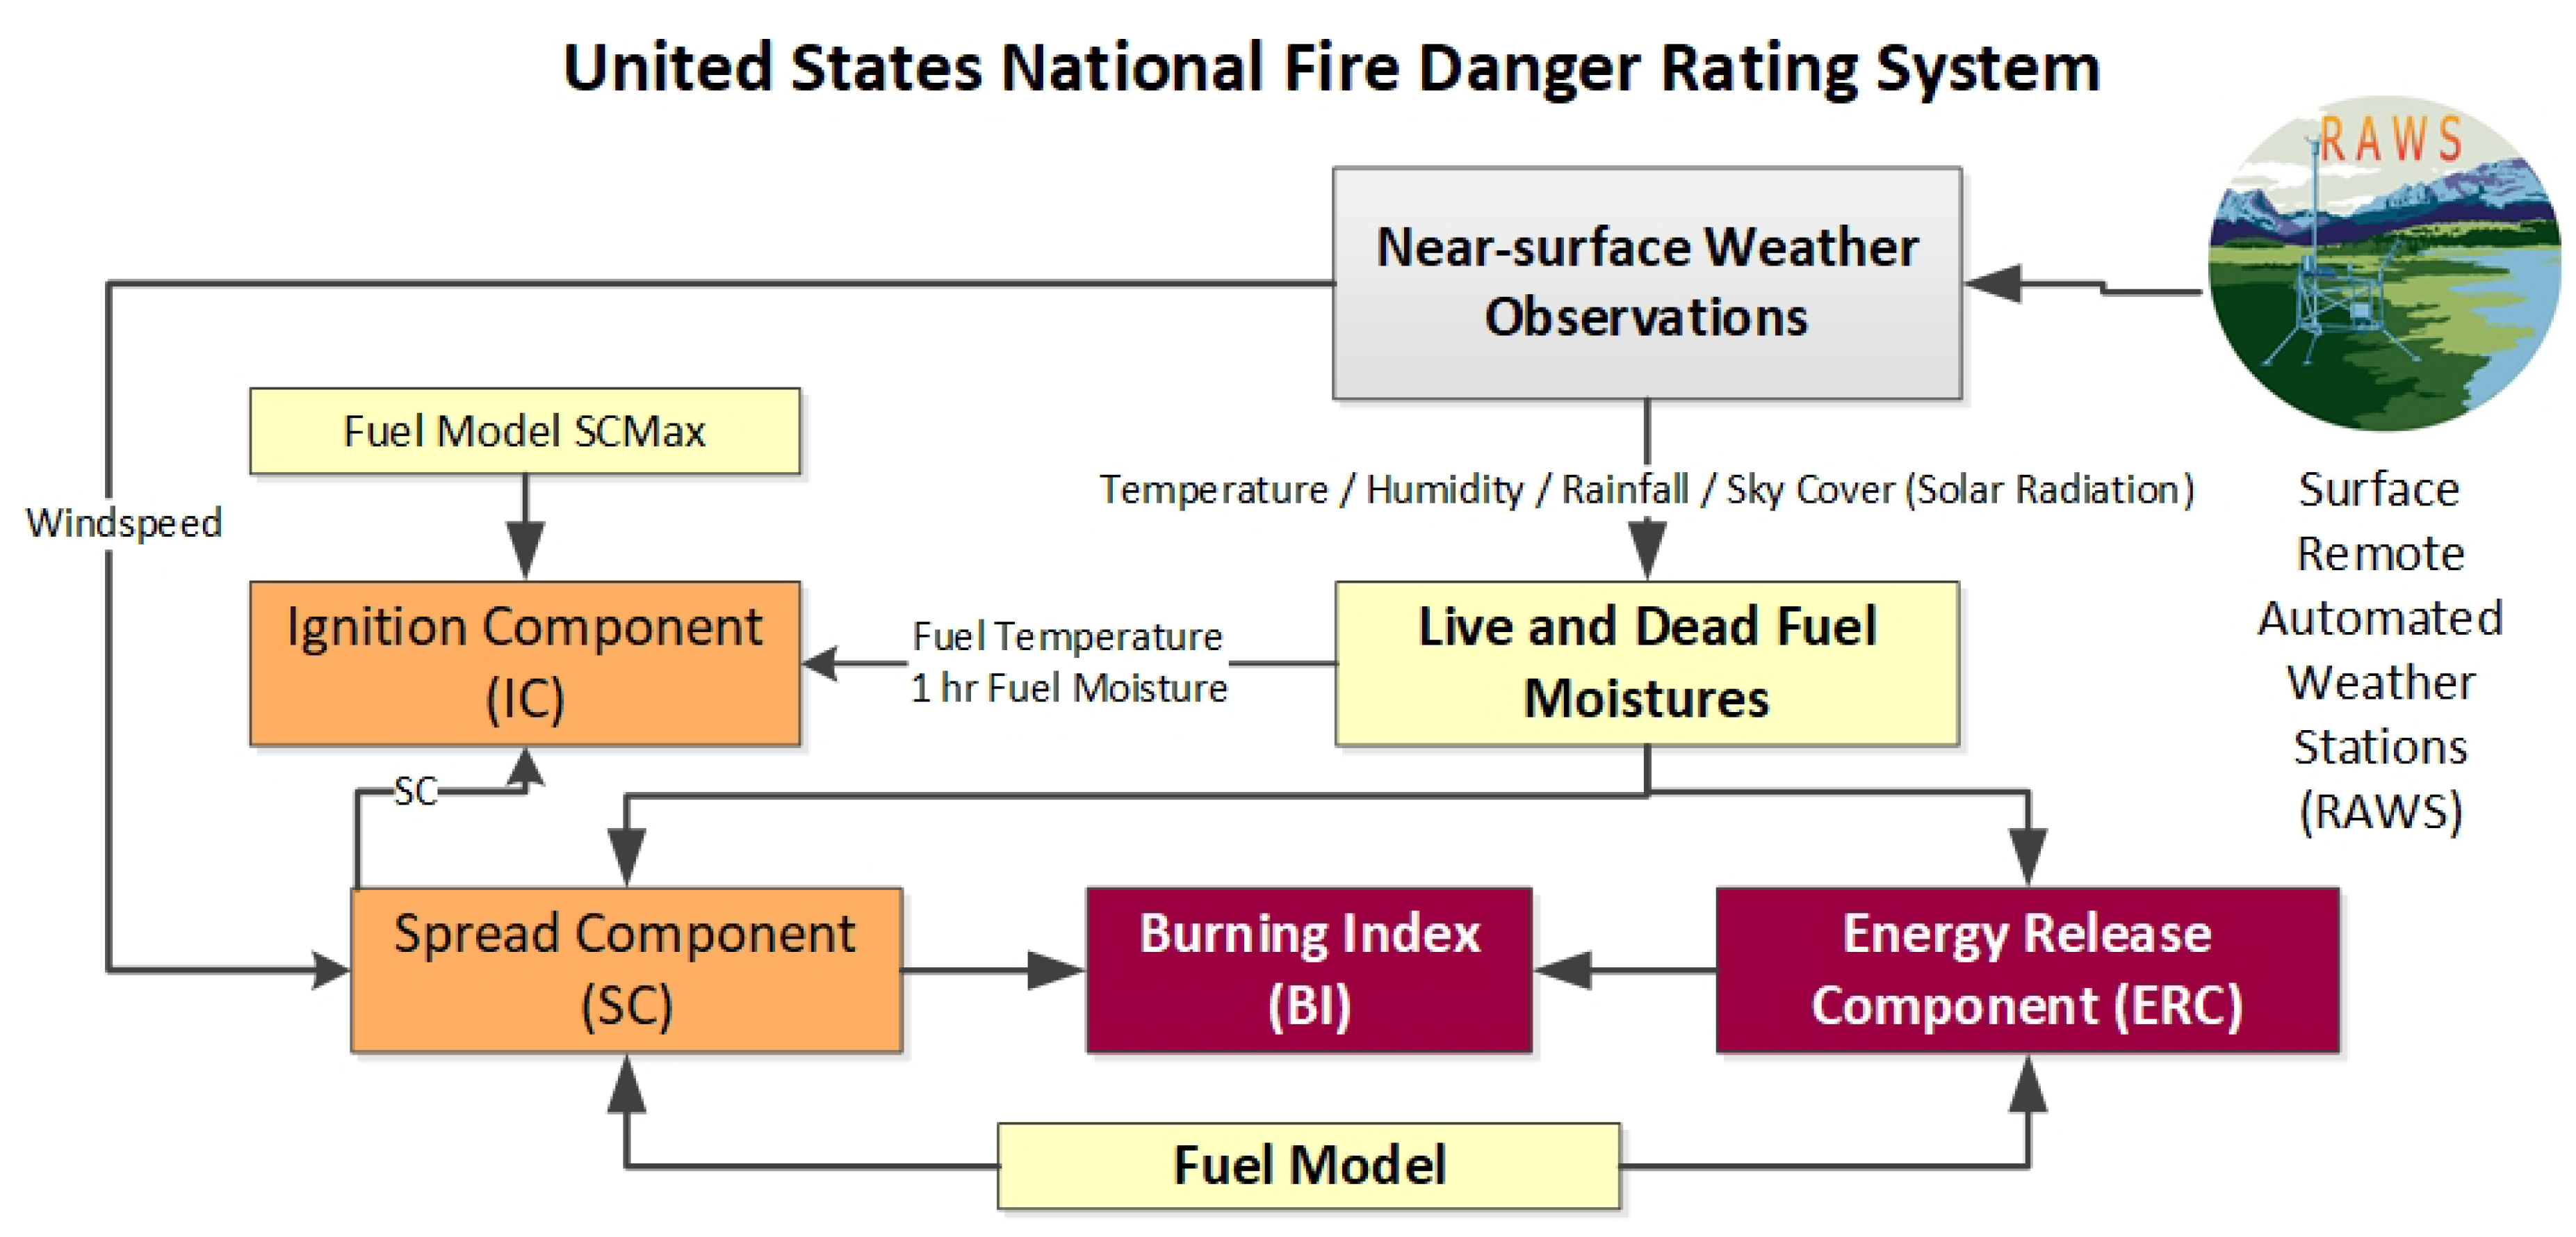
We used the daily (00Z to 00Z) gridMET (about 4-km or 1/24th° grid spacing) surface meteorological dataset that covers CONUS from 1979 to 2017 [25] to calculate fire danger indices. This dataset has been used extensively to explore a variety of connections between wildfires and climate (e.g., [7,26]). It provides daily measures of 2-m air temperature and relative humidity extrema ( T m a x , T m i n , R H m a x and R H m i n ) as well as total daily precipitation. Daily precipitation duration needed by the USNFDRS was calculated from daily precipitation amount using a simple model derived from RAWS data. For the period of record for each of 2124 weather stations (from the start of the record through Dec 2010, >10 years of data for each station), we calculated the daily mean precipitation amount for each interval of precipitation duration (0–24 h) and we fit the following model to the means for each station using non-linear least squares regression:
P D u r = 24 × ( 1 e β × P A m n t 24 )
where P D u r is the precipitation duration (hours per day) and P A m n t 24 is the daily total precipitation (inches). A single model for each station was fit using all available data for all years. β parameters for each of the 2124 weather stations were then mapped and interpolated across the 4-km domain using inverse distance weighting to create a raster data layer of β parameters across CONUS. This allowed us to transform precipitation amount into precipitation duration at every grid cell as needed by USNFDRS. The model is naturally bounded between 0 and 24 and requires only the β parameter to be estimated. Furthermore, it accounts for varying relationships between rainfall intensity and duration across the domain.
Furthermore, we supplemented this dataset with daily maximum 10-m windspeeds from the North American Regional Reanalysis [27] derived from sub-daily (8 times per day) U and V component winds, nearest-neighbor resampled to the 4-km gridMET domain.
Gridded surface weather conditions and the β layer were input into the USNFDRS model to calculate fuel moistures and fire danger indices (Figure 1). Per convention, a constant fuel model (Fuel Model G) was applied across CONUS [28]. While undoubtedly not representative of fuel variations across CONUS, using a constant model standardizes the indices so that they can be compared across space and time, essentially forcing the USNFDRS to function as a fire weather index, since only weather is varying in space and time. All calculations were performed using the 1978 version of the USNFDRS [20,29], which is the same set of equations currently implemented in operational fire danger prediction systems. This produced a 39-year, daily, CONUS-wide, 4-km gridded climatology of fuel moistures and fire danger indices.

2.1.1. ERC and BI

Of the intermediate variables and final outputs of the USNFDRS (Figure 1), fire management decisions are most often guided by ERC and BI. They are the only two metrics referenced in the Incident Response Pocket Guide (IRPG) [30], and are by far the two most common metrics used to set staffing levels and adjective fire danger ratings, as identified in the Weather Information Management System (WIMS). Fundamentally ERC and BI represent two different fire behavior characteristics: the amount of heat per area (HPA) released during flaming, and the flame length, respectively. While for a constant fuel model, HPA depends solely on fuel moisture content, flame length additionally depends on the fire’s spread rate, which is primarily driven by windspeed. Strictly speaking, BI is a function of ERC:
B I ( E R C × S C ) 0.46
where ERC is proportional to the HPA released during flaming, the Spread Component (SC) is proportional to the spread rate, and BI is proportional to flame length. Please note that due to the heavy influence of large diameter, long time-lag fuels, ERCs respond more slowly to changes in atmospheric conditions and therefore exhibit well pronounced seasonal oscillations. In contrast, due to the influence of fine dead fuels and windspeed on fire spread rates, BIs typically exhibit high-frequency day-to-day fluctuations. Using SC instead of BI to represent wind-driven variations in fire potential would be a more straightforward choice. However, SC is almost never used in operational NFDRS decision-making and the overwhelming majority of users are basing preparedness and response decisions on either ERC or BI. A survey of the indices published through WIMS on the Wildland Fire Assessment System (WFAS) for 15 July 2019 showed that out of 1907 Remote Automated Weather Stations reporting, 1012 used BI as their primary decision index, 888 used ERC and only 6 used Spread Component. Therefore, we focus only on ERC and BI to ensure that any new index we develop will be more easily interpreted and applied.

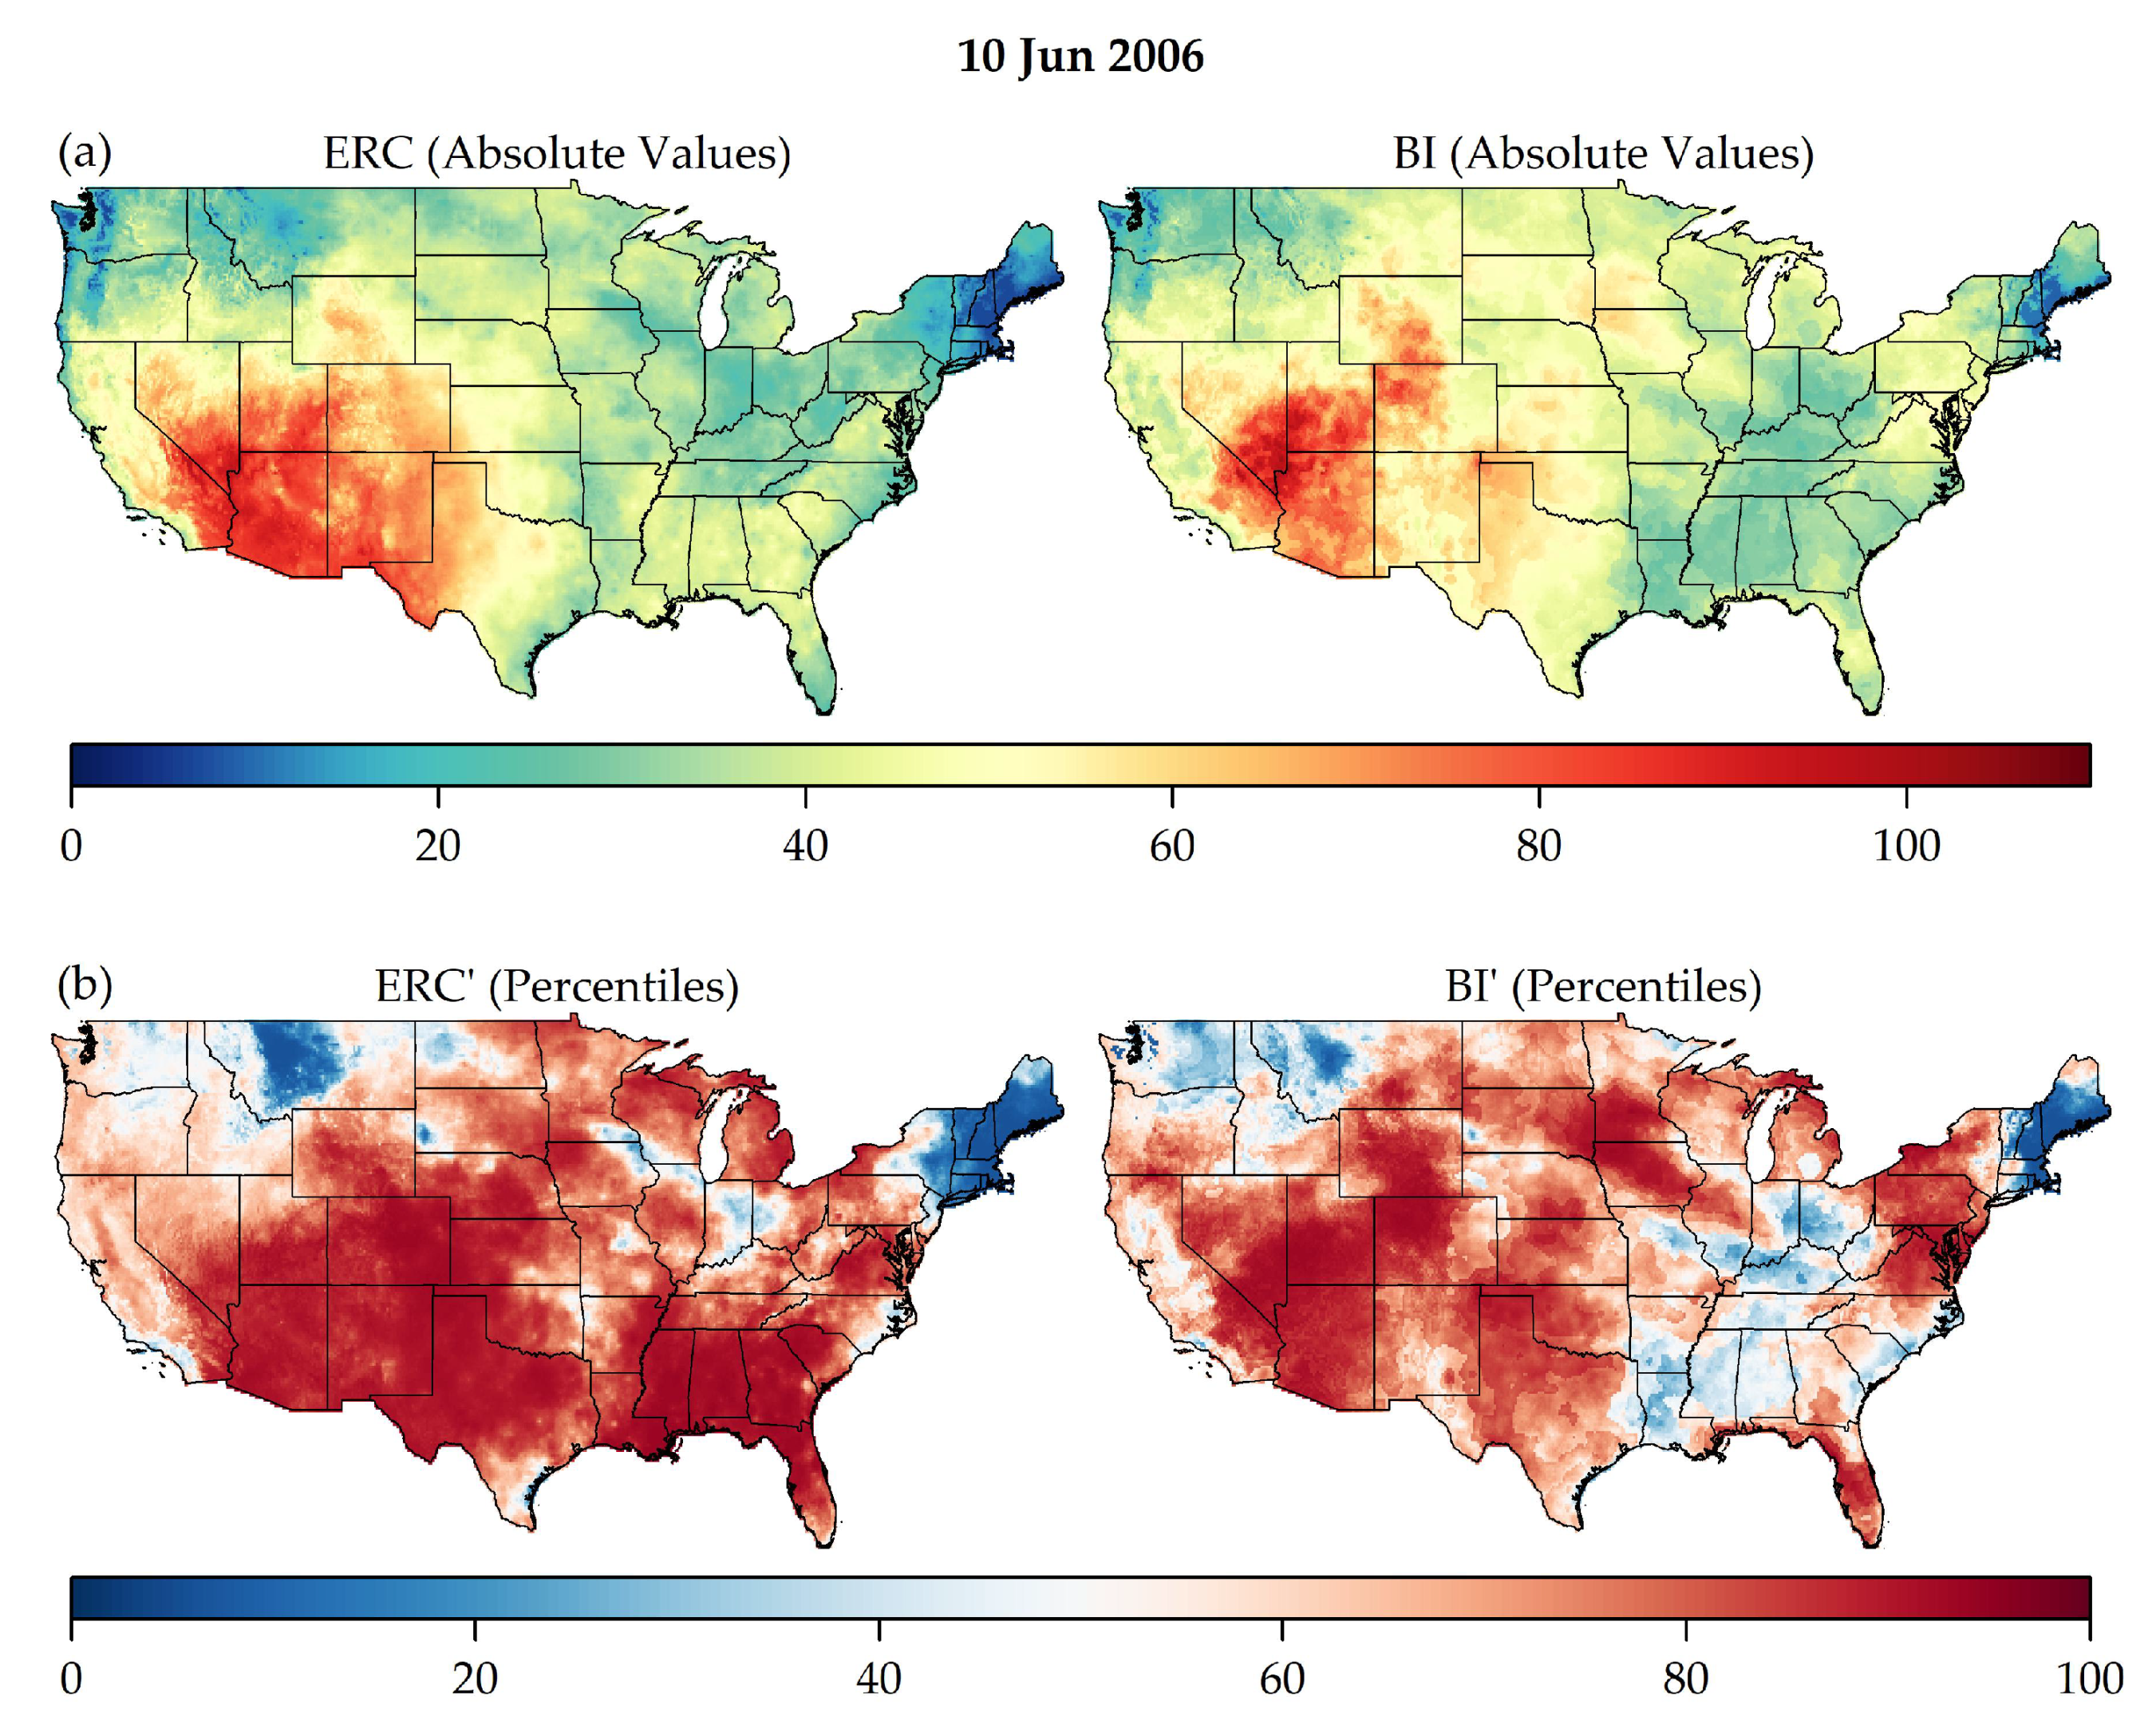
2.1.2. ERC and BI Percentiles

Although based on a uniform fuel model, historical climate variations across CONUS impart different ranges of ERCs and BIs between 4-km grid cells. Consequently it is difficult to compare absolute values between locations or over time without understanding the local climatology. For example, whereas the maximums of ERC and BI exceed 100 across much of the Southwest, the maximums of ERC and BI barely break 50 in the Northeast (Figure 2). Thus, absolute values of 50 indicate moderate fire danger in the Southwest but extreme fire danger in the Northeast. Therefore, to capture their spatial and temporal context, and to place them on a comparable scale, daily absolute values of ERC and BI in each 4-km grid cell were converted into daily percentiles relative to the 39-year climatology, hereafter referred to as ERC’ and BI’ to indicate that they are percentile values. This normalization procedure resulted in a 39-year, daily, CONUS-wide, 4-km gridded climatology of percentiles such that the 100th percentile of ERC or BI (i.e., E R C = 100 or B I = 100 ) represents the 39-year maximum absolute value in a grid cell.

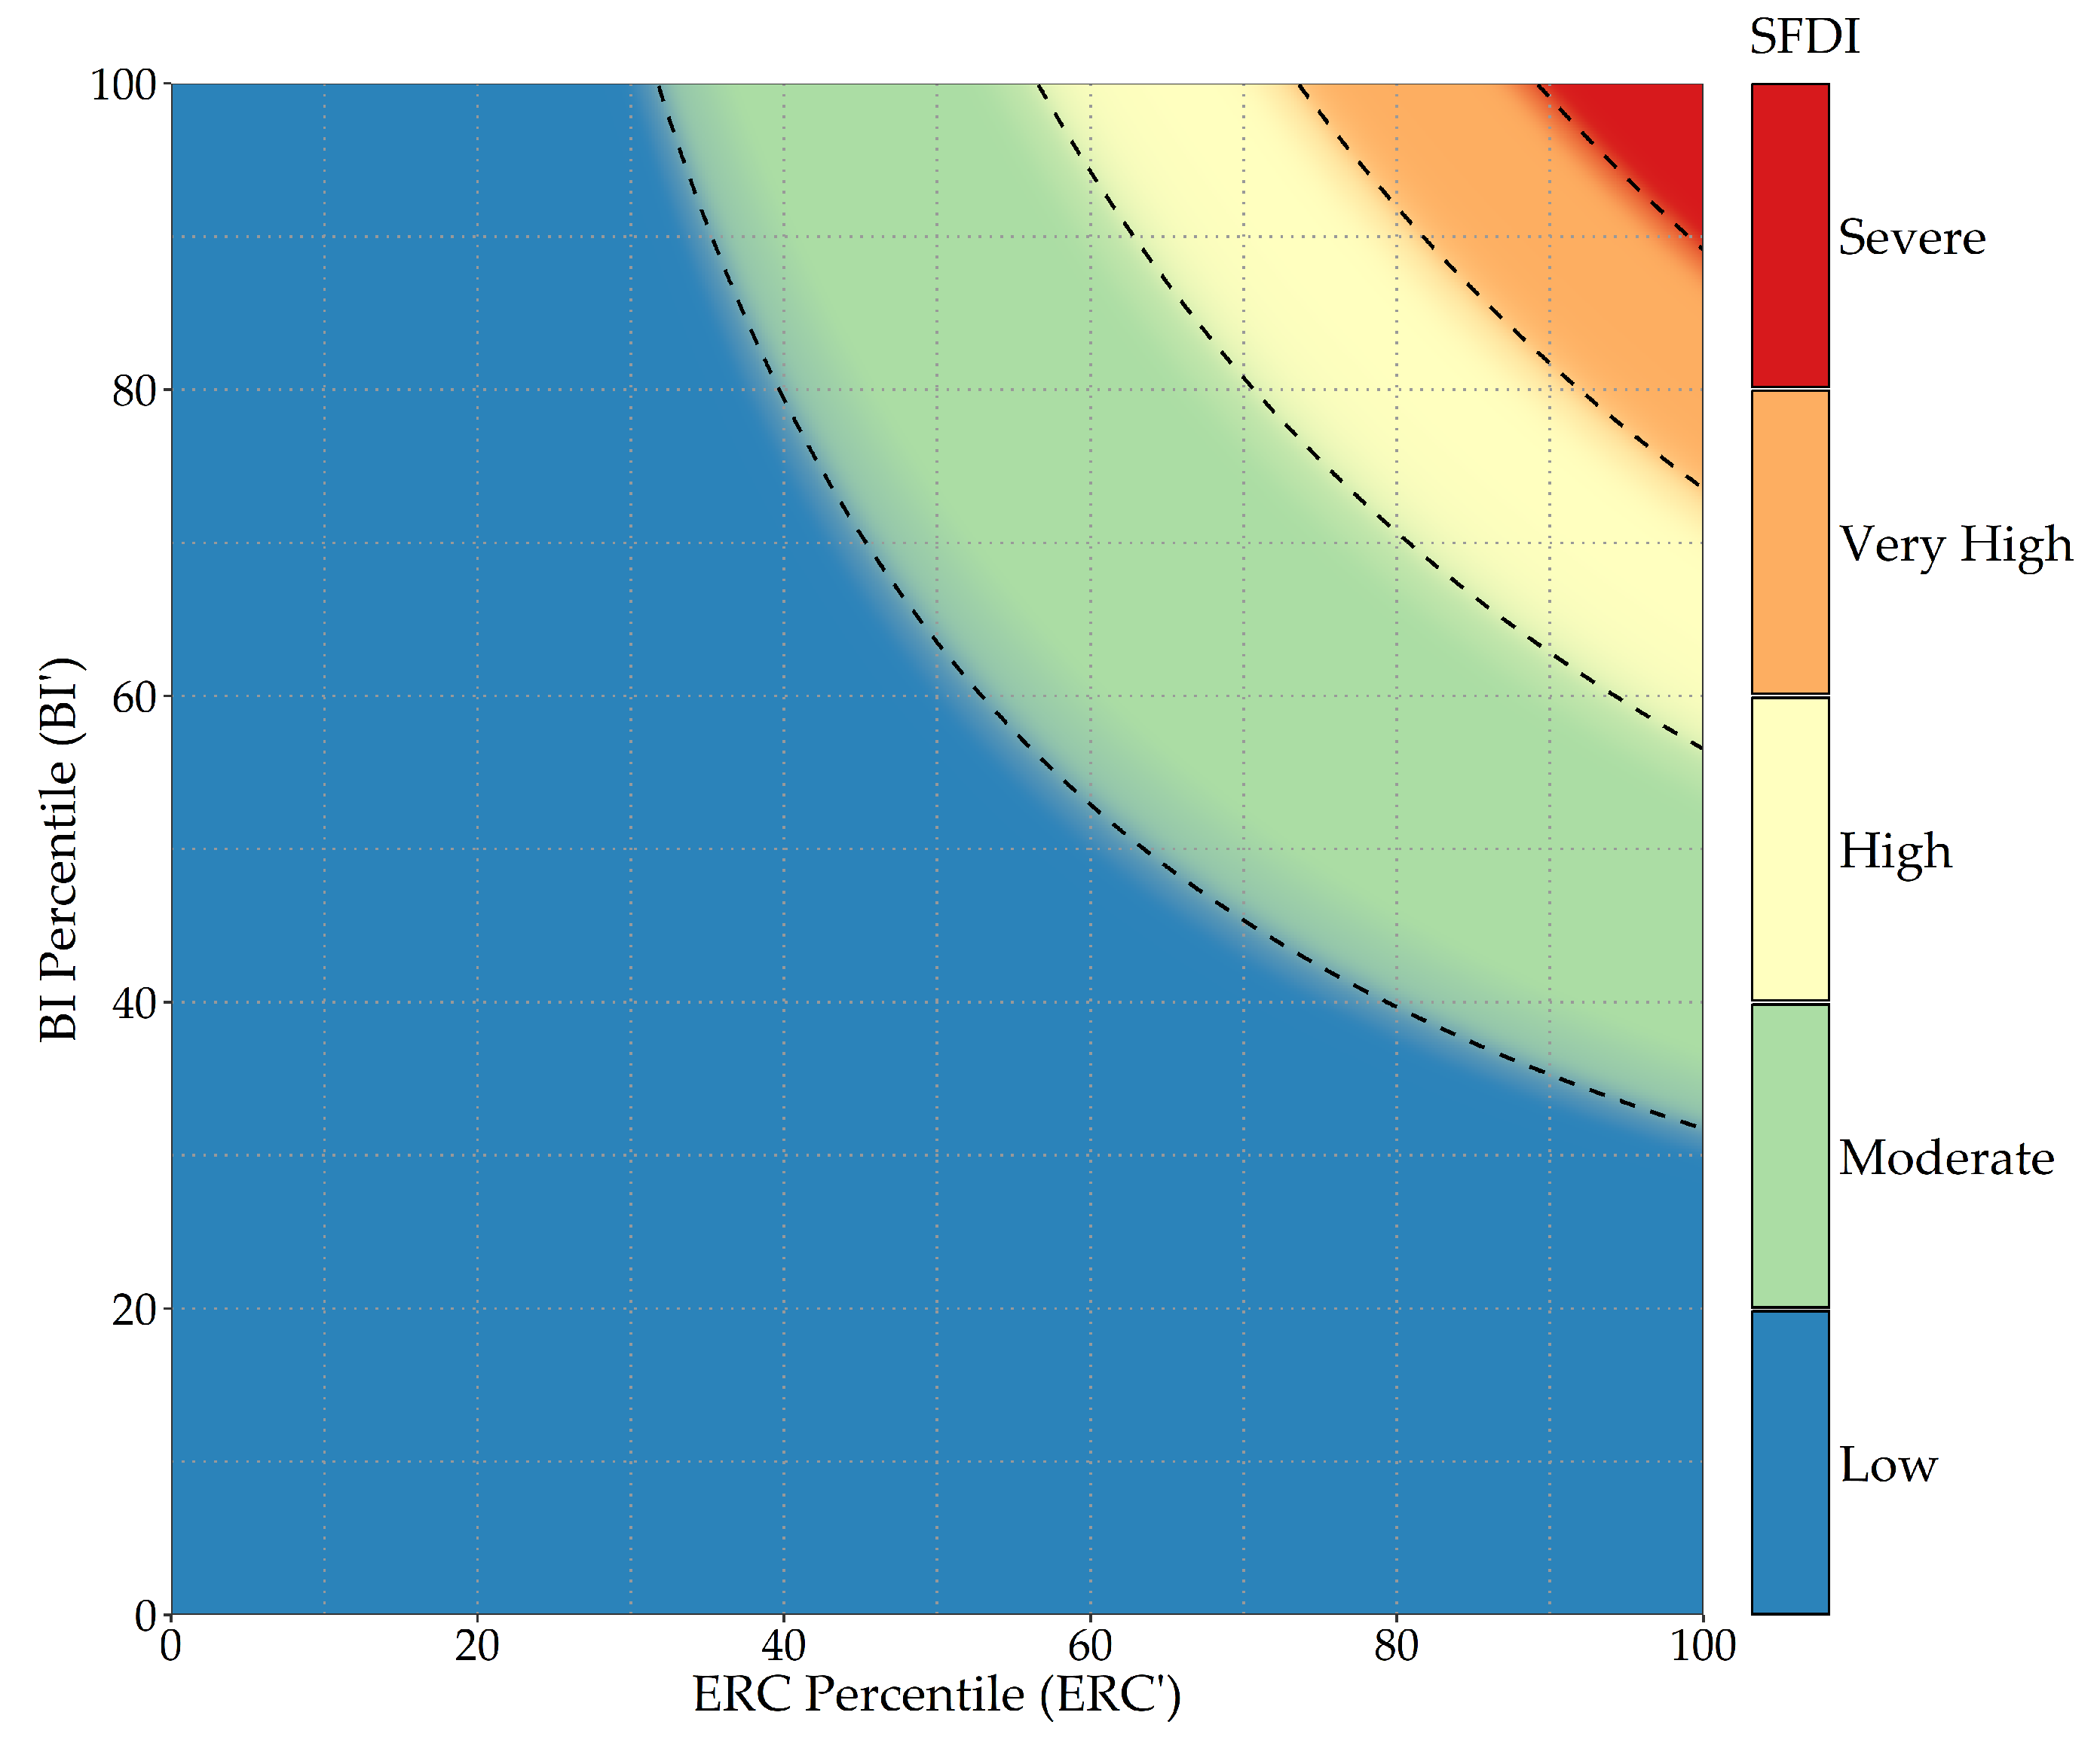
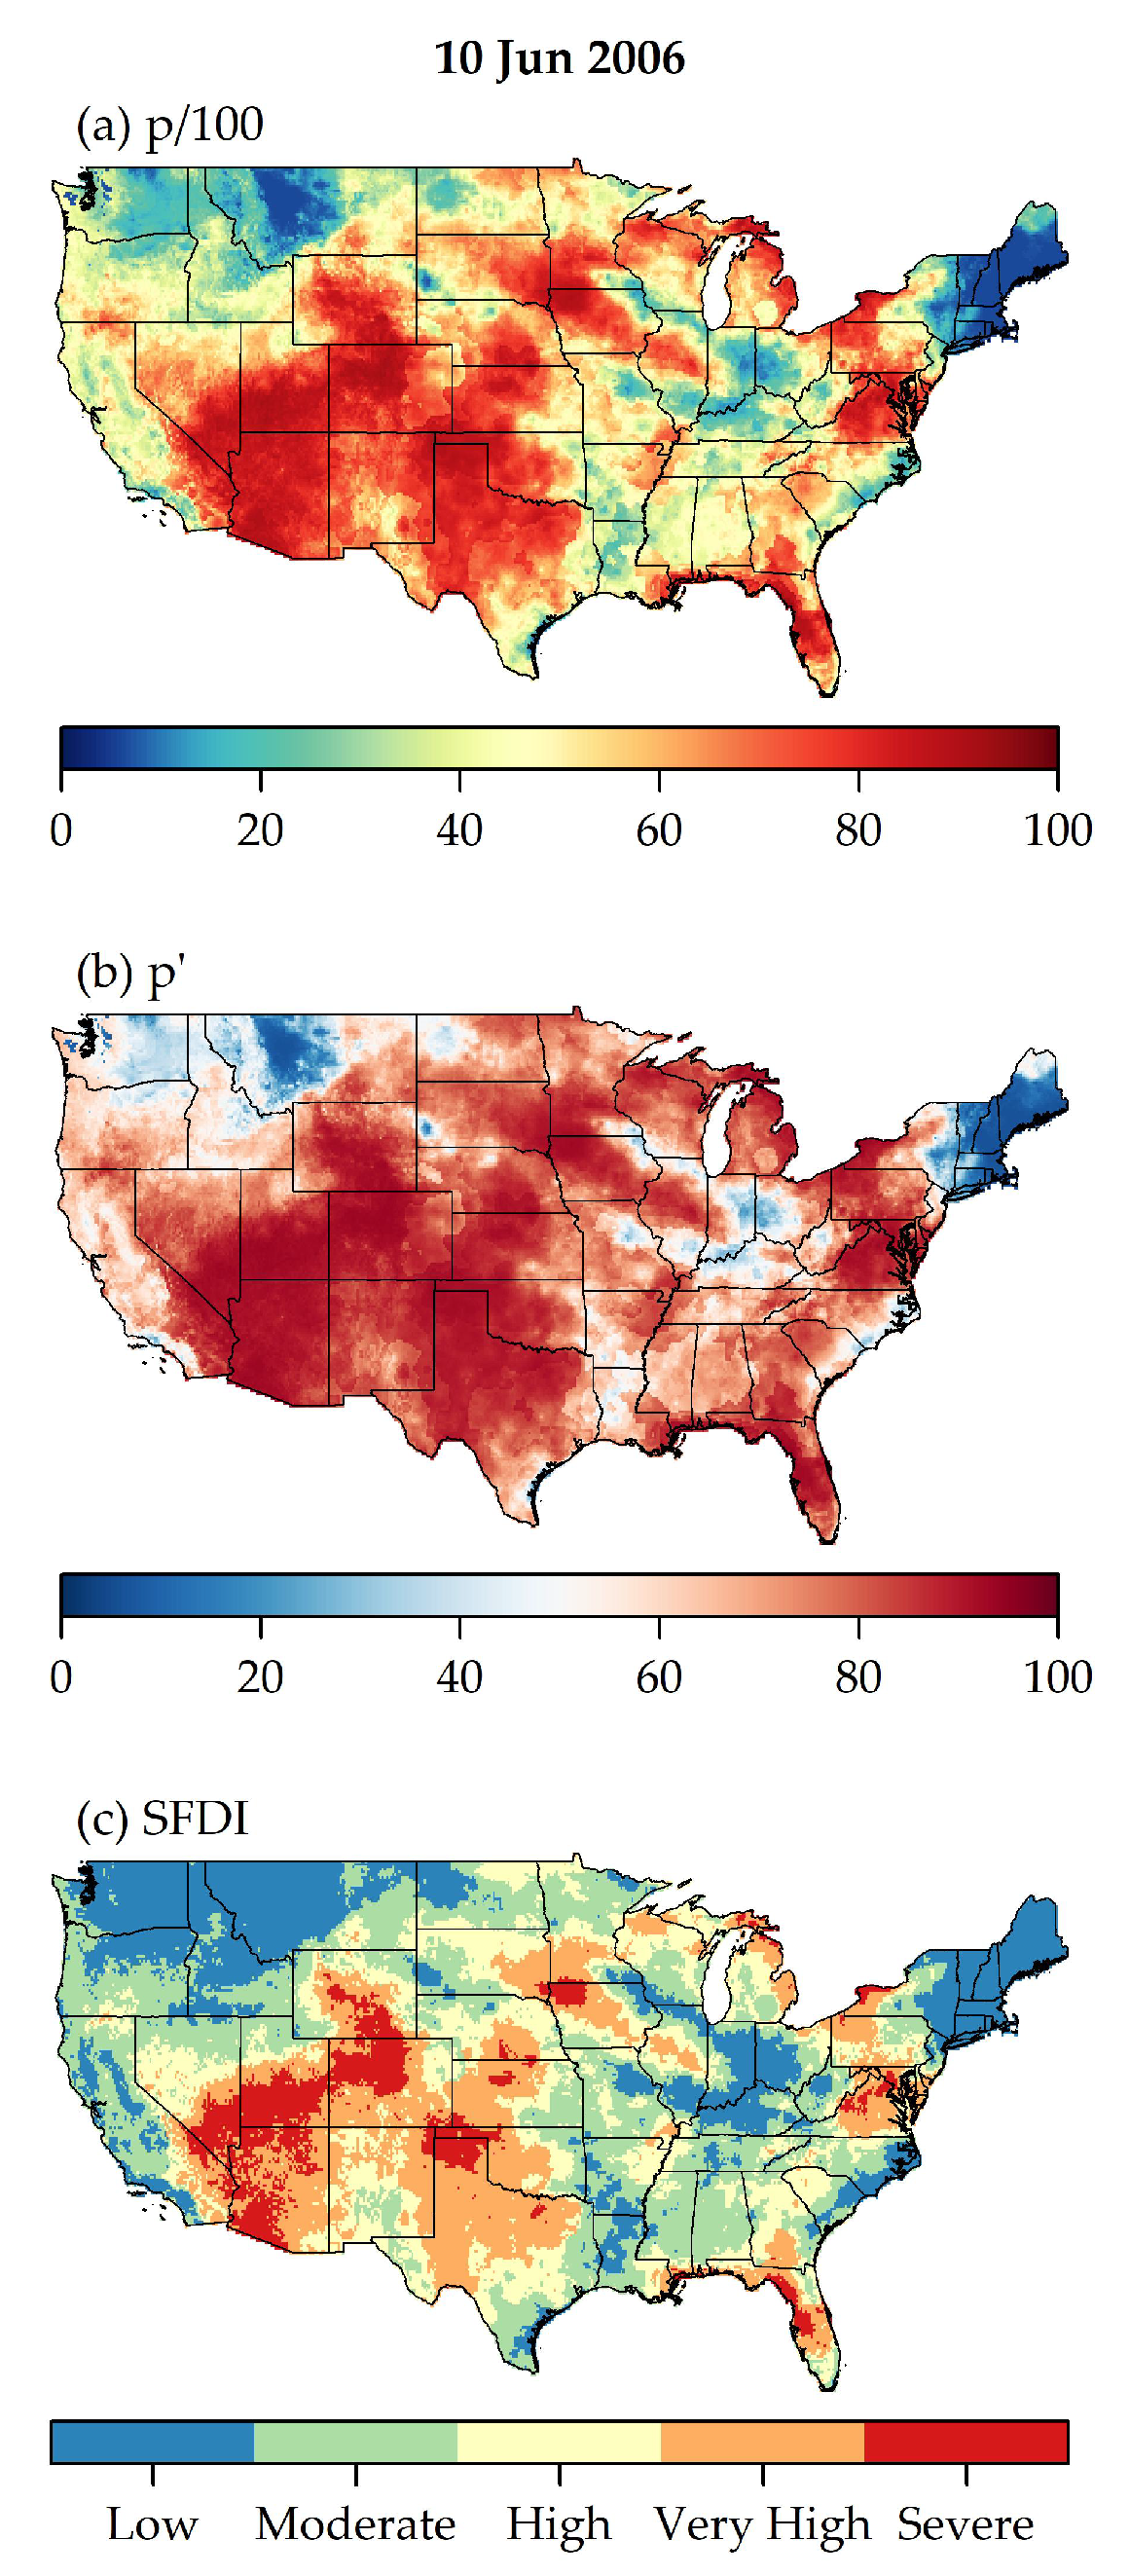
2.2. Severe Fire Danger Index

Since ERC and BI are not perfectly correlated (Figure A1 in Appendix A) it is possible for pairs of ERCs and BIs to capture two opposing but potentially dangerous surface conditions: dry and calm versus damp and windy. While the former conditions (i.e., high ERCs and low BIs) yield large amounts of heat release, the latter conditions (i.e., low ERCs and high BIs) result in rapid spread rates and tall flame lengths. Therefore, the alignment of high ERCs with high BIs should indicate the locations with the greatest potential for extreme fire behavior [31]. With the goal of identifying the conditions that pose the most serious threat to firefighter and community safety, the concept of merging ERC and BI into a single metric was formulated into the SFDI.
In practice there may be several ways to merge ERC and BI into SFDI, but here we only explore a single method based on the product of ERC and BI percentiles. Regardless of the method, SFDI calculations should be intuitive and easy to explain to fire managers and firefighters. Also regardless of the method, merging ERC’ with BI’ inevitably imposes the high-frequency, day-to-day fluctuations of windspeeds that are captured by BI’ onto the low frequency, seasonal oscillations in fuel moistures that are characterized by ERC’.
At the core of the SFDI is the product, p, of ERC and BI percentiles (i.e., p = E R C × B I ) and the percentile of p such that p = ( E R C × B I ) . Percentiles reside on a continuous scale and are therefore capable of capturing incremental changes along the entire fire danger continuum. To translate continuous values into a set of relevant, day-to-day decision support metrics, fire managers divide the local fire danger continuum into discrete classes based on historical fire danger conditions [32]. The same logic is applied here and p′ is classified into SFDI as follows:
S F D I = Severe , if 97 < p 100 Very High , if 90 < p 97 High , if 80 < p 90 Moderate , if 60 < p 80 Low , if 0 p 60
The thresholds used to classify SFDI (i.e., the 60th, 80th, 90th and 97th percentiles) coincide with the climatological breakpoints selected by US fire management agencies to define adjective fire danger ratings, establish staffing levels, preposition resources, regulate industrial activity, and restrict access to public lands, according to the Interagency Standards for Fire and Fire Aviation Operations [32]. Furthermore, these breakpoints are used to simulate fire spread probabilities throughout the US in the Wildland Fire Decision Support System [33]. Imposing these thresholds dictates that each grid cell spent exactly 60%, 20%, 10%, 7% and 3% of days in the 39-year climatology assigned to the Low, Moderate, High, Very High, and Severe classes, respectively. The application of Equation (3) is depicted in Figure 3 and ultimately resulted in a 39-year, daily, CONUS-wide, 4-km gridded climatology of SFDI.

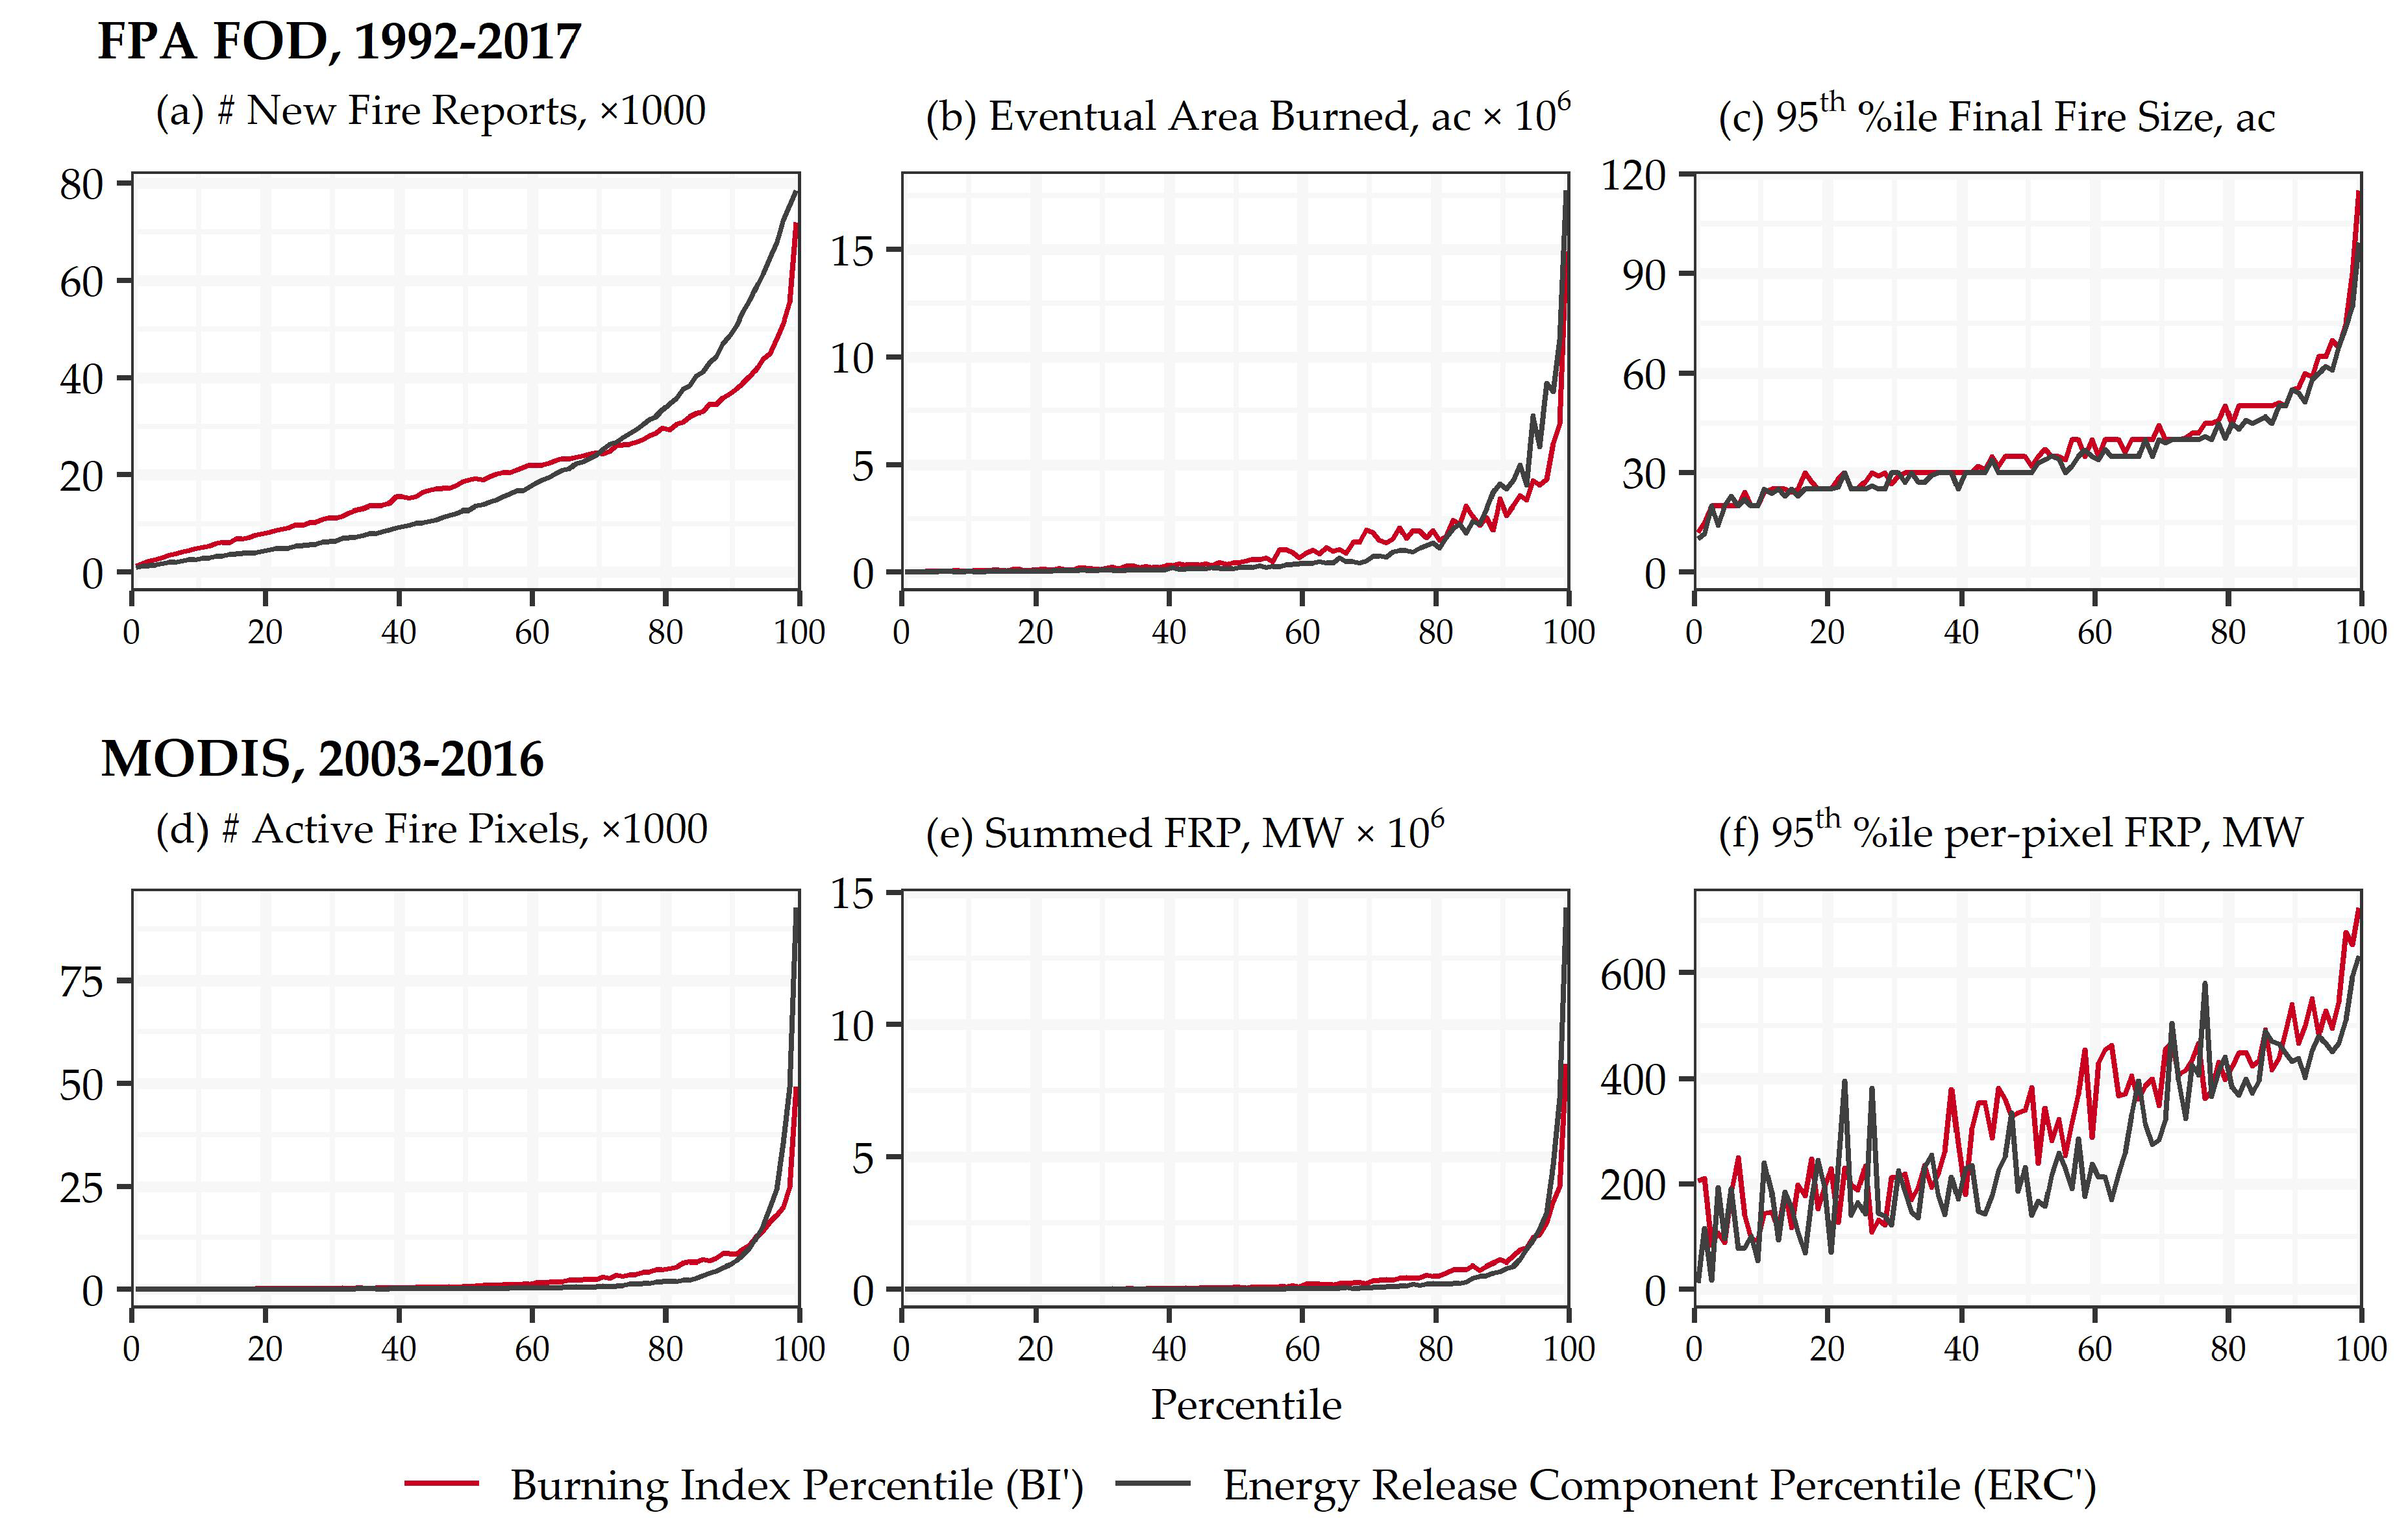
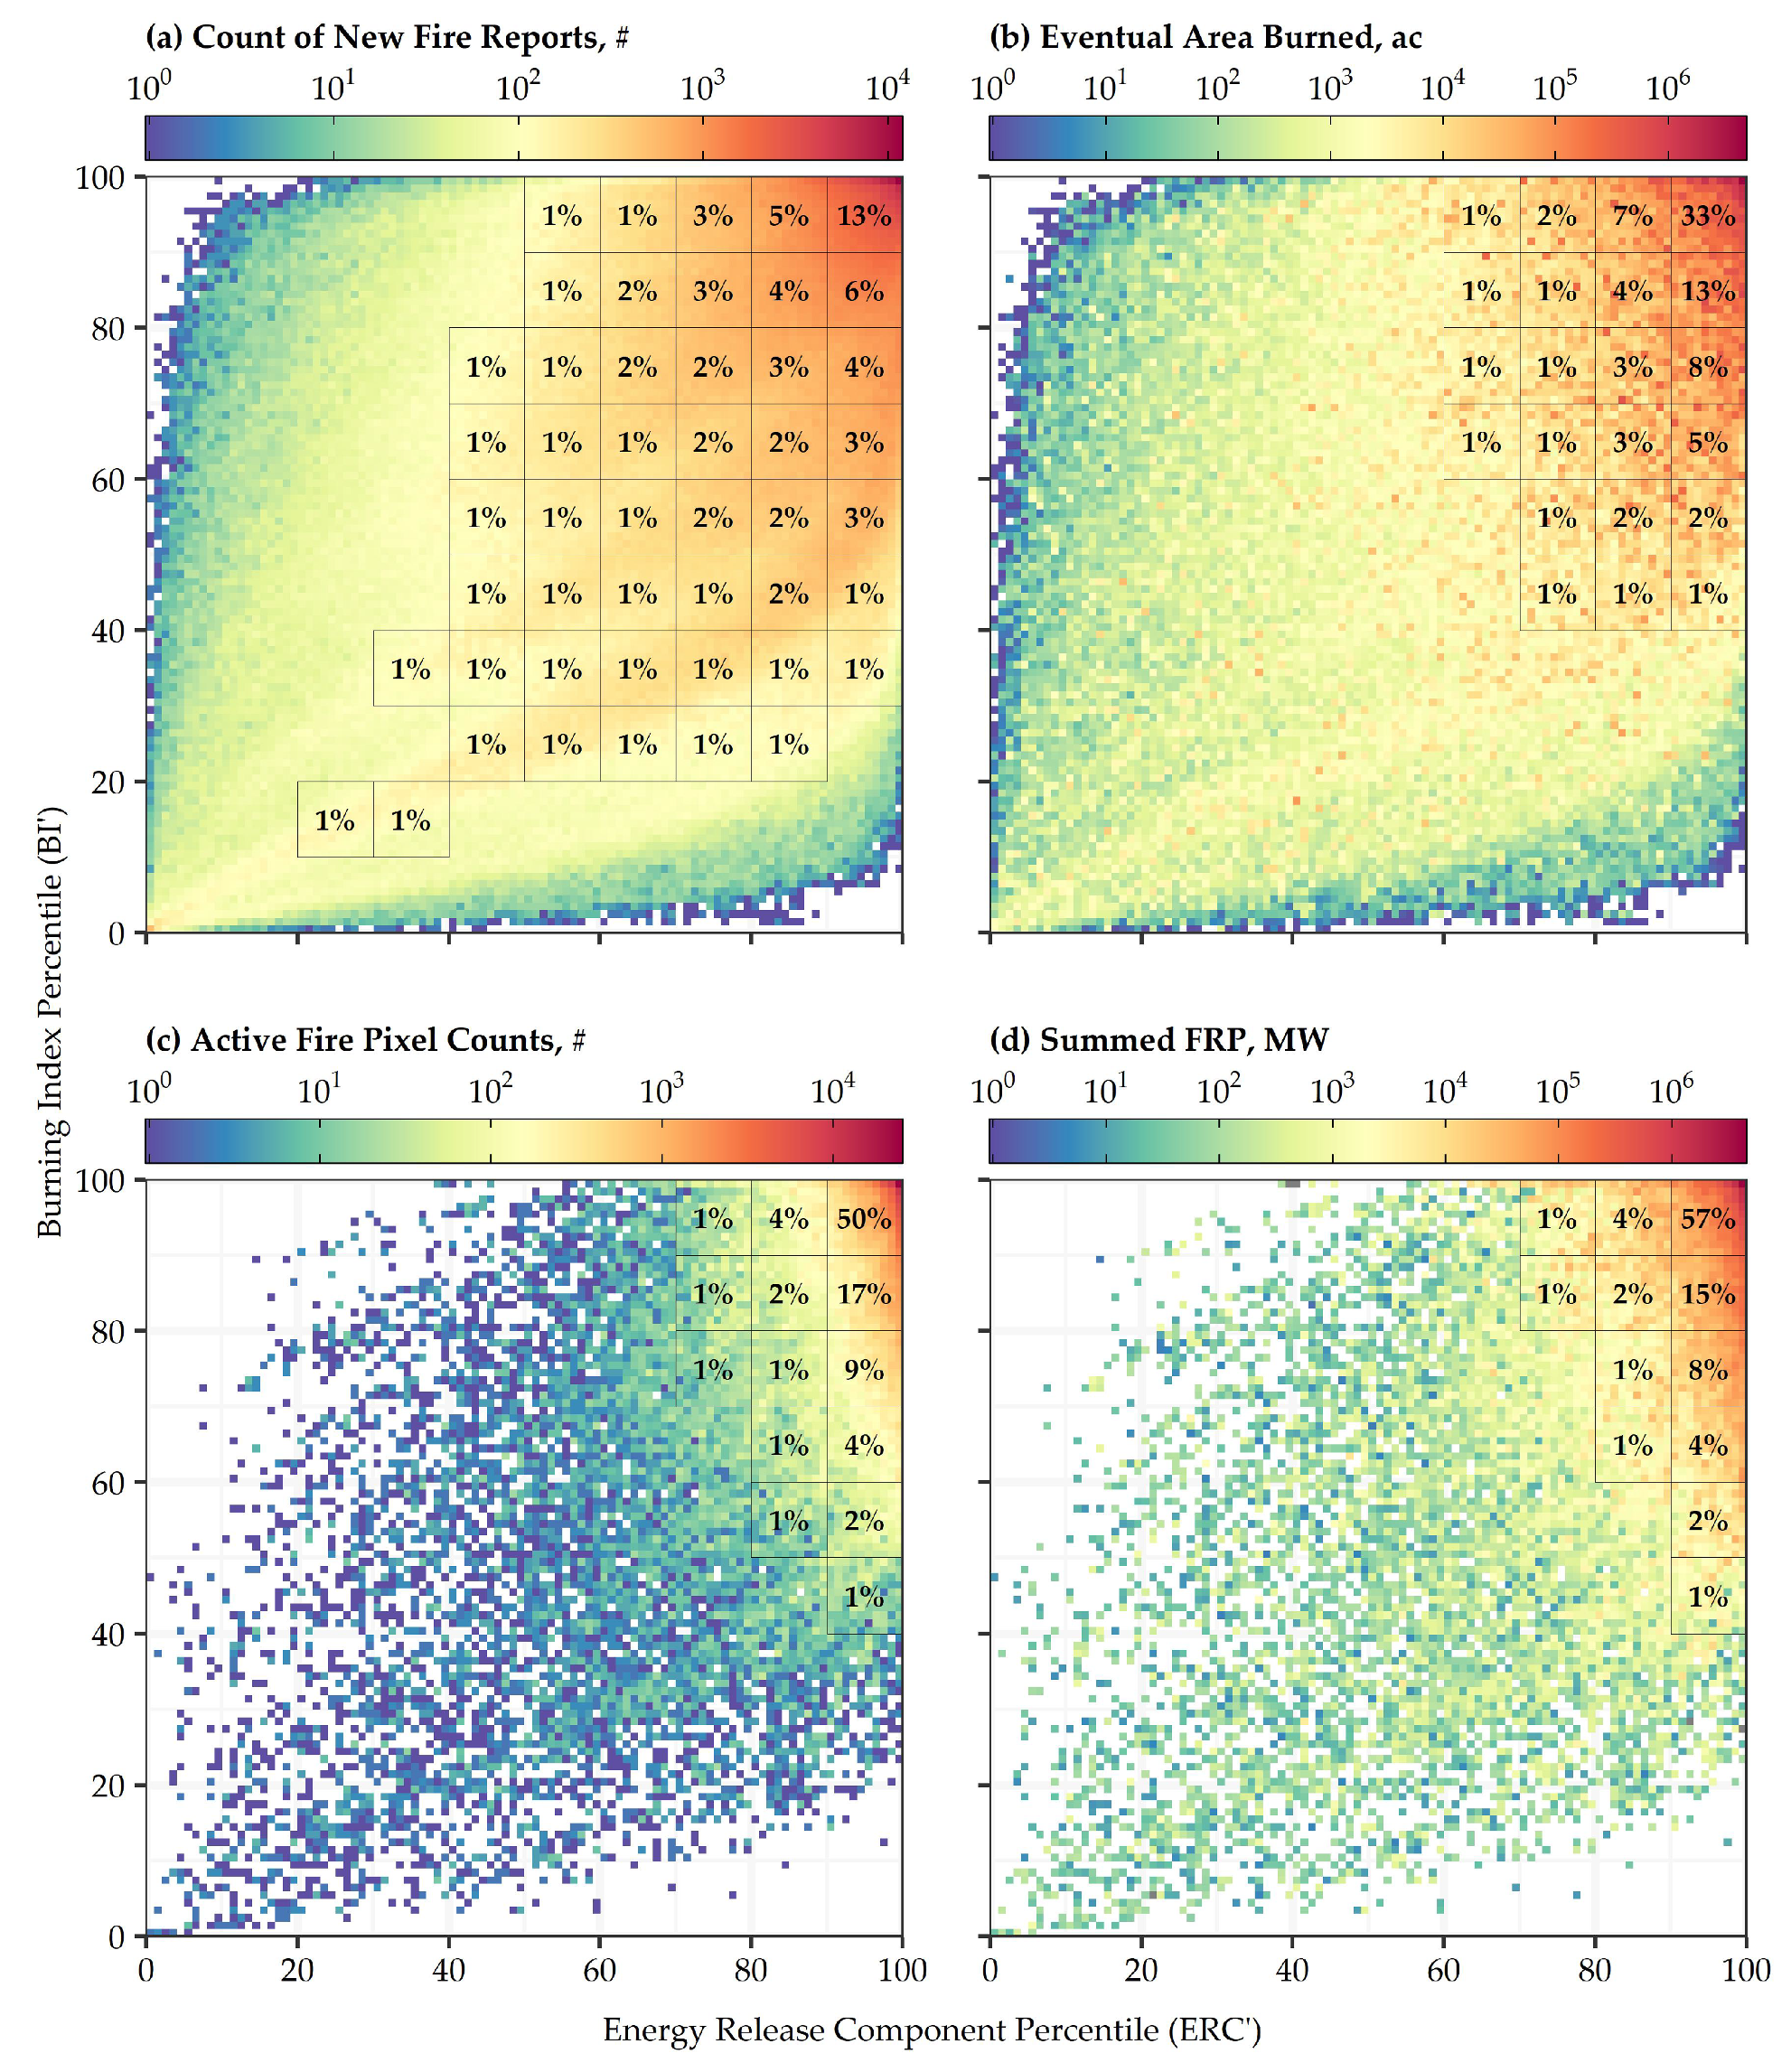
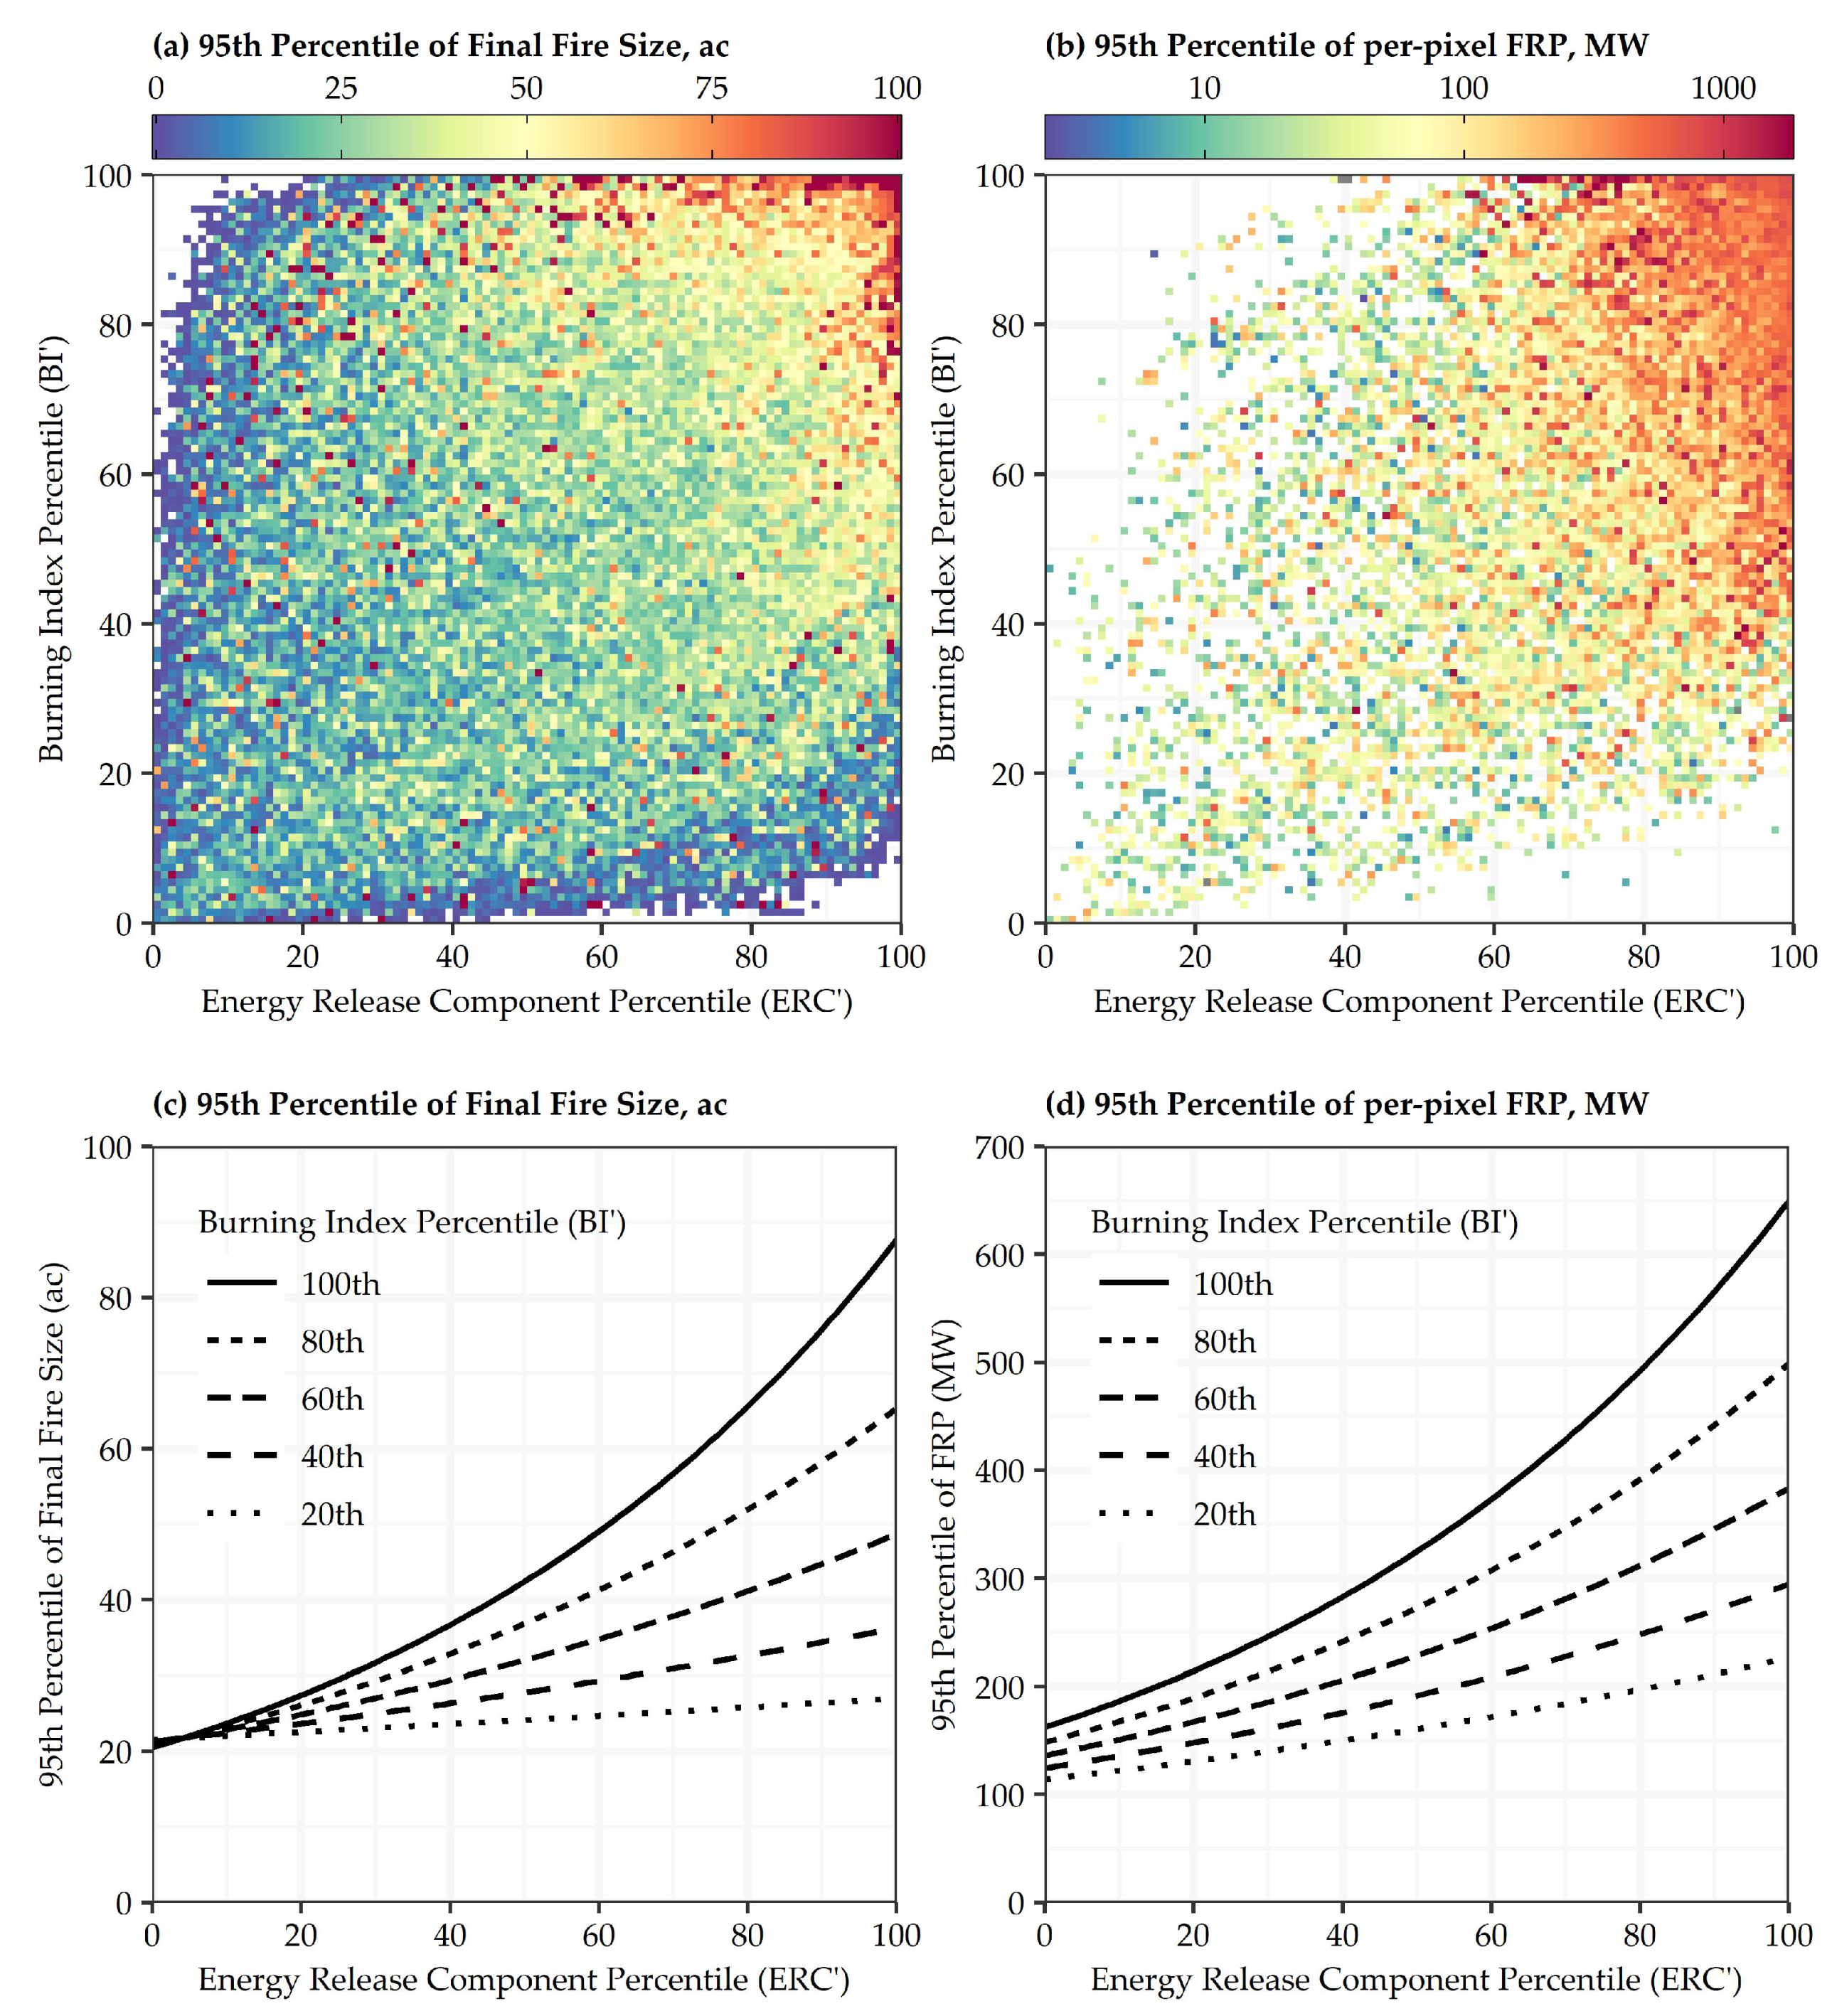
2.3. Associations with New and Ongoing Fire Activity

The utility of fire danger indices resides in their ability to identify the weather and fuel conditions under which wildland fires are most likely to ignite and become difficult to control. To this end, fire danger indices were associated with observations of fire activity compiled from two data sources. The Fire Program Analysis Fire Occurrence Database (FPA FOD) contains the discovery date, origin location, and final size of wildland fires reported by federal, state, and tribal agencies [34]. The MODIS active fire product (MCD14ML) contains the time, location and fire radiative power (FRP) emitted by fires within 1-km active fire pixels detected 4x daily during satellite overpasses [35]. Together these two datasets provide daily, CONUS-wide snapshots of both new and ongoing fire activity.
Point records in the FPA FOD were spatially and temporally intersected with the fire danger climatology so that wildland fires reported across CONUS between 1992–2017 were assigned an ERC’, BI’, and SFDI value coinciding with their origin location and discovery date. To limit MODIS active fire pixels to only those detected in known wildland fires, point records in the MCD14ML dataset coinciding with the centroid of 1-km active fire pixels were clipped to perimeters mapped by the Monitoring Trends in Burn Severity (MTBS) project between 2003–2016 [36]. This MCD14ML subset was then intersected with the fire danger climatology so that active fire pixels detected inside large wildland fire perimeters were assigned an ERC’, BI’, and SFDI value coinciding with their location and date of detection. Perimeter-clipped MODIS data are then assumed to represent day-to-day variations in large fire activity and intensity across CONUS.

2.4. Evaluations

Fire danger components and indices are typically evaluated based on the strength of their relationships with observed fire activity [28]. Although previous evaluations have been performed at the spatial scale of an individual Fire Danger Rating Area (FDRA), evaluations herein are performed CONUS-wide. Since FDRAs are delineated in part by climate class, associating fire activity with absolute values of fire danger is well justified. However, given the geographic variability in the range of absolute values (Figure 2), the only possible way to perform a CONUS-wide evaluation is by associating fire activity with percentiles of fire danger. While previous evaluations relied on logistic regressions to model the probabilities of fire-days, multiple-fire-days, and large-fire-days [28], we limited the scope of this evaluation to focus on two specific notions: (i) that a greater amount of fire activity should be observed at higher fire danger, and (ii) fires observed at higher fire danger should exhibit more extreme fire behavior.
To quantify the amount of fire activity observed at different fire danger conditions, new fire reports contained in the FPA FOD and active fire pixels contained in the MCD14ML product were sorted into bins of ERC’ and BI’. Equally wide bins varied from as narrow as 1 percentile to a maximum of a decile. The total amount of fire activity observed in each bin was summarized according to (i) the total number of new fires discovered, (ii) the total area burned by each new fire on and after the discovery date, (iii) the total number of active fire pixels detected, and (iv) the total sum of FRP detected. Marginal bins were used to isolate and evaluate a single index (either ERC’ or BI’), while joint bins were used to evaluate combinations of ERC’ and BI’. It is expected that equally wide bins (i.e., bins that contain an equal number of days) of ERC’, BI’, or a combination of ERC’ and BI’, should capture a greater proportion of fire activity at higher fire danger.
In addition to the total amounts, distributions of final fire sizes and distributions of FRP were used to summarize fire characteristics observed in each marginal and joint bin of ERC’ and BI’. Since both distributions of final fire sizes and FRP are notoriously right-skewed e.g., [37,38], summary statistics were calculated based on the log-transformed values. Even after transformation, however, distributions of final fire sizes still contain a reporting artifact whereby fire sizes are often rounded to whole numbers or convenient fractions such that fire counts tend to stack up at discrete fire sizes. The combination of a long right tail and a reporting bias towards common and/or convenient sizes makes it difficult to confidently summarize central tendencies. Moreover, the effects of increasing fire danger might not simply shift the locations of the distributions, but could possibly alter their scale and shape thereby invalidating any assumptions of constant variance [39]. Therefore, instead of summarizing fire characteristics by medians or means, distributions of final fire sizes and FRP in each marginal or joint bin of ERC’ and BI’ were summarized by their 95th percentile [40]. Quantifying the 95th percentile of final fire sizes and per-pixel values of FRP is intended to evaluate whether (i) higher fire danger on the discovery date leads to a greater proportion of larger fires, and (ii) higher fire danger supports more energetic active fire pixels.
Not only are the 95th percentiles of final fire sizes and FRP used to demonstrate the ability of ERC’ and BI’ to independently capture extreme fire behavior, these fire characteristics are also used to test for an interaction between ERC’ and BI’. The assumption underlying the development of the SFDI is that ERC’ and BI’ together are better predictors of fire activity than either alone. Specifically, we posit that the effects of BI’ on fire behavior depend on ERC’, i.e., whereas the influence of high BIs on final fire sizes and FRP should be minimized by damp fuels at low ERCs, the capacity of high BIs to promote extreme behavior should be exacerbated by dry fuels at high ERCs. The interactive effects of these two variables were examined by constructing quantile regressions using the quantreg package in R [41] to model the 95th percentiles (i.e., τ = 0.95) of final fire sizes and FRP based on ERC’, BI’, and their interaction. Significance tests for variable inclusion were assessed using p-values and model selection was based on the Akaike Information Criterion, AIC [42].

2.5. Forecasting the Severe Fire Danger Index

In addition to the historical analysis, SFDI calculations were built into an operational system using the NDFD [24], which produces gridded forecasts at least twice daily at 2.5-km grid spacing for CONUS, Alaska, Hawaii, Puerto Rico, and Guam. These forecasts were summarized over 24 h periods to produce daily forecasts of mean, maximum, and minimum temperature, and relative humidity, as well as precipitation duration in hours and midday (21Z) windspeed. In this case, midday windspeed was chosen to more align with operational practices of using 1200 or 1300 local time wind observations for fire danger rating assessments. We also leverage 100 h and 1000 h fuel moisture contents calculated at nearly 2000 RAWS each day to provide initial forecast conditions [43]. These heavy dead fuel moistures were interpolated across CONUS using inverse distance weighting to provide initial conditions to the 100 and 1000 h fuel moisture forecasts. This system produces daily forecasts of the ERC, BI, ERC’, BI’ and SFDI for the next seven days. ERC’, BI’ and SFDI are computed by comparing the forecast ERC and BI to their respectively 39-year climatologies described earlier that have been resampled to 2.5-km grid spacing using the nearest-neighbor method. In this study, we present results using the next day forecast, produced operationally at 0530 US mountain standard time each morning and provided to fire managers, firefighters, and the public through the US Forest Service Fire and Aviation Management-supported WFAS [44] (https://m.wfas.net). These forecasts were archived daily from 01 August 2017 through 01 December 2018.
To provide a view of the early-warning capabilities of the SFDI and to illustrate the spatial predictive power of this operational system, archived daily forecasts were analyzed for nine large, destructive, and deadly fire events that occurred in California during 2017 and 2018. Fire danger conditions during the initial stages of the fires were characterized by identifying the 2.5-km NDFD grid cells that contained fire activity on the start date and the day following the start date using the 375-m active fire pixels detected by the Visible Infrared Imaging Radiometer (VIIRS). In contrast to the MODIS 1-km grid spacing, the VIIRS 375-m grid spacing provides a finer level of detail for identifying active fire areas [45]. Forecast performance was evaluated by summarizing the 2.5-km grid cells that were burned during the first two days of the incidents according to the SFDI.
Forecast performance was also evaluated beyond the initial stages of the California fires. To limit observations to known wildland fires in the absence of an updated MTBS dataset, MODIS active fire pixels detected CONUS-wide from 01 August 2017 through 01 December 2018 were clipped to incident perimeters downloaded from the Geospatial Multi-agency Coordinating Group (GeoMAC) website [46]. Active fire pixels were spatially and temporally intersected with the NDFD forecast and then summarized by SFDI. Evaluations of the 2.5-km gridded NDFD forecast were performed identical to the evaluations of the 4-km gridded climatology and were based on the number of active fire pixel counts, the sum of FRP, and the 95th percentile of per-pixel values of FRP.

2.6. Comparing SFDI to Firefighter Entrapment and Fatality Events from 1979–2017

The development of an index that tracks well with observed fire activity, and the technical capacity to forecast and map episodes of severe fire danger, together form the foundation of an operational, early-warning system targeted at improving wildland firefighter situational awareness and safety. At a minimum, increased fire behavior may postpone containment opportunities [47,48], but under worst-case scenarios, rapid and unexpected accelerations towards extreme fire behavior can lead to wildland firefighter entrapments [49]. To directly evaluate the capacity of the SFDI to indicate life-threatening fire environments, a wildland firefighter entrapment database [49] containing 178 events between 1979–2017 was intersected with the fire danger climatology. Each record in this database was assigned an ERC’, BI’ and SFDI value coinciding with the location and date of the entrapment. The number of entrapments, the number of firefighters entrapped, and the number of fatalities resulting from the entrapments were summarized by SFDI to assess the possible use of the SFDI to convey dangerous fire environment conditions.

3. Results

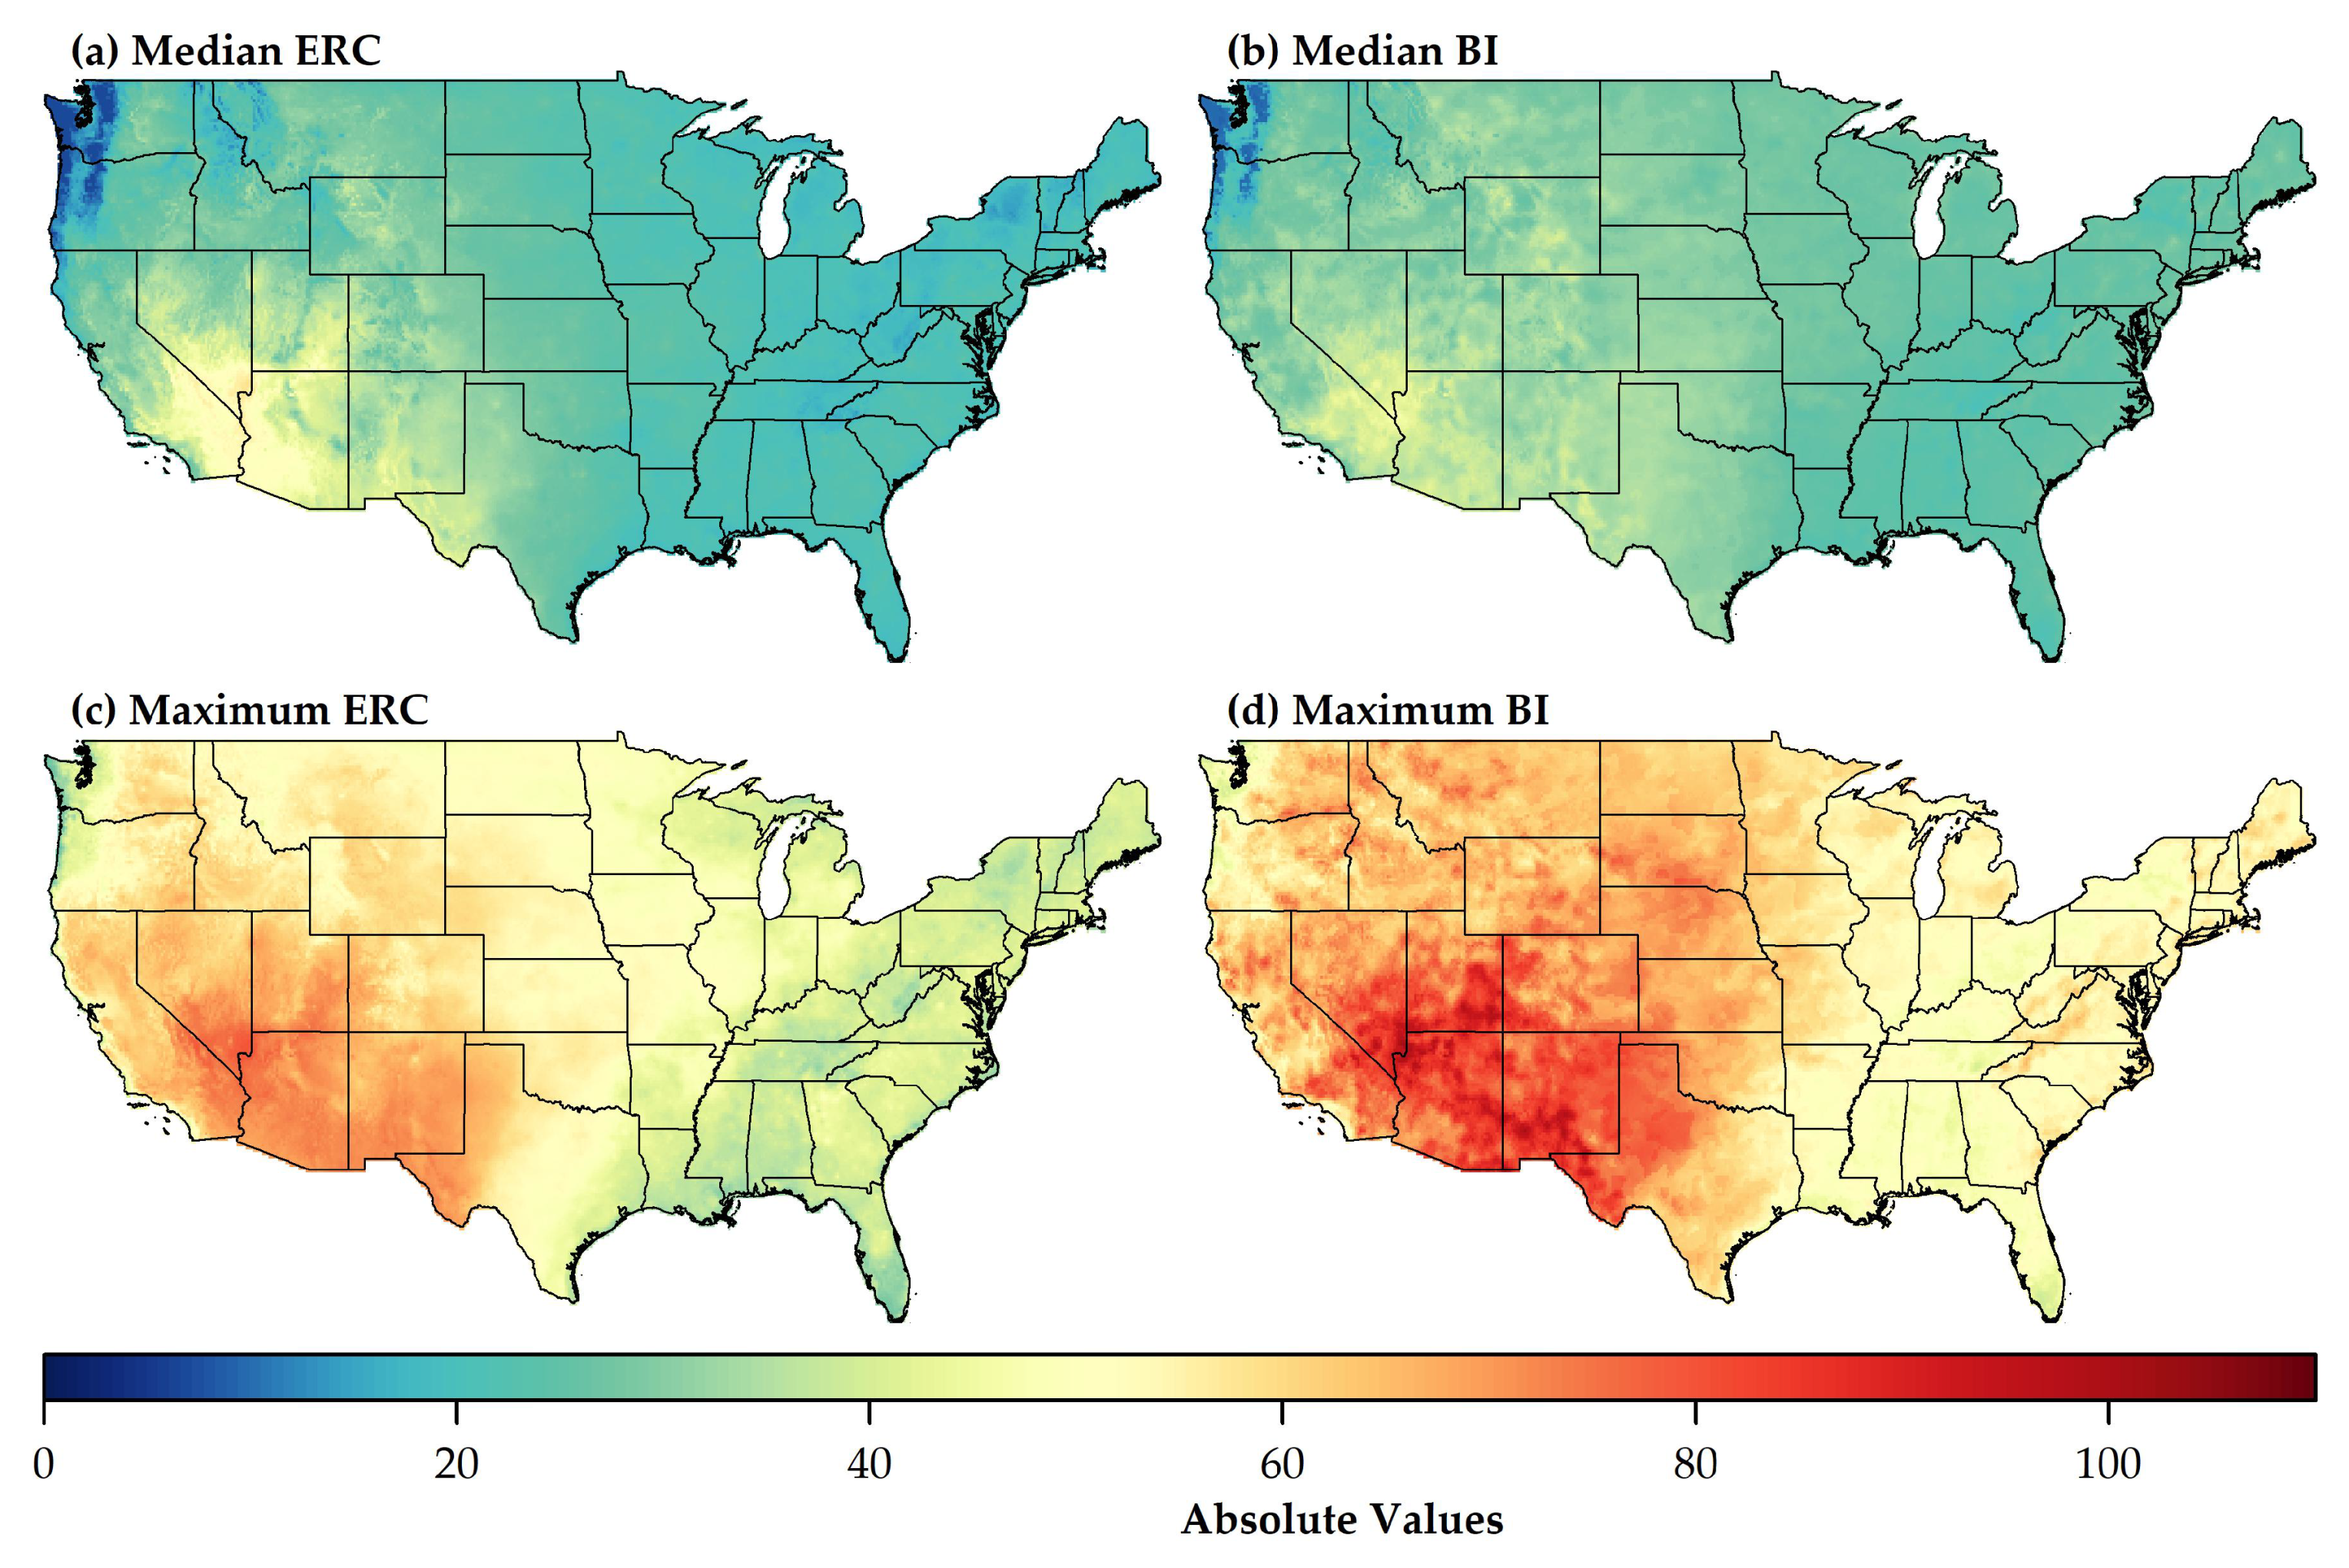
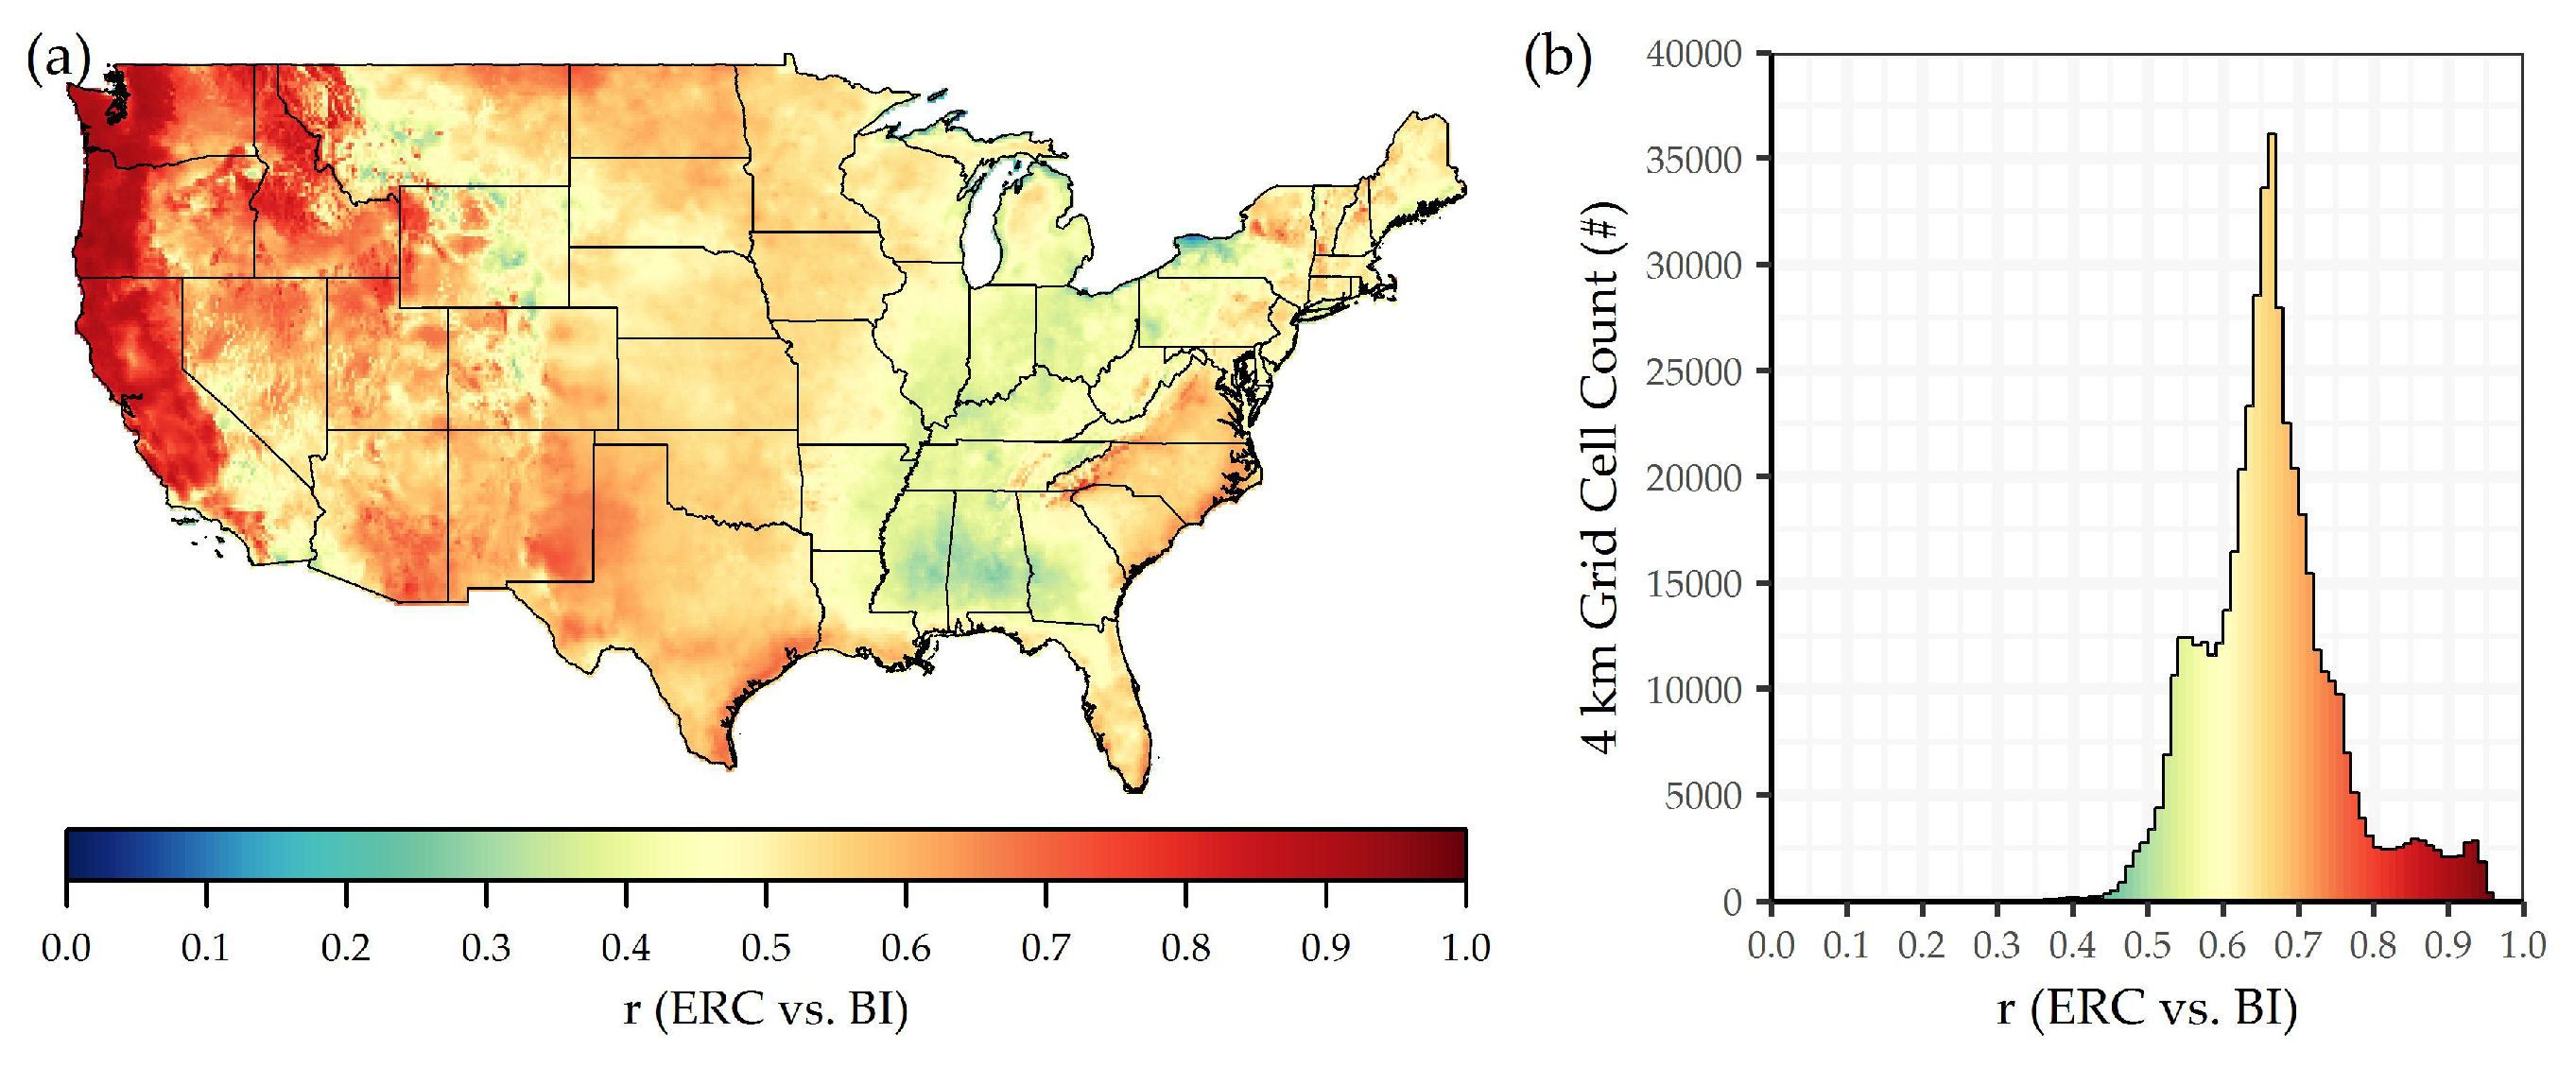
3.1. ERC, BI and Their Percentiles
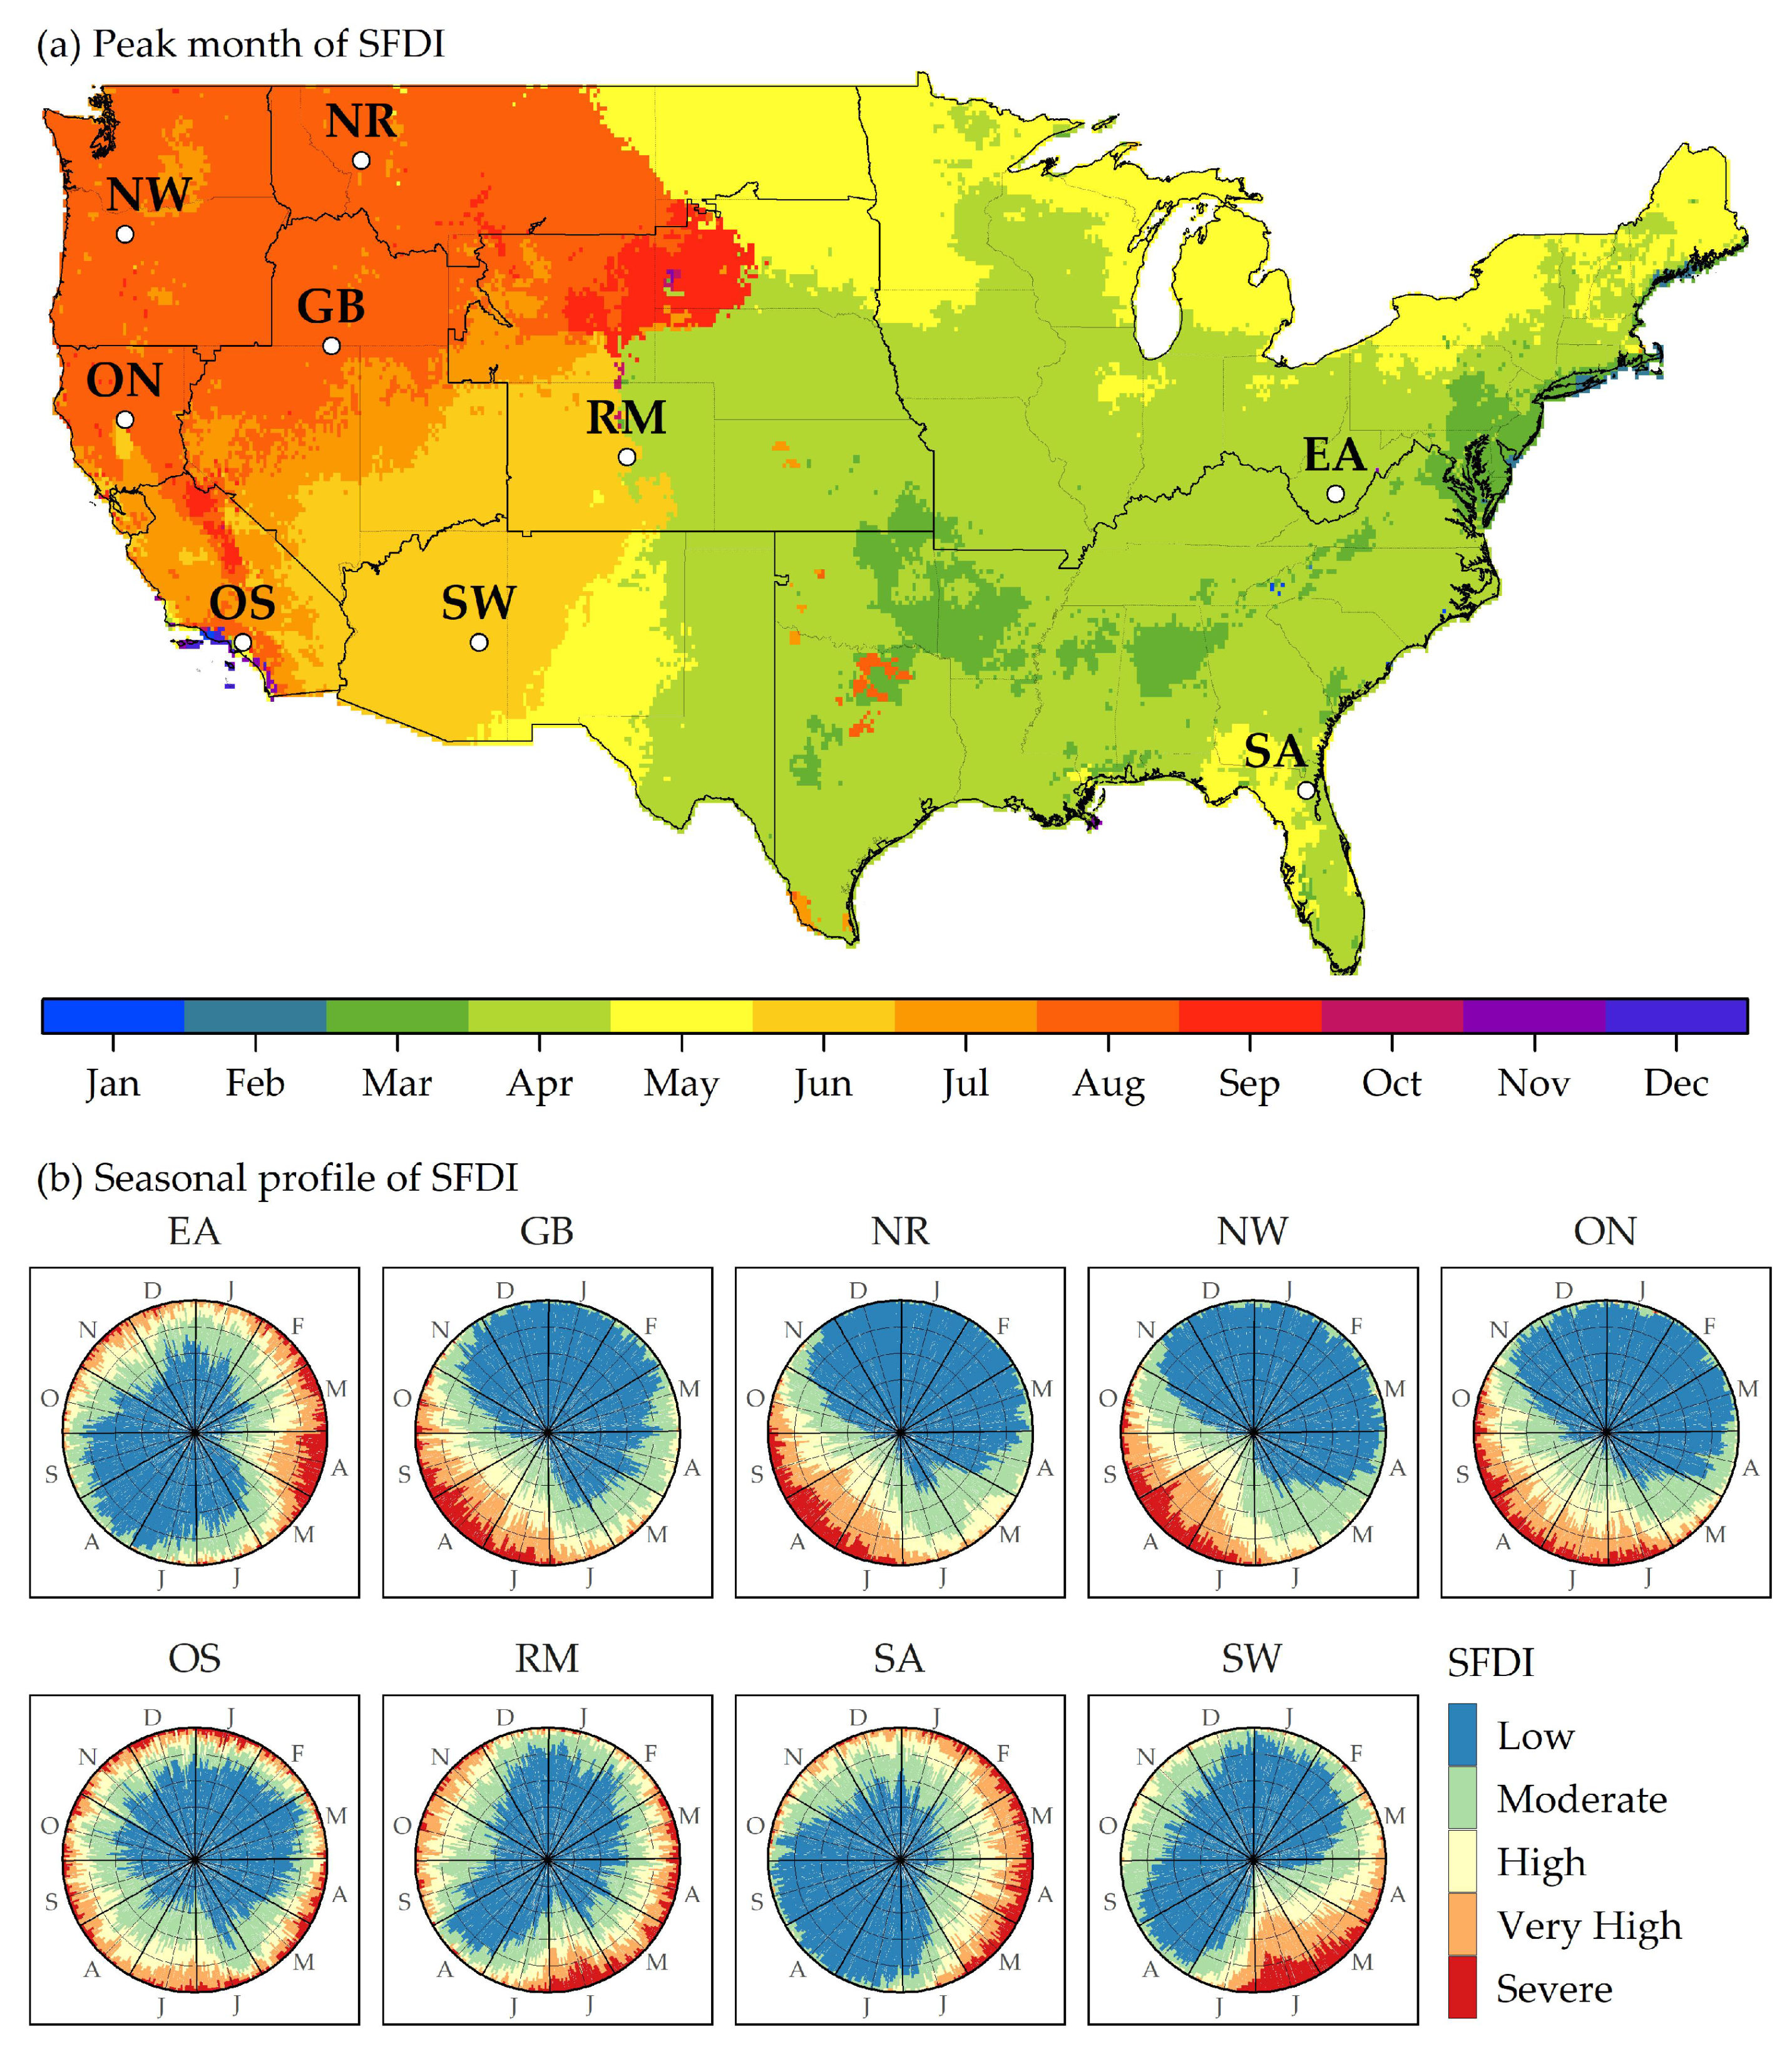
An example of the conversion of ERC and BI from absolute values into percentiles is presented for a single day on 10 June 2006 (Figure 4). Based solely on the absolute values, and without understanding the differences between regional climatologies, it would appear that on this particular day only the Southwest experienced high fire danger (Figure 4a). In reality, hot and dry conditions pushed ERCs above their 90th percentiles across much of the lower half of CONUS, and areas of locally strong winds resulted in pockets of historically high BIs in the Upper Midwest, the Northeast, and the eastern Gulf Coast (Figure 4b). To account for local climatological variations in fire danger, percentiles of ERC and BI (ERC’ and BI’), rather than their absolute values, are henceforth evaluated based on observed fire activity.
When sorted into 1 percentile bins, the marginal plots in Figure 5 illustrate that both ERC’ and BI’ are good individual indicators of new and ongoing fire activity. While it is possible for ignitions to establish and grow sufficiently large to be discovered even at relatively low fire danger, the number of new fire reports increased exponentially with fire danger so that the majority (50%) of the initial attack load was concentrated on days when either ERCs were above their 81st percentile or when BIs were above their 73rd percentile (Figure 5a). The non-linear response of new fire activity to changes in fire danger is more pronounced in the marginal profiles of eventual burned area (Figure 5b). New fires discovered on days when ERC’ ≥ 81 or when BI’ ≥ 73 ultimately accounted for 82% and 63% of the area burned across CONUS between 1992 and 2017. The shapes of the marginal profiles in Figure 5b are partly driven by the increase in new fire reports, but also by the final fire sizes. New fires that started on days at higher fire danger ultimately achieved larger final fire sizes such that 5% of the fires that started in the maximum bins of ERC’ or BI’ eventually grew larger than 100 acres (Figure 5c).
Since MODIS active fire pixels were clipped to large wildland fire perimeters contained in the MTBS database, and since newly ignited fires tend to grow larger if started at higher fire danger (Figure 5c), it is not surprising that a greater number of active fire pixels were detected at higher fire danger (Figure 5d). Even if most new fires are reported at elevated fire danger, daily MODIS observations of large fires continued over their entire lifetime. Therefore, the near absence of active fire pixels at low fire danger is primarily indicative of the inability of MODIS to detect smaller and/or less intense areas of combustion as fires either self-extinguished or were successfully suppressed by firefighters at moderate to benign weather conditions. Over the course of 14 years, MODIS detected 60% of the total sum of FRP emitted by large wildland fires while they were burning at ERCs above their 97th percentile (Figure 5e). The greater sum of FRP observed at higher fire danger is partly attributed to a greater number of active fire pixels, but is also due to the presence of more energetic active fire pixels, with the 95th percentile of per-pixel FRP values exceeding 600 MW when fires were burning at the highest fire danger (Figure 5f). In general, the marginal panels shown in Figure 5d–f reinforce the notion that locally high fire danger after ignition generally supports larger, more persistent, and more intense fire activity.
Sorting new fire records and active fire pixels into joint bins revealed that most new and ongoing fire activity occurred when the highest ERCs aligned with the highest BIs. Approximately 13% of new fires that eventually accounted for 33% of the area burned across CONUS were discovered on days when the combination of both ERC and BI were above their 90th percentiles (Figure 6a,b). Even more dramatically, approximately 50% of active fire pixels accounting for 57% of the summed FRP were detected by MODIS on days when the combination of both ERC and BI were above their 90th percentiles (Figure 6c,d).
Within a vertical band of constant ERC’, new fires eventually grew larger and active fires burned more vigorously as BI’ increased (Figure 7a,b). For example, 5% of new fires across CONUS eventually exceeded 12 ac if started in the upper decile of ERCs and the lower decile of BIs. In contrast, 89% of new fires exceeded 12 ac if started when both the ERCs and BIs were in their upper deciles. Similarly, for only those MODIS active fire pixels detected when ERC’>90, the tails of the distributions of FRP were pulled towards higher per-pixel values as BI’ increased, affecting a three-fold increase in the 95th percentile of FRP. Quantile regression results provide further statistical evidence of the effects of varying windspeed on observed fire characteristics under different fuel moisture conditions (Figure 7c,d). Regardless of how the models were constructed, the interaction term E R C × B I was always significant ( p 0.01 ), and including the interaction term E R C × B I always reduced the AIC.

3.2. SFDI

Figure 8 illustrates an example of how the product, p, of ERC’ and BI’ culminates into the SFDI. On 10 Jun 2006, 21%, 29%, 22%, 21%, and 7% of CONUS was assigned to the Low, Moderate, High, Very High, and Severe classes, with Severe patches located from Wyoming southwest into Arizona, the Oklahoma and Texas Panhandles, and the Gulf Coast of northern Florida. Conditions conducive to wildland fire ignitions and growth are not static but migrate across CONUS during the year. The core of the fire season occurs during March, April, and May in the Southeast, during April, May and June in the Southwest, and during July, August and September in the Northwest (Figure A2).
Evaluations based on associations with fire records in the FPA FOD revealed that regarding initial attack, fewer new fires were reported in the upper classes of SFDI (Table 1). Given the marginal profiles in Figure 5a, and the joint profiles in Figure 6a, the decrease in the number of new fires reported in the upper classes of SFDI is an artifact of the decreasing amount of time that grid cells spent in incrementally higher classes. Nevertheless, new fires that started in elevated classes of SFDI ultimately accounted for a greater proportion of the total area burned. A decrease in the number of new fires with a coincident increase in the total area burned can only be explained by an increase in individual fire sizes. Hence ignitions that started in the upper classes of SFDI ultimately resulted in larger fires, as shown by a continual increase in the 95th percentile of final fire sizes (Table 1).
To provide a more complete picture of the evolution of fire activity between the origin and the final fire perimeter, histograms of per-pixel values of FRP were stratified by SFDI class (Figure 9). Only 2.6% of MODIS active fire pixels between 2003–2016 were detected in the "Low" class (Table 1), suggesting that if present, fires burning at lower fire danger are less capable of generating a sufficient amount of radiant heat required to trigger a MODIS detection. Conversely, 75.2% were detected in the Very High and Severe classes, indicating that fires sufficiently large and/or intense enough to be detected by MODIS are mainly burning in the elevated classes of SFDI. Consistent with the marginal and joint results presented previously for ERC’ and BI’, there was a continual increase in the 95th percentile of per-pixel values of FRP detected in incrementally higher classes of SFDI, as summarized in Table 1.

3.3. Operational SFDI Forecasts

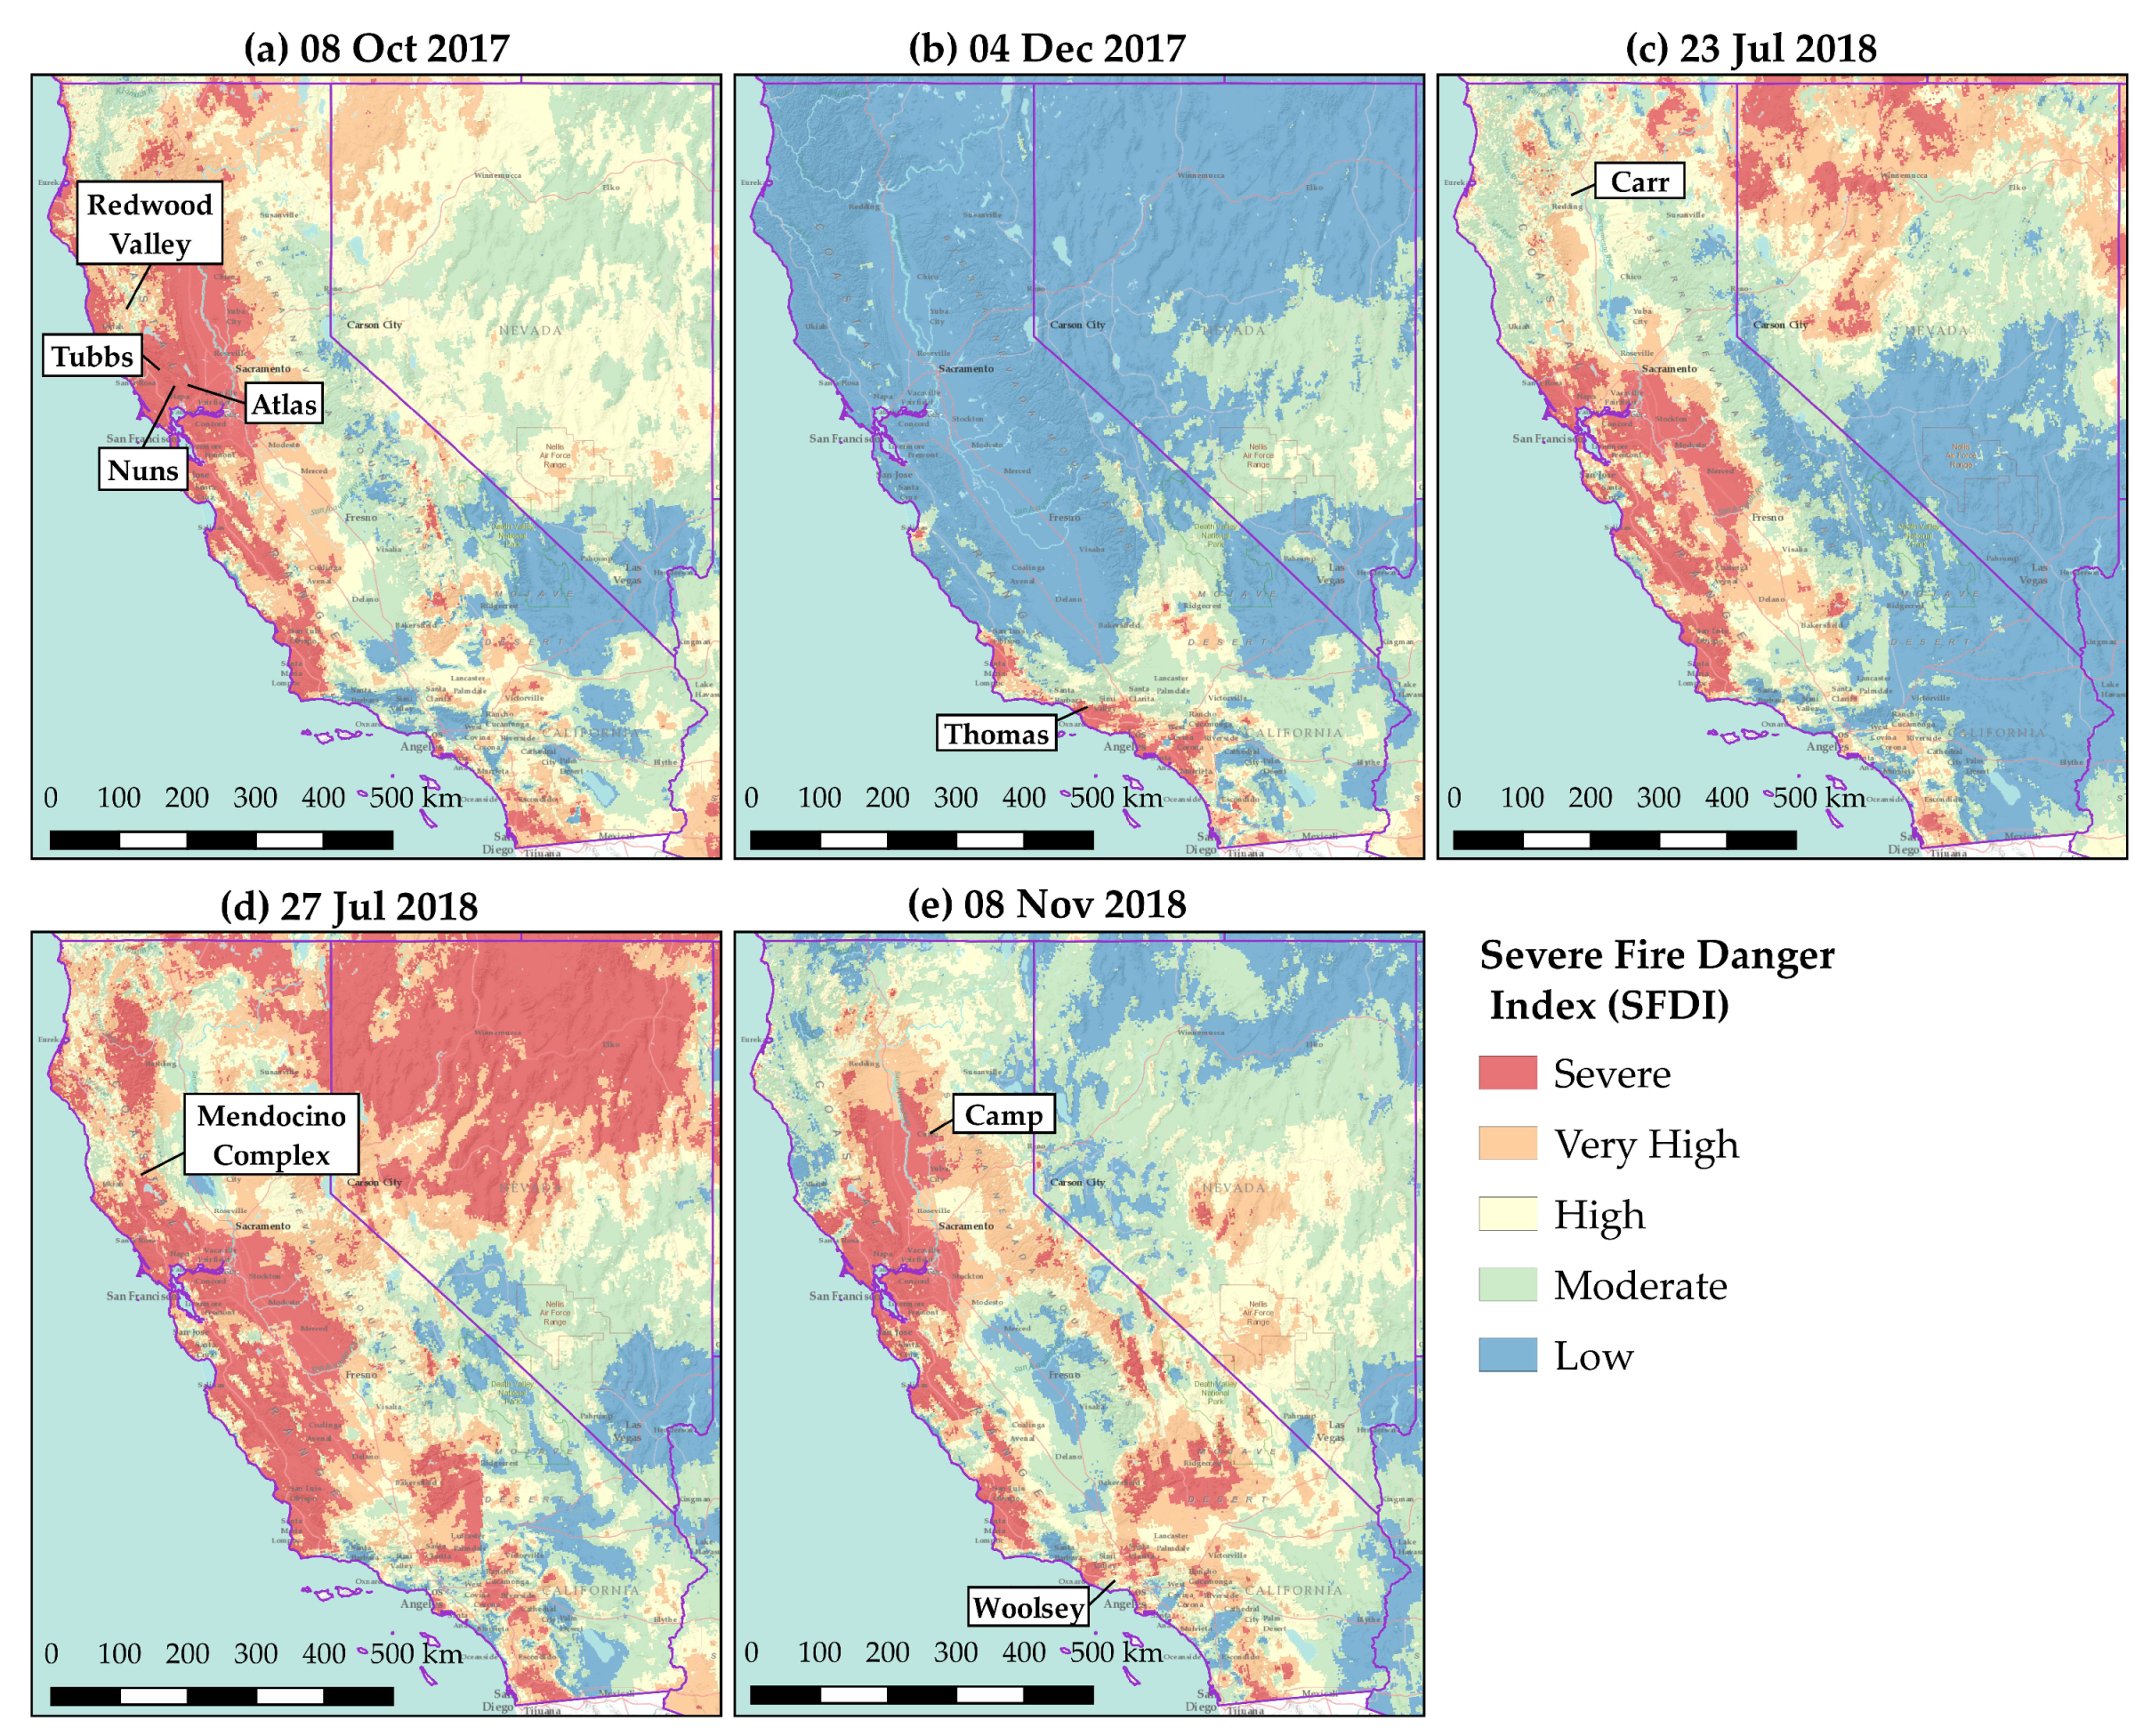
3.3.1. Significant California Wildfires in 2017 and 2018

Forecast maps of SFDI produced on the morning of the start dates of nine large, destructive and deadly fires in California in 2017 and 2018 are shown in Figure 10. These forecasts were produced and posted before each incident was reported. To exclude areas that did not burn during the initial stages of the fires, forecast summaries are limited to only those 2.5-km NDFD grid cells that contained VIIRS hotspots on the start date and the day following the start date. The worst-case SFDI was rated as Severe for seven of the nine fires, and Very High for the remaining two fires (Table 2). All the area that burned during the first two days of the Atlas, Nuns, and Tubbs fires was forecast as Severe prior to discovery. Over all nine fires, an average of half (49%) of the area (based on 2.5-km grid cells) that burned during the first two days was classified as Severe by the NDFD forecast on the morning of the start date prior to ignition. These results demonstrate the capabilities of both the SFDI as well as the operational forecast system to deliver advanced notice of the areas susceptible to new ignitions and rapid initial fire growth.

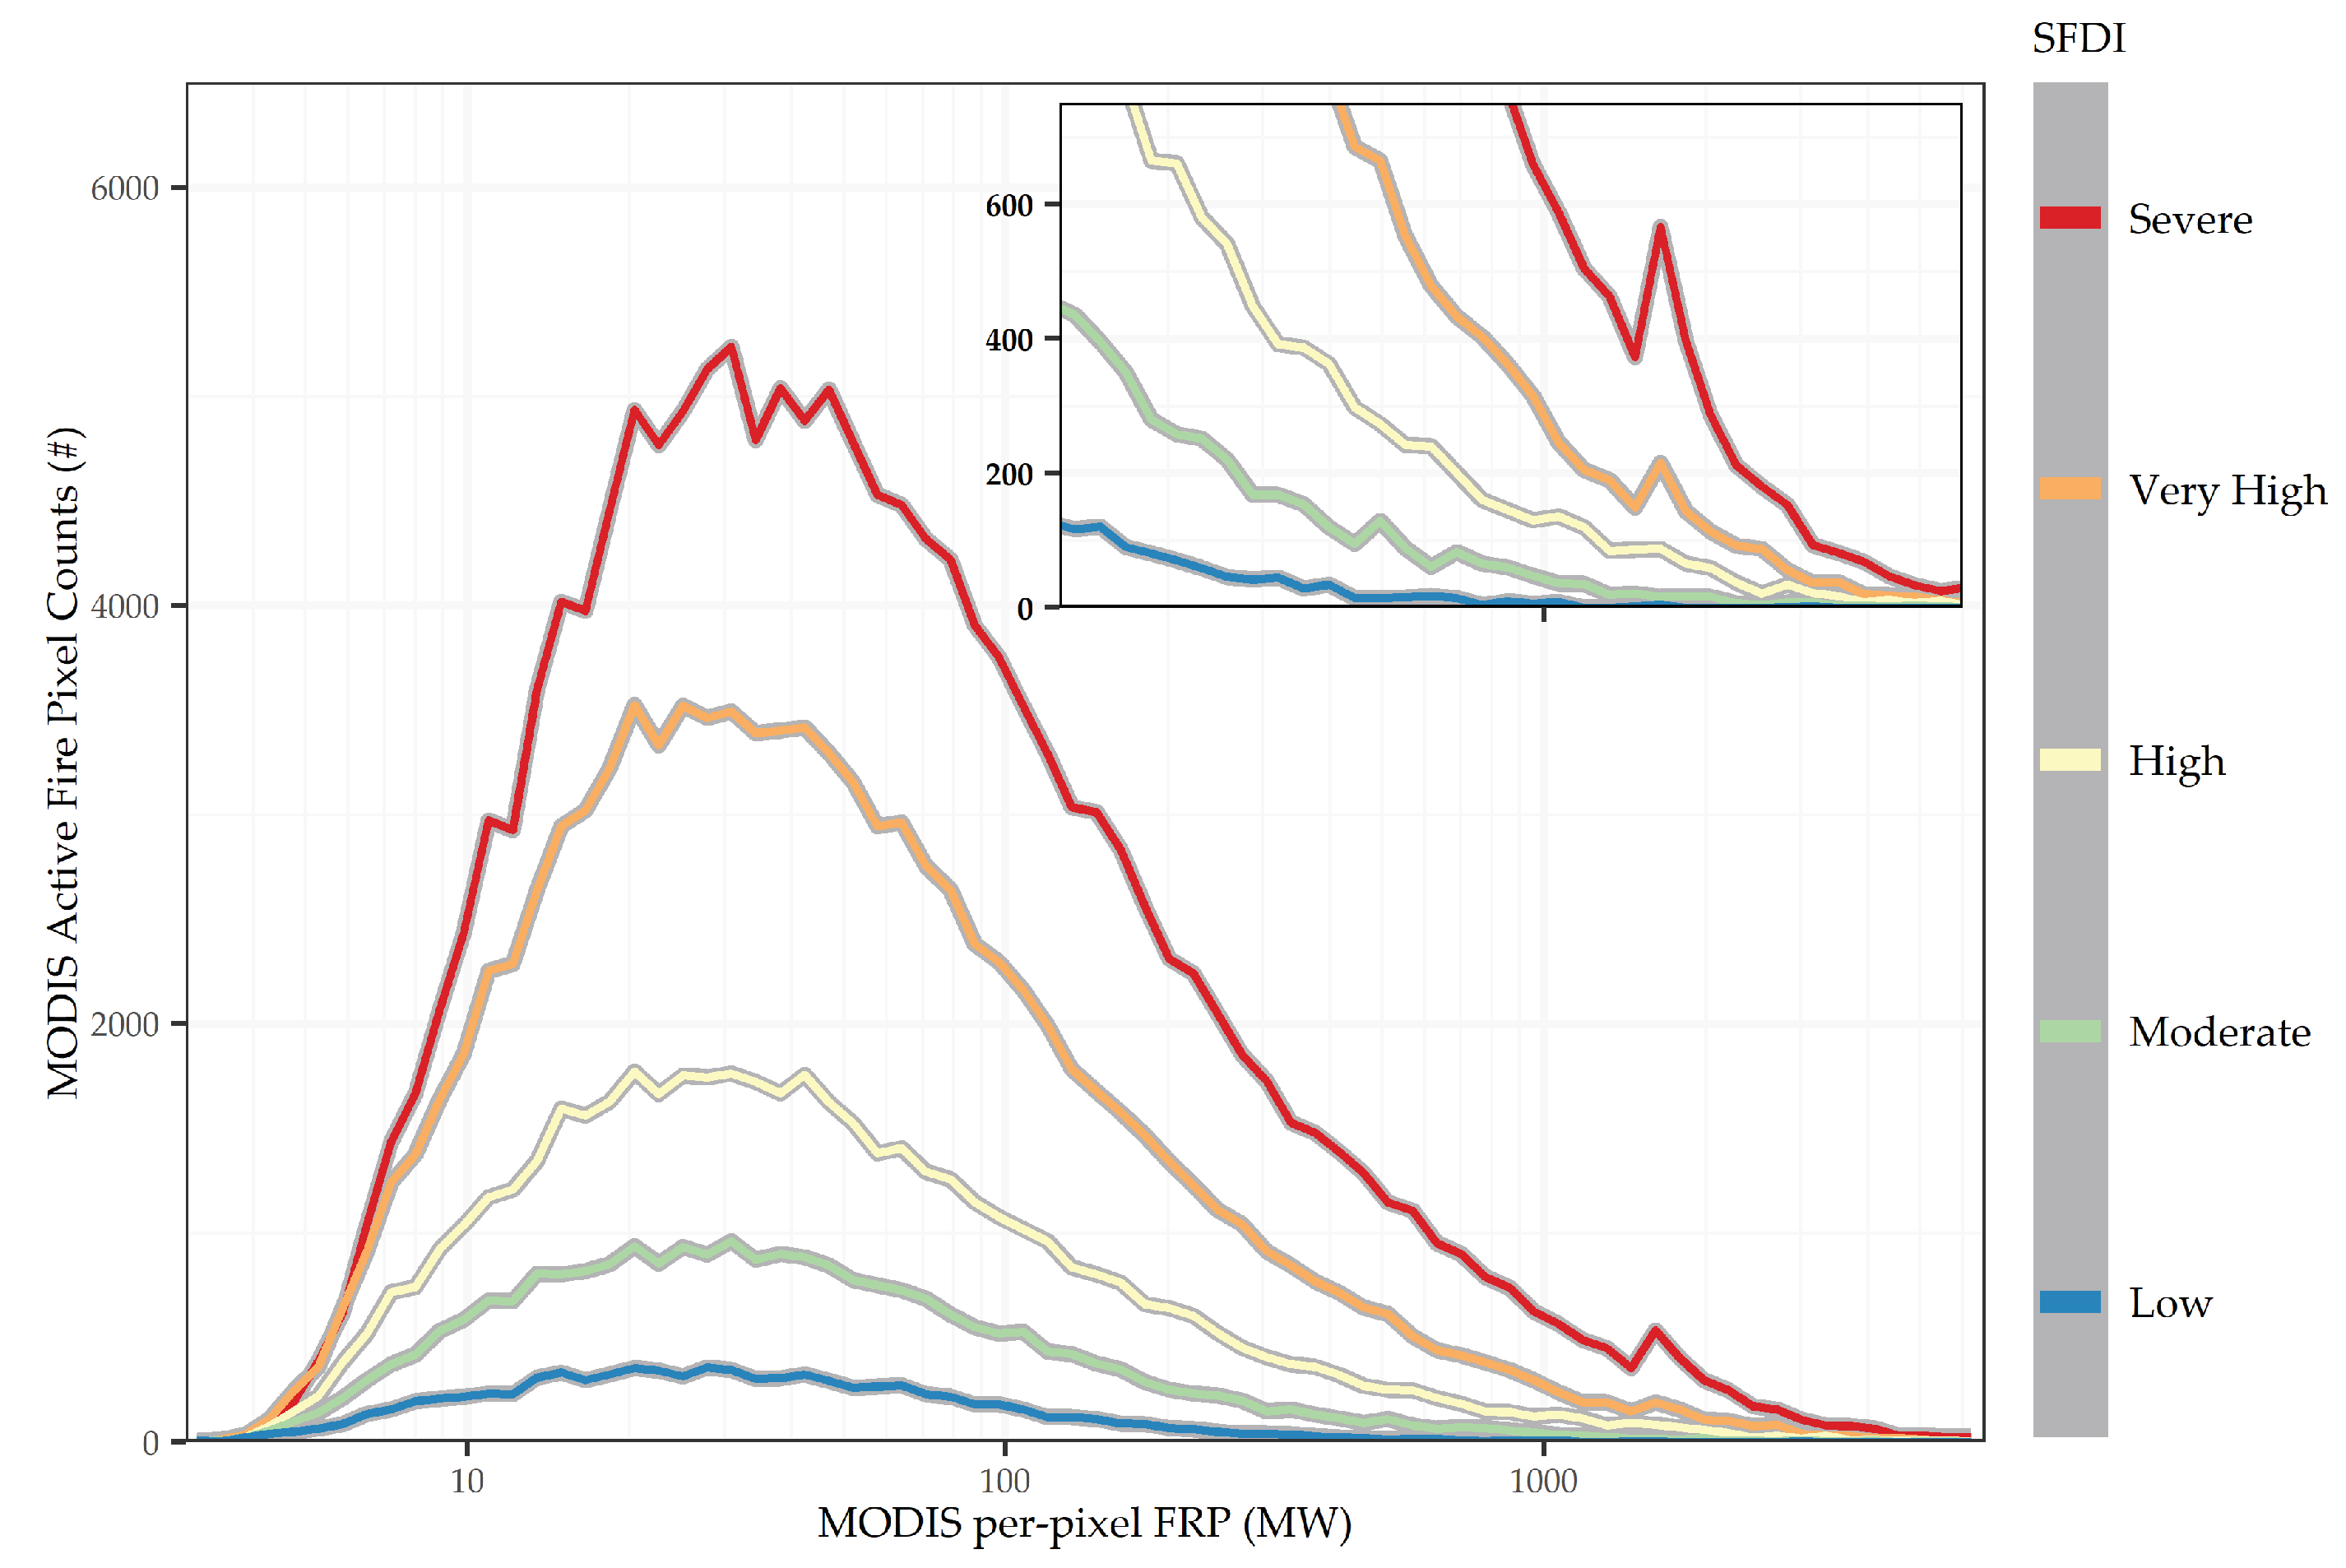
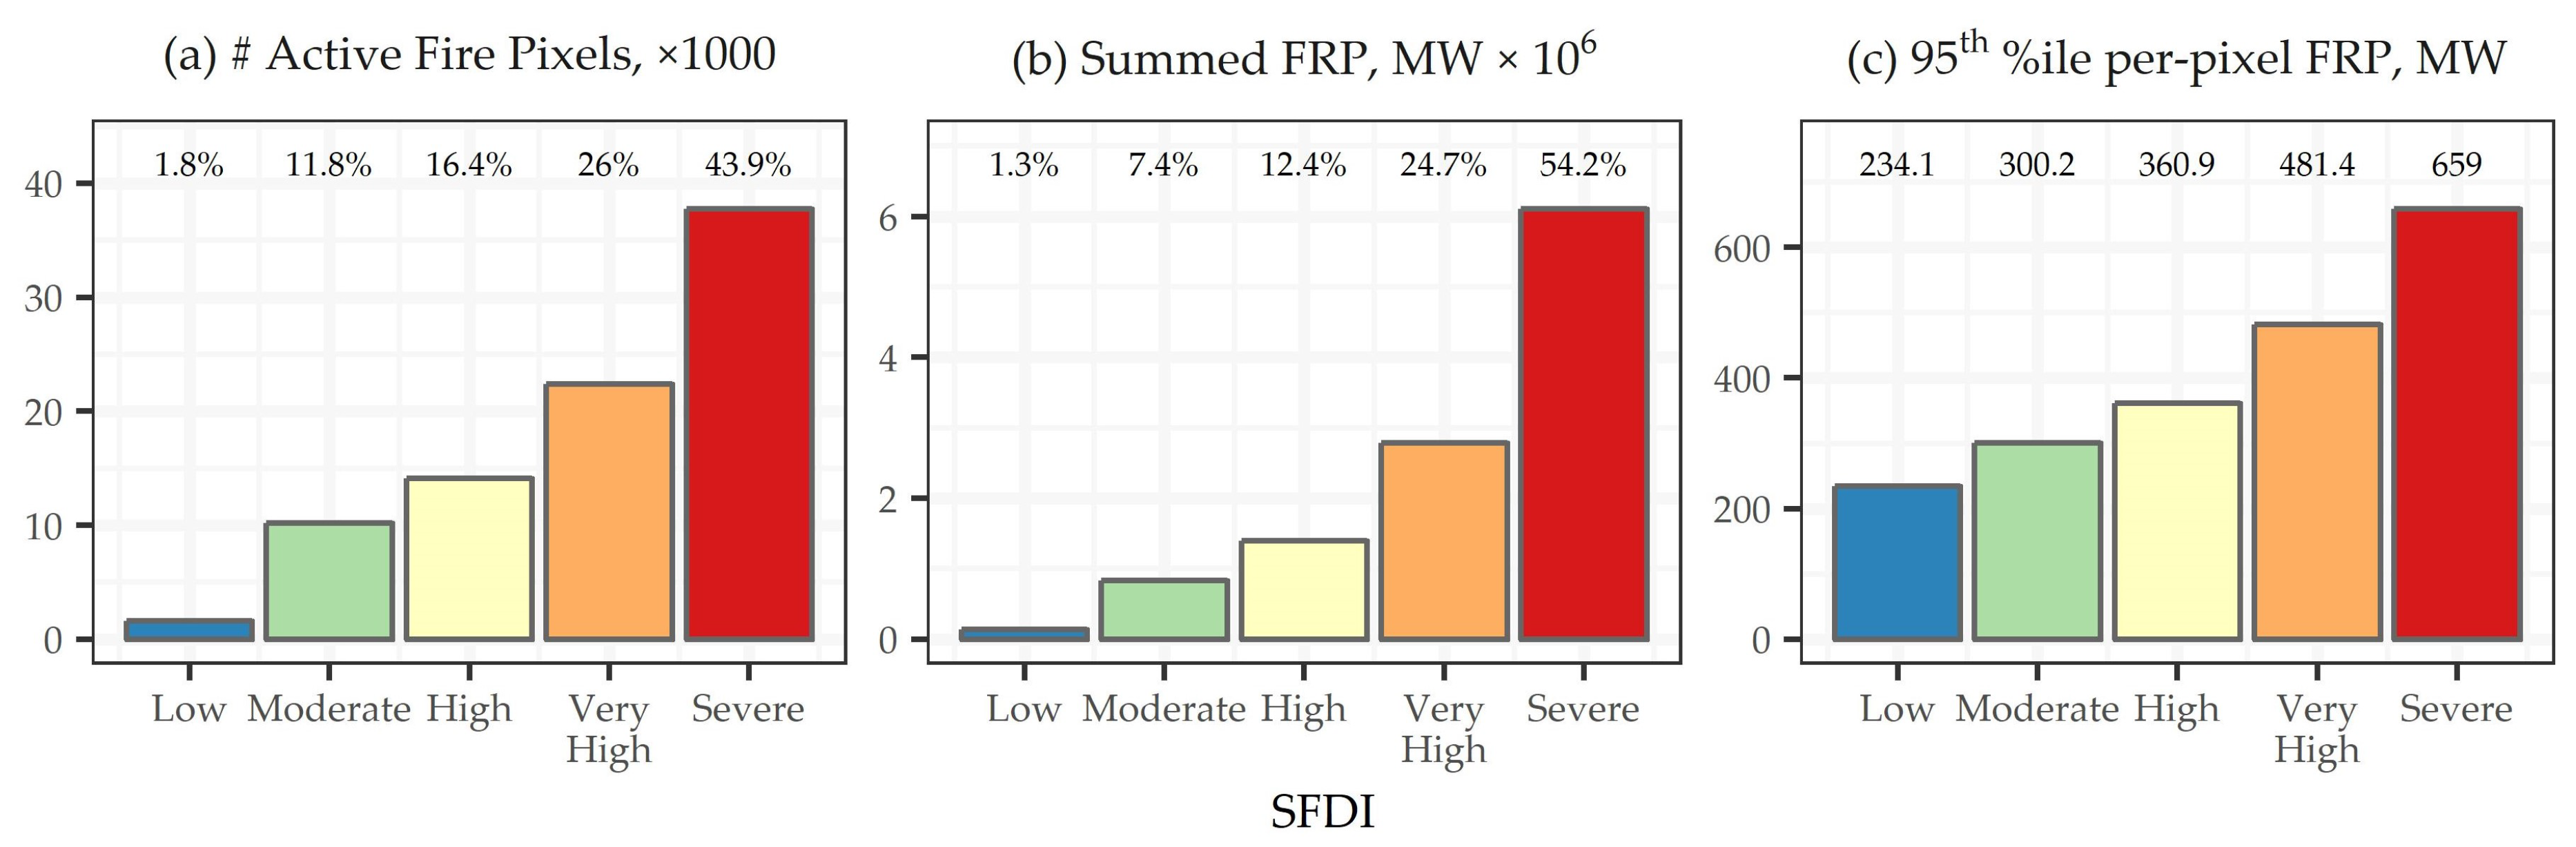
3.3.2. CONUS-Wide Associations with Observed Fire Activity

Between 1 August 2017 and 1 December 2018, MODIS detected more than 85,000 active fire pixels across CONUS that were within 830 incidents mapped in the GeoMAC database. While NDFD forecast maps were generated at 0530 US mountain standard time, MODIS active fire pixels were detected at 0130, 1030, 1330, and 2230 local time. Hence the late morning, afternoon, and evening observations of fire activity occurred after the forecast was already delivered. Similar to the evaluation results for the 4-km gridded climatology, a greater number of more energetic active fire pixels were detected in 2.5-km grid cells mapped in the upper classes of SFDI by the NDFD forecast (Figure 11). These results demonstrate that if NDFD forecast maps of SFDI generated and posted to the WFAS website during the morning show Very High or Severe conditions surrounding an ongoing incident, then firefighters can anticipate larger, more persistent, and more extreme fire activity during the upcoming operational period.

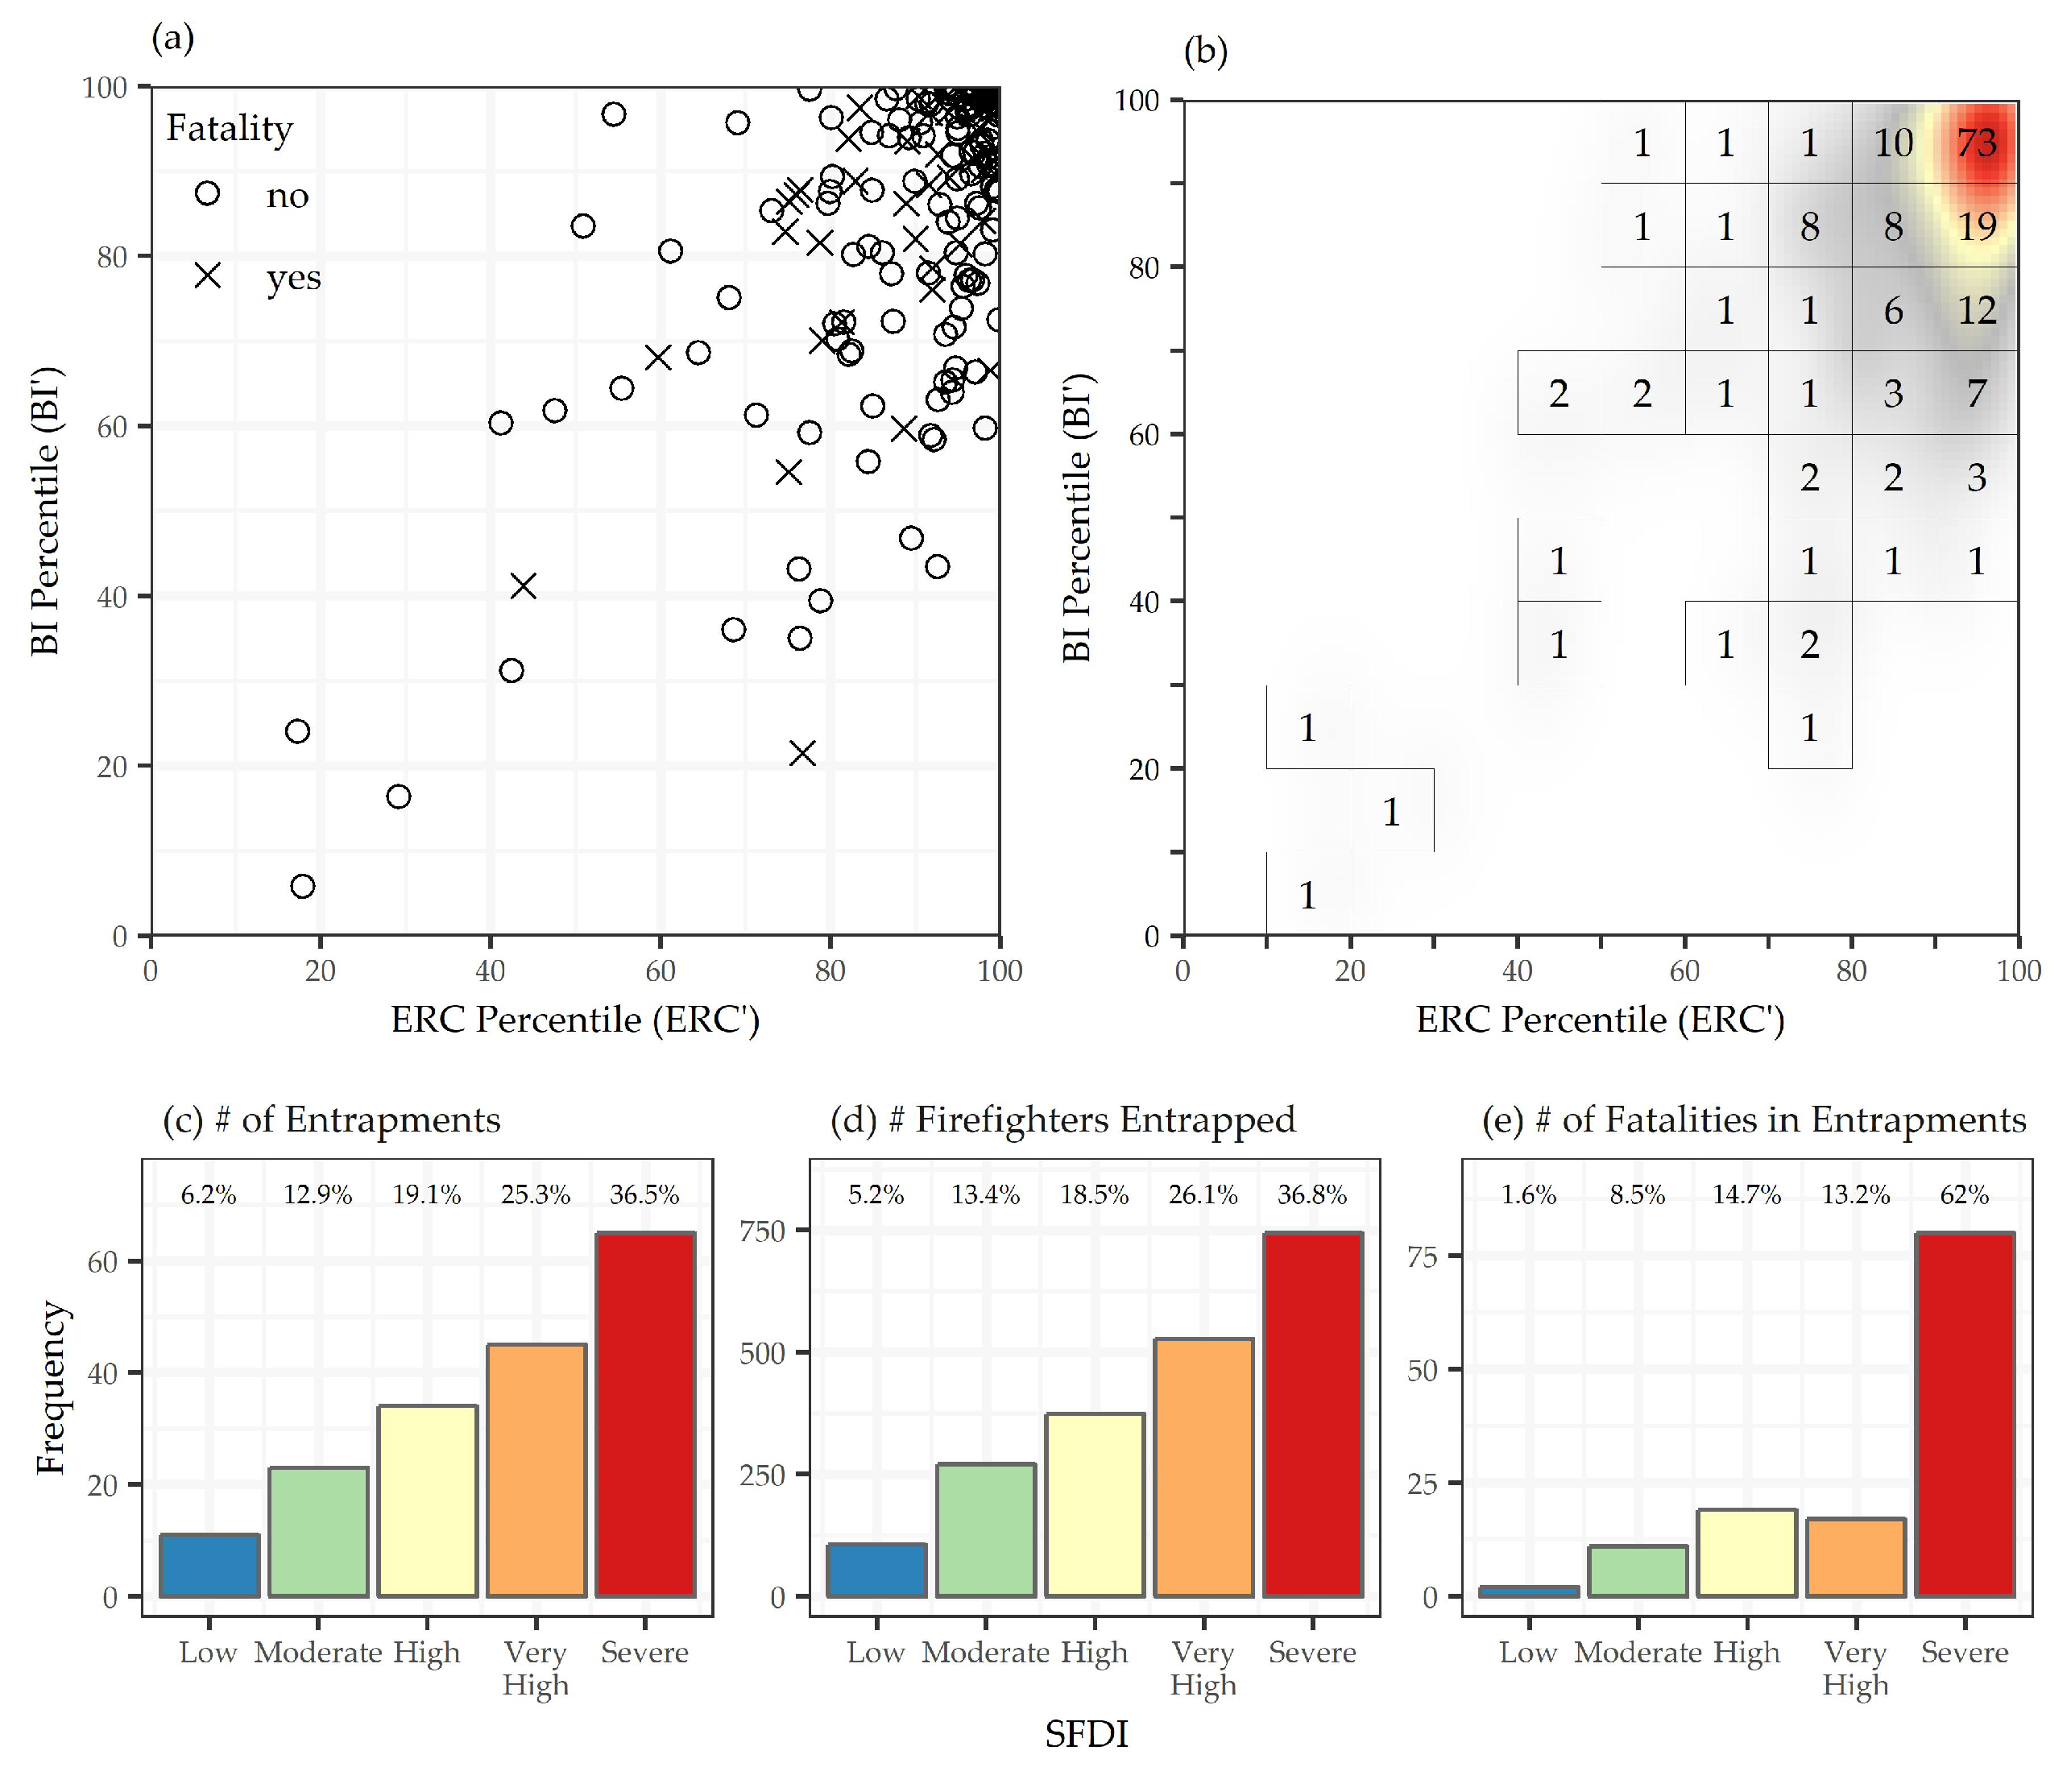
3.4. Fire Danger on Days at Entrapment Locations

In combination, a SFDI metric that tracks well with extreme fire activity and can forecast and disseminate maps of SFDI could be used to improve firefighter situational awareness. Associations between fire danger and 178 firefighter entrapments that occurred across CONUS from 1979 to 2017 are shown in Figure 12. There were 86 (48%) entrapments when the BI was above the 90th percentile, and 115 (64%) entrapments when the ERC was above the 90th percentile. Moreover, 128 (72%) entrapments occurred when either the ERC or the BI was above the 90th percentile, and 73 (41%) entrapments occurred when both the ERC and the BI were in the upper decile, suggesting that the fire danger indices selected to calculate SFDI are strong indicators of the combined weather conditions that pose the greatest risk to wildland firefighter safety.
Figure 12 further summarizes the relationships between SFDI and entrapment statistics. In addition to a steady increase in the number of entrapments and the number of firefighters entrapped, 62% of firefighter entrapment fatalities occurred on days rated as Severe, despite this class representing only 3% of all days at a given location. In total, 97 out of 129 (75.2%) wildland firefighter burnover fatalities occurred in places where SFDI was either Very High or Severe. This demonstrates that an operational system capable of generating SFDI forecasts could be a valuable tool for mapping locations where weather conditions have the potential to promote rapid changes in fire behavior and compromise firefighter safety, possibly leading to an entrapment or even death.

4. Discussion

Here we have presented the development and evaluation of a metric of severe fire danger. We have shown that it is closely related to fire activity, fire intensity, and historical firefighter entrapments. We have also shown that the same metric can be used to evaluate historical conditions as well as to forecast future conditions. This metric is currently implemented within an operational forecast system for severe fire danger prediction and it can provide critical decision support information to a variety of users including firefighters, fire managers, industry, and communities.
This new index was developed to provide rapid decision support information to wildland fire management operations in the US and therefore we used the USNFDRS as its foundation. The USNFDRS is taught to fire managers using standardized training developed by the US National Wildfire Coordinate Group (NWCG), which is offered throughout the US. Additionally, its use is embedded in daily fire preparedness and response decision-making. Extending the applications of USNFDRS, rather than replacing them with new indices, should ensure more rapid adoption of this new index to support wildland fire management decisions.
A key component of this new index is the straightforward method used to normalize the index scales across CONUS. This normalization meant that the same percentile values could be interpreted similarly across the entire country. Furthermore, it allowed us to combine disparate indices, the ERC and BI, together because the scaled ERC and BI were on comparable, interpretable scales. Although maps of absolute values contain useful information e.g., (Figure 4), they could be misleading if a person is unaware of the differences between regional fire danger climatologies. Converting absolute values into percentiles takes into account the local climatology and therefore facilitates comparisons between regions even if a person is unaware of the fire danger history.
Evaluating spatial fire danger indices requires leveraging a suite of complimentary fire occurrence data but it is important to recognize the strengths and weaknesses of each dataset. Interpreting the number of new fires discovered at a given level of fire danger is obvious: a greater number of new fire reports implies a greater initial attack load. However, interpreting the area burned by fires that started at a given level of fire danger is less straightforward. Since the FPA FOD only contains the discovery date and the final fire size, and does not record daily fire progressions, the area burned does not reflect the total fire growth at a particular fire danger condition, but rather represents the cumulative extent of fires that can be attributed to ignitions that started at a particular fire danger condition. Fire growth ebbs and flows for days and weeks after ignition; therefore, it may be difficult to conceptually reconcile the relationship between final fire size and the fire danger conditions recorded solely on the discovery date [50]. Rather than taking a strict interpretation, we suggest fires that started at high fire danger and accounted for large amounts of the area burned were likely difficult to control upon discovery and were therefore prone to escape initial attack. A more complete description of these daily fire growth events can be captured by satellite-derived active fire products from MODIS, VIIRS and other platforms.
A MODIS active fire pixel indicates the location of a fire burning at the time of an overpass. When accumulated over space and time, there are two reasons that MODIS could detect a greater number of active fire pixels. First, the fires are larger such that on an instantaneous basis MODIS detects more active fire pixels during a single overpass. In addition, combustion persists longer such that MODIS repeatedly detects an active fire pixel at the same location during multiple overpasses. In addition to the time and location, the MCD14ML product contains an estimate of the FRP emitted from all sub-pixel combustion components. Again, if accumulated over space and time, a greater sum of FRP could be attributed to a greater number of active fire pixels. Moreover, a greater sum of FRP could also be attributed to higher per-pixel values of FRP, which on an instantaneous basis, are induced by larger sub-pixel fire areas or by more intense combustion.
Even though the total number of wildland fires is dominated by the overwhelming number of small fires, the total area burned is mainly attributed to large fires. Individual fires that exceed 5000 ac (2023.4 ha) and were therefore assigned to NWCG size class G together accounted for <0.2% of the total number of fires, but 68% of the total area burned across CONUS between 1992 and 2017. Of the fires that individually exceeded 5000 ac, 7.3% and 5.8% were discovered in the lowest SFDI classes, respectively. The occurrence of large wildland fires that ignited at low fire danger, though uncommon, should not be overlooked. Upon discovery it is possible that decisions were made to manage these fires to accomplish resource objectives and promote healthy forests. However, these decisions cannot be easily verified since neither initial management responses nor long-term strategies are recorded in the FPA FOD. In any event, it is unlikely that these fires achieved their final size on the same day as ignition, but rather grew in intermittent pulses over the course of several weeks. Since daily fire progressions are also absent from the FPA FOD, it is difficult to identify the weather conditions that were present on large fire growth days.
Although this system was developed and tested using the USNFDRS indices, a similar modeling and mapping approach could be applied using other fire danger rating system indices. Any combination of fire danger indices that quantify drought conditions, such as ERC, and wind events, such as BI, could be combined by calculating the respective daily percentiles, computing the product of those percentiles and the percentiles of that product, and categorizing the normalized results. The Fire Behavior Prediction System (FBP) of the Canadian Forest Fire Danger Rating System (CFFDRS) uses a similar process by combining inputs from the Forest Fire Weather Index, i.e., the Initial Spread Index (fine fuel moisture and windspeed) and the Build-Up Index (long-term drying), by fuel type to predict fire behavior [51]. Implementing a process to normalize across fuel types and over time could further enhance the ability of the CFFDRS to track and predict unique fire danger events. Similarly, the Australian (McArthur) Forest Fire Danger Index is arranged with an input of daily weather conditions to capture short-term variations and a Drought Factor calculated from a drought index such as the Keetch–Byram Drought Index (KBDI) that capture longer-term surface moisture variations [21]. Thus, the SFDI logic is consistent with other fire danger systems. Additionally, other indices that are not part of established fire danger rating systems but capture critical components of the fire environment, such as the drought information from the Evaporative Demand Drought Index [52] or critical weather events captured by the Hot-Dry-Windy index (HDW) [53] could be leveraged to predict the time and location of extreme fire danger events. Ultimately, any combination of metrics that provide information about the co-occurrence of drought and wind events could be used within the structure of the Severe Fire Danger Index.
An important component of this new severe fire danger metric is that it is categorical, and the interpretation of those categories is the same across the entire domain. Fire danger indices are best used to support decision-making when the continuous indices produced by these systems are binned or categorized into discrete levels [54]. These discrete categories can be used to guide decisions and those thresholds can be quantified ahead of time in planning documents such as a units Fire Danger Operating Plan (US Forest Service) or the Fire Danger Application Documents (US Bureau of Land Management) [32]. This direct application is possible because the interpretation of the SFDI metric is spatially consistent and interpretable across entire units. Essentially, when SFDI is mapped as Severe, only three percent of the historical days observed conditions at or above that severity (SFDI is above the 97th percentile) regardless of the spatial location of that observation. Overall, a categorical index with a common spatial interpretation paves the way for a more complete application of fire danger information across landscapes.
While the SFDI index captures the combination of dry conditions and strong wind events, there are many aspects of the fire environment that may not adequately be captured by this index. For example, the NDFD may or may not resolve events such as the strong thunderstorm outflows that caused rapid fire growth on the Yarnell Hill fire in Arizona that resulted in the death of 19 hotshots [55]. Other forecast models, such as the High-Resolution Rapid Refresh (HRRR) model, can provide better short-term forecasts that can be used to inform better BI forecasts under these convective storm-driven wind conditions. Furthermore, wind resolutions for the SFDI forecasts are coarse and do not currently incorporate fine-scale terrain influences such as channeling, acceleration through constrictions, or lee-side eddying. Improved models for downscaling complex winds through conservation of mass and momentum, such as WindNinja [56], could improve our ability to map severe weather conditions across landscapes at higher resolutions. Also, weather downscaling systems such as TOPOFIRE, that resolve the influences of terrain on local weather, fuel moisture, and fire danger conditions, could also vastly improve these spatial fire potential assessments [57]. As forecasts and downscaling models improve, they can be used to systematically improve the ability of the SFDI to resolve these important fast-changing and fine-scale weather variations and their impact on fire potential.
Relationships between the SFDI and firefighter entrapments and fatalities underscore a need to incorporate this real-time information into an Operational Risk Management (ORM) framework for interagency wildland firefighting. ORM frameworks, such as those from the US Marine Corps [58], provide a clear framework for Operational Risk decision-making at both the strategic and tactical level. Strategic ORM can be performed when ample time exists to plan while tactical ORM relies on rapid decision-making models with limited time for planning. The SFDI can inform risk management planning and decision-making at both ends of the spectrum. SFDI can be used to inform wildland firefighter pre-positioning and staffing as well as providing critical input to maintain situational awareness for tactical operations. More work is needed to determine the most appropriate ways to leverage the SFDI in both pre-season (strategic) planning and fire response (tactical) operations.
A key benefit of a simple, categorical severe fire danger forecast system is that the same metrics that can be used for operational planning and response for local, state, or federal wildfire responders can also be used to inform private citizens about expected conditions. These metrics could easily be used as part of an early-warning alert system that ensures a higher level of readiness should new ignitions spread quickly and threaten communities under extreme conditions. The US state of California has instituted the “Ready, Set, Go” campaign in an effort to inform and prepare private citizens for wildfires. After structures have been prepared (Ready) and personal action plans have been developed (Set), the most important aspect is to have resources needed to prepare to leave (Go) if a new fire threatens a community. As such, tools such as the SFDI can be crucial for informing these communities in advance of an impending threat. Our analysis of the largest, most destructive and deadliest fires in California in 2017 and 2018 (Figure 10) suggest that our SFDI forecasts could better inform communities of impending wildfires and ensure that they are monitoring all available media resources and ready to go when necessary to protect themselves and their families.

5. Conclusions

We have demonstrated that this SFDI metric is a strong predictor of wildland firefighter entrapments and fatalities and we have shown that it is a good forecast tool for indicating regions with extreme fire behavior potential. SFDI maps are currently being produced daily and are available on the WFAS mobile map interface (https://m.wfas.net). While simple, it can be used for a variety of fire management purposes from developing appropriate spatial preparedness plans, informing ORM decisions, planning for and adequately implementing wildland fire initial response and modifying daily tactics on large fires. Furthermore, the same metric can be extended for use in informing communities about increased extreme fire behavior potential that could impact them with minimal notice. Ultimately, this new system can project conditions across landscapes that can ensure proactive responses by both fire management professionals and communities to minimize the impacts of wildfires on life and property throughout the US and similar systems could be developed to support firefighters and communities worldwide.

Author Contributions

Conceptualization, W.M.J. and P.H.F.; Methodology, W.M.J. and P.H.F.; Validation, P.H.F. and W.G.P.; Formal analysis, W.M.J., P.H.F., W.G.P. and B.W.B.; Resources, W.M.J. and B.W.B.; Data curation, P.H.F.; Writing—original draft preparation, W.M.J. and P.H.F.; Writing—review and editing, W.G.P. and B.W.B.; Visualization, P.H.F; Supervision, W.M.J. and B.W.B.; Project administration, W.M.J. and B.W.B.; Funding acquisition, W.M.J. and B.W.B.

Funding

Project funded in part by the US Forest Service, Fire and Aviation Management and in part by the Joint Fire Science Program (JFSP) (Project 18-S-01-1).

Acknowledgments

This paper is dedicated to all the wildland firefighters who lost their lives in the line of duty and to all the citizens who perished in wildfires. We will keep learning from these events and help better inform responders and the public in the future. You are gone but not forgotten.

Conflicts of Interest

The authors declare no conflict of interest. The funders had no role in the design of the study; in the collection, analyses, or interpretation of data; in the writing of the manuscript, or in the decision to publish the results.

Appendix A

Figure A1. Pearson correlation coefficient (r) between the Energy Release Component (ERC) and the Burning Index (BI). Correlations in each grid cell were performed using the full 39-year (1979–2017) daily time-series. (a) CONUS-wide map at 4-km grid spacing. (b) Histogram of grid cell counts.
Fire 02 00047 g0a1
Figure A2. Seasonality of the Severe Fire Danger Index (SFDI). (a) Peak of the fire season based on the month with the greatest number of days classified as Very High or Severe. (b) Seasonal profiles at daily resolution of the probability of a single 4-km grid cell being classified into a particular class of SFDI. The probabilities are stacked, arranged clockwise from 1 January to 31 December, and the scales range from 0 at the center to 1 at the outer edge. Locations of the seasonal profiles reside in one of the nine interagency geographic areas shown in (a).
Fire 02 00047 g0a2

References

  1. Bowman, D.M.J.S.; Balch, J.K.; Artaxo, P.; Bond, W.J.; Carlson, J.M.; Cochrane, M.A.; D’Antonio, C.M.; DeFries, R.S.; Doyle, J.C.; Harrison, S.P.; et al. Fire in the Earth System. Science 2009, 324, 481–484. [Google Scholar] [CrossRef] [PubMed]
  2. Alexander, M.E.; Mutch, R.W.; Davis, K.M.; Bucks, C.M. Wildland fires: Dangers and survival. In Wilderness Medicine, 7th ed.; Auerback, P.S., Ed.; Elsevier, Mosby: Philadelphia, PA, USA, 2017; pp. 276–318. [Google Scholar]
  3. Jolly, W.M.; Cochrane, M.A.; Freeborn, P.H.; Holden, Z.A.; Brown, T.J.; Williamson, G.J.; Bowman, D.M.J.S. Climate-induced variations in global wildfire danger from 1979 to 2013. Nat. Commun. 2015, 6, 7537. [Google Scholar] [CrossRef] [PubMed]
  4. Westerling, A.L.; Hidalgo, H.G.; Cayan, D.R.; Swetnam, T.W. Warming and earlier spring increase western US forest wildfire activity. Science 2006, 313, 940–943. [Google Scholar] [CrossRef]
  5. Littell, J.S.; McKenzie, D.; Peterson, D.L.; Westerling, A.L. Climate and wildfire area burned in western U. S. ecoprovinces, 1916–2003. Ecol. Appl. 2009, 19, 1003–1021. [Google Scholar] [CrossRef]
  6. Dennison, P.E.; Brewer, S.C.; Arnold, J.D.; Moritz, M.A. Large wildfire trends in the western United States, 1984–2011. Geophys. Res. Lett. 2014, 41, 2928–2933. [Google Scholar] [CrossRef]
  7. Abatzoglou, J.T.; Williams, A.P. Impact of anthropogenic climate change on wildfire across western US forests. Proc. Natl. Acad. Sci. USA 2016, 113, 11770–11775. [Google Scholar] [CrossRef] [PubMed] [Green Version]
  8. Westerling, A.L. Increasing western US forest wildfire activity: sensitivity to changes in the timing of spring. Philos. Trans. R. Soc. -Biol. Sci. 2016, 371. [Google Scholar] [CrossRef] [PubMed]
  9. Kitzberger, T.; Falk, D.A.; Westerling, A.L.; Swetnam, T.W. Direct and indirect climate controls predict heterogeneous early-mid 21st century wildfire burned area across western and boreal North America. PLoS ONE 2017, 12, e0188486. [Google Scholar] [CrossRef]
  10. Holden, Z.A.; Swanson, A.; Luce, C.H.; Jolly, W.M.; Maneta, M.; Oyler, J.W.; Warren, D.A.; Parsons, R.; Affleck, D. Decreasing fire season precipitation increased recent western US forest wildfire activity. Proc. Natl. Acad. Sci. USA 2018, 115, E8349–E8357. [Google Scholar] [CrossRef]
  11. Britton, C.; Lynch, C.F.; Torner, J.; Peek-Asa, C. Fire characteristics associated with firefighter injury on large federal wildland fires. Ann. Epidemiol. 2013, 23, 37–42. [Google Scholar] [CrossRef]
  12. Radeloff, V.C.; Hammer, R.B.; Stewart, S.I.; Fried, J.S.; Holcomb, S.S.; McKeefry, J.F. The wildland–urban interface in the United States. Ecol. Appl. 2005, 15, 799–805. [Google Scholar] [CrossRef]
  13. Radeloff, V.C.; Helmers, D.P.; Kramer, H.A.; Mockrin, M.H.; Alexandre, P.M.; Bar-Massada, A.; Butsic, V.; Hawbaker, T.J.; Martinuzzi, S.; Syphard, A.D.; et al. Rapid growth of the US wildland-urban interface raises wildfire risk. Proc. Natl. Acad. Sci. USA 2018, 115, 3314–3319. [Google Scholar] [CrossRef] [PubMed] [Green Version]
  14. Diffenbaugh, N.S.; Swain, D.L.; Touma, D. Anthropogenic warming has increased drought risk in California. Proc. Natl. Acad. Sci. USA 2015, 112, 3931–3936. [Google Scholar] [CrossRef] [PubMed] [Green Version]
  15. California Department of Forestry and Fire Protection. Top 20 Most Destructive California Wildfires. 2019. Available online: http://www.fire.ca.gov/communications/downloads/fact_sheets/Top20_Destruction.pdf (accessed on 28 January 2019).
  16. California Department of Forestry and Fire Protection. Top 20 Largest California Wildfires. 2019. Available online: http://www.fire.ca.gov/communications/downloads/fact_sheets/Top20_Acres.pdf (accessed on 28 January 2019).
  17. California Department of Forestry and Fire Protection. Top 20 Deadliest California Wildfires. 2018. Available online: http://calfire.ca.gov/communications/downloads/fact_sheets/Top20_Deadliest.pdf (accessed on 28 January 2019).
  18. Parisien, M.A.; Miller, C.; Parks, S.A.; DeLancey, E.R.; Robinne, F.N.; Flannigan, M.D. The spatially varying influence of humans on fire probability in North America. Environ. Res. Lett. 2016, 11, 075005. [Google Scholar] [CrossRef] [Green Version]
  19. Bistinas, I.; Oom, D.; Sá, A.C.L.; Harrison, S.P.; Prentice, I.C.; Pereira, J.M.C. Relationships between human population density and burned area at continental and global scales. PLoS ONE 2013, 8, e81188. [Google Scholar] [CrossRef] [PubMed]
  20. Bradshaw, L.S.; Deeming, J.E.; Burgan, R.E.; Cohen, J.D. The 1978 National Fire-Danger Rating System: Technical Documentation; General Technical Report INT-169; U.S. Department of Agriculture, Forest Service, Intermountain Forest and Range Experiment Station: Ogden, UT, USA, 1984; p. 44.
  21. Noble, I.; Gill, A.; Bary, G. McArthur’s fire-danger meters expressed as equations. Aust. J. Ecol. 1980, 5, 201–203. [Google Scholar] [CrossRef]
  22. Stocks, B.J.; Lynham, T.; Lawson, B.; Alexander, M.; Wagner, C.V.; McAlpine, R.; Dube, D. Canadian forest fire danger rating system: An overview. For. Chron. 1989, 65, 450–457. [Google Scholar] [CrossRef]
  23. Schlobohm, P.; Brain, J. Gaining an Understanding of the National Fire Danger Rating System; PMS 932; National Wildfire Coordinating Group, Fire Danger Working Team: Boise, ID, USA, 2002; p. 72. [Google Scholar]
  24. Glahn, H.R.; Ruth, D.P. The new digital forecast database of the National Weather Service. Bull. Am. Meteorol. Soc. 2003, 84, 195–202. [Google Scholar] [CrossRef]
  25. Abatzoglou, J.T. Development of gridded surface meteorological data for ecological applications and modelling. Int. J. Climatol. 2013, 33, 121–131. [Google Scholar] [CrossRef]
  26. Nauslar, N.; Abatzoglou, J.; Marsh, P. The 2017 North Bay and Southern California fires: A case study. Fire 2018, 1, 18. [Google Scholar] [CrossRef]
  27. Mesinger, F.; DiMego, G.; Kalnay, E.; Mitchell, K.; Shafran, P.C.; Ebisuzaki, W.; Jovic, D.; Woollen, J.; Rogers, E.; Berbery, E.H.; et al. North American regional reanalysis. Bull. Am. Meteorol. Soc. 2006, 87, 343–360. [Google Scholar] [CrossRef]
  28. Andrews, P.L.; Loftsgaarden, D.O.; Bradshaw, L.S. Evaluation of fire danger rating indexes using logistic regression and percentile analysis. Int. J. Wildland Fire 2003, 12, 213–226. [Google Scholar] [CrossRef]
  29. Cohen, J.D.; Deeming, J.E. The National Fire-Danger Rating System: Basic Equations; General Technical Report PSW-82; U.S. Department of Agriculture, Forest Service, Pacific Southwest Forest and Range Experiment Station: Berkeley, CA, USA, 1985; p. 16.
  30. National Wildfire Coordinating Group (NWCG). Incident Response Pocket Guide. 2018. Available online: https://www.nwcg.gov/publications/461 (accessed on 15 May 2019).
  31. Jolly, W.M.; Freeborn, P.H. Towards improving wildland firefighter situational awareness through daily fire behaviour risk assessments in the US Northern Rockies and Northern Great Basin. Int. J. Wildland Fire 2017, 26, 574–586. [Google Scholar] [CrossRef]
  32. National Wildfire Coordinating Group (NWCG). Interagency Standards for Fire and Fire Aviation Operations 2019; National Interagency Fire Center, Great Basin Cache Supply Office: Boise, ID, USA, 2019. [Google Scholar]
  33. Finney, M.A.; Grenfell, I.C.; McHugh, C.W.; Seli, R.C.; Trethewey, D.; Stratton, R.D.; Brittain, S. A method for ensemble wildland fire simulation. Environ. Model. Assess. 2011, 16, 153–167. [Google Scholar] [CrossRef]
  34. Short, K.C. A spatial database of wildfires in the United States, 1992-2011. Earth Syst. Sci. Data 2014, 6, 1–27. [Google Scholar] [CrossRef] [Green Version]
  35. Giglio, L.; Schroeder, W.; Justice, C.O. The collection 6 MODIS active fire detection algorithm and fire products. Remote. Sens. Environ. 2016, 178, 31–41. [Google Scholar] [CrossRef] [Green Version]
  36. Eidenshink, J.; Schwind, B.; Brewer, K.; Zhu, Z.; Quayle, B.; Howard, S. A Project for Monitoring Trends in Burn Severity. Fire Ecol. 2007, 3. [Google Scholar] [CrossRef]
  37. Malamud, B.D.; Millington, J.D.A.; Perry, G.L.W. Characterizing wildfire regimes in the United States. Proc. Natl. Acad. Sci. USA 2005, 102, 4694–4699. [Google Scholar] [CrossRef] [Green Version]
  38. Kumar, S.S.; Roy, D.P.; Boschetti, L.; Kremens, R. Exploiting the power law distribution properties of satellite fire radiative power retrievals: A method to estimate fire radiative energy and biomass burned from sparse satellite observations. J. Geophys. Res. Atmos. 2011, 116, 17. [Google Scholar] [CrossRef]
  39. Rijal, B. Quantile regression: an alternative approach to modelling forest area burned by individual fires. Int. J. Wildland Fire 2018, 27, 538–549. [Google Scholar] [CrossRef]
  40. Mees, R.; Chase, R. Relating Burning Index to Wildfire Workload Over Broad Geographic Areas. Int. J. Wildland Fire 1991, 1, 235–238. [Google Scholar] [CrossRef]
  41. Koenker, R. Quantile Regression in R: A Vignette. In Quantile Regression; Econometric Society Monographs, Cambridge University Press: Cambridge, UK, 2005; pp. 295–316. [Google Scholar] [CrossRef]
  42. Akaike, H. Information theory and an extension of the maximum likelihood principle. In Second International Symposium on Information Theory; Petrov, B.N., Csaki, B.F., Eds.; Akadémiai Kiadó: Budapest, Hungary, 1973; pp. 267–281. [Google Scholar]
  43. Jolly, M. Seven day fire danger forecasts from the National Digital Forecast Database. In Eighth Symposium on Fire and Forest Meteorology; American Meteorological Society: Kalispell, MT, USA, October 2009; pp. 13–15. [Google Scholar]
  44. Jolly, W.M.; Andrews, P.L.; Bradshaw, L.S. The Wildland Fire Assessment System (WFAS): A web-based resource for decision support. In EastFire Conference Proceedings; George Mason University: Fairfax, VA, USA, May 2005. [Google Scholar]
  45. Schroeder, W.; Oliva, P.; Giglio, L.; Csiszar, I.A. The New VIIRS 375m active fire detection data product: Algorithm description and initial assessment. Remote Sens. Environ. 2014, 143, 85–96. [Google Scholar] [CrossRef]
  46. Geospatial Multi-Agency Coordinating Group (GeoMAC). Fire Perimeter Dataset. 2019. Available online: https://rmgsc.cr.usgs.gov/outgoing/GeoMAC/ (accessed on 15 May 2019).
  47. Finney, M.; Grenfell, I.C.; McHugh, C.W. Modeling Containment of Large Wildfires Using Generalized Linear Mixed-Model Analysis. For. Sci. 2009, 55, 249–255. [Google Scholar] [CrossRef]
  48. Plucinski, M.P. Fighting flames and forging firelines: wildfire suppression effectiveness at the fire edge. Curr. For. Rep. 2019, 5, 1–19. [Google Scholar] [CrossRef]
  49. Page, W.G.; Freeborn, P.H.; Butler, B.W.; Jolly, W.M. A review of US wildland firefighter entrapments: trends, important environmental factors and research needs. Int. J. Wildland Fire 2019. [Google Scholar] [CrossRef]
  50. Freeborn, P.H.; Cochrane, M.A.; Jolly, W.M. Relationships between fire danger and the daily number and daily growth of active incidents burning in the northern Rocky Mountains, USA. Int. J. Wildland Fire 2015, 24, 900–910. [Google Scholar] [CrossRef]
  51. Taylor, S.W.; Alexander, M.E. Field Guide to the Canadian Forest Fire Behaviour Prediction (FBP) System, 3rd ed.; Special Report 11; Natural Resources Canada, Canadian Forest Service, Northern Forestry Centre: Edmonton, AB, Canada, 2018; 132p.
  52. Hobbins, M.T.; Wood, A.; McEvoy, D.J.; Huntington, J.L.; Morton, C.; Anderson, M.; Hain, C. The Evaporative Demand Drought Index. Part I: Linking Drought Evolution to Variations in Evaporative Demand. J. Hydrometeorol. 2016, 17, 1745–1761. [Google Scholar] [CrossRef]
  53. Srock, A.F.; Charney, J.J.; Potter, B.E.; Goodrick, S.L. The Hot-Dry-Windy Index: A New Fire Weather Index. Atmosphere 2018, 9, 279. [Google Scholar] [CrossRef]
  54. Wotton, B.M. Interpreting and using outputs from the Canadian Forest Fire Danger Rating System in research applications. Environ. Ecol. Stat. 2009, 16, 107–131. [Google Scholar] [CrossRef]
  55. Page, W.G.; Wagenbrenner, N.S.; Butler, B.W.; Forthofer, J.M.; Gibson, C. An evaluation of NDFD weather forecasts for wildland fire behavior prediction. Weather. Forecast. 2018, 33, 301–315. [Google Scholar] [CrossRef]
  56. Wagenbrenner, N.S.; Forthofer, J.M.; Lamb, B.K.; Shannon, K.S.; Butler, B.W. Downscaling surface wind predictions from numerical weather prediction models in complex terrain with WindNinja. Atmos. Chem. Phys. 2016, 16, 5229–5241. [Google Scholar] [CrossRef] [Green Version]
  57. Holden, Z.A.; Jolly, W.M.; Parsons, R.; Warren, A.; Landguth, E.; Abatzoglou, J. TOPOFIRE: A System for Monitoring Insect and Climate Induced Impacts on Fire Danger in Complex Terrain. Mt. Views 2013, 7, 2–5. [Google Scholar]
  58. United States Marine Corps. US Marine Corps Operational Risk Management. 2014. Available online: http://www.au.af.mil/au/awc/awcgate/usmc/orm.pdf (accessed on 17 July 2019).
Figure 1. Basic flow diagram of the US National Fire Danger Rating System.
Fire 02 00047 g001
Figure 2. CONUS-wide 4-km maps of the median values of (a) the Energy Release Component (ERC) and (b) the Burning Index (BI) as well as the maximum values of (c) ERC and (d) BI. Geographic variability in the range of absolute values is driven by the local climatology and necessitates the use of percentiles for point-to-point comparisons.
Fire 02 00047 g002
Figure 3. Method for merging ERC and BI percentiles (ERC’ and BI’) into the Severe Fire Danger Index (SFDI).
Fire 02 00047 g003
Figure 4. CONUS-wide 4-km maps of fire danger on 10 Jun 2006. (a) Absolute values of the Energy Release Component (ERC) and the Burning Index (BI). (b) ERC and BI percentiles (ERC’ and BI’).
Fire 02 00047 g004
Figure 5. Marginal plots illustrating the isolated relationships between individual fire danger indices and observed fire activity. (ac) Counts of new fire reports, eventual area burned, and the 95th percentile of final fire sizes obtained from the FPA FOD from 1992–2017. (df) Counts of active fire pixels, summed FRP, and the 95th percentile of per-pixel values of FRP obtained from the MODIS active fire product from 2003–2016.
Fire 02 00047 g005
Figure 6. New and ongoing fire activity sorted into joint bins of the Energy Release Component (ERC’) and Burning Index (BI’) percentiles. At 1 percentile resolution the color scales indicate the amount of fire activity observed in each joint bin, and at decile resolution the percentages indicate the proportion of fire activity observed in each joint bin. Note the logarithmic color scales, and that percentages less than 1% are not labelled. (a) Counts of new fire reports contained in the FPA FOD. (b) Eventual area burned by new fires that started under those fire danger conditions. (c) Active fire pixel counts detected by MODIS. (d). Sum of FRP detected by MODIS.
Fire 02 00047 g006
Figure 7. Joint distributions (top panels) and quantile regression models (bottom panels) illustrating the interactive effects of the Energy Release Component (ERC’) and Burning Index (BI’) percentiles on (a,c) the 95th percentile of final sizes, and (b,d) the 95th percentile of per-pixel values of fire radiative power (FRP).
Fire 02 00047 g007
Figure 8. CONUS-wide 4-km maps illustrating the process of mapping the Severe Fire Danger Index (SFDI) for a single day on 10 Jun 2006. Upstream percentiles of the Energy Release Component (ERC’) and the Burning Index (BI’) for the same day are shown in Figure 4. The product (a) and then the percentile of the product (b) of ERC’ and BI’ are used to generate the SFDI (c).
Fire 02 00047 g008
Figure 9. Distributions of per-pixel values of fire radiative power (FRP) stratified by Severe Fire Danger Index (SFDI). Active fire pixels detected across CONUS from 2003 to 2016 were obtained from the Moderate-Resolution Imaging Spectroradiometer (MODIS) monthly active fire product (MCD14ML) and were clipped to Monitoring Trends in Burn Severity (MTBS) fire perimeters. Note the log-scale of the x-axis, and that the inset is zoomed into the tails. Each distribution is summarized in Table 1.
Fire 02 00047 g009
Figure 10. Day 0 forecasts of SFDI at 2.5-km grid spacing archived on the start dates for nine large, destructive, and deadly California fires in 2017 and 2018. (a) Atlas, Nuns, Redwood Valley, and Tubbs fires. (b) Thomas fire. (c) Carr fire. (d) Mendocino Complex. (e) Camp and Woolsey fires. Note: Each forecast was produced before any of these high-profile fires were reported.
Fire 02 00047 g010
Figure 11. Evaluation of the daily, CONUS-wide, 2.5-km gridded National Digital Forecast Database (NDFD) maps of the Severe Fire Danger Index (SFDI) produced daily at 0530 US mountain standard time and archived from 01 August 2017 to 01 December 2018. Active fire pixels were obtained from the Moderate-Resolution Imaging Spectroradiometer (MODIS) monthly active fire product (MCD14ML) and were clipped to Geospatial Multi-agency Coordinating Group (GeoMAC) incident perimeters. Except for the 0130 local overpass times, MODIS observations of fire activity occurred after the NDFD maps were produced and posted to the WFAS website.
Fire 02 00047 g011
Figure 12. Associations between percentiles of the Energy Release Component (ERC’), the Burning Index (BI’), Severe Fire Danger Index (SFDI), and 178 wildland firefighter entrapments that occurred across CONUS between 1979 and 2017. (a) Scatterplot of fatal and non-fatal entrapments. (b) Density plot annotated with the number of entrapments per decile. (c), (d) and (e) The number of entrapments, the number of firefighters entrapped, and the number of firefighter entrapment fatalities that occurred in each class of SFDI. Note the floating y-axis on the bottom panels.
Fire 02 00047 g012
Table 1. Summary of the amount and characteristics of (a) new and (b) ongoing fire activity observed at each Severe Fire Danger Index (SFDI) category. New fires reported across CONUS from 1992 to 2017 were obtained from the Fire Program Analysis Fire Occurrence Database (FPA FOD). Active fire pixels detected across CONUS from 2003 to 2016 were obtained from the Moderate-Resolution Imaging Spectroradiometer (MODIS) monthly active fire product (MCD14ML) and were clipped to Monitoring Trends in Burn Severity (MTBS) fire perimeters.
(a)(b)
SFDIProportion of New Fire ReportsProportion of Area Burned95th %tile of Final Fire SizeProportion of Active Fire PixelsProportion of Summed FRP95th %tile of per-Pixel FRP
Low25.0%6.6%28 ac2.6%1.2%198.4 MW
Moderate26.3%15.2%40 ac7.4%4.9%312.9 MW
High19.6%20.2%50 ac14.7%12.7%428.8 MW
Very High18.4%28.1%61 ac29.7%27.2%465.7 MW
Severe10.7%29.9%95 ac45.5%54.0%639.6 MW
Table 2. Proportion of area (2.5-km grid cells) that burned during the first two days of nine wildfires classified by the forecasted Severe Fire Danger Index (SFDI). The nine incidents from 2017 to 2018 comprise seven of the most destructive, four of the largest, and five of the deadliest fires in California’s history [15,16,17]. Forecast maps were produced on the morning of the start date prior to discovery (Figure 11), and the 2.5-km grid cells that burned the day of and the day following ignition were identified based on their intersection with Visible Infrared Imaging Radiometer (VIIRS) 375-m hotspots.
SFDI
Incident (Final Size, ac)LowModerateHighVery HighSevere
Atlas (51,624)0.0%0.0%0.0%0.0%100.0%
Nuns (54,382)0.0%0.0%0.0%0.0%100.0%
Redwood Valley (36,523)0.0%6.3%18.8%75.0%0.0%
Tubbs (36,807)0.0%0.0%0.0%0.0%100.0%
Thomas (281,893)0.0%10.8%10.8%16.2%62.2%
Carr (229,651)0.0%10.0%70.0%20.0%0.0%
Mendocino Complex (459,123)0.0%0.0%15.3%46.2%38.5%
Camp (153,336)0.0%0.0%0.0%62.5%37.5%
Woolsey (96,949)0.0%40.3%31.3%25.4%3.0%
Average0.0%7.5%16.3%27.2%49.0%

