Article

Comparative Studies on the Radiative Heat Transfer in Arc Plasma and Its Impact in a Model of a Free-Burning Arc

1
Leibniz Institute for Plasma Science and Technology, 17489 Greifswald, Germany
2
Laboratoire Plasma et Conversion d’Energie (LAPLACE), Université de Toulouse, CNRS, UPS, INPT, 31062 Toulouse, France
3
Department of Power Electrical and Electronic Engineering, Faculty of Electrical Engineering and Communication, Brno University of Technology, 61600 Brno, Czech Republic
*
Author to whom correspondence should be addressed.
Plasma 2024, 7(3), 631-650; https://doi.org/10.3390/plasma7030033
Submission received: 11 June 2024 / Revised: 31 July 2024 / Accepted: 2 August 2024 / Published: 5 August 2024

Abstract

:
The radiative heat transfer in arc plasma models is considered from the point of view of its description in terms of a net emission coefficient, the method of spherical harmonics in its lowest order, and the discrete ordinate method. Net emission coefficients are computed, applying approximate analytical and numerical approaches and a multi-band representation of the spectral absorption coefficient with three kinds of its averaging and two datasets. Self-consistent access to the radiative heat transfer is applied to a two-dimensional axisymmetric model of a free-burning arc in argon at atmospheric pressure. The results obtained from the models employing the net emission coefficient, the method of spherical harmonics, and the discrete ordinate method are compared.

Graphical Abstract

1. Introduction

Electric arcs find a wide range of applications. They appear in gases and vapours at low, atmospheric, and high pressure. Being characterized by low voltage, the emission of high-intensity light, and the production of heat, electric arcs are utilized in material processing (welding, cutting, furnaces), lamps, switching devices, etc. Industrial applications require a high degree of automation, accuracy, reliability, and stability of the arc plasma diagnostics (see [1] and the references therein). Electrical measurements (voltage and current) provide a method for the control of the arc stability. Fluctuations in the arc attachment on the electrode lead to changes in the arc length and, in turn, in the arc voltage [2]. Optical imaging allows for a three-dimensional analysis of the plasma structure [3]. Optical emission spectroscopy as a non-intrusive method and, in combination with advanced cameras and detectors, enables the measurement of the plasma temperature in the arc core, which is assumed close to the state of local thermodynamic equilibrium (LTE) [4]. Laser scattering methods that, in general, avoid the assumption of LTE have been applied to obtain the electron temperature and density [5]. Nevertheless, it is difficult or even hardly possible to experimentally determine the complex conditions inside the arc plasma. Modelling and simulation of arc plasma for various applications have been, therefore, intensively developed over the years (see, e.g., [6,7,8,9,10] among others). An electric arc implies a multiphysics problem since the arc generation is generally accompanied by interrelated electromagnetics, fluid flow, and heat transfer. State-of-the-art models of arc plasma have been developed that focus in particular on the effects of turbulence [11], non-equilibrium [12,13], and arc–electrode interaction [14,15,16]. A unified modelling approach for arc discharges at low currents (a few Amperes) and small gaps is based on fluid description and employs a single set of equations for the entire inter-electrode region and allows one to explore the spatial structure of the arc. The account of a metal vapour released from the electrodes in arc models shows that the plasma parameters and the net radiative emission can be significantly changed. More details can be found in the review works [1,16] and the references therein.
Due to the high temperatures in the arc plasmas, the treatment of the plasma radiation is an important issue in their modelling [17,18]. The divergence of the radiative heat flux appears as a sink term in the equation of energy conservation in magneto-hydrodynamic (MHD) models of LTE arc plasma. It represents the interaction between the radiation and the plasma matter and is related to the radiative intensity. Arc plasmas are heated up to temperatures of tens of thousands of kelvins that implies irradiation by neutral and charged particles that covers the spectral region of 1012 Hz–1016 Hz, where tens of thousands of spectral lines exist. The change in the spectral radiative intensity along a line of sight due to emission and absorption is governed by the equation of radiative transfer (RTE) with account for the spatial distributions of temperature and pressure and the equilibrium plasma composition. The computation of the radiative heat flux for every frequency and direction in space within the arc model becomes hardly affordable. In order to overcome the computational overhead and keep the arc model feasible and capable of predicting the arc behaviour, simplifications are usually introduced. An overview and analysis of methods is given in [17]. A common approach used in many arc models makes use of introducing a net emission coefficient (NEC) [19] obtained for an isothermal cylinder of a given radius. This approach is often reduced to the computation of the radiative heat losses in the arc as a function of the local values of temperature and pressure although, the NEC is, strongly speaking, determined by the entire temperature profile in the arc [19]. Although this approach can provide reasonable results for the plasma temperature for a well-chosen value of the radius, for which the NEC is computed, there remains inconsistency regarding situations with deviations from a cylindrical shape of the arc. Other approaches for solving the RTE with account for the emission and absorption of radiation as well as effects on the plasma boundaries are the method of spherical harmonics (P1 as the lowest order) and the discrete ordinate method (DOM) [20]. The application of the DOM to models of gas circuit breakers has been considered in [21].
In the present work, we revisit the physical background of the radiative heat transfer, we give an overview of approximate methods for its computation, and we follow self-consistent access in the treatment of the radiative heat transfer in models of LTE arc plasma that account for the arc–electrode interaction [22,23]. The derivation of governing relations used in the methods under consideration is given as supplementary material in Appendix A and Appendix B. NEC, P1, and DOM are implemented into a 2D model of a free-burning arc. Approximate NECs are obtained from the spectral absorption coefficient, employing a line-by-line approach. In addition, the multi-band approximation of the absorption coefficient is applied to obtain the NECs in the P1 and DOM approaches for two datasets regarding the spectral absorption coefficient. The plasma temperature and the radiative losses predicted by the NEC, P1, and DOM approaches are compared. The impact of using different datasets for the spectral absorption coefficient is studied. These detailed studies and the self-consistent account of the radiative heat transfer in state-of-the-art LTE arc plasma models instead of pre-imposed profiles of the plasma temperature [18,21] constitute the originality of this work.

2. Physical Background

An almost complete description of the basic LTE arc model employed in this work can be found in the previously published works [22,23]. Here, its main features are briefly summarized. A model of a thermionic cathode made of doped tungsten and its non-equilibrium boundary layer (submodel 1 in Figure 1) and an MHD model of the LTE arc plasma in argon at atmospheric pressure and the anode (submodel 2 in Figure 1) are coupled through a dimensionless interface along the edge between the cathode and the plasma. For a given total current, the first submodel solves for the current and the heat transfer within the cathode, applying pre-computed transfer functions as boundary conditions for the normal current density and heat flux as functions of the surface temperature of the cathode and the voltage drop in the boundary layer. These transfer functions are obtained by solving the energy balance of the non-equilibrium boundary layer [24]. Among the results, the distribution of the normal current density (jn) and the electron temperature (Te) along the plasma edge are computed. These quantities serve as boundary conditions of the second submodel. Notice that in the LTE arc plasma, electrons and heavy particles are characterized by a common temperature (Te = T). The second submodel solves the equations for the conservation of mass, momentum, and energy, the equations describing the current continuity, Ohm’s law, and the Maxwell equation [23]. The equations of current and heat transfer are solved in the electrodes as well. The thermodynamic and transport properties of the argon plasma are from [25,26], while those of the solid materials are from [27,28]. The connection of the cathode to the plasma is realized by means of coupling submodel 1 to submodel 2 through the non-equilibrium boundary layer. The electrical connection of the plasma to the anode is enabled by setting a lower limit of the electrical conductivity (100 S/m) in the vicinity of the anode. The thermal connection is given by default since the anode surface in contact with the plasma is not a boundary but an interface for the heat conduction. In what follows, the attention is focused on the energy conservation equation, in which the radiative heat transfer is taken into account.
The energy conservation equation for a stationary LTE arc plasma is written as
ϱ C p u · T + · q + q r = α p T u · p + τ : u + Q .
In Equation (1), ρ denotes the mass density, C p is the specific heat capacity at constant pressure, T is the plasma temperature, u is the velocity vector, q is the conductive heat flux, qr is the radiative heat flux, α p = 1 ϱ ϱ T is the coefficient of thermal expansion, p is the pressure, τ is the viscous stress tensor for a Newtonian fluid, and Q contains other heat sources such as Joule heating and the transport of electron enthalpy.
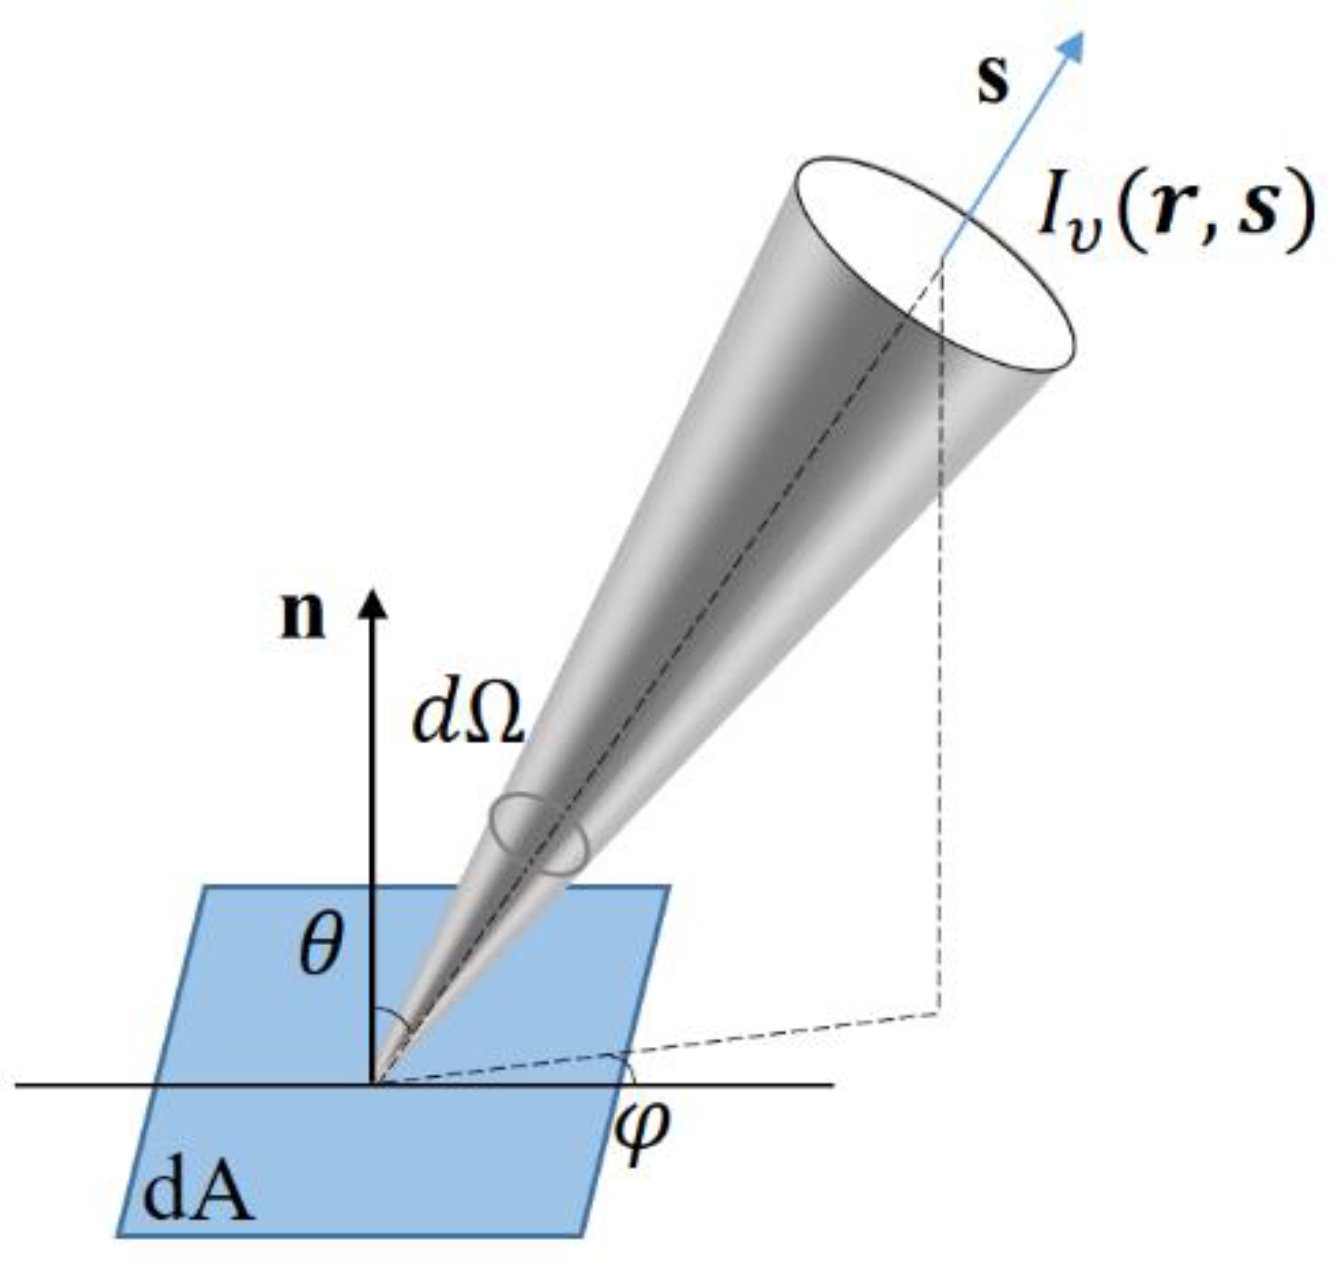
The divergence of the radiative heat flux · q r is of greatest interest in this work since it represents the interaction between radiation and matter. For an absorbing–emitting medium, the radiative intensity I ν ( r , s ) is defined as the radiative energy per unit time and unit area normal to the rays per unit solid angle and frequency (Figure 2) [20,29]. Here, r is a position vector fixing the location of a point in space, and s is a unit direction vector.
The change in the spectral radiative intensity along a line of sight into direction s is given by the radiative transfer equation (RTE) [20], which, in the case of no scattering, reads
s · I ν = d I ν d s = κ ν B ν κ ν I ν .
In Equation (2), κ ν denotes the spectral absorption coefficient, the Plank intensity B ν = 2 h c 2 ν 3 e h ν / k B T 1 is introduced, with h and k B being, respectively, the Plank and the Boltzmann constants, and c is the speed of light. This equation shows how the intensity is amplified by emission and decreased by absorption. The integration of the RTE over the solid angle gives the divergence of the spectral radiative heat flux:
· q r ν = Ω = 0 4 π s . I ν d Ω = Ω = 0 4 π κ ν B ν d Ω Ω = 0 4 π κ ν I ν d Ω .
Integrated over the spectrum, the divergence of the radiative heat is now
· q r = 4 π 0 κ ν B ν d ν 0 Ω = 0 4 π κ ν I ν d Ω d ν
or
· q r = 4 π 0 κ ν B ν d ν 0 κ ν G ν d ν
as the incident radiation G ν = Ω = 0 4 π I ν d Ω is introduced. Equation (5) shows that · q r is obtained through integration over the directional coordinates and the spectrum, and therefore, it depends on the distribution of the plasma temperature in the medium. This refers to the quantity net emission coefficient [19], introduced as
ε N = 1 4 π · q r .
At the arc edge, absorption of radiation originating from the arc centre can lead to negative values of the NEC ε N [19]. Since an exact evaluation of · q r is usually not feasible, approximations can be invoked [19,29].

3. Overview of Approximate Methods Used in the Present Work

The approximate methods considered in the present work involve simplifications with respect to the spectral properties of the arc plasma and the treatment of the directional integration, i.e., the solution of the RTE (2). These methods are briefly summarized below.

3.1. Multi-Band Approximation for the Spectral Absorption Coefficient

In this approximation, the spectral properties of the plasma (the spectral absorption coefficient κ ν ) are assumed to be uniform over a set of frequency intervals [20]. In the case where only one interval is used, the approximation reduces to the grey model. The increase in the number of spectral bands improves the accuracy and increases the computational effort. The number of spectral bands and their boundaries are chosen by considering the behaviour of the absorption coefficient (see below for the computation of the absorption coefficient). Five intervals with boundaries 0.003, 1.0, 2.8, 3.8, 6.67, and 10.0 in units of 1015 Hz, as reported in [30], are used in the present work. The evaluation of the spectral absorption coefficient κ ν in each interval of frequencies [ ν i ,   ν i + 1 ] can be performed applying Plank ( κ P ) or Rosseland ( κ R ) averaging [20] or a combination of both ( κ h ), which leads to a hybrid mean value [31]. The idea behind the hybrid mean absorption coefficient is to weight the overestimate and the underestimate expected by, respectively, the Plank and Rosseland mean absorption coefficients [32]. The corresponding equations read
κ P = ν i ν i + 1 κ ν B ν d ν / ν i ν i + 1 B ν d ν ,
κ R 1 = ν i ν i + 1 κ ν 1 d B ν d T d ν / ν i ν i + 1 d B ν d T d ν
κ h = γ κ R + 1 γ κ P , γ = ( κ P κ R ) / κ P .
According to Equation (9), κ h could become negative if κ R / κ P > 2 (not the case in argon).
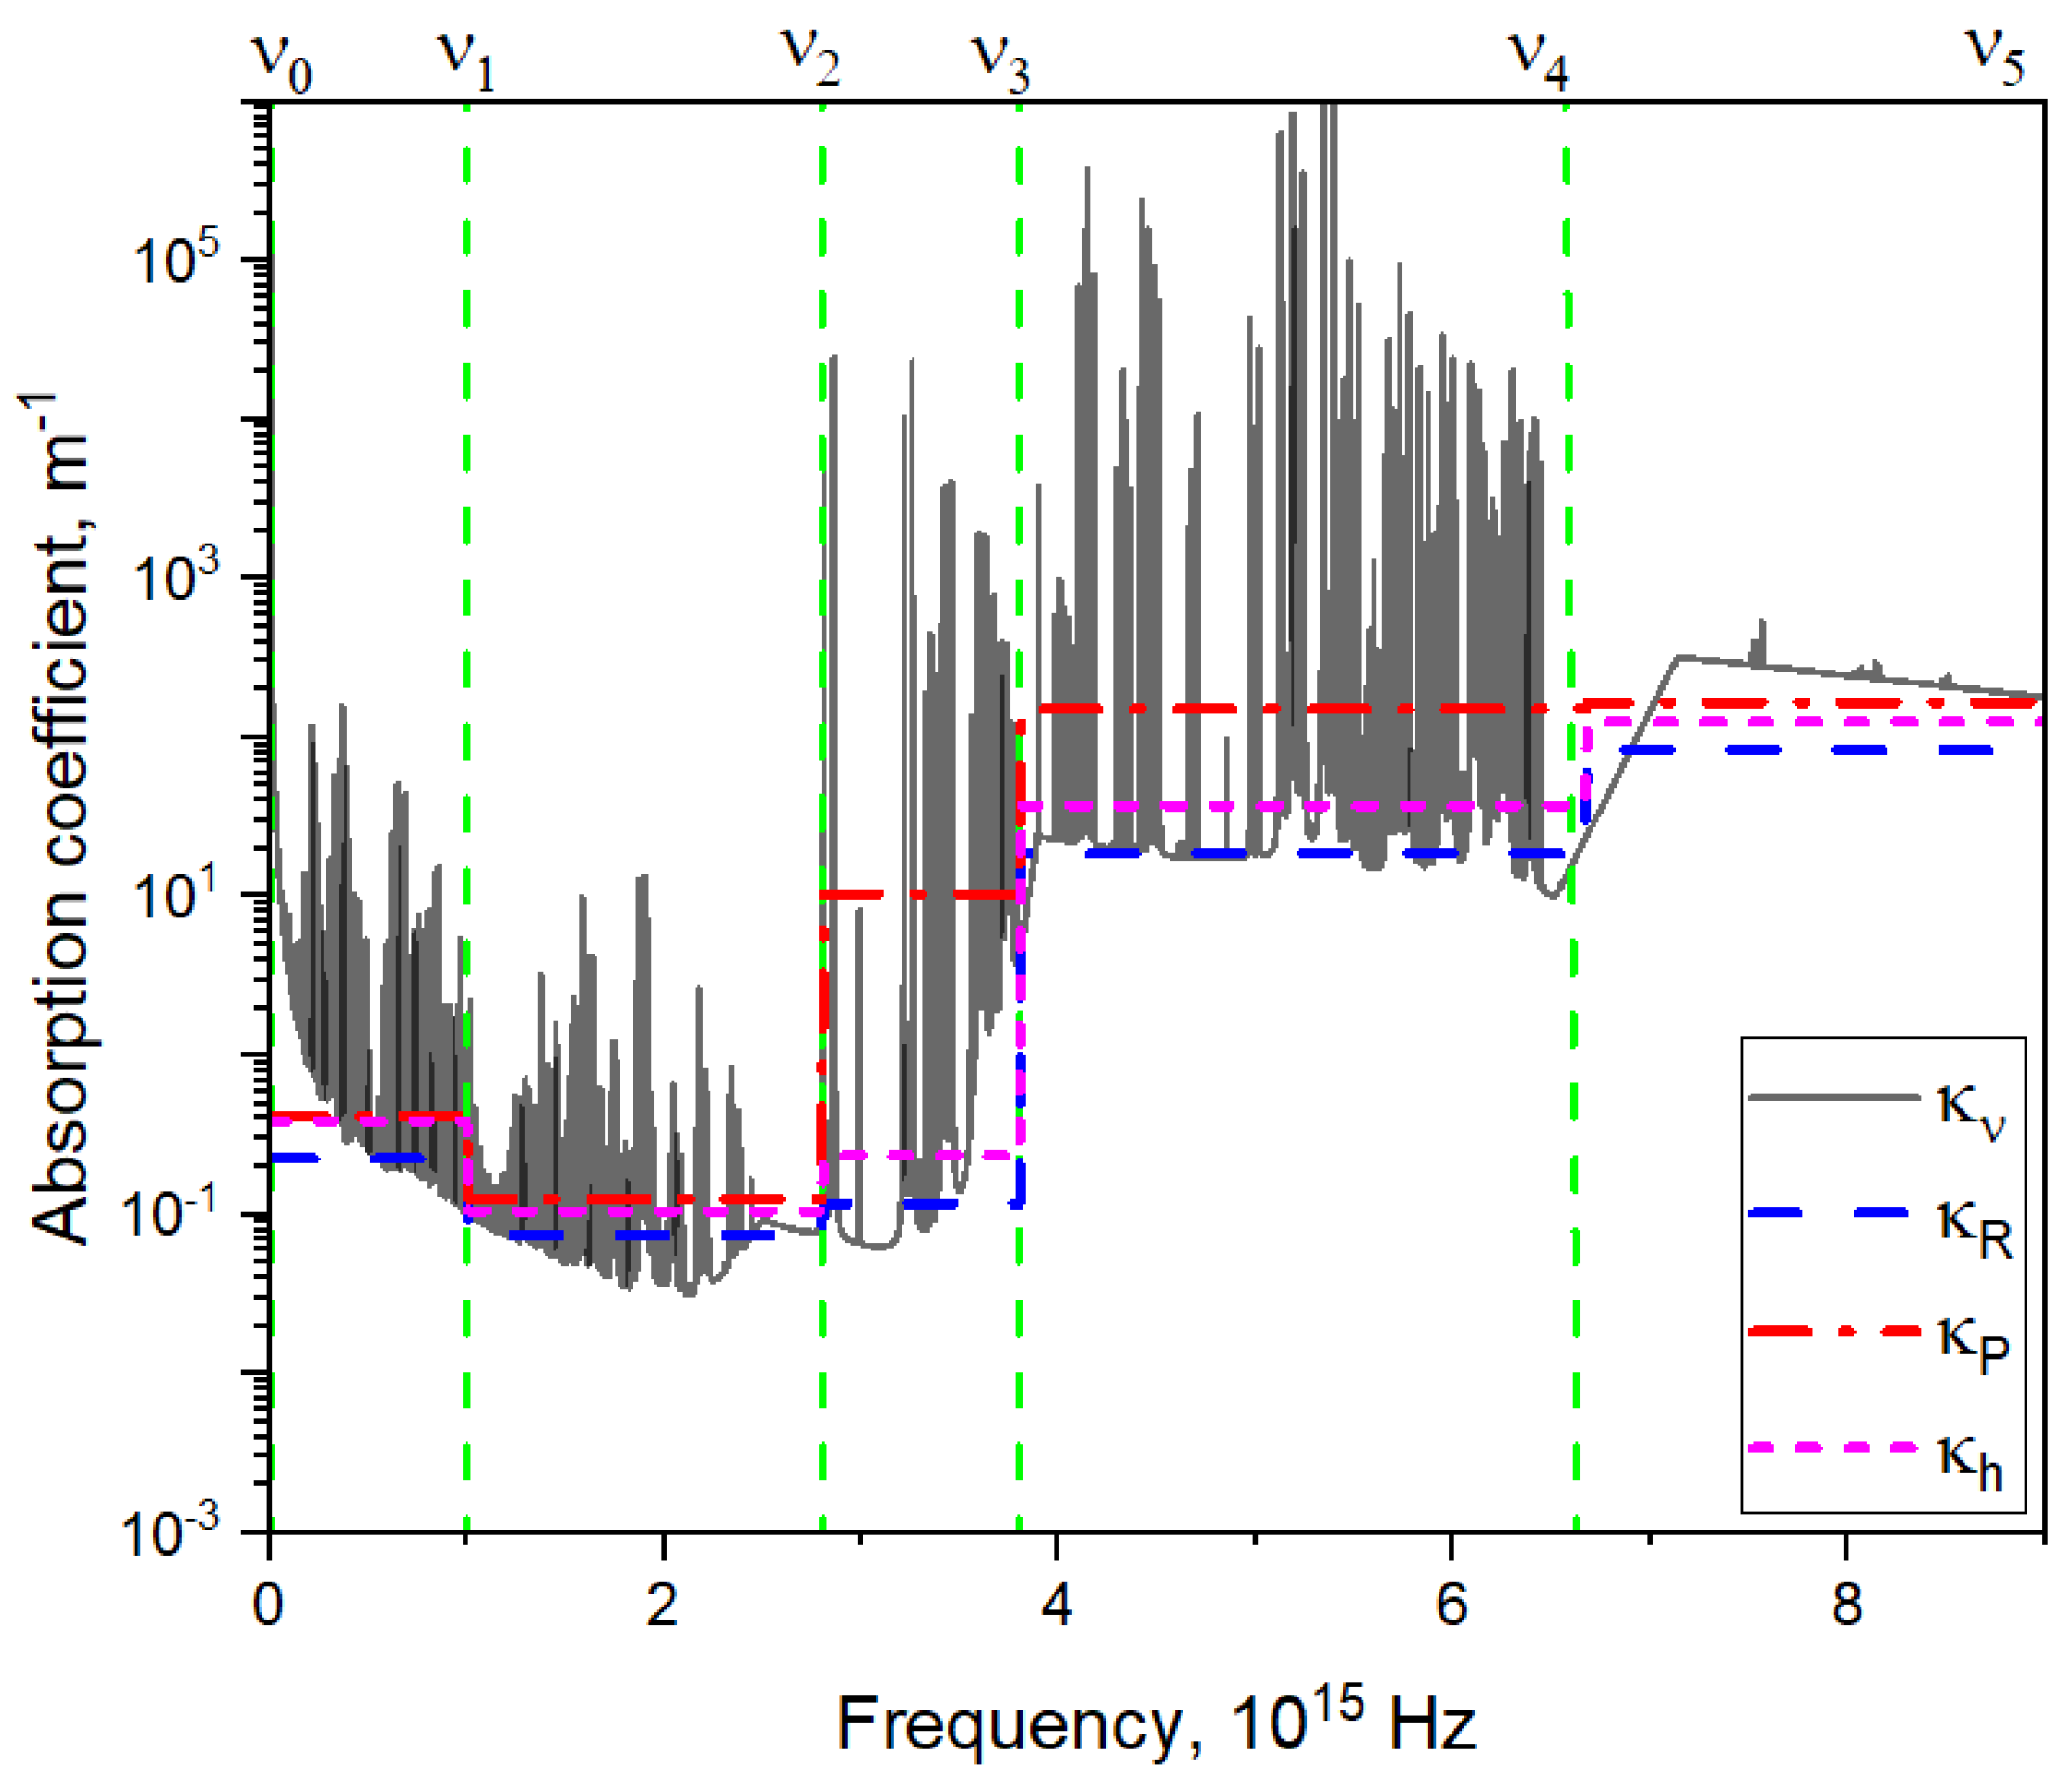
As an example, the spectral absorption coefficient ( κ ν ) of Ar plasma at a pressure of 1 bar and a temperature of 20,000 K is shown in Figure 3 along with the mean absorption coefficients κ R , κ P , and κ h . In some spectral intervals, the difference between κ P and κ R becomes quite large.

3.2. The P1 Method of Spherical Harmonics

In the method of spherical harmonics, the RTE (2) is transformed into a set of partial differential equations [20]. The governing equations of the approximation of lowest order, known as the P1 approximation, are written as follows
· q r r = κ 4 π B G r ,
q r r = 1 3 κ G r .
The derivation of Equation (11) is provided in Appendix A. Notice that the index “ν” denoting the corresponding spectral quantity is dropped. A second-order partial differential equation for G r is derived from Equations (10) and (11):
· D P 1 G r = κ 4 π B G r ,
where D P 1 = 1 3 κ . The boundary condition at opaque walls (Marshak boundary condition [20]) reads
n · D P 1 G r = q r , n e t ,
with q r , n e t being the net radiative flux absorbed by the boundary; n is the surface normal. Depending on the surface emissivity ϵ ( 0,1 ) , the boundary surface is treated as grey with
q r , n e t = ϵ 2 2 ϵ 4 π B η G
or black ϵ = 1 . The quantity η ( 0,1 ) accounts for the fractional emissive power in a given spectral interval. The net radiative flux at flow inlets and outlets is computed in the same manner as at walls, assuming an emissivity of one.

3.3. The Discrete Ordinate Method

The DOM solves the RTE (2) by means of a discretization of the angular space; i.e., the integral over all directions is replaced by numerical quadratures of discrete directions j.
Ω = 0 4 π I d Ω = j ω j I j .
The number of directions gives the number of the dependent variables to be solved for.
With intensities having been obtained, the radiative heat flux, the incident radiation, and the divergence of the radiative heat flux can be determined (see Equations (3) and (5)).
The boundary condition at opaque walls reads
I j , b n d = ϵ B η + 1 ϵ π q r , o u t
for all directions s j , such that n · s j < 0 .

3.4. Approximate Net Emission Coefficient

Equation (6) relates the net emission coefficient and the divergence of the radiative heat flux · q r . An approximate net emission coefficient can be obtained by solving the RTE (2) for cylindrical isothermal plasmas of various temperatures and radii [19]. Approximate analytical expressions for the net emission coefficient at the centre of homogeneous plasma were presented in [19,33] as
ε A = 0 κ ν B ν G 1 κ ν R d ν ,
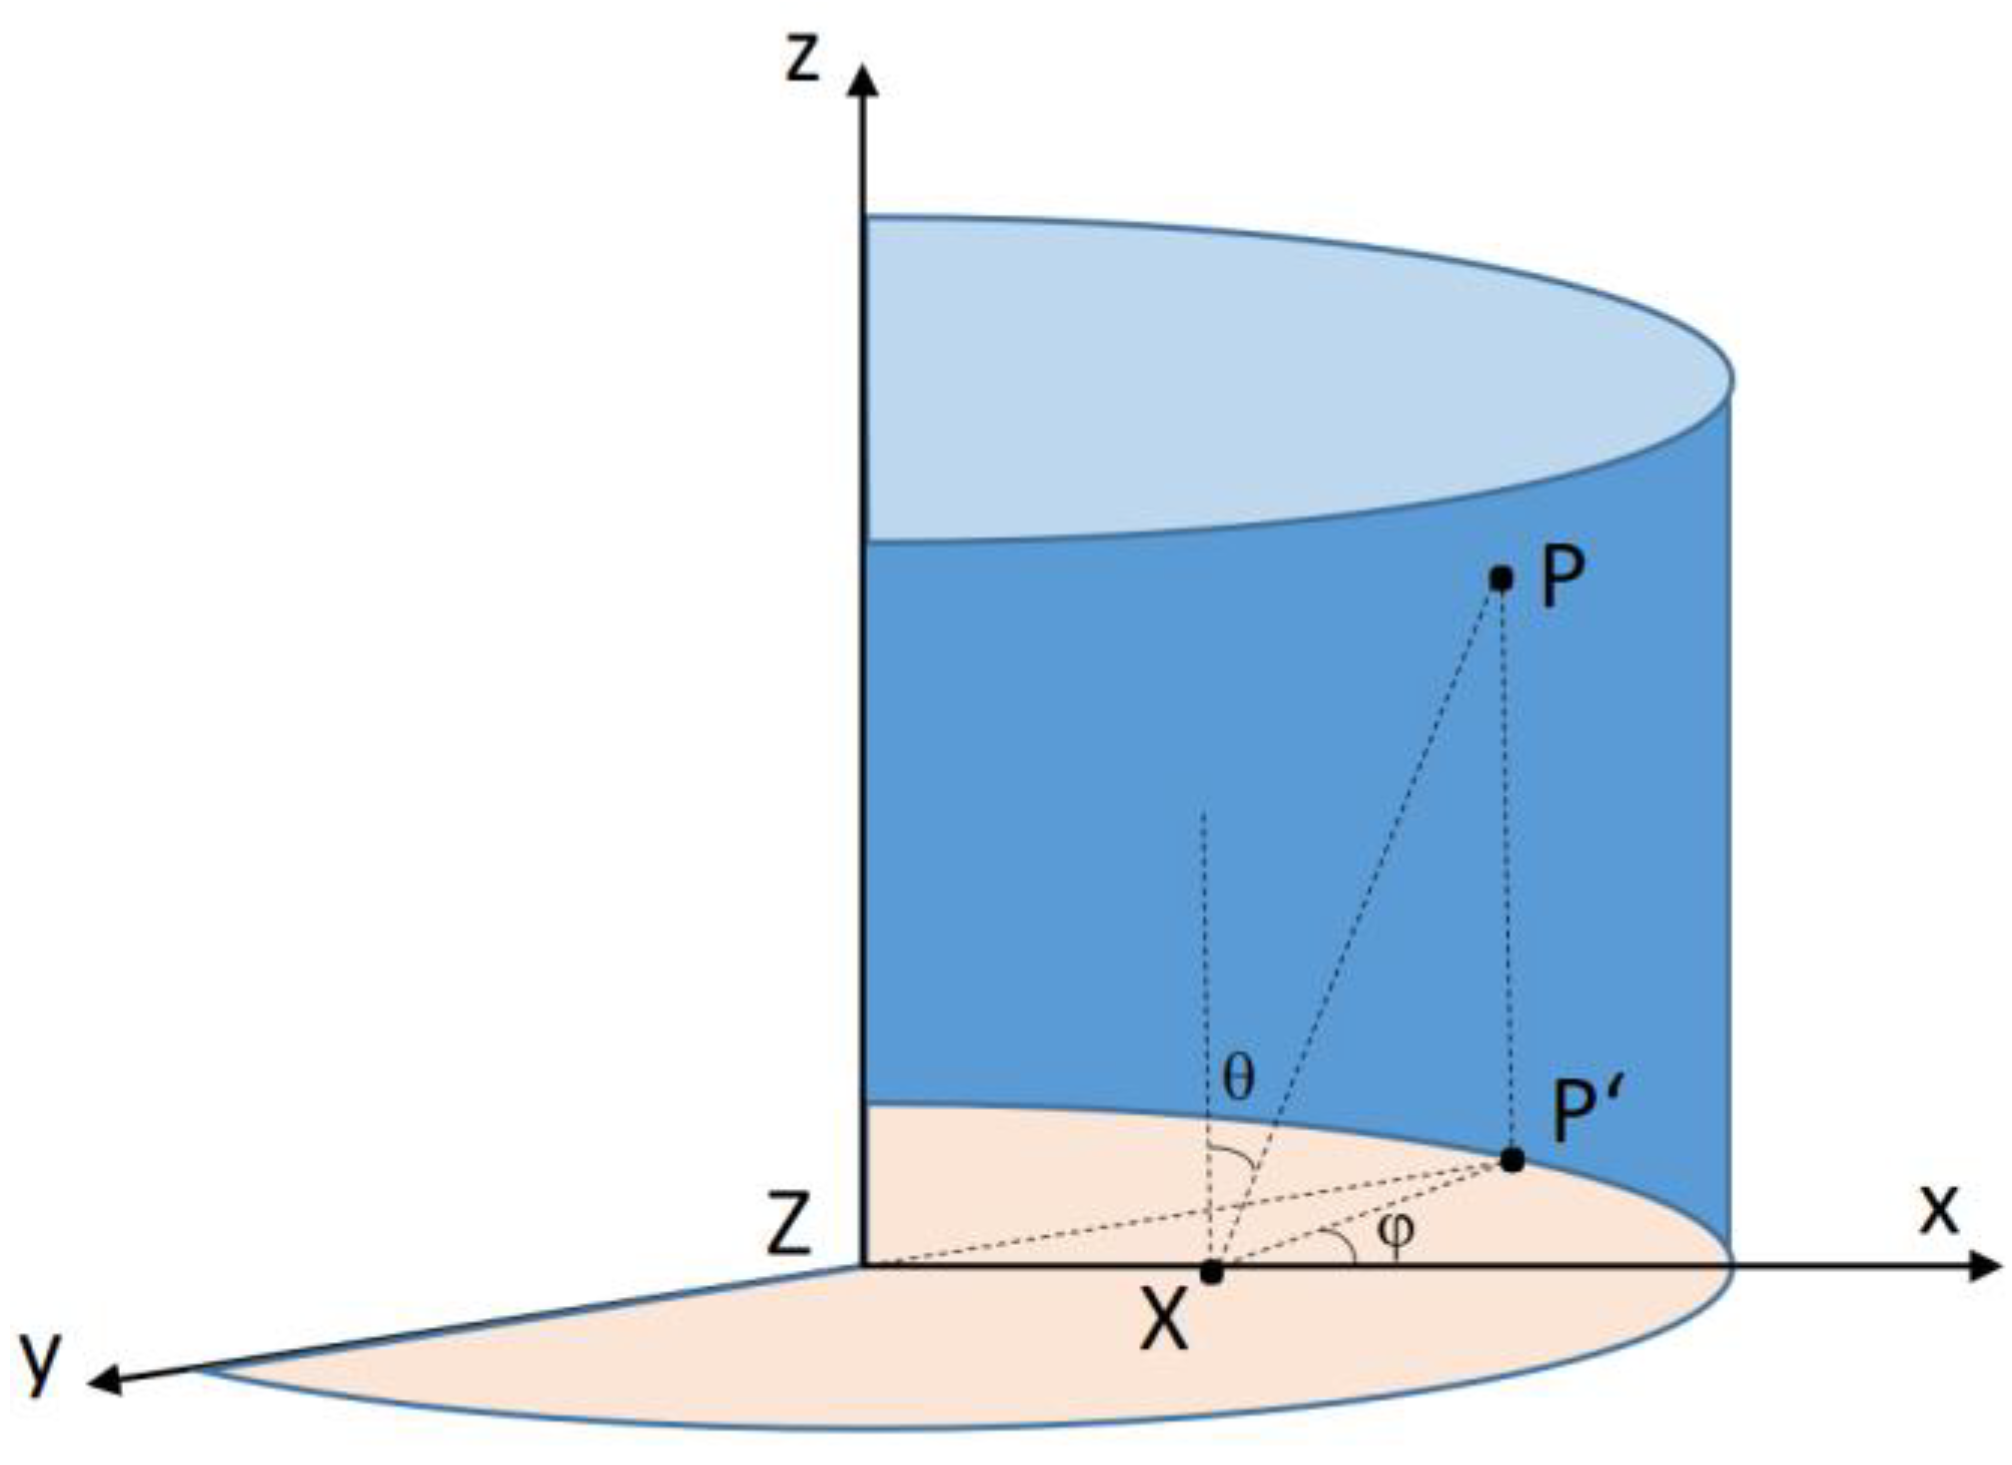
where R denotes the radius of the cylinder. The derivation of Equation (17) is provided in Appendix B. The directional vector is defined by the spherical coordinates θ and φ (see Figure 4). Point X is located insight the plasma (taken for convenience on the x-axis). The integration along the line XP ( θ 0 ) can be transformed into integration along the line Z P ′, which is perpendicular to the z axis of the cylindrical plasma.
Note that Equation (17) is often approximated as [19,34]
ε A = 0 B ν κ ν exp κ ν R d ν
since the function G 1 x behaves similarly to exp x . Equation (18) applies, strongly speaking, to the case of an isothermal sphere of radius R .
The evaluation of the value of ε A according to Equation (17) for a given value of the radius R can be achieved by a direct integration and by applying the multi-band approach [34] while employing the Planck, Rosseland, and hybrid mean absorption coefficients considered in Section 3.1.
Alternatively, numerical solutions by means of the P1 method and DOM in a combination with the multi-band approximation of the spectral absorption coefficient are considered in the present work, and the NEC is obtained from the evaluated divergence of the radiative heat flux according to Equation (6). Solutions of the RTE are obtained in a three-dimensional geometry and the approximate NECs are evaluated for several values of the radius R and the length L (R << L) of the cylinder.

4. Computation of the Absorption Coefficient

The spectral absorption coefficient plays a crucial role in the propagation of radiation in participating media, as is indicated by Equation (2) and the subsequent relations. The accurate knowledge of this quantity is thus a necessity for any calculations involving a radiative transfer. The accurate determination poses a big challenge as every process resulting in a loss of radiation has to be included in the evaluation process.
The number of processes is significantly reduced in the case of argon as the working gas. Since argon is a noble gas, the gas under LTE conditions is composed mainly of atomic species, alleviating the need for evaluation of radiation–molecular interaction processes. Furthermore, the LTE assumption enables the evaluation of the emission coefficient instead of direct absorption coefficient evaluations, as these coefficients are related to each other by Kirchhoff’s law:
ε ν = κ ν B ν T ,
where ε ν denotes the spectral emission coefficient, and κ ν and B ν have already been defined in Section 2. The evaluation of the emission coefficient instead of that of the direct absorption coefficient is preferable in certain cases.
Three kinds of transition processes have to be taken into account, when evaluating the absorption coefficient in an atomic gas. These are bound–bound, bound–free, and free–free transitions. The naming convention is derived from an electron state in the vicinity of an atom or an ion before and after the absorption of radiation in the form of a photon.
The bound–bound transition, often called photo-absorption or line radiation, is associated with the absorption of a photon by an electron found in the bound state of the argon atom or ion. The absorbed energy excites the electron to a higher but still bound energy state. The resulting contribution to the absorption coefficient can be expressed as
κ ν = I p , T P ν 1 exp h ν / k T
where I p , T = π r 0 c f i k N i is the total line intensity, P ν is the line profile, generally calculated as an approximation of the Voigt profile, and 1 exp h ν / k T is a correction factor accounting for induced emission. In the above expressions, r 0 is the classical electron radius, f i k is the oscillator strength of line, c is the speed of light constant,
N i = g i N Q int T e E i k T
is the population density of the lower level with statistical weight g i and energy E i , and Q int denotes the internal partition function. The line profile P ν expresses an averaging of the absorption of many absorbing atoms each in slightly different condition, stemming either from a thermal motion (Doppler broadening), a close proximity to a charged particle (Stark broadening), a close proximity to a particle with dipole momentum (van der Waals broadening), or a close proximity to a particle with a similar structure of electron levels (Resonance broadening). Details of each broadening mechanism fall out of the scope of this work and can be found in relevant works, such as [35].
Bound–free transition, also called photo-absorption or radiative recombination, represents another important process in the evaluation of the absorption coefficient. The process is associated with the formation of a positive ion and a free electron due to the absorption of radiation. The transition is characterized by a continuous absorption coefficient, with sharp drops at certain frequencies known as absorption edges. The frequency of these edges is governed by the energy structure of the involved atoms and corresponds to the energy difference between the bound states and the ionization level. Some approximations of the evaluation of bound–free absorption coefficient are provided, e.g., in [36,37].
Finally, the free–free transition, known as the inverse Bremsstrahlung or simply the Bremsstrahlung from the emission point of view, represents the absorption of radiation by a free electron in the electric field produced by a neutral particle with a dipole momentum or an ion. The contribution of this process to the total absorption coefficient is generally small with exception of the low frequency limit. The calculation procedure depends on whether the process is calculated in the vicinity of a neutral atom or an ion. This topic is considered in detail, e.g., in [38].
The absorption coefficient is evaluated using Kirchhoff’s law. Two separate datasets were considered in the present work, each one obtained in a slightly different way, as follows:
  • Dataset I
The plasma composition for the given pressure of 1 bar and temperature values from 300 K up to 30,000 K is obtained using the mass action law, the energy levels of the species (ArI-IV), and their internal partition functions [37]. The spectral absorption coefficient is then deduced from these population densities as the sum of several radiative contributions for wavelengths between 30 nm and 4500 nm: the atomic continuum comprising the Bremsstrahlung in electron–ion collisions, Bremsstrahlung in electron–atom collisions, radiative recombination and attachment, and atomic and ionic spectral lines. An almost complete description and the data used are given in [37]. Compared to [37], the number of atomic energy levels was extended according the NIST data [39] to include 427 energy levels for ArI, 417 for ArII, 125 for ArIII, and 58 for ArIV. In particular, attention was paid to the description of the atomic lines. Instead of using an escape factor as in [37], the line-by-line method was employed that takes into account a fine treatment of the profiles of the atomic lines and their broadening due to the Doppler effect, van der Waals interaction, and the Stark effect. This treatment is a complex and long task since these effects modify the shape of the line profiles depending on the pressure and the temperature. For the 9551 lines of argon species (2758 for ArI, 5804 for ArII, 843 for ArIII, and 146 for ArIV), the wavelength grid involves 9,267,017 points at 300 K and 1,256,961 points at 30,000 K.
  • Dataset II
The same plasma composition utilized in dataset I is used to calculate the radiation properties for dataset II, thus keeping the plasma composition of both datasets equal. The spectral absorption coefficients are calculated with consideration of radiation processes including bound–bound (atomic and ionic lines), bound–free (photoionization continuum) and free–free (Bremsstrahlung) processes. Data for known atomic lines were taken from the NIST database. In total, 804 atomic and ionic lines of argon were considered (412 for ArI, 300 for ArII, 68 for ArIII, and 24 for ArIV). Several broadening mechanisms for each line were considered, including Doppler, Stark, van der Waals, and resonance broadening. The final line profile was calculated using Whiting approximation for the Voigt line profile [40]. Two data sources were utilized for evaluating the photoionization process on the absorption properties of argon. The primary source was cross-sections published by Opacity Project supplemented by hydrogenic approximation according to [36] in cases of missing cross-sections. In total, 1203 energy levels of argon atoms and ions were considered (176 cross-sections and 27 hydrogenic approximations for ArI, 238 cross-sections and 23 hydrogenic approximations for ArII, 225 cross-sections and 231 hydrogenic approximations for ArIII, and 338 cross-sections and 52 hydrogenic approximations for ArIV). The Bremstrahlung contribution was calculated for both neutral argon and argon ions. The radiation contribution was calculated in the range from 1 × 10¹¹ Hz (3 mm) to 1.2 × 10¹⁶ Hz (25 nm) with a fixed frequency step of 1010 Hz resulting in the total number of 1,199,991 frequency grid points.

5. Results and Discussion

The main objective of the present work is self-consistent access to the radiative heat transfer in models of LTE arc plasma. For that purpose, the NEC, P1, and DOM methods are implemented into a 2D axisymmetric model of a free-burning arc, and the computed plasma parameters are compared. Each method requires the knowledge of the radiative properties of the plasma. In the framework of the arc model employing the NEC, the values of the NEC have to be computed prior to the simulation and provided as a function of the temperature. The arc models employing the P1 and the DOM methods make use of a mean absorption coefficient (Planck, Rosseland, hybrid) obtained as a function of the temperature for a number of frequency bands. In order to provide consistent data for comparison, the NECs for isothermal cylindrical plasma in argon at atmospheric pressure are presented first. Then, the results from the model of the free-burning arc are presented and discussed.

5.1. Isothermal Cylindrical Plasma

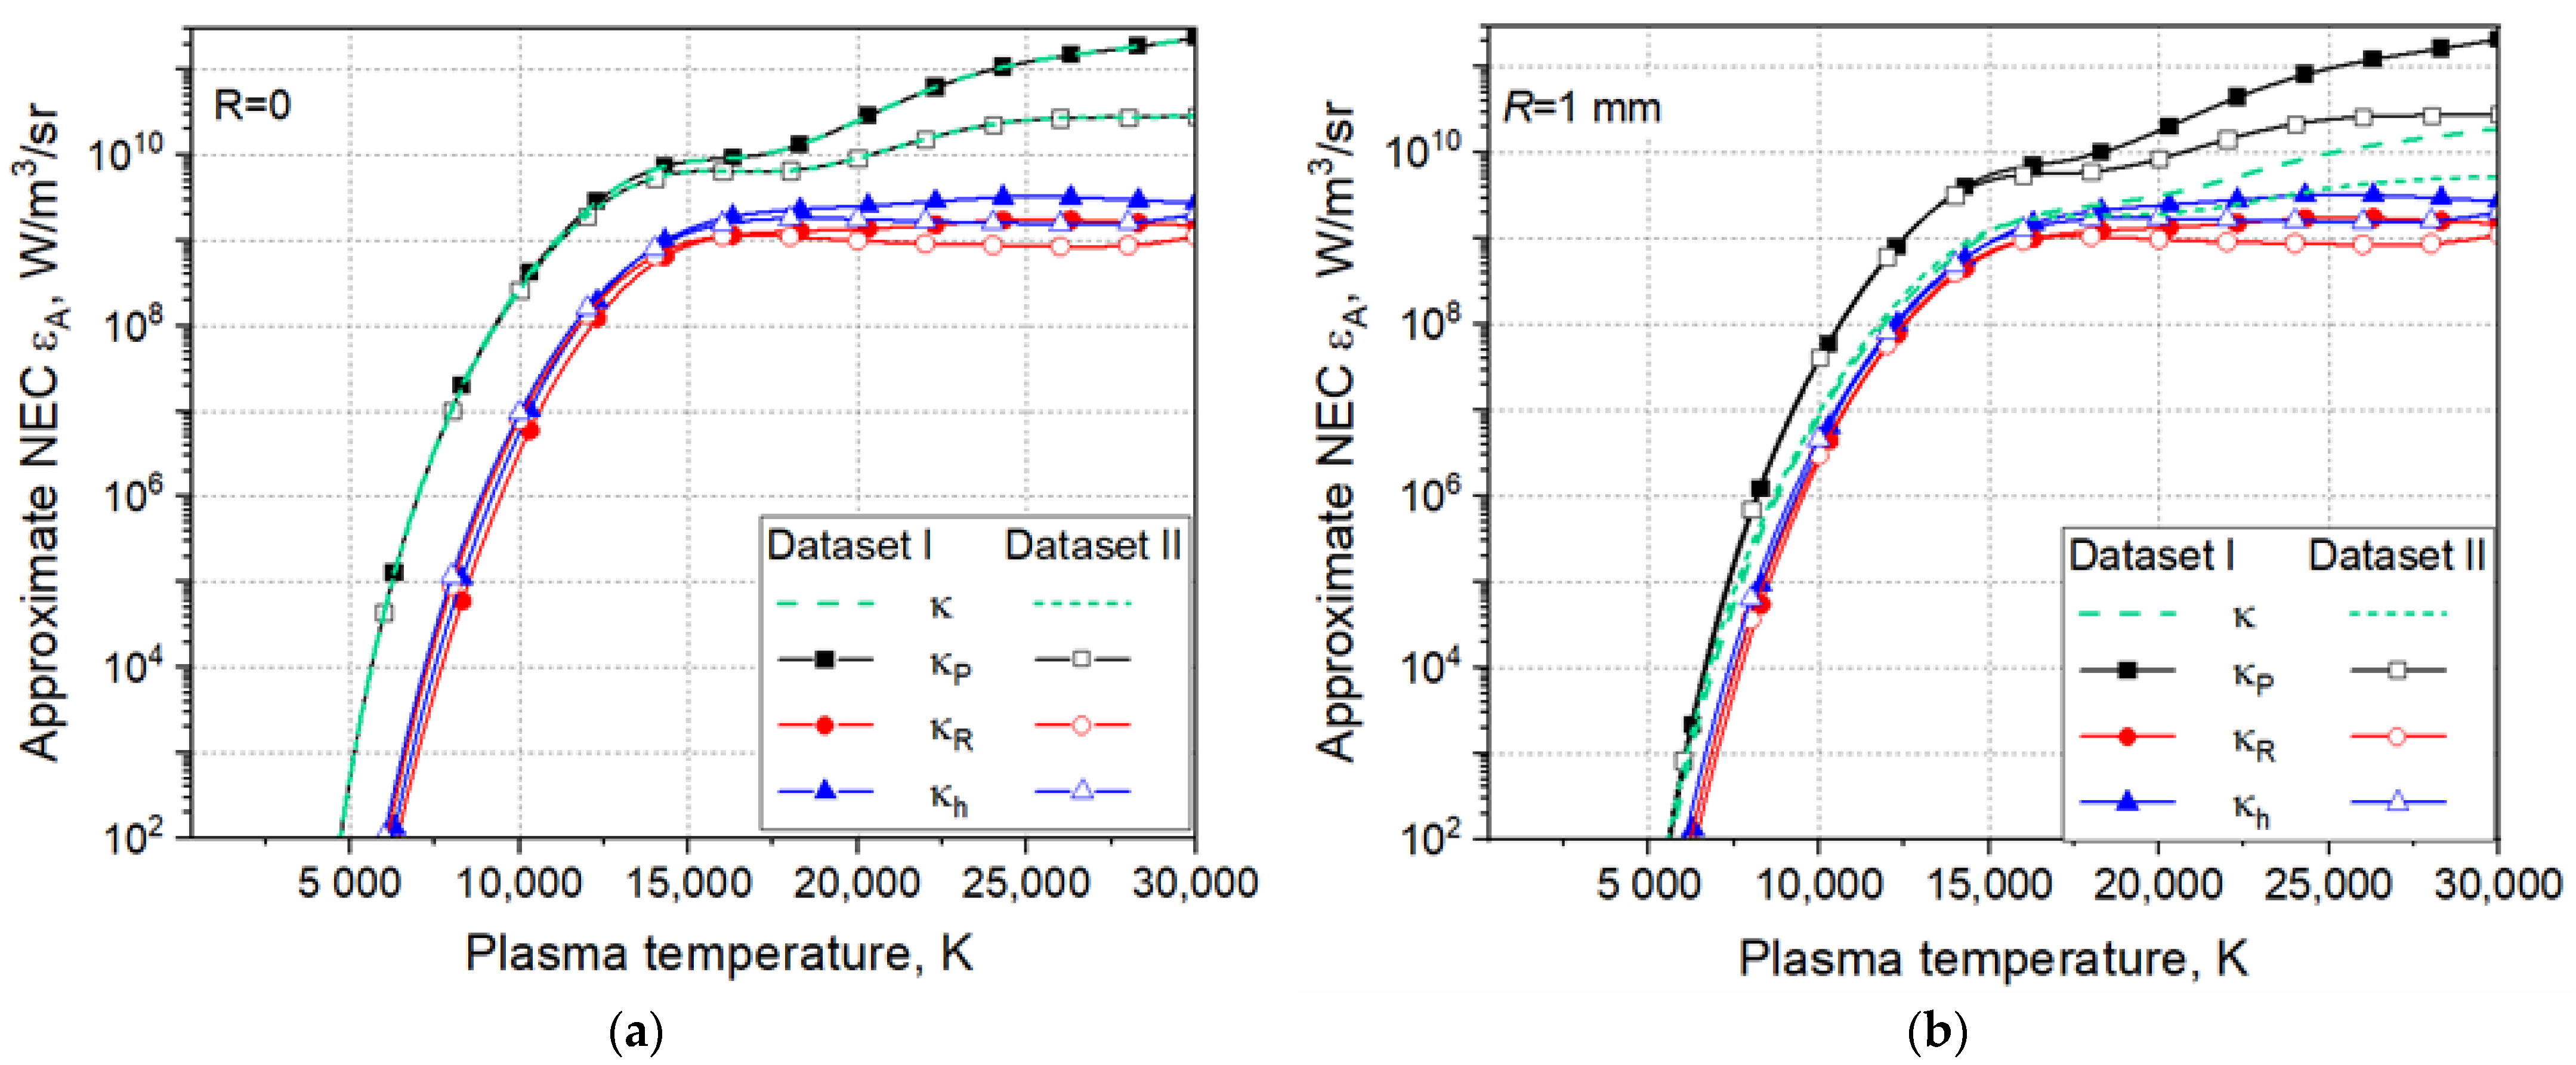
The net emission coefficient as considered above represents the radiative power per unit volume and unit solid angle that is irradiated from a cylindrical isothermal plasma of radius R into the surrounding area. Approximate NECs ( ε A ) are obtained using Equation (17) as derived in the form of Equation (A28) in Appendix B for plasma temperatures up to 30,000 K. The results are shown in Figure 5 for various plasma radii R, for the spectral emission coefficients κ in the line-by-line approach (referred to in what follows as the spectral emission coefficients κ ), and for mean absorption coefficients ( κ P , κ R , κ h ) for datasets (I, II). For the sake of a convenient reading, curves with solid symbols are assigned to dataset I, while open symbols are assigned to dataset II. NECs obtained with the Planck mean absorption coefficient κ P are presented as rectangles, while circles correspond to the Rosseland mean absorption coefficient κ R , and triangles denote NECs obtained with the hybrid mean absorption coefficient κ h . The approximate NECs obtained with the spectral emission coefficients κ are presented by the dashed line for dataset I and by the short dashed line for dataset II.
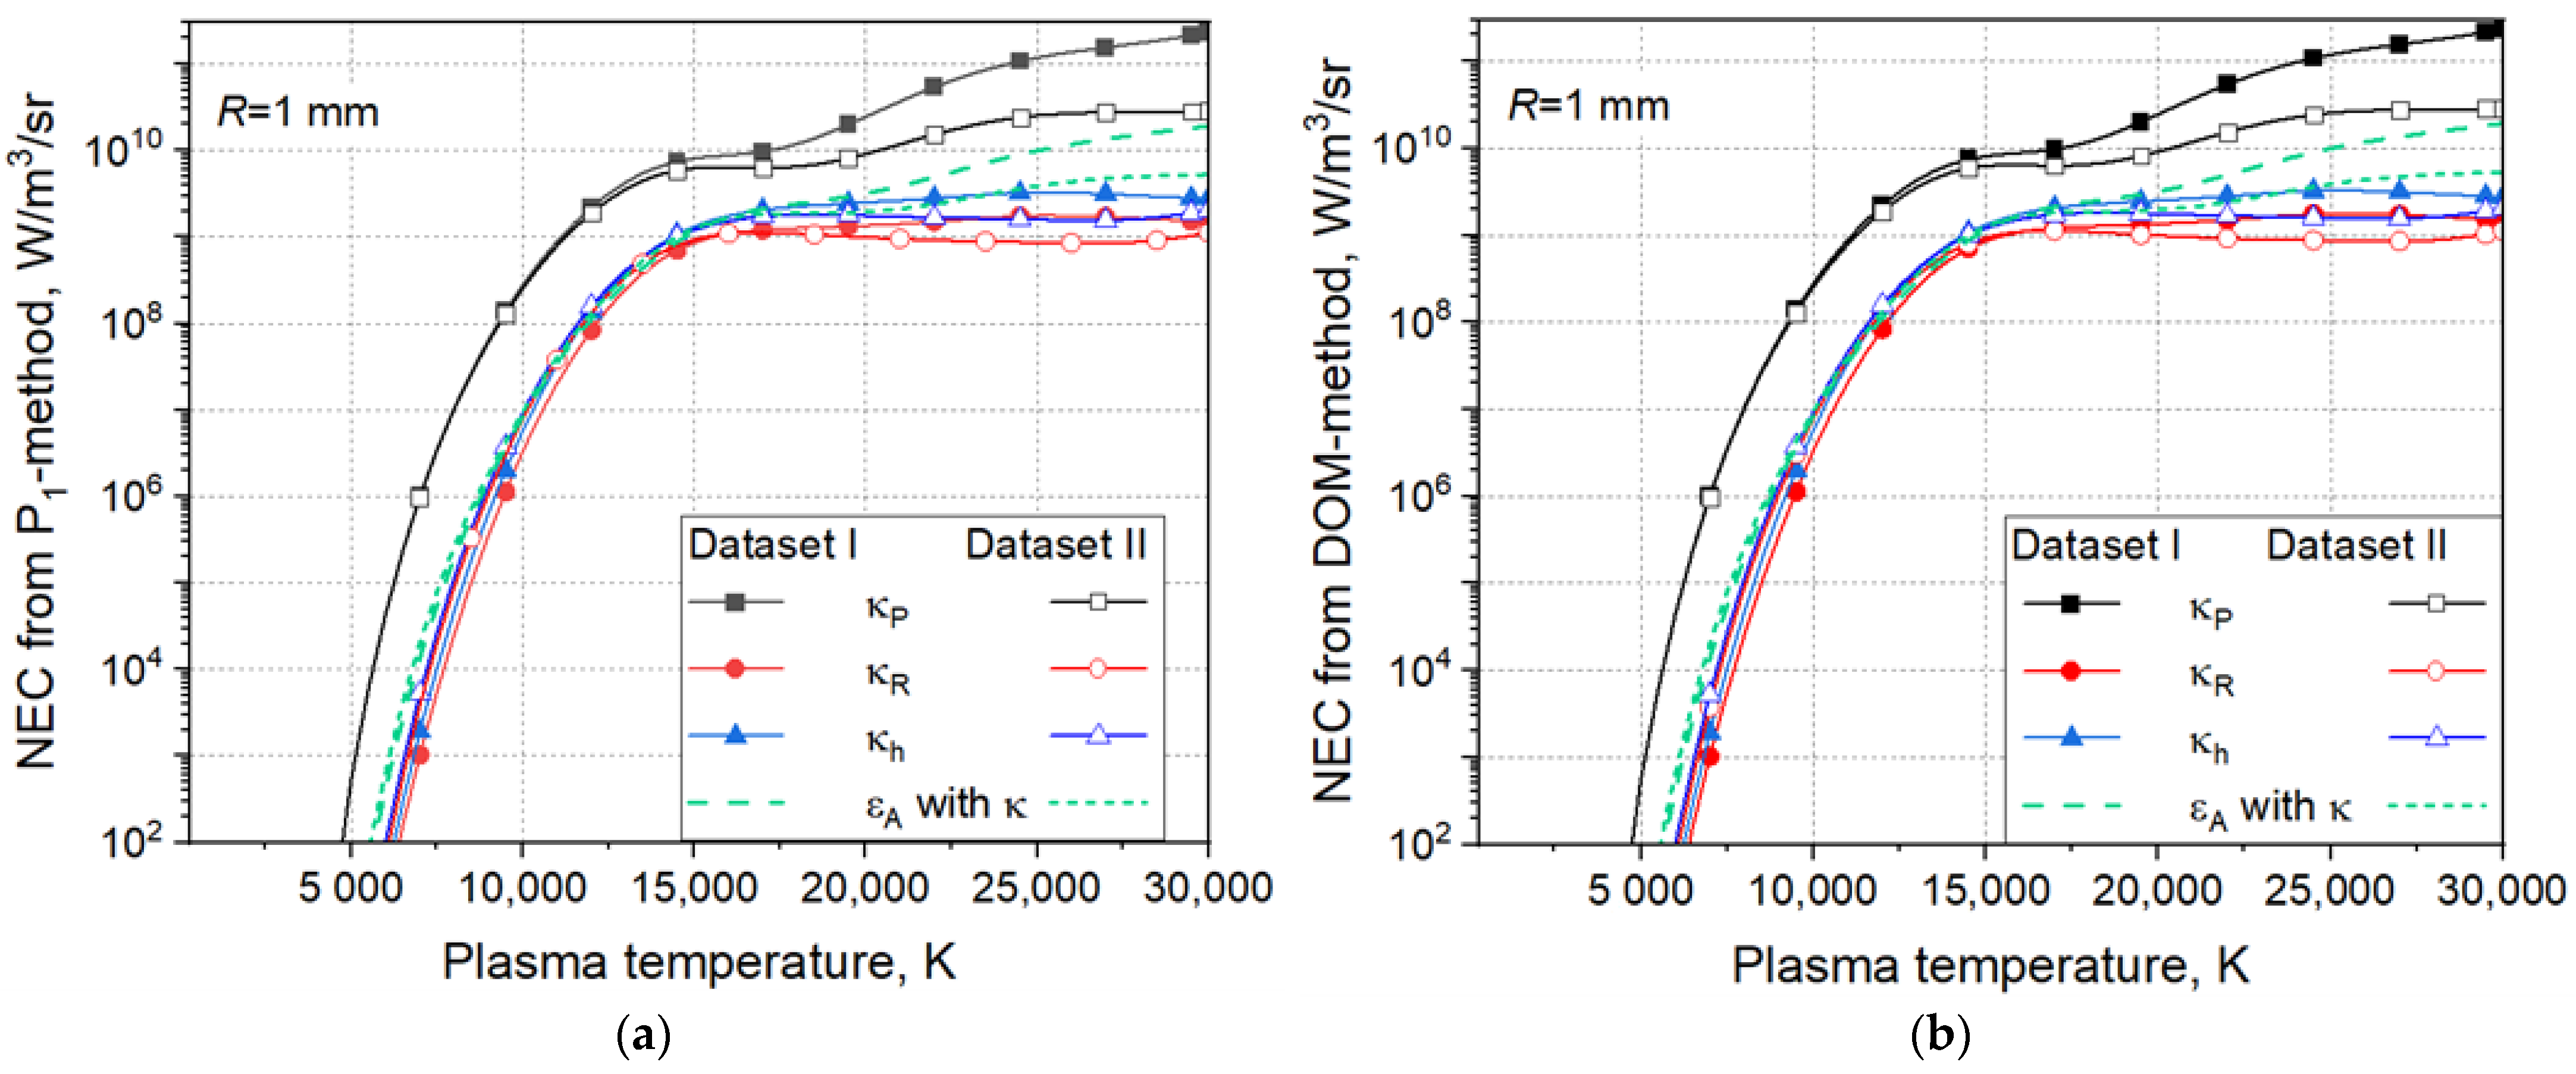
The dependence of the approximate NEC ε A on the radius R is related to the exponential term in Equation (18). For a given temperature, the spectral absorption coefficient is constant and the product κ ν R (the optical thickness) increases with the increase in R, which leads to the decrease in ε A . Results for ε A obtained with the spectral absorption coefficient κ as well as various mean absorption coefficients ( κ P , κ R , κ h ) and datasets are presented for R = 0 (Figure 5a) and R = 1 mm (Figure 5b). Although the general course of the NECs obtained with datasets I and II is similar, a more pronounced difference appears for temperatures beyond 15,000 K. The values of ε A obtained by the spectral absorption coefficients κ overlap with the NECs obtained by applying the Planck mean absorption coefficient κ P for R = 0 (Figure 5a). In contrast, the results with κ for R = 1 mm become close to the results with the hybrid mean absorption coefficient κ h for temperatures between 10,000 K and 20,000 K, particularly when using dataset II. For temperatures below 10,000 K, the results with κ continuously reconnect from the κ P curves to the κ h curves while remaining higher than the ε A with κ h (Figure 5b). The NECs obtained applying the Planck mean absorption coefficient κ P are larger than those applying the Rosseland mean value κ R since κ P > κ R (see Figure 3). The employment of the hybrid mean absorption coefficient κ h leads to values of ε A between those applying κ P and κ R , while the difference to the values of ε A with κ is reduced for temperatures beyond 10,000 K.
Figure 6a,b show the NECs ( ε N ) obtained from the evaluated divergence of the radiative heat flux according to Equation (6) in a 3D geometry of the isothermal cylindrical plasma (Figure 4). The ambient temperature is set at 300 K and the plasma temperatures are varied from 300 K up to 30,000 K. Results are obtained with mean absorption coefficients ( κ P , κ R , κ h ) and datasets (I, II) and employing the five-band approximation. The results for the approximate NECs ( ε A ) obtained with the spectral emission coefficients κ are shown as well for the sake of comparison. The cylindrical plasma has a radius R = 1 mm and a length L = 20 mm. The computational domain is resolved by means of about 20,000 elements. Twelve directions are used in the DOM to discretize the angular space. The results of the P1 method practically coincide with those of the DOM (see also Figure 7). They indicate the same behaviour with respect to the variation in the mean absorption coefficient and the dataset, like the results for the corresponding approximate NECs ( ε A ) in Figure 5b. However, for temperatures below 10,000 K, the P1- and DOM-NECs ( ε N ) with κ R and κ h are more close to the ε A obtained by the spectral absorption coefficients κ in comparison to Figure 5b. In the region between 10,000 K and 15,000 K, the ε N values from P1 (Figure 6a) and DOM (Figure 6b) with the multi-band hybrid absorption coefficient κ h practically overlap with the ε A obtained with the spectral emission coefficients κ . For temperatures beyond 15,000 K, the deviation of the P1 and DOM ε N results with κ h from the ε A values with κ and datasets I and II is similar to that in Figure 5b for the ε A values.
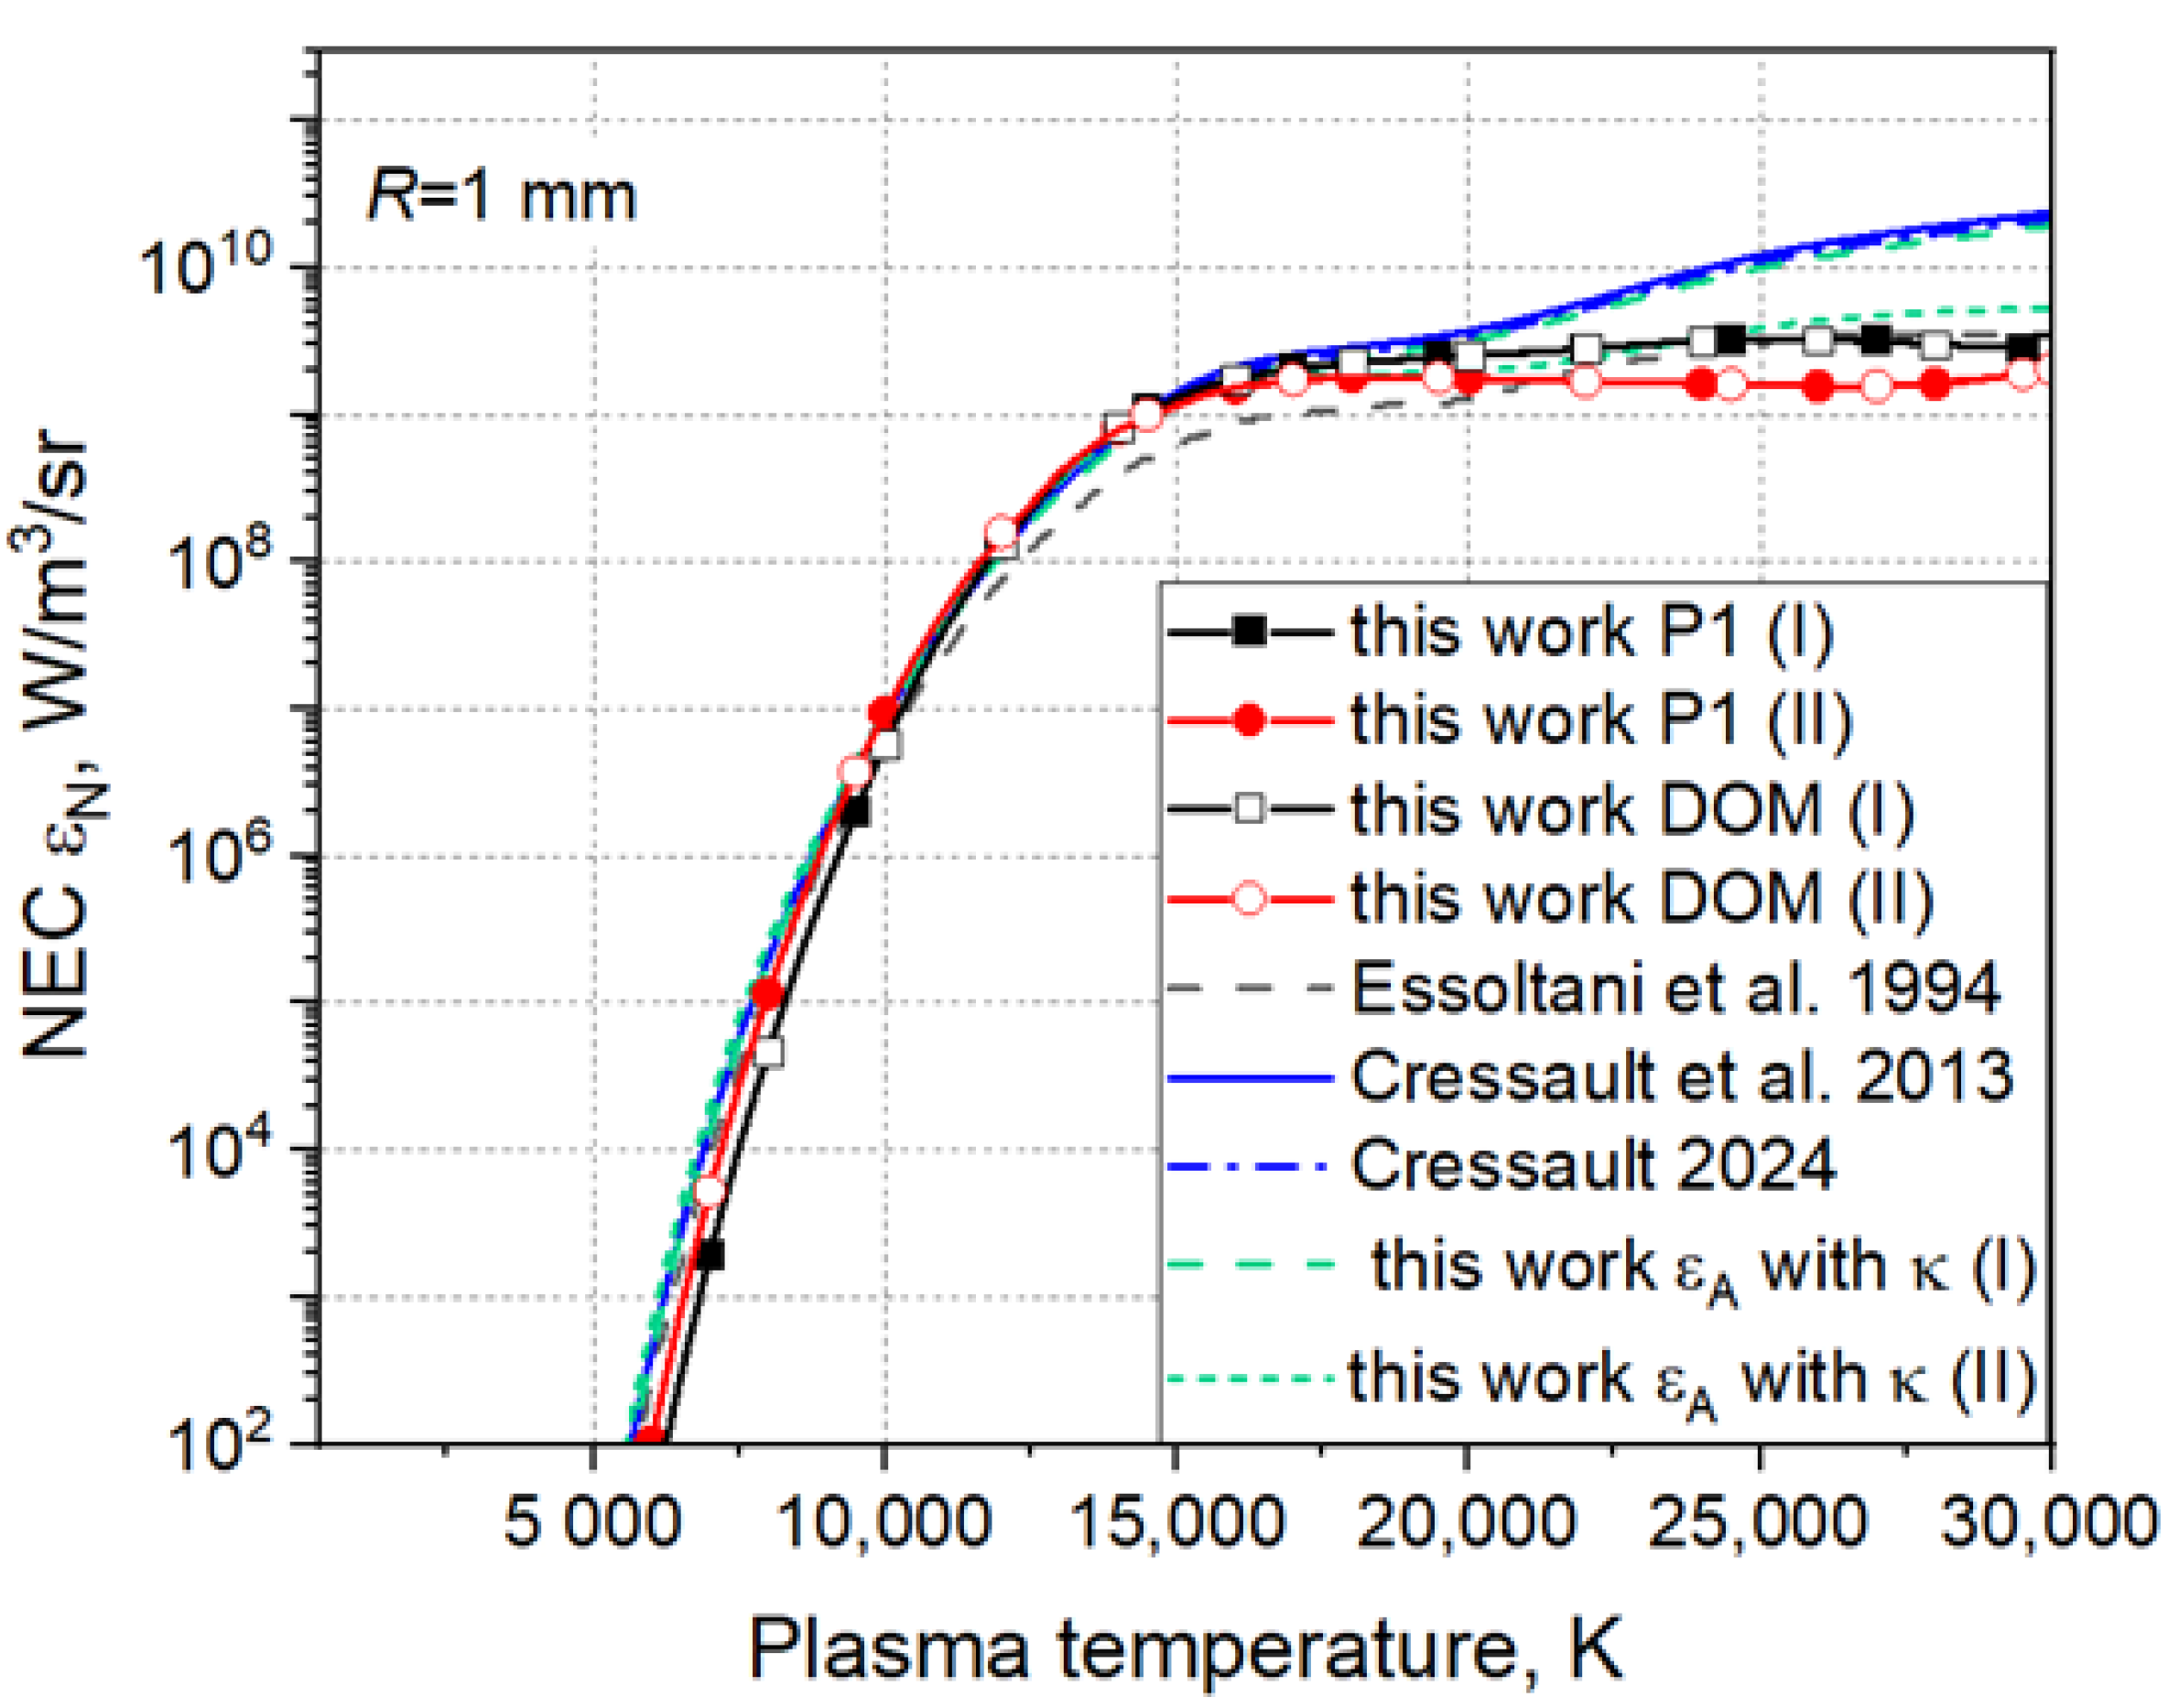
Figure 7 shows a comparison of the NEC ε N with some published data. The ε N values obtained with the P1 and DOM methods and ε A values with the spectral emission coefficients κ and the mean absorption coefficients κ h based on datasets I and II are shown. Notice that the NECs presented in references [37,41] apply, in general, parent data to dataset I. The P1 and DOM results with κ h coincide and are in a good agreement with those in the work [41] and the ε A values based on dataset II. Furthermore, they agree well with the NECs obtained in [37] for plasma temperatures between 10,000 K and 15,000 K, but deviate stronger for temperature beyond 20,000 K. The introduction of the hybrid mean absorption coefficient κ h will reduce the deviation between the present and previously published data to a certain degree (see Figure 7) and can be therefore seen as a good candidate for applications in arc plasma models. It is worth noting that the results obtained with the spectral emission coefficients κ for cylindrical geometry in this work, employing Equation (17), overlap with the results in [37], which are obtained for spherical geometry (Equation (18)). Results labelled as Cressault 2024 are obtained from updating data in [37].
The evaluation of the NECs ( ε N ) in this work provides consistent datasets for the comparison of the results of arc models, in which the radiative heat transfer is considered in terms of the NEC and the P1 and DOM approaches.

5.2. The Free-Burning Arc

The model of the free-burning arc in this work employs a tungsten–inert gas arrangement, and the 2D axisymmetric computational domain is presented in Figure 8. It includes a La-W cathode with a length of 20 mm, a radius of 2 mm, and a truncated 60° conical tip (a plateau radius of 0.2 mm). The anode is a water-cooled copper plate with a radius of 33 mm and a thickness of 7 mm. The distance between the cathode tip and the anode is 8 mm. The arc burns in atmospheric-pressure argon at a direct current of 100 A. The gas is fed with a flow rate of 12 slm through a nozzle with an inner radius of 8 mm.
Simulations are performed applying the NEC ε N (with R = 1 mm), P1, and the DOM. The data for the implementation of the radiative heat transfer (see Equation (1)) are based on five-band hybrid mean absorption coefficients κ h and datasets I and II. The boundary conditions for the RTE (2) are set according to, respectively, Equation (14) for the P1 method and Equation (16) for the DOM. Temperature-dependent values for the emissivity of tungsten [42] and copper [43] are considered. The open boundaries are considered with an emissivity of one (see Section 3.2 and Section 3.3).
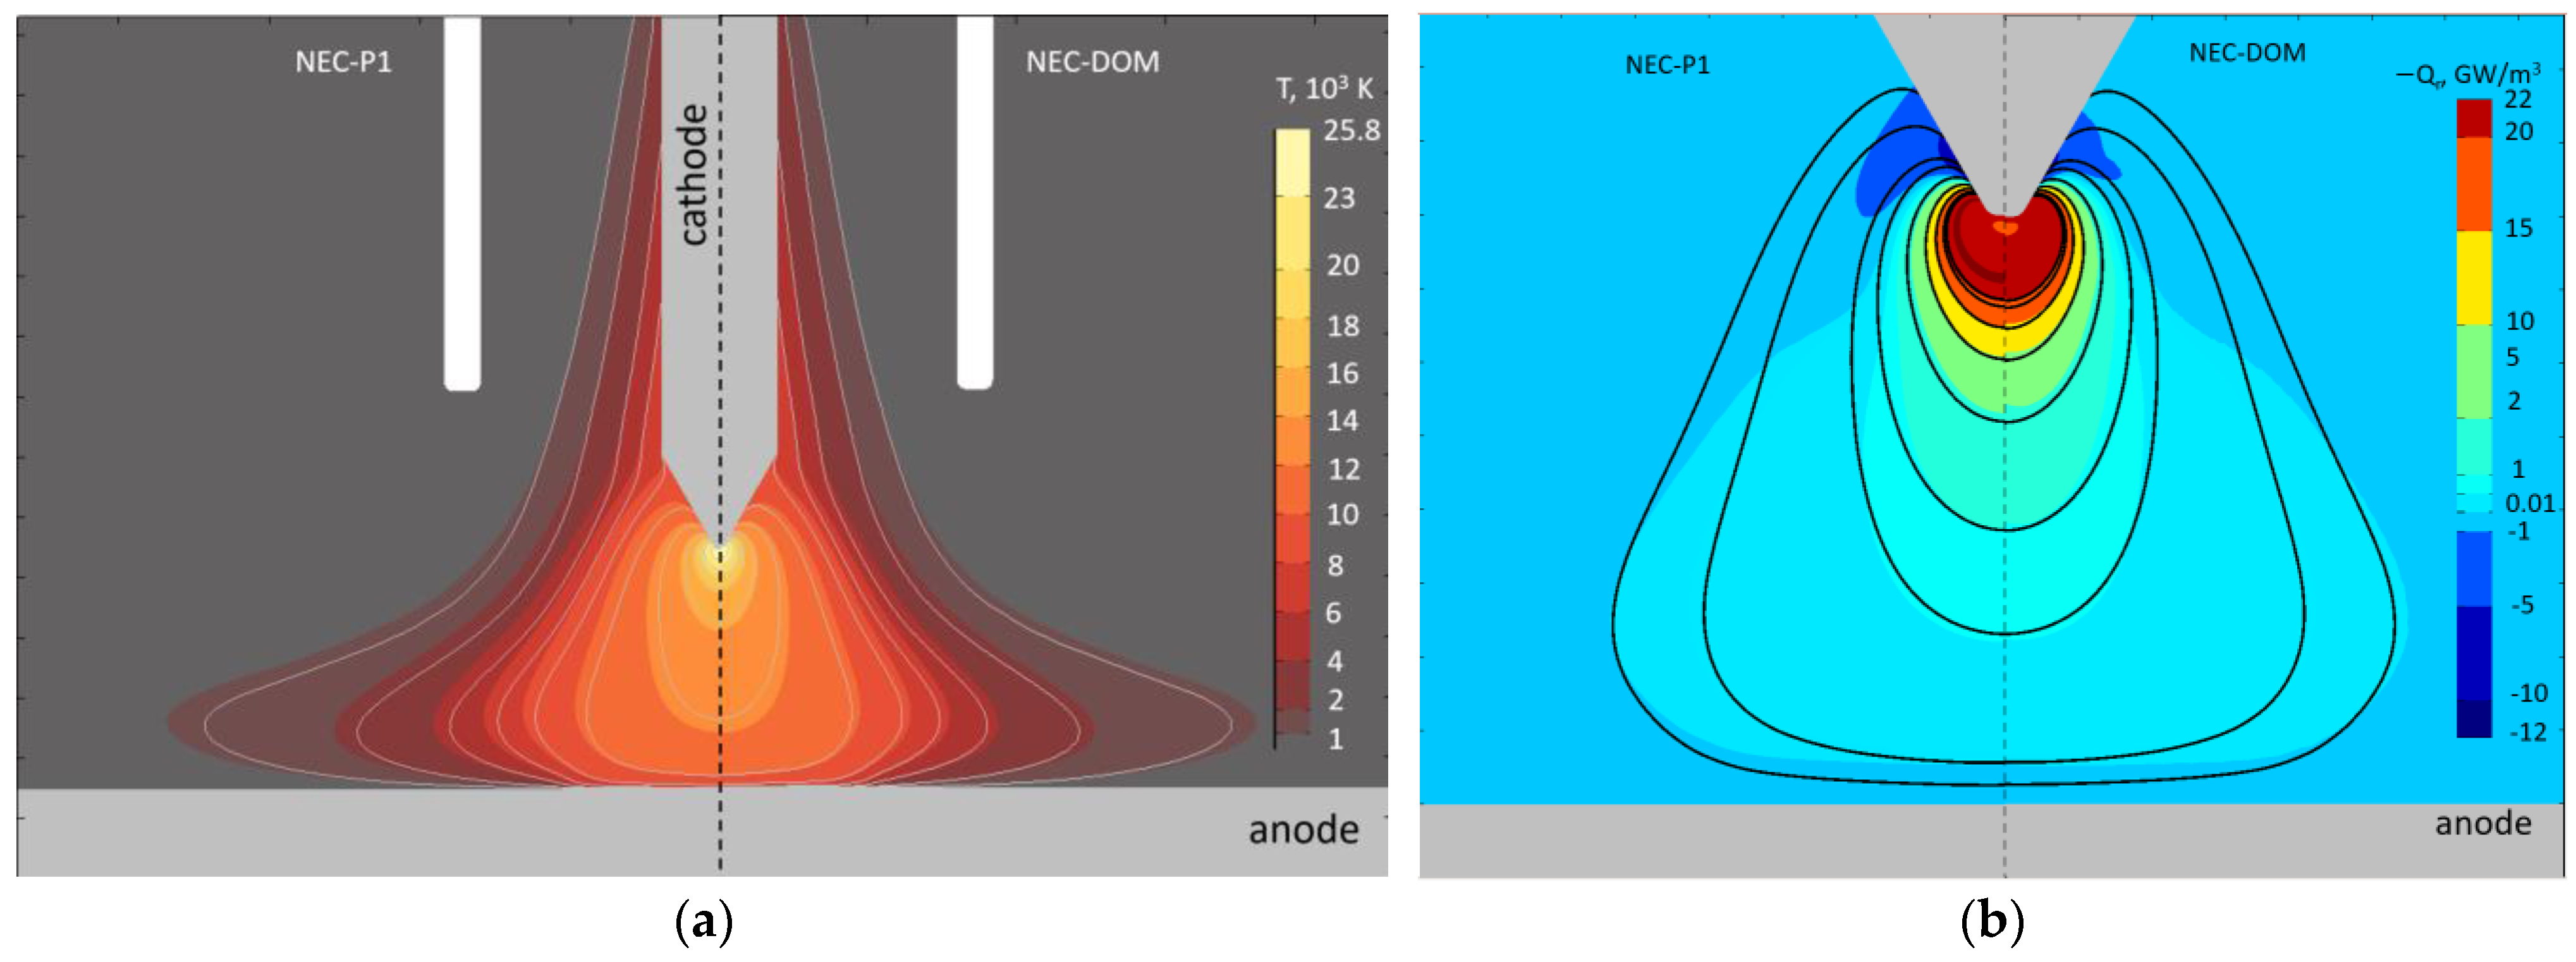
Figure 9 presents the distribution of the plasma temperature T (a) and the radiative term −Qr (b) obtained applying the NEC ε N , the P1 method, and the DOM with the hybrid absorption coefficient based on dataset I. The results from the model with the NEC are given, shown with the uniformly coloured contour lines on both the left- and right-hand side of each graph. The results from the models applying the P1 method and the DOM are shown as filled contours in a colour map to be compared side by side with each other and with the NEC results. The contour lines overlap with the edge between the filled contours when the results are in agreement. The NEC contours are taken at the same levels as the filled ones for the plasma temperature and the positive range of the −Qr-values in Figure 9b. Both the P1 method and the DOM predict negative −Qr values in the region surrounding the cathode tip and close to the anode. This means that the radiation is absorbed there in contrast to the predictions of the models applying the NECs. Note that the results from the P1 and the DOM only slightly differ from each other. In general, the contours of equal temperature predicted by the models with the NECs agree well in the hot arc core with those from the P1 method and the DOM, and deviations are observed in the arc periphery. The filled contours of equal temperature from the model with the P1 method are slightly broader than those with the DOM. The difference in the filled contours representing the −Qr-values from the models with the P1 method and the DOM is well pronounced near the cathode tip as shown in Figure 9b.
The distributions of the predicted plasma temperature and the radiative heat source along the arc axis obtained with the models applying NEC, P1, and DOM as well as different datasets for the absorption coefficient are shown in Figure 10. Note that the axial position of the end of the cathode tip is zero, while that of the anode surface is at 8 mm. Experimental values from optical emission spectroscopy (OES) [44] are shown as well in Figure 10a. Note that the values of the plasma temperature on the arc axis obtained with the various models and datasets are very close to each other. They agree relatively well with the experimental values. The distribution of the −Qr values on the arc axis in Figure 10b shows that the values from the model with the NEC based on dataset I are higher than the other results by a factor of up to two. This effect results from the higher NEC ε N for database I (see Figure 6a,b). Negative values of −Qr are obtained close to the anode surface.
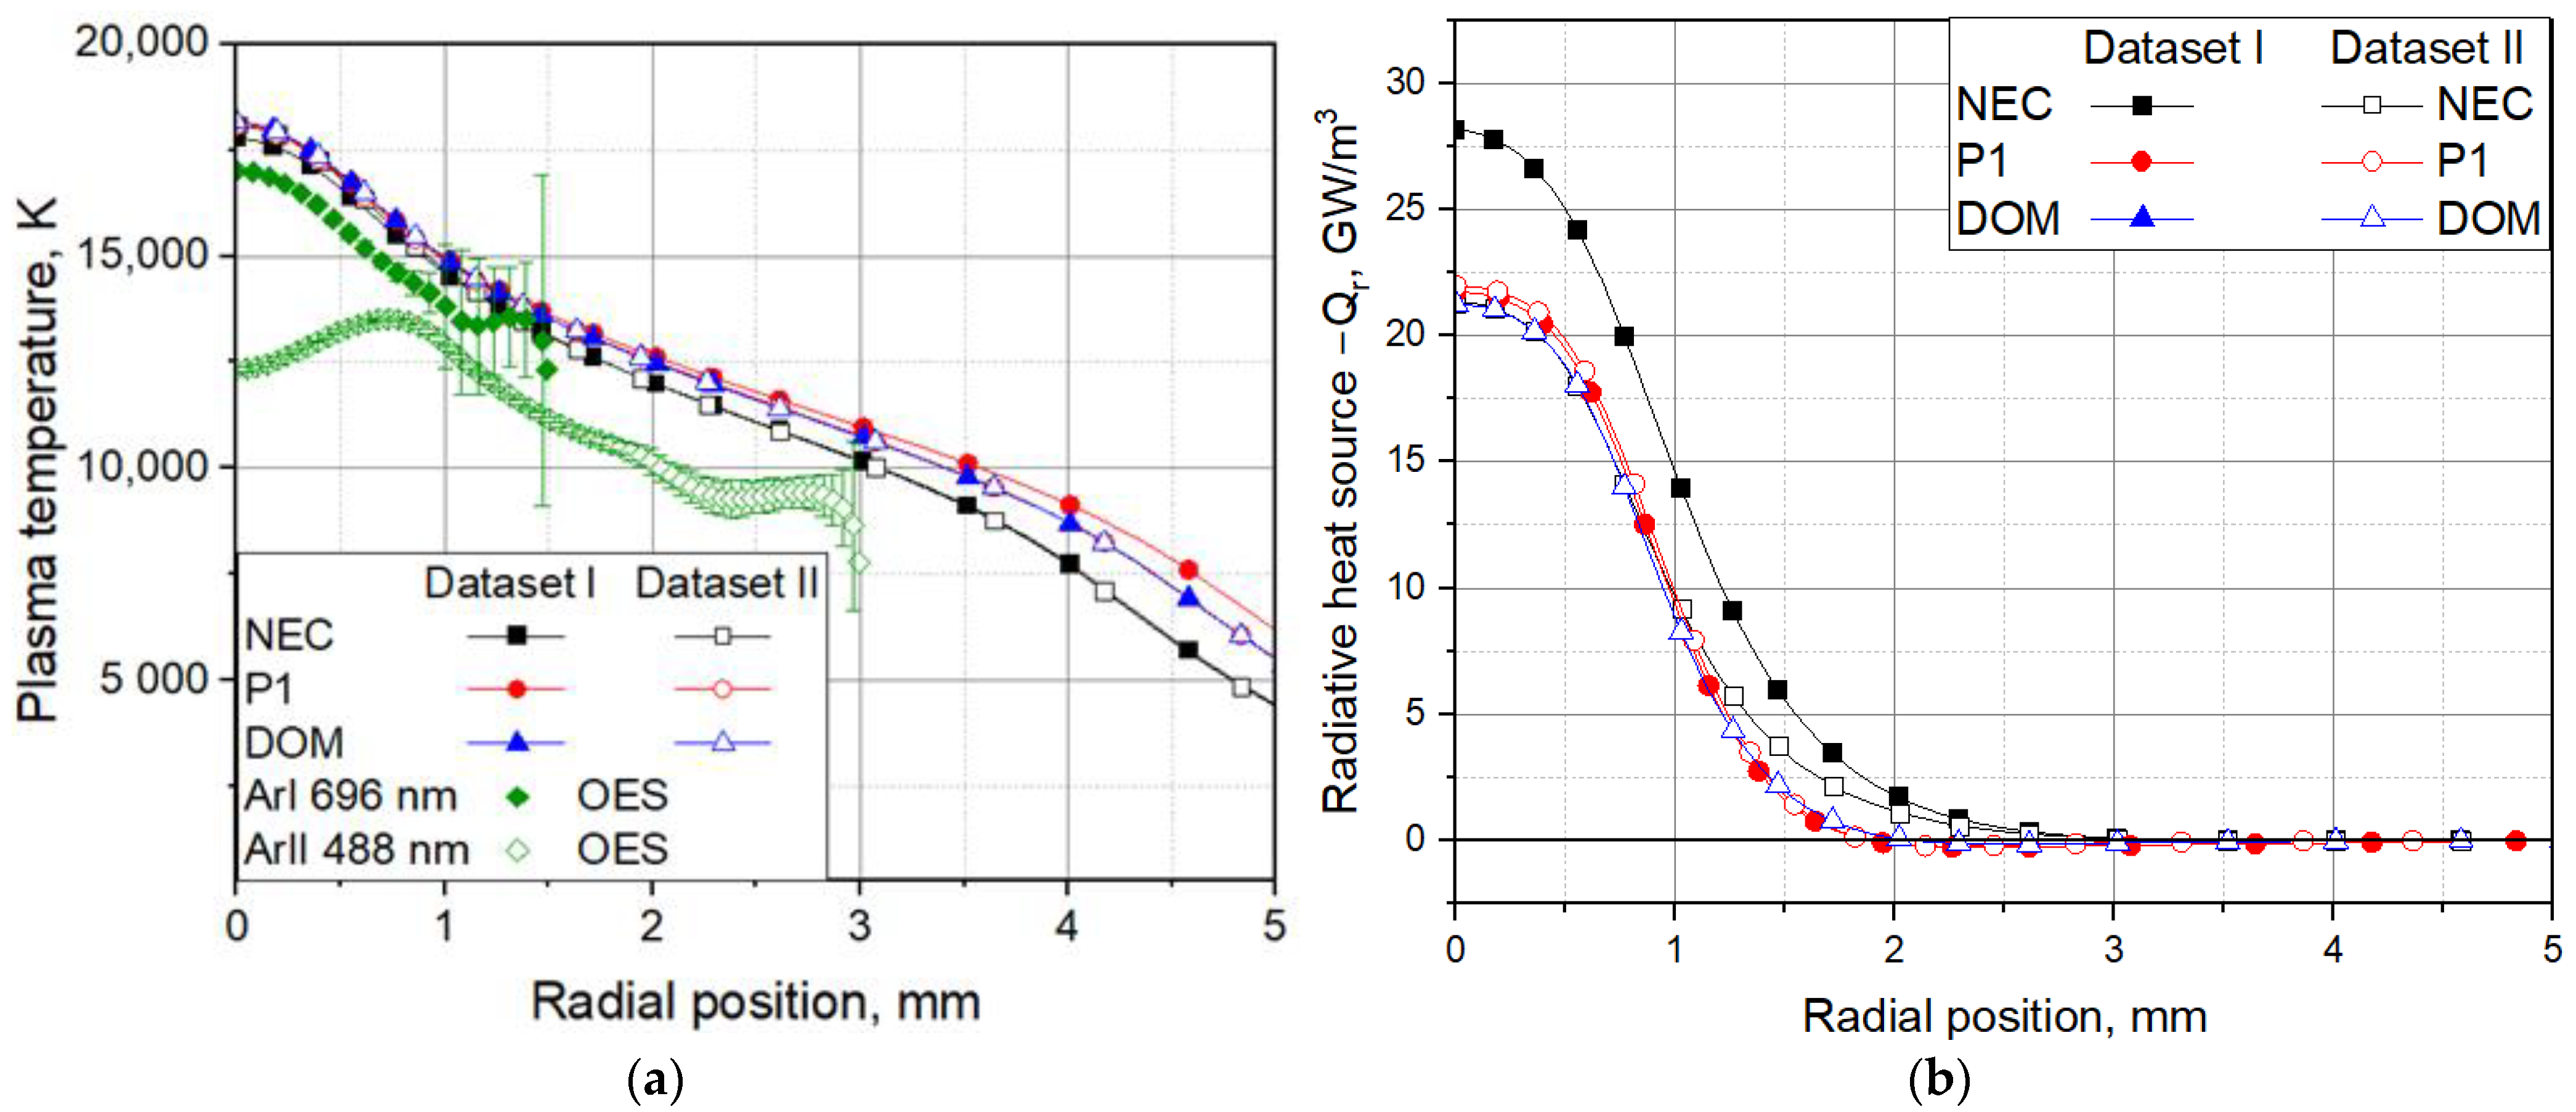
The distributions of the plasma temperature and the radiative heat source along a lineout that is perpendicular to the arc axis and is drawn in a distance of 1 mm from the cathode tip are shown in Figure 11. Similarly to Figure 10, the results are obtained with the models applying the NEC, P1, and the DOM as well as different datasets for the absorption coefficient. Experimental data for the plasma temperature are shown in Figure 11a. Note that the OES data for two spectral lines (Ar I at 696 nm and Ar II at 488 nm) are shown in order to show temperatures above 15,000 K close the arc axis (radial position zero). The results show that for radial positions close to the zero, the temperatures obtained by the models with the NEC, P1, and the DOM are very similar. Deviations are obtained toward the arc periphery as the model with the P1 method predicts the highest values. Note that the accuracy of the experimental values in the arc periphery is comparable with the deviations resulting from the applied methods of computation of the radiative heat transfer. The radial distribution of the −Qr values (Figure 11b) shows again the higher values from the model with the NEC based on dataset I and similar result for the P1 and DOM. Note that the model with the NEC and dataset II shows a well pronounced deviation from the P1 and DOM results for radial positions beyond 1 mm.
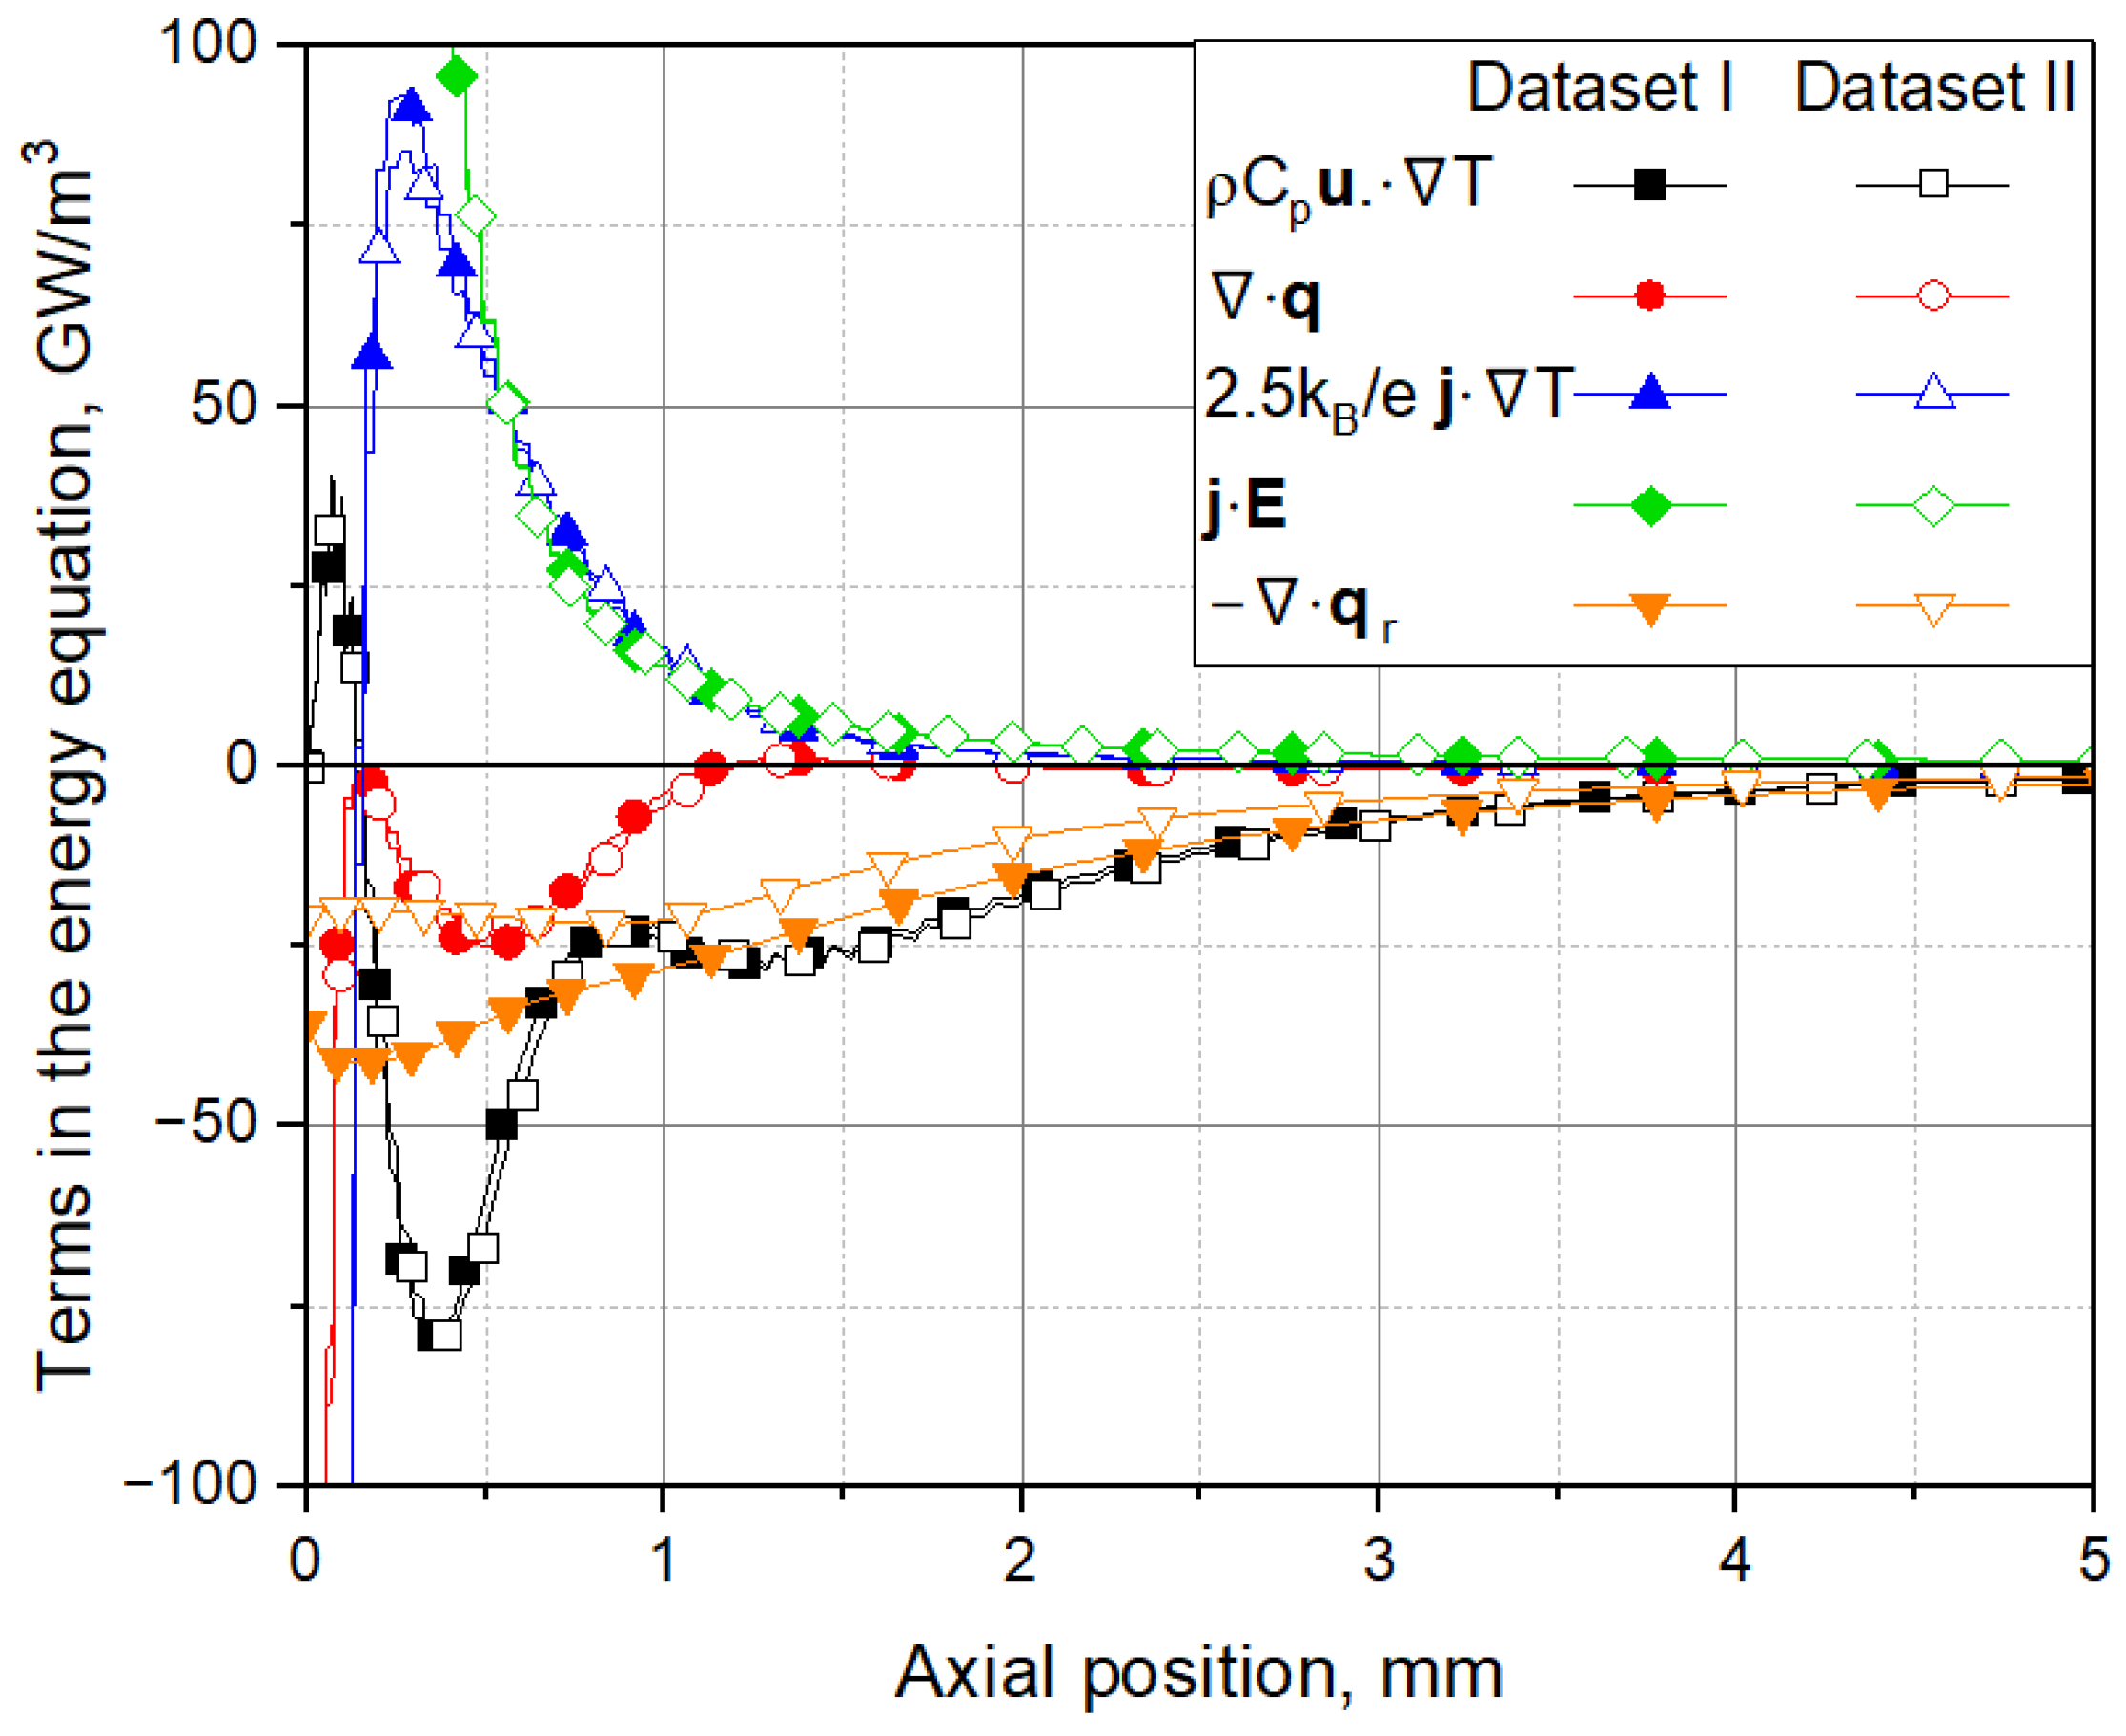
In order to explore the impact of the description of the radiative heat transfer on other terms in the equation of energy conservation (Equation (1)) than Qr, Figure 12 presents their axial distribution for the models with NECs and datasets I and II. The results show that the deviations in the terms other than Qr are small. It seems that the difference in the Qr terms is distributed in smaller parts among the other terms in Equation (1) so that its effect on the plasma temperature is of minor importance. The Joule heating ( j · E ) and the transport of electron enthalpy ( 2.5   k B j · T ) are combined in the term Q on the right-hand side of Equation (1). The Joule heating is the dominant term for axial positions below 0.5 mm from the cathode tip. The transport of electron enthalpy and the convective term ( ϱ C p u · T ) as well as the divergence of the conductive heat flux · q reach their maxima in the vicinity of the cathode. The radiative term Q r = · q r and the convective term dominate for distances from the cathode tip beyond 1 mm. The impact of the datasets is weaker in this region. Note that the terms accounting for viscous dissipation and pressure work in Equation (1) are of minor importance and are not shown in Figure 12.

6. Conclusions

The present work is focused on the account of the radiative heat transfer in arc plasma models. State-of-the-art LTE models of a free-burning arc applying NECs, the P1 method, and the DOM are employed to study the effects resulting from the various methods and absorption data. NECs are computed using analytical approximations and a three-dimensional solution of the equation of radiative transfer from an isothermal cylinder in the framework of the multi-band approximation for various definitions of the mean absorption coefficient (Planck, Rosseland, hybrid) with the P1 and the DOM. Self-consistent access to the radiative heat transfer is realized in the model of a free-burning arc. The main results are summarized as follows:
  • The approximate ( ε A ) and the numerically obtained ( ε N ) NECs depend on the datasets for the spectral absorption coefficient in particular for plasma temperatures beyond about 15,000 K. The approximate NEC ε A is lower than ε N , independently of the datasets that have been used.
  • The P1 method and the DOM for solving the equation of radiative transfer provide practically the same numerical NECs ( ε N ) .
  • The NECs depend on the method of averaging the spectral absorption coefficient within the spectral bands. NECs that are obtained applying the Planck mean values are larger than those applying the Rosseland mean values. A hybrid definition of the mean absorption coefficient provides intermediate values that are more close to the approximate spectral NEC.
  • The implementation of the NEC for a plasma radius of 1 mm, the P1 method, and the DOM with five spectral bands and a hybrid mean value of the spectral absorption coefficient into the model of the free-burning arc shows very similar values of the plasma temperature in the hot arc core and deviations in the range of 1000 K in the arc periphery. Such deviations can hardly be approved in experiments with optical emission spectroscopy.
  • The arc models with the P1 method and the DOM indicate negative radiative losses (absorption of radiation) near the electrodes in contrast to the models with NECs.
  • The predicted plasma temperature in the models with NECs is practically the same despite the discrepancy in the radiative loss term Qr for the two datasets for the spectral absorption coefficient, which are considered in the present study.

Author Contributions

Conceptualization M.B.; methodology, M.B., Y.C. and P.K.; software, M.B., Y.C. and P.K.; investigation, M.B.; resources, M.B., Y.C. and P.K.; writing—original draft preparation, M.B. All authors have read and agreed to the published version of the manuscript.

Funding

This research received no external funding.

Data Availability Statement

The data supporting the results of this study are openly available at https://www.inptdat.de/node/671, reference [45].

Conflicts of Interest

The authors declare no conflicts of interest.

Appendix A

In the P1 approximation, the radiation intensity is expressed in terms of a scalar function a ( r ) and a vector function b ( r ) [20]:
I r , s = a r + b ( r ) · s ,
Notice that the index “ν”, denoting the spectral quantities, is dropped for the sake of shortness. The four unknowns are related to physical quantities. For example, the incident radiation is
G r = Ω = 0 4 π I r , s d Ω = Ω = 0 4 π a r + b ( r ) · s d Ω = 4 π a r ,
since Ω = 0 4 π s d Ω = 0 2 π 0 π sin θ   cos φ sin θ   sin φ cos θ sin θ d θ d φ = ( 0,0 , 0 ) .
q r r = Ω = 0 4 π I r , s s d Ω = Ω = 0 4 π a r s d Ω + b ( r ) · Ω = 0 4 π s s d Ω = 4 π 3 b ( r ) ,
since Ω = 0 4 π s s d Ω = 4 π 3 δ ^ , with δ ^ being the unit tensor. Hence,
I r , s = 1 4 π G r + 3 4 π q r r · s
and s · I r , s is computed as
s · I r , s = · s I r , s = · s 1 4 π G r + 3 4 π q r r · s = · s 1 4 π G r + 3 q r r · s
Applying the RTE (2), one obtains
· s 1 4 π G r + 3 q r r · s = κ B I r , s = κ B 1 4 π G r 3 4 π q r r · s
and the integration over all solid angles yields
Ω = 0 4 π · s 1 4 π G r + 3 q r r · s d Ω = Ω = 0 4 π κ B 1 4 π G r 3 4 π q r r · s d Ω
· 1 4 π G r Ω = 0 4 π s d Ω + · 3 4 π q r r Ω = 0 4 π s s d Ω = Ω = 0 4 π κ B 1 4 π G r d Ω Ω = 0 4 π κ 3 4 π q r r · s d Ω
in which the first term on the left-hand side and the second term on the right-hand side are zero. Therefore, Equation (A8) becomes
· q r r = κ 4 π B G r
Multiplying the RTE by components of the directional vector s and integrating over all directions Ω yields, for the left-hand-side,
1 4 π · G r 0 4 π s s d Ω + 3 q r r · 0 4 π s s s d Ω = 1 4 π · G r 4 π 3 δ ^ = 1 3 G r
and for the right-hand-side,
κ B 0 4 π s d Ω 1 4 π G r 0 4 π s d Ω 3 4 π q r r · 0 4 π s s d Ω = κ 3 4 π q r r · 4 π 3 δ ^ = κ q r r
and finally, from Equations (A10) and (A11), one obtains
q r r = 1 3 κ G r
Equations (A9) and (A12) provide the governing set of one scalar and one vector equation for the quantities G r and q r r in the P1 approximation.

Appendix B

Lowke [19] computed approximate net emission coefficients at the centre of cylindrical isothermal plasma of various temperatures and radii (R) as
ε A ν = κ ν B ν J ν = κ ν B ν G 1 κ ν R ,
where J ν represents the average radiative intensity, i.e.,
J ν = 1 4 π 0 4 π I ν d Ω ,
and G 1 x = 0 π / 2 sin θ e x / sin θ d θ , with θ is being the polar angle and x = κ ν r . The incident radiation is
G ν = 0 4 π I ν d Ω = 4 π J ν = 4 π B ν 1 G 1 κ ν R .
The derivation is given for the sake of completeness in Appendix A.
In order to evaluate the net emission coefficient, G 1 x must be obtained.
One considers the distance s along the line of sight (XP). Point X corresponds to s = 0 and point P corresponds to s = L. By multiplying the RTE (2) by an integrating factor e s L κ η d η , where L is the plasma boundary, one obtains
d I ν d s e s L κ η d η = κ ν B ν e s L κ η d η κ ν I ν e s L κ η d η
d I ν d s e s L κ η d η = κ ν B ν e s L κ η d η d d s I ν e s L κ η d η + d I ν d s e s L κ η d η .
Here, the relation
d d s e s L κ η d η = d d s s L κ η d η e s L κ η d η = κ η e s L κ η d η
is used. Then,
d d s I ν e s L κ η d η = κ ν B ν e s L κ η d η
If the point where the radiation intensity is sought is placed in the coordinate origin, then replacing ρ = L − s applies to the intensity in point Z in direction – Ω :
I ν 0 , Ω = 0 L κ ν ( ρ ) B ν ( ρ ) e 0 ρ κ ρ d ρ d ρ
Therefore, the average radiation intensity can be expressed as
J ν = 1 4 π 0 4 π I ν d Ω
and
J ν = 1 2 π ρ = 0 ρ θ = 0 π / 2 φ = 0 2 π κ ν ( ρ ) B ν ( ρ ) e 0 ρ κ ρ d ρ sin θ d φ d θ d ρ
The integration is taken along straight lines from the centre of the arc ( ρ = 0 ) to the edge of the arc ( ρ = ρ ), and the direction of the lines is given by the spherical coordinates θ , φ . The integration along lines for θ π / 2 can be transformed to integration along lines perpendicular to the arc axis by using d ρ = d r / sin θ .
J ν = r = 0 R κ ν B ν d r θ = 0 π / 2 e 0 r κ / sin θ d r d θ .
Let us consider the integral θ = 0 π / 2 e 0 r κ / sin θ d r d θ . Then,
θ = 0 π / 2 e 0 r κ d r / sin θ d θ = θ = 0 π / 2 e x / sin θ d θ
where x = 0 r κ d r . This integral can be expressed through the recurrence relation
G n = θ = 0 π / 2 sin n θ e x / sin θ d θ
as G 0 . Notice that
G 1 = θ = 0 π / 2 sin θ e x / sin θ d θ
and
0 x G 0 x d x = θ = 0 π / 2 d θ 0 x sin θ e x / s i n θ d x s i n θ = θ = 0 π / 2 d θ 0 x / s i n θ sin θ d e x / s i n θ = θ = 0 π 2 d θ e x s i n θ sin θ 0 x s i n θ = θ = 0 π 2 d θ sin θ e x s i n θ 1 = θ = 0 π 2 sin θ d θ θ = 0 π 2 sin θ e x s i n θ d θ = cos θ 0 π 2 G 1 x = 1 G 1 x
Hence,
J ν = x = 0 κ ν R B ν d x θ = 0 π / 2 e 0 r κ / sin θ d r d θ = B ν 1 G 1 κ ν R
The approximate net emission coefficient is finally expressed as
ε A ν = κ ν B ν J ν = κ ν B ν G 1 κ ν R

References and Note

  1. Murphy, A.B.; Uhrlandt, D. Foundation of high-pressure thermal plasmas. Plasma Sources Sci. Technol. 2018, 27, 063001. [Google Scholar] [CrossRef]
  2. Fauchais, P.; Coudert, J.F.; Vardelle, M. (Eds.) Diagnostics in Thermal Plasma Plasma Diagnostics; Academic Press: Boston, MA, USA, 1989. [Google Scholar]
  3. Colombo, V.; Concetti, A.; Ghedini, E.; Dallavalle, S.; Vancini, M. High-speed imaging in plasma arc cutting: A review and new developments. Plasma Sources Sci. Technol. 2009, 18, 023001. [Google Scholar] [CrossRef]
  4. Bachmann, B.; Kozakov, R.; Gött, G.; Ekkert, K.; Bachmann, J.P.; Marques, J.L.; Schöpp, H.; Uhrlandt, D.; Schein, J. High-speed three-dimensional plasma temperature determination of axially symmetric free-burning arcs. J. Phys. D Appl. Phys. 2013, 46, 125203. [Google Scholar] [CrossRef]
  5. Murphy, A.B.; D Farmer, A.J.; Haidar, J. Laser-scattering measurement of temperature profiles of a free-burning arc. Appl. Phys. Lett. 1992, 60, 1304–1306. [Google Scholar] [CrossRef]
  6. Hsu, K.C.; Pfender, E. Modeling of a free-burning, high-intensity arc at elevated pressures. Plasma Chem. Plasma Process. 1984, 4, 219–234. [Google Scholar] [CrossRef]
  7. Simonin, O.; Delalondre, C.; Violett, P.-L. Modelling in thermal plasma and electric arc column. Pure Appl. Chem. 1992, 64, 623–628. [Google Scholar] [CrossRef]
  8. Wendelstorf, J.; Decker, I.; Wohlfart, H.; Simon, G. TIG and plasma arc modelling: A survey. In Mathematical Modelling of Weld Phenomena; Cerjak, H., Ed.; Institute of Materials: London, UK, 1997; Volume 650, pp. 848–897. [Google Scholar]
  9. Gleizes, A.; Gonzalez, J.-J.; Freton, P. Thermal plasma modelling. J. Phys. D Appl. Phys. 2005, 38, R153–R183. [Google Scholar] [CrossRef]
  10. Trelles, J.P.; Heberlein, J.V.R. Simulation results of arc behavior in different plasma spray torches. J. Therm. Spray Technol. 2006, 15, 563–569. [Google Scholar] [CrossRef]
  11. Shigeta, M. Turbulence modelling of thermal plasma flows. J. Phys. D Appl. Phys. 2016, 49, 493001. [Google Scholar] [CrossRef]
  12. Trelles, J.P.; Heberlein, J.V.R.; Pfender, E. Non-equilibrium modelling of arc plasma torches. J. Phys. D Appl. Phys. 2007, 40, 5937–5952. [Google Scholar] [CrossRef]
  13. Baeva, M.; Kozakov, R.; Gorchakov, S.; Uhrlandt, D. Two-temperature chemically non-equilibrium modelling of transferred arcs. Plasma Sources Sci. Technol. 2012, 21, 055027. [Google Scholar] [CrossRef]
  14. Baeva, M.; Benilov, M.S.; Almeida, N.A.; Uhrlandt, D. Novel non-equilibrium modelling of a DC electric arc in argon. J. Phys. D Appl. Phys. 2016, 49, 245205. [Google Scholar] [CrossRef]
  15. Choquet, I. Gas tungsten arc models including the physics of the cathode layer: Remaining issues. Weld. World 2018, 62, 177–196. [Google Scholar] [CrossRef]
  16. Benilov, M.S. Modeling the physics of interaction of high-pressure arcs with their electrodes: Advances and challenges. J. Phys. D: Appl. Phys. 2020, 53, 013002. [Google Scholar] [CrossRef]
  17. Nordborg, H.; Iordanis, A.A. Self-consistent radiation based modelling of electric arcs: I. Efficient radiation approximations. J. Phys. D Appl. Phys. 2008, 41, 135205. [Google Scholar] [CrossRef]
  18. Tanaka, Y.; Fujino, T.; Iwao, T. Review of thermal plasma simulation technique. IEEJ Trans. 2019, 14, 1582–1594. [Google Scholar] [CrossRef]
  19. Lowke, J.J. Predictions of arc temperature profiles using approximate emission coefficients for radiation losses. J. Quant. Spectrosc. Radiat. Transf. 1974, 14, 111–122. [Google Scholar] [CrossRef]
  20. Modest, M.F. Radiative Heat Transfer, 3rd ed.; Elsevier Inc.: Amsterdam, The Netherlands, 2013. [Google Scholar]
  21. Iordanis, A.A.; Franck, C.M. Self-consistent radiation based modelling of electric arcs: II. Application to gas circuit breakrs. J. Phys. D Appl. Phys. 2008, 41, 135206. [Google Scholar] [CrossRef]
  22. Mohsni, C.; Baeva, M.; Franke, S.; Gortschakow, S.; Araoud, Z.; Charrada, K. Effect of a bidirectional coupling of a LTE arc column to a refractory cathode in atmospheric pressure argon. Phys. Plasmas 2020, 27, 073514. [Google Scholar] [CrossRef]
  23. Baeva, M.; Zhu, T.; Kewitz, T.; Testrich, H.; Foest, R. Self-consistent cathode-plasma coupling and role of the fluid flow approach in torch modelling. J. Therm. Spray. Technol. 2021, 30, 1737–1750. [Google Scholar] [CrossRef]
  24. Benilov, M.S. Theory and Modelling of Arc Cathodes. Plasma Sources Sci. Technol. 2002, 11, A49–A54. [Google Scholar] [CrossRef]
  25. Pateyron, B.; Delluc, G.; Calve, N. T&T Winner-Software for Thermo-Chemistry, Univ. Limoges, 2015, 87051 Limoges Cedes, France.
  26. Murphy, A.B.; Arundel, C.J. Transport Coefficients of Argon, Nitrogen, Oxygen, Argon-Nitrogen, and Argon-Oxygen Plasmas. Plasma Chem. Plasma Process. 1994, 14, 451–490. [Google Scholar] [CrossRef]
  27. Smith, D.; Altovsky, I.V.; Barabash, V.R.; Beeston, J. ITER Blanker, Shield and Material Database; ITER Documentation Series; IAEA: Vienna, Austria, 1991; Volume 29. [Google Scholar]
  28. Touloukian, Y.S. Thermal Conductivity: Metallic Elements and Alloys, TPRS Series, vol. 1 IFI/Plenum; IFI/Plenum: New York, NY, USA, 1970. [Google Scholar]
  29. Tencer, J.; Howell, J.R. Coupling radiative heat transfer in participating media with other heat transfer modes. J Braz. Soc. Mech. Sci. Eng. 2016, 38, 1473–1487. [Google Scholar] [CrossRef]
  30. Bartlova, M.; Bogatyreva, N.; Aubrecht, V. Radiation heat transfer in thermal argon plasma with iron vapours. Plasma Phys. Technol. 2014, 1, 8–10. [Google Scholar]
  31. Kloc, P.; Aubrecht, V.; Bartlova, M.; Fuchs, R. Comparison of mean absorption methods for radiation transfer models in air plasma at various pressures. Plasma Chem Plasma Process 2023, 43, 429–447. [Google Scholar] [CrossRef]
  32. Kozu, S.; Fujino, T.; Yoshino, T.; Mori, T. Radiative transfer calculation of CO2 thermal plasma using a hybrid Plack-Rosseland mean absorption coefficient. In Proceedings of the 22nd International Conference on Gas Discharges and Their Applications, Novi Sad, Serbia, 2–7 September 2018; pp. 127–130. [Google Scholar]
  33. Church, C.H.; Schlecht, R.G.; Liberman, I.; Swanson, B.W. Studies of highly radiative plasmas using the wall-stabilized pulsed arc discharge. AIAA J. 1966, 4, 1947–1953. [Google Scholar] [CrossRef]
  34. Bogatyreva, N.; Bartlova, M.; Aubrecht, V. Absorption properties of argon arc plasma. In Proceedings of the 43rd EPS Conference on Plasma Physics, Leuven, Belgum, 4–8 July 2016; pp. 481–484. [Google Scholar]
  35. Griem, H.R. Plasma Spectroscopy; McGraw-Hill: New York, NY, USA, 1964. [Google Scholar]
  36. Liebermann, R.W.; Lowke, J.J. Radiation emission coefficients for sulfur hexafluoride arc plasmas. J. Quant. Spectrosc. Radiat. Transf. 1976, 16, 253–264. [Google Scholar] [CrossRef]
  37. Cressault, Y.; Gleizes, A. Thermal plasma properties for Ar–Al, Ar–Fe and Ar–Cu mixtures used in welding plasmas processes: I. Net emission coefficients at atmospheric pressure, J. Phys. D Appl. Phys. 2013, 46, 415206. [Google Scholar] [CrossRef]
  38. Cabannes, F.; Chapelle, J. Spectroscopic Plasma Diagnostic Reactions under Plasma Conditions; Wiley-Interscience: New York, NY, USA, 1971; Volume 1. [Google Scholar]
  39. Kramida, A.; Ralchenko, Y.; Reader, J.; NIST ASD Team. NIST Atomic Spectra Database (ver. 5.10); National Institute of Standards and Technology: Gaithersburg, MD, USA, 2022. Available online: https://physics.nist.gov/asd (accessed on 15 November 2022). [CrossRef]
  40. Whitting, E.E. An empirical approximation to the Voigt profile. J. Quant. Spectrosc. Radiat. Transf. 1968, 8, 1379–1384. [Google Scholar] [CrossRef]
  41. Essoltani, A.; Proulx, P.; Boulos, M.I.; Gleizes, A. Volumetric emission of argon plasmas in the presence of vapors of Fe, Si, and AI. Plasma Chem. Plasma Process. 1994, 14, 437–450. [Google Scholar] [CrossRef]
  42. Lassner, E.; Schubert, W.D. Tungsten: Properties, Chemistry, Technology of the Element, Alloys, and Chemical Compounds; Springer: New York, NY, USA, 1999. [Google Scholar] [CrossRef]
  43. Incorpera, F.P.; DeWitt, D.P.; Bergman, T.L.; Lavine, A.S. Fundamentals of Heat and Mass Transfer, 6th ed.; John Wiley: New York, NY, USA, 2006. [Google Scholar]
  44. Baeva, M.; Gorchakov, S.; Kozakov, R.; Uhrlandt, D.; Schoenemann, T. Non-equilibrium modelling of the electrical characteristics of a free-burning arc. High Volt. Eng. 2013, 39, 2159–2165. [Google Scholar] [CrossRef]
  45. Baeva, M.; Cressault, Y.; Kloc, P. Comparative studies on the radiative heat transfer in a self-consistent model of a free-burning arc in argon—Dataset. Preprints 2024, 2024060853. [Google Scholar] [CrossRef]
Figure 1. Schematics of the arc plasma model.
Plasma 07 00033 g001
Figure 2. Graphical representation of the directional irradiation.
Plasma 07 00033 g002
Figure 3. Spectral absorption coefficient ( κ ν ) of Ar plasma at a pressure of 1 bar and a temperature of 20,000 K and the mean absorption coefficients κ R , κ P , and κ h .
Plasma 07 00033 g003
Figure 4. The geometry of a cylindrical arc plasma.
Plasma 07 00033 g004
Figure 5. Approximate net emission coefficient ε A obtained for the spectral absorption coefficient κ and for the mean absorption coefficients κ P , κ R , κ h ; datasets I and II; and for plasma radii: (a) R = 0; (b) R = 1 mm.
Plasma 07 00033 g005
Figure 6. Net emission coefficient ε N obtained by (a) the P1 and (b) DOM methods with a 5-band spectral absorption coefficient for a radius of 1 mm, mean absorption coefficients, and datasets I and II. The approximate net emission coefficients ε A obtained with the spectral absorption coefficient κ are shown for the sake of comparisons.
Plasma 07 00033 g006
Figure 7. NECs obtained in the present work by means of the P1 and the DOM methods for a plasma radius R = 1 mm and datasets I and II in comparison with published data by Essoltani et al. [41], Cressault et al. [37], and the approximate net emission coefficients ε A in this work.
Plasma 07 00033 g007
Figure 8. The arrangement of the free-burning arc with the 2D computational domain.
Plasma 07 00033 g008
Figure 9. Contours of equal plasma temperature T (a) and the radiative source −Qr (b) from the models of the free-burning arc with the NEC ε N and the P1 method (a) and the NEC ε N and the DOM. The hybrid absorption coefficient is based on dataset I.
Plasma 07 00033 g009
Figure 10. The plasma temperature T (a) and the radiative source −Qr (b) along the axis from the models of the free-burning arc with the NEC ε N (squares), the P1 method (circles), and the DOM (triangles). The hybrid absorption coefficient is based on datasets I (solid symbols) and II (open symbols). Experimental data from OES of the spectral line ArII (solid diamonds) are presented as well.
Plasma 07 00033 g010
Figure 11. The plasma temperature T (a) and the radiative source −Qr (b) along a line at a distance of 1 mm from the cathode tip and perpendicular to the axis. The results are from the models of the free-burning arc with the NEC ε N (squares), the P1 method (circles), and the DOM (triangles). The hybrid absorption coefficient is based on datasets I (solid symbols) and II (open symbols). Experimental data from OES of spectral lines Ar I (open diamonds) and Ar II (solid diamonds) are presented as well.
Plasma 07 00033 g011
Figure 12. Axial distribution of terms in the equation of energy conservation from simulations with NEC ε N and datasets I and II.
Plasma 07 00033 g012
Disclaimer/Publisher’s Note: The statements, opinions and data contained in all publications are solely those of the individual author(s) and contributor(s) and not of MDPI and/or the editor(s). MDPI and/or the editor(s) disclaim responsibility for any injury to people or property resulting from any ideas, methods, instructions or products referred to in the content.