Abstract
We study the effect of the rotational transform profile on the L–H confinement transitions in the neutral beam-heated plasmas in the TJ-II stellarator. The rotational transform profile in the vacuum is determined by the external coil currents but is modified by the plasma current, . We find that L–H confinement transitions systematically occur when the configuration and plasma current are such that a low-order rational is placed in the plasma edge region, with a distribution centered around . It is suggested that magnetohydrodynamic turbulence plays an important role in triggering the L–H transitions at TJ-II.
1. Introduction
Spontaneous transitions from a low (L) to a high (H) confinement state are routinely observed in the majority of toroidal magnetic confinement devices. The conditions for accessing the H-mode regime have been studied extensively, and it is clear that the injected heating power, mean electron density, plasma species, wall conditions, magnetic field strength, magnetic configuration, and magnetic perturbations all play a role [1,2,3], making this into a complex phenomenon.
The advantage of stellarators for studying the impact of the magnetic configuration on the L–H transition is that the configuration is mainly determined by the externally imposed magnetic field [4]. Low-shear stellarators, in addition, offer an ideal testing ground to study the importance of the rotational transform (the inverse safety factor) and low-order rationals [5]: due to the low magnetic shear, the main low-order rationals are separated radially and their individual effect on confinement can be studied, which is nearly impossible in high-shear devices like tokamaks. Indeed, with the low-shear Wendelstein 7-AS device, a systematic dependence of the confinement on the rotational transform was observed, as well as the existence of narrow rotational transform windows for H-mode access [6].
Confinement transitions in high-density plasmas, or L–H transitions, have been studied intensely at the low-shear stellarator TJ-II in the past. These spontaneous confinement transitions often occur in plasmas heated using neutral beam injection (NBI) [7] and should be distinguished from the low-density (electron to ion root) transitions typical of electron cyclotron-heated (ECRH) plasmas [8,9]. The L–H transitions are characterized by a moderate increase in the energy confinement time (typically about 30%), an increase in the line average electron density, a drop in the edge emissions, the development of steep edge density gradients, and a reduction in the edge turbulence level, occurring within a few ms. These phenomena are clear indications of the formation of a transport barrier in the plasma edge region.
In a review of the L–H confinement transitions at TJ-II [10], several aspects were clarified: (a) the presence of a low-order rational surface in the plasma edge generally facilitates the transitions (as also noted in [11]); (b) the net plasma current affects the transitions, such that different magnetic configurations require a different value of plasma current to achieve the transition, which was linked to the existence of a preferential radial position of specific low-order rational surfaces; and (c) a radial electric field well forms during the transition at the edge of the plasma (near ). The latter observations were completed using Doppler reflectometry [12]. Later work has shown the existence of a causal relationship between the MHD mode activity associated with low-order rational surfaces and L–H transitions [13].
From resistive magnetohydrodynamic (R-MHD) turbulence simulations, it is known that low-order rationals generate larger amplitude turbulence than high-order rationals. Turbulence is instrumental in driving sheared flows, which produce the transport barriers that trigger confinement transitions. Therefore, it is expected that low-order rationals are key to understanding these confinement transitions.
The present work reanalyzes a large set of discharges with L–H transitions to clarify how systematic the impact of low-order rational surfaces is for the achievement of confinement transitions in high-density TJ-II plasmas. As we will show, it is essential to consider the modification of the rotational transform profile by the net plasma current in order to achieve a proper understanding of the mechanism underlying these L–H transitions. Once this effect is taken into account, it can be shown that the L–H transitions are systematically characterized by the presence of a low-order rational surface in the plasma edge region, with a distribution centered around .
Turbulence modeling based on an R-MHD code is used to clarify that the sheared flows generated in the neighborhood of low-order rational surfaces, through Reynolds stress, likely stem from the L–H confinement transitions observed at TJ-II.
2. Methods
The experiments reported here are performed at the TJ-II stellarator [14], with toroidal magnetic field T, major radius m, and minor radius m [15]. Figure 1 shows a diagram of TJ-II. Plasmas are initiated using two Electron Cyclotron Resonance Heating (ECRH) beam lines, operating at 53.2 GHz, delivering up to about 300 kW of power each. Two tangential Neutral Beam Injection (NBI) systems, operating in a co/counter configuration [16], then inject up to ∼1 MW of throughput power at ≤32 keV into the TJ-II vessel for ≤120 ms.
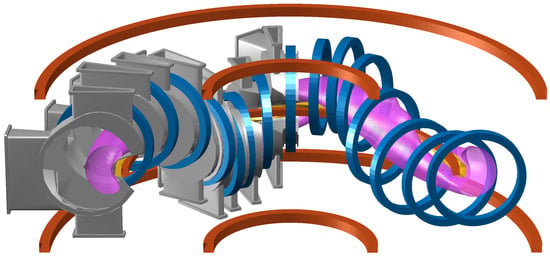
Figure 1.
Diagram of one half (two periods) of the TJ-II stellarator, showing the external magnetic field coils (blue: circular toroidal field coils; red: vertical field, radial field, and central circular coils) and ochre: helical coil) that generate the magnetic configuration, a quarter (one period) of the vacuum vessel (gray) and the Last Closed Flux Surface of a plasma (purple). Under normal field operation, the main toroidal field is anti-clockwise as seen from the top. The plasma current is called positive when it points in the anti-clockwise direction.
2.1. Magnetic Configuration
By varying currents in the external field coils, the flexible TJ-II heliac is capable of exploring a wide range of magnetic configurations [17].
In the present study, we explore a set of vacuum configurations that are mainly characterized by the variation in a single parameter: the helical coil current . These selected configurations have a very similar vacuum rotational transform profile, except for an offset, as shown in Figure 2. The horizontal axis, , is the normalized minor radius, such that corresponds to the magnetic axis and to the Last Closed Flux Surface (LCFS). The second number ‘yy’ of the configuration label shown in the legend, xxx_yy_zz, equals 10 times (kA). Thus, it is possible to explore the impact of specific rational surfaces at specific radial positions while keeping other physically relevant parameters (such as the magnetic shear) constant. Note, however, that the rotational transform profile in actual experiments may differ from the vacuum profile, as will be discussed in the following.
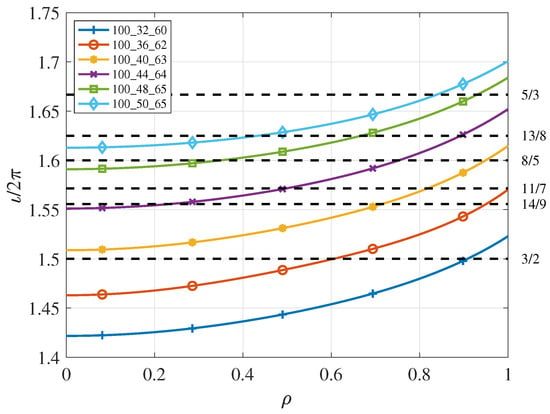
Figure 2.
Vacuum rotational transform profiles for the configurations indicated in the legend. Some rational values are indicated by horizontal dashed lines, with their corresponding labels on the right (all rationals = n/m in the range 1.45 ≤ n/m ≤ 1.69 with n ≤ 15 are shown).
2.2. Impact of Plasma Current on the Rotational Transform Profile
In the presence of plasma, the rotational transform is modified by the plasma current, . Assuming that the plasma resistivity roughly obeys Spitzer resistivity, the impact of the plasma current on the rotational transform can be estimated [18]. A simplified model that enables estimating the rotational transform profile based on the value of the net plasma current is provided in [19]. It states
where with (kA)−1 and . Although this model ignores fine details that may affect the current distribution under different conditions, the model has been very successful in predicting the temporal evolution of Alfvén mode frequencies as the plasma current changed during NBI heating. Note that this expression is similar to the one used in W7-AS [6]. By way of example, this correction of the rotational transform is shown in Figure 3 for the magnetic configuration 100_44 () and various values of . Note the radial displacement of the 8/5 rational surface as a function of . Comparing Figure 2 and Figure 3, one observes that, both by increasing the external helical current and by increasing the internal plasma current , the rational surfaces are shifted inward (at least in the edge plasma). The modification of the rotational transform profile also implies a modification of the radial magnetic shear.
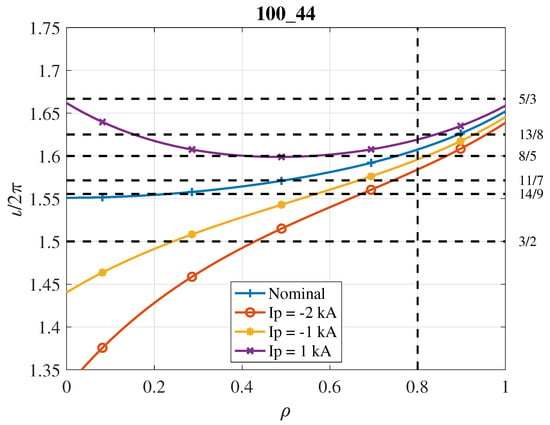
Figure 3.
Rotational transform for configuration 100_44 (), and its modification for small values of . The radial location is highlighted by a vertical dashed line.
The poloidal magnetic field at a given radial location depends on the integral of the toroidal plasma current enclosed within the flux surface. Hence, the correction of the rotational transform for small values of will depend strongly on the radial distribution of the plasma current, which is not known with precision. However, near the edge of the plasma, the enclosed current is very close to the total plasma current, which is measured and known. Therefore, the error in the correction of the rotational transform is expected to be small for large values of , also considering that most of the current will be concentrated at small values of due to the dependence on resistivity. Apart from this (systematic) error due to the assumptions underlying the model of Equation (1), the measurement error of translates into an additional error.
2.3. Plasma Current, Plasma Energy Content, and the H Factor
At TJ-II, the net plasma current is measured using a Rogowski coil, while the plasma diamagnetic energy W is measured using diamagnetic loops [17,20]. From W, the energy confinement time in steady state can be estimated as , where P is the estimated absorbed heating power. The confinement enhancement factor is defined as the increase in confinement time with regard to the ISS04 scaling law estimate, [10]. Here, we define a relative enhancement factor H from the ratio of evaluated after the transition time , and evaluated prior to the transition time, in order to highlight the additional confinement produced by the transition.
2.4. Modeling
To try to understand the role played by low-order resonant surfaces in confinement enhancement at TJ-II, we use a resistive MHD model based on the reduced MHD equations [21,22]. In this simple model, interchange modes are the dominant instability, the averaged equilibrium magnetic field has cylindrical symmetry, and the magnetic field line curvature is provided by the averaged magnetic field line curvature. Since we do not model the three-dimensional magnetic geometry of the TJ-II stellarator, the calculations are not an accurate simulation of the TJ-II results yet have been very helpful in interpreting the experimental results, at least in a qualitative sense [23,24,25]. A detailed specification of the model and its main parameters is provided in Appendix A and Ref. [26]. The parameters correspond to m−3, keV, and T while imposing the rotational transform profile taken from the experiment. The model does not attempt to reproduce the details of the experiment but is only used to clarify the impact of low-order rational surfaces on confinement.
In this framework, we make use of a parameter that measures the confinement caused by turbulent transport [27]. We define an effective particle confinement time, , that only takes the turbulent fluxes into account:
The expression for the radial particle flux, , can be obtained from the evolution equation of the density (see Appendix A) and has two components: the product of the density with the fluctuating radial velocity and the contribution of the fluctuating magnetic field (Equation (10) of Ref. [26]). For the cases shown here, the contribution of the last term is negligible.
3. Experimental Results
In TJ-II, spontaneous L–H transitions are achieved [7] under NBI heating conditions. As in other low-magnetic-shear stellarators, the L–H transition is achieved at constant heating power by increasing the plasma density, and, in general, the higher the heating power, the higher the density needed to trigger the transition. In these experiments, the walls are lithium-coated to ensure low recycling and moderate impurity content, enabling good density control.
The H-mode transitions reproduce common features found in other helical devices [4], i.e., an increase in the plasma density and plasma energy content, a drop in the signal, the development of steep density gradients, and a drastic reduction in the level of turbulence. The radial electric field increases by a factor of three at the transition and a strong sheared flow develops in the proximity of , where the maximum reduction in the density fluctuation level is measured. In general, the energy confinement time is comparable to that predicted by the ISS04 scaling law in L-mode and up to about 30% higher in H-mode [28]. As observed in other low-magnetic-shear helical devices, this enhancement is clearly influenced by the magnetic configuration [10]. The sensitivity on the magnetic configuration could indicate the relevance of configuration-dependent driving and damping terms to the generation of flows as an important element in the transition physics. In TJ-II, a high gain in H-mode confinement, associated with a strong flow, seems to be triggered if a low-order rational is located at the relevant edge layer [10].
In this paper, we use a database of 239 NBI-induced ‘L–H’ transitions studied in the previous reference. The absorbed NBI heating power varies between about 200 and 600 kW, with a distribution that includes many discharges in the low-power range and few discharges in the high-power range. This database was also studied in [13], where it was found that the MHD mode activity was systematically associated with the transition.
The two NBI injection systems drive current: NBI1 (co-injection) generates a positive current, whereas a combination of NBI1 + NBI2 (co-counter) yields a smaller or negative current, depending on the balance of the injected powers. The bootstrap current contribution is relatively small [29]. No feedback control (on or any other quantity) was applied.
Electron density profiles across L–H confinement transitions at TJ-II have been documented in earlier work, using a combination of profile data from the high-resolution Thomson scattering, reflectometry, and helium beam systems [13,30,31]. The typical change in the profile shape is shown in Figure 4. The observed broadening and heightening of the electron density profile are consistent with the observed increase in the line average electron density from the 2 mm interferometer. The broadening of the profile suggests the formation of a transport barrier near the plasma edge, consistent with the detected changes in the radial electric field mentioned above. The electron density is close to zero for . As noted in [17], this ‘far edge region’ contributes very little to plasma confinement. The so-called ‘density gradient region’ extends from about to in H-mode. The electron density profile in the core region () is typically relatively flat.
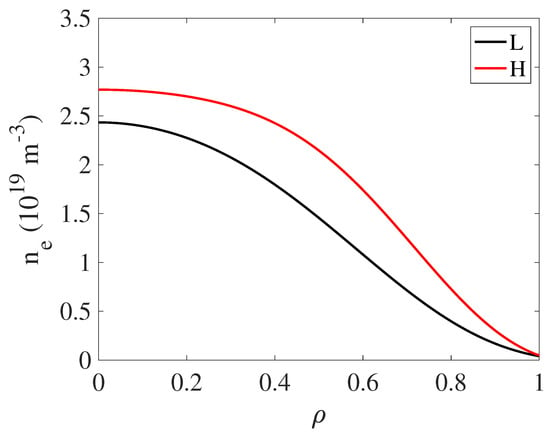
Figure 4.
Typical electron density profiles’ shapes in the NBI phase in L and H modes [31].
To better understand the sequence of events surrounding a typical L–H transition at TJ-II, Figure 5 shows an example of relevant time traces in a plasma with heating by NBI 1 (co-injection) with ∼237 kW of absorbed power. The line average density (a) increases gradually. The net plasma current (b) is observed to increase across the transition. The plasma energy content W (c) is roughly constant before the transition and increases gradually afterwards. The emissions (d) are observed to drop sharply at the transition. This characteristic behavior of and W is used to identify the transitions, and the drop of , along with a reduction in the turbulence amplitude, are used to mark the transition time. The estimated radial location of the 8/5 rational surface (e) is observed to drop gradually across the transition.
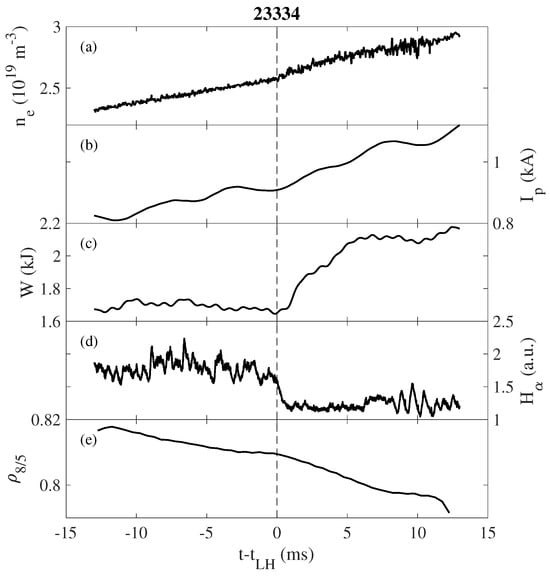
Figure 5.
Time traces of relevant quantities across an L–H transition. (a) The line average density, ; (b) the net plasma current, ; (c) the plasma energy content, W; (d) emissions from the edge; and (e) the estimated radial location of the 8/5 rational surface.
Figure 6 shows the main observation motivating the analysis presented in this paper. For each magnetic configuration, identified by the value of the external helical current , we show the specific value of the net plasma current, , at the transition time, . Remarkably and perhaps unexpectedly, the distribution of these points is far from random, but the data points tend to cluster at rather specific values of for each value of . For example, at , one observes transitions with and with but not in between. Therefore, the question is raised as to why the transitions occur at such specific values of and not others.
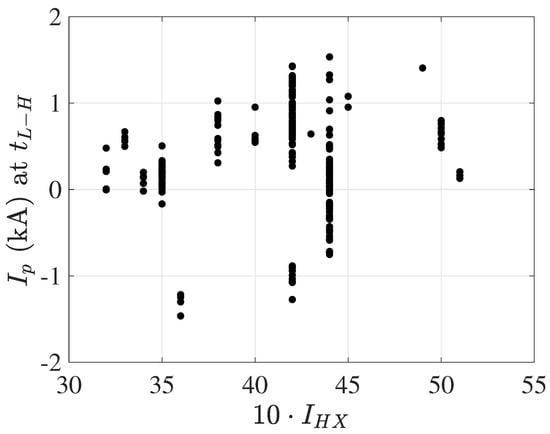
Figure 6.
Measured plasma current, , at the transition time, . The horizontal axis is ten times the helical current, ; i.e., it corresponds to the magnetic configuration.
By plotting the corrected rotational transform profile based on the measured value of , as described in Section 2.2, it becomes clear that the corrected iota profile is such that it places an important low-order rational at the edge, near . Figure 7 shows the same data points as Figure 6, but here we have identified the main rational that is located near in each case. The case is especially interesting as it is now clarified that the two clearly separate groups of values at the transition correspond to two distinct rational values. Something similar occurs at , although the two groups are less clearly separated.
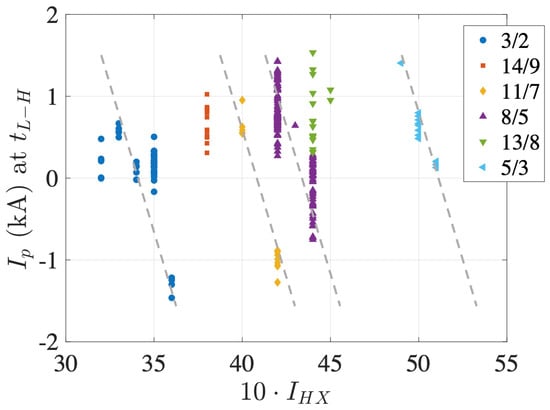
Figure 7.
Inferred rational values are indicated in the legend, and dashed lines linking groups of points corresponding to the same rational value have been added, as discussed in the text.
In Figure 7, the points corresponding to the same inferred rational value are connected by diagonal dashed lines. This reflects the fact that the radial location of the rational surfaces is controlled by two parameters: the external coil current and the plasma current . These two parameters have some capacity for compensating each other, as mentioned in Section 2.2: when increases, the rational associated with the transition can be kept at the same radial location in the plasma edge by decreasing . This is the mechanism underlying the diagonal lines indicated in the figure; each diagonal line corresponds to a rational surface that is located roughly at the same radial location in the plasma edge. We would also like to point out that the inferred identification of the relevant rationals shown here is largely confirmed by the analysis of the magnetic fluctuations measured with Mirnov coils [13]. These observations clearly point to the importance of the location of the rational surface on the plasma edge as a dominant factor for triggering transitions.
The number of transitions observed for each rational value is also significant. In this analysis, one should take into account that not all the configurations have been explored to the same degree, as reported elsewhere [13]. This is visible in Figure 6 and Figure 7 as some configurations correspond to more data points than others; in particular, and 44 have been explored extensively. One also needs to be aware that positive current values are more common than negative current values due to the fact that the use of NBI 1 (co) has been more extensive than NBI 2 (counter). The higher density of points for positive therefore simply reflects the choice of external heating, and it does not imply that L–H transitions are less likely for negative . Nevertheless, the major low-order rational values 3/2, 8/5, and 5/3 all correspond to a significant number of transitions, while the somewhat higher-order rational values 14/9, 11/7, and 13/8 correspond to a generally lower number of observed transitions. This effect can be observed directly in the densely populated configurations with and 44, in which the transitions associated with the lower-order rationals are much more common than the transitions associated with the higher-order rationals, regardless of the sign of . Finally, one may note the existence of a gap in this L–H transition database at ; future work will attempt to fill this gap.
This hypothesis that the presence of a low-order rational near is important for achieving L–H transitions can be confirmed and clarified by plotting the estimated radial position of the relevant rational. Figure 8 shows this quantity based on the corrected rotational profile according to Section 2.2—which takes into account the effect of both and on the position of rational surfaces. Note that the rational value inferred to be associated with the confinement transition is generally located within the gray area indicated in the figure, near , with the exception of the rational 3/2, which apparently may produce transitions with a wider range of values (perhaps unsurprisingly as it is a very low-order rational and hence corresponds to a very broad mode).
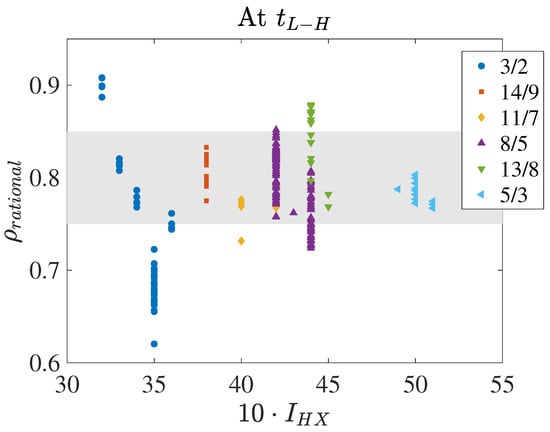
Figure 8.
Corrected radial position, , of the main relevant rational surface at the confinement transition time, . The horizontal axis is ten times the helical current, ; i.e., it corresponds to the magnetic configuration. The value of the rational associated with the transition is indicated in the legend.
Figure 9 shows the number of transitions versus the radial position of the relevant rational surface. A clear preference for is visible. All the transitions for correspond to the rational 3/2.
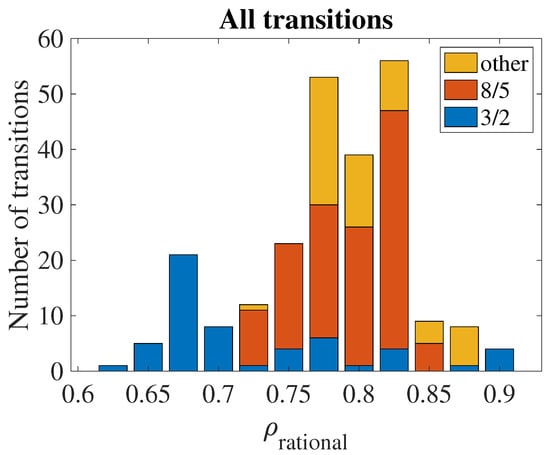
Figure 9.
Statistics of transitions according to the radial position of relevant rational surface. The full height of the bars corresponds to the number of transitions associated with any rational. The numbers of transitions associated with the 8/5 and 3/2 rationals are indicated with the colors shown in the legend.
Figure 10 shows the relative enhancement factor H for the rational 8/5 versus . In spite of large scatter, the data show a trend to the effect that the confinement enhancement is larger when the rational 8/5 is placed further inward (as indicated by the red dashed line).
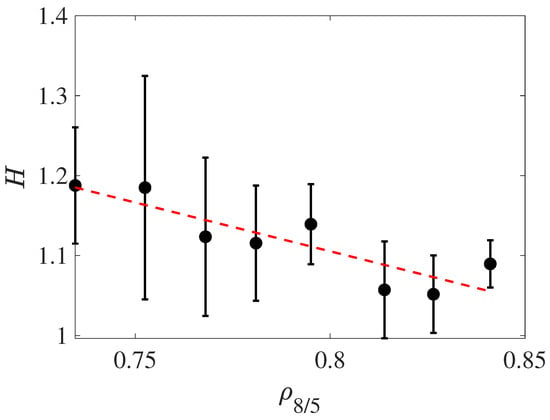
Figure 10.
Confinement enhancement factor, H, versus the radial location of the 8/5 surface. Data from individual discharges have been collected in bins. The error bars shown indicate the standard deviation of the data in each bin.
Figure 11 shows the mean evolution of for , a configuration for which two rationals can be associated with the transitions, as shown in Figure 7, namely 11/7 and 8/5. The mean is taken over the curves of for all the discharges with the same values of and corresponding to the same rational. It is observed that, when the 11/7 surface is associated with the transition, the rational moves outward towards prior to the transition, whereas the 8/5 rational surface moves inward towards . In other words, it appears that the occurrence of the transition is associated with the presence of a low-order rational near the ‘optimal’ location ().
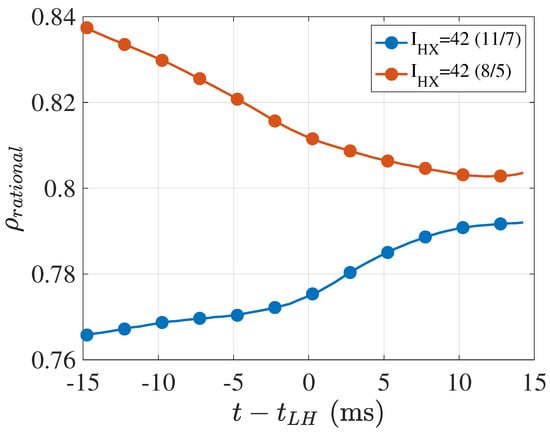
Figure 11.
Average time evolution of the estimated position of rational surfaces (11/7 and 8/5) associated with the L–H transition for the configuration . The time evolution is averaged over 80 discharges (8/5) and 10 discharges (11/7).
In general, the plasma current evolves slightly across the confinement transition. As observed indirectly in Figure 11, the temporal increase or decrease in the plasma current is not interrupted by the transition and continues to evolve. Nevertheless, the current value at the transition is significant, as reflected in Figure 4 and Figure 5.
As noted in earlier work [13], the density at the transition varies with the configuration. This has been interpreted in the sense that a higher density (gradient) is needed for some configurations, meaning that, for some configurations, it is harder to achieve a transition (more ‘drive’ or ‘free energy’ is needed). However, this previous work did not take the correction of the radial position of the rationals (based on ) into account.
Transitions related to the rational 3/2 provide an ideal framework to shed some light on this issue as the variation in the radial location of this rational surface is much larger than is the case with the other rationals (Figure 8). Figure 12 shows the line average density at versus the radial location of the 3/2 rational. To avoid mixing two effects (radial position and power level), we have restricted this plot to the low-power dataset, which is more densely populated than the higher-power dataset. One observes that the required density (gradient) to obtain a transition increases for larger values of . This means that transitions are ‘easier’ to achieve (a lower density is required) if the position of the corresponding rational is slightly further inward although still within the density gradient region. Possibly, this is so because, at a given density value, the density gradient (driving the corresponding instability) is higher at points that are slightly further inward; see Figure 4.
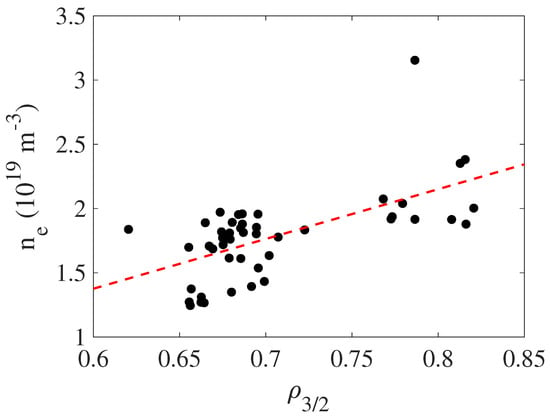
Figure 12.
Line average electron density at the time of the L–H transition, , versus the radial location of 3/2 surface. The red dashed line indicates a trend for the low heating power dataset ( kW).
This is also borne out by the confinement enhancement factor H shown in Figure 13: when the rational is located further outward, the confinement enhancement is generally less (which is analogous to Figure 10 for the rational 8/5).
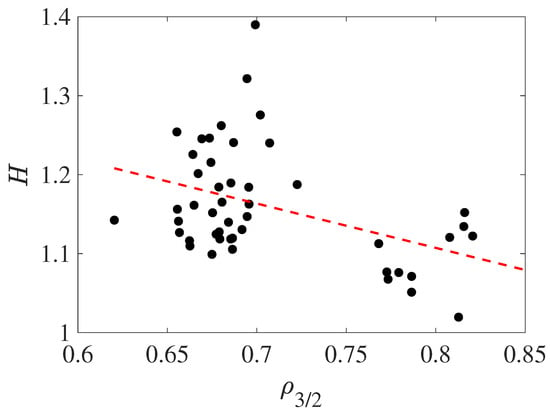
Figure 13.
Confinement enhancement factor, H, versus the radial location of the 3/2 surface for the low heating power dataset ( kW).
4. Modeling Results
In this section, we present and compare the simulations performed using the resistive MHD turbulence model described in Appendix A. The simulations are performed using density and electron temperature profiles that are similar to typical experimental profiles (Figure 14) and two slightly different rotational transform profiles. These two profiles are shown in Figure 15. The purpose of this modeling effort is to explore the effect of the radial placement of an important low-order rational surface (5/3 in this case) on the turbulent transport.
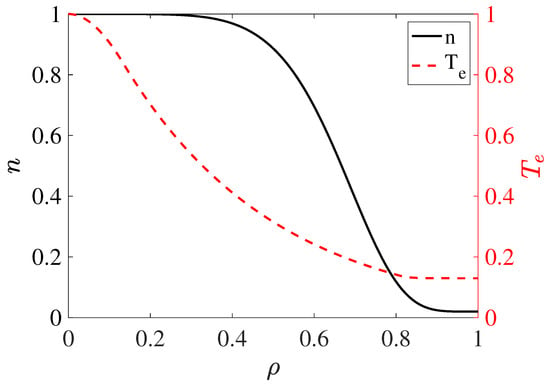
Figure 14.
Normalized density and electron temperature profiles used in MHD turbulence modeling.
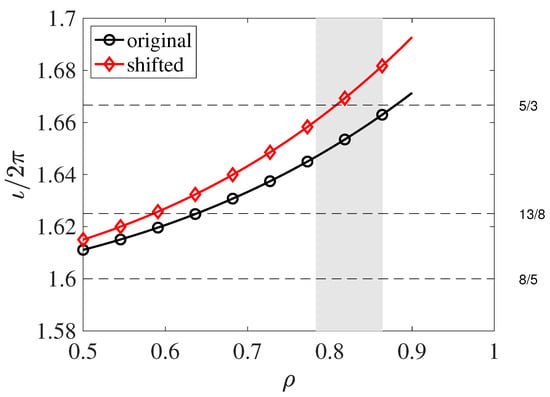
Figure 15.
Rotational transform profiles used in MHD turbulence modeling.
The reference profile corresponds to the magnetic configuration 100_48 (). It has a main resonant surface corresponding to the rational 5/3 near the plasma boundary. The second profile is modified in such a way that the position of the 5/3 rational surface is shifted inwards. It is noted that the modification of the rotational transform profile does not attempt to model the effect of the plasma current described in Section 2.2; rather, a simple artificial modification of the rotational transform profile is imposed, as shown. In the model, the plasma is artificially extended from to through flat density and temperature profiles (see Figure 14) to avoid numerical problems with the boundary conditions at . Accordingly, the profiles are only shown for .
Figure 16 shows the effective (turbulence) confinement time (Equation (2)) for both turbulence simulations. A factor of two difference of is observed over most of the region shown. We note that this difference is quite significant, in view of the fact that all the other factors are kept constant, thus emphasizing the importance of the rotational transform profile for transport. It is also observed that the gradient of is much larger in the region for the case where the rational is placed at . This implies that the radial turbulent flux is decreasing radially towards , indicating the existence of an edge transport barrier associated with the 5/3 rational surface.
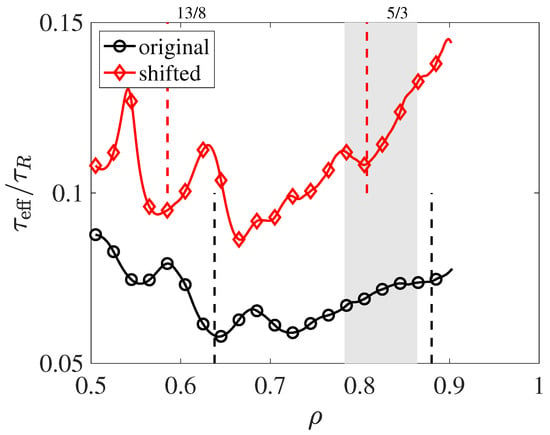
Figure 16.
Effective confinement time, , normalized to the resistive time, , versus normalized radii for the two modeled cases. The locations of the 13/8 and 5/3 rational surfaces are indicated for each case by a vertical dashed line in the corresponding color.
We also draw attention to the structure in the profile observed for : it is characterized by two local maxima, bracketing the location of the rational surface, that shift inward by about the same amount as the inward shift of the 13/8 rational surface. These two ‘bumps’ correspond to two transport barriers (local maxima of ) associated with the rational surface.
Figure 17 compares the poloidal plasma velocity profile, , between the two cases. One observes a significant change in the poloidal velocity. In particular, a double velocity shear layer develops around : the ‘V’-shaped dip in the profile, indicated by a gray area, bracketing the position of the 5/3 rational surface (compare to Figure 15).
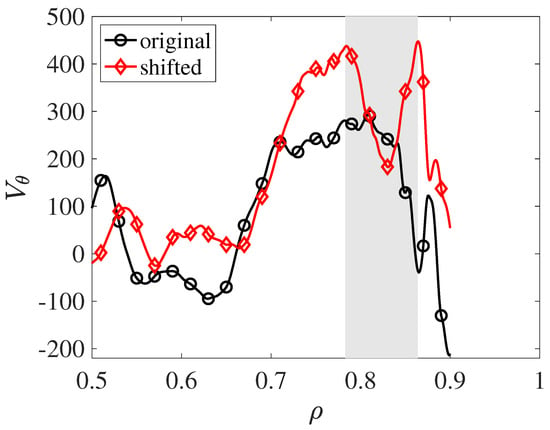
Figure 17.
A comparison of radial profiles of between the two modeled cases.
This flow structure resembles the experimental observations of the poloidal flow created using Doppler reflectometry at W7-X, when the 5/5 rational surface is positioned at the plasma edge, inside the Last Closed Flux Surface [32]. These measurements show that the contribution of the associated island to the flow is maximal at the island boundaries and close to zero at the island O-point. The locally increased flow shear is also associated with a reduction in the density fluctuation amplitude.
5. Discussion
This work attempts to shed some light on the mechanism for the triggering of L–H transitions in low-shear stellarators. Past work suggests that the rotational transform may play a significant role. For example, in W7-AS, the plasma confinement was found to vary systematically with the (edge) rotational transform value. In addition, clear, narrow windows for H-mode access were observed, depending on the edge rotational transform value [6]. These effects were hypothesized to be related to the absence of resonant MHD modes in the neighborhood of major low-order rational surfaces; this absence would imply less MHD-induced radial transport. The other suggested explanations were based on a variation in the connection length in the plasma edge or the reduction in the neoclassical viscosity near the rational surfaces. Nevertheless, at the time, it was not possible to formulate a complete explanation for all the observations.
Similarly, a dependence of the H-factor on the edge rotational value was also observed at TJ-II, and H-mode access was facilitated when a major low-order rational (8/5 or 5/3) was placed at the edge, near [10]. It was suggested that the presence of the rational surface might induce local changes in the radial electric field (as observed using Doppler reflectometry) associated with the rational surface, which then might induce the formation of a transport barrier via turbulence suppression.
To clarify the hypothesis that the presence of a low-order rational surface near is important for the L–H confinement transitions in TJ-II, it is necessary to consider the effect of the net plasma current, , on the edge rotational transform profile.
The present work re-examines the L–H transitions in TJ-II in order to clarify the role of the plasma current, , in modifying the position of rationals at the L–H transition time. Over a wide range of magnetic configurations, the observed confinement transitions occur when the plasma rotational transform profile (modified by the net plasma current, ) is such that a low-order rational is placed near .
This specific radial position corresponds to the ‘foot’ of the density profile (Figure 4), i.e., the transition between the density gradient region and the plasma edge region. It likely constitutes an optimal location for the generation of zonal flows that induce turbulence suppression: on the one hand, the density gradients are sufficiently high to drive MHD instabilities, while, on the other hand, the density itself is low enough to facilitate the driving of (sheared) plasma flows by these instabilities. Modes associated with low-order rationals generate larger fluctuation levels than those associated with high-order rationals, which clarifies why low-order rationals, in particular, are essential for explaining the observations. In turn, these fluctuations associated with low-order rationals may then produce the (sheared) plasma flows that lead to turbulence suppression via Reynolds stress [33].
This ‘optimal location’ hypothesis is borne out specifically in Figure 11. It shows the case of the configuration with , which has two low-order rationals in the plasma edge region in the vacuum, namely 11/7 at and 8/5 at (Figure 2). When becomes negative, the 11/7 rational moves outward; likewise, when becomes positive, the 8/5 rational moves inward. Both situations may lead to the placement of the corresponding rational near and lead to a confinement transition (Figure 7 and Figure 8).
The fact that MHD instabilities are involved is confirmed by an analysis of the magnetic fluctuations associated with the L–H transitions [13]. This work clarified the causal relation between the magnetic fluctuations and the L–H transition and identified the specific rational associated with the transition in a number of cases.
In contrast with various other types of instabilities occurring in fusion plasmas (such as ETG, ITG, and TEM [34]), MHD instabilities specifically depend on the rotational transform, so their involvement is key to understanding the observations reported here.
An exception to the general rule that a low-order rational needs to be placed near for a confinement transition to occur is the rational 3/2. It is the lowest-order rational of all the rationals studied here, and therefore it corresponds to the broadest mode (once the mode is saturated). This may be part of the explanation for why this mode produces transitions over a wider radial range. In this context, we draw attention to the fact that L–H transitions with a low-order rational deep inside the plasma (near ) often involve an intermediate (‘I’) phase with Limit Cycle Oscillations (LCOs) [35,36,37]. The wide range of radial locations (at ) of this mode enable studying the ‘ease’ of achieving the transition as a function of the radial location of the mode. It was found that the transition is ‘easier’ and has a larger impact on confinement for positions that are further inward (Figure 12 and Figure 13). It should be noted, however, that the position of the rational is not necessarily the same as the position of the associated sheared flow [38].
To facilitate the interpretation of the experimental results, we used a resistive MHD turbulence model (described in Appendix A) and ran cases with density and temperature profiles similar to the experimental profiles but two slightly different rotational transform profiles: a nominal profile and a profile in which the edge rational surface corresponding to the rational 5/3 was shifted slightly inward. The model results show the development of a double velocity shear layer around the 5/3 rational surface in its inward shifted position, accompanied by a very significant increase in the effective turbulence confinement time. Simultaneously, a double transport barrier also develops around the 13/8 rational surface at the position , probably as a secondary effect of the increasing driving gradients that are a consequence of the enhanced overall confinement. The triggering of the 13/8 mode may also be facilitated by mode coupling effects, as argued elsewhere [39].
6. Conclusions
This paper re-examines the L–H transitions in the low-shear TJ-II stellarator. From previous work, it was known that an L–H transition is facilitated when a major low-order rational (8/5 or 5/3) is placed in the edge region, near [10].
One observes that the L–H transitions at a given magnetic configuration occur at rather specific values of the net plasma current, . To understand this observation, we took the effect of the net plasma current on the magnetic configuration into account using a simple model. As a consequence, we found that most L–H transitions occur when a low-order rational surface is positioned near . The significance of this location is that it corresponds to the ‘foot’ of the density profile, i.e., the transition between the density gradient region and the rather flat profile at the plasma edge. In other words, it is roughly the outermost location where significant (turbulence-driving) gradients exist. An exception to this general rule are the transitions associated with the 3/2 rational, which may be located in a wider radial range when the transition occurs; when the rational is located at smaller radii, Limit Cycle Oscillations may occur [37].
Interestingly, therefore, the occurrence of the L–H transitions at TJ-II is systematically correlated with the presence of the low-order rational surfaces in the plasma edge region. When the MHD modes corresponding to these low-order rational surfaces are triggered, the corresponding fluctuations may provide the seed for the development of zonal flows through Reynolds stress. The resulting flows have indeed been observed directly in specific cases [12]. Sheared zonal flows, in turn, are known to be associated with turbulence suppression and transport barriers.
Future work will seek to confirm this effect experimentally, by actively controlling and scanning the plasma current in conditions that would allow L–H transitions in principle.
A resistive MHD turbulence model was used to facilitate a better understanding of these observations. Using similar density and temperature profiles as in the experiment, it was observed that a case with a shifted rotational transform profile, such that , had much better confinement than a case with . The formation of a double velocity shear layer and transport barrier in the shifted case was also observed.
These results are expected to be relevant in the framework of the efforts to understand confinement improvement and perhaps obtain the H-mode in the low-shear W7-X stellarator [32,40,41,42].
Author Contributions
Conceptualization, B.P.v.M., T.E., B.C. and L.G.; methodology, B.P.v.M., T.E., B.C. and L.G.; software, B.P.v.M., T.E., B.C. and L.G.; validation, B.P.v.M., T.E., B.C. and L.G.; formal analysis, B.P.v.M., T.E., B.C. and L.G.; investigation, B.P.v.M., T.E., B.C. and L.G.; data curation, B.P.v.M. and T.E.; writing—original draft preparation, B.P.v.M.; writing—review and editing, B.P.v.M., T.E., B.C. and L.G.; visualization, B.P.v.M., B.C. and L.G. All authors have read and agreed to the published version of the manuscript.
Funding
Research sponsored in part by the Ministerio de Ciencia e Innovación of Spain under project Nos. PID2021-124883NB-I00, PID2021-125607NB-I00, and PID2022-137869OB-I00. This work has been carried out within the framework of the EUROfusion Consortium, funded by the European Union via the Euratom Research and Training Programme (Grant Agreement No. 101052200—EUROfusion). Views and opinions expressed are, however, those of the author(s) only and do not necessarily reflect those of the European Union or the European Commission. Neither the European Union nor the European Commission can be held responsible for them. B.A.C. gratefully acknowledges support for the research from the DOE office of Fusion Energy under US Department of Energy Contract No. DE-SC0018076.
Data Availability Statement
The data that support the findings of this study are available from the corresponding author upon reasonable request.
Acknowledgments
The authors would like to thank the TJ-II Team (See the author list in ref. [15]) for a fruitful collaboration.
Conflicts of Interest
The authors declare no conflicts of interest.
Appendix A. The Resistive MHD Model
In this work, we make use of a resistive MHD model to understand MHD turbulence. While this model does not include all the aspects of turbulence in fusion plasmas, it does provide insights into the effects caused by MHD turbulence, a type of turbulence that is closely associated with with the magnetic geometry and sensitive to the presence of low-order rational surfaces.
The four equations of the model are summarized below in their dimensionless form [26]:
The first equation describes the evolution of the poloidal magnetic flux, , and follows from Faraday’s and Ohm’s laws. The second one describes momentum balance, where U is the z component of the vorticity. The last two equations specify the evolution of the density, n, and the electron temperature, . All the quantities are decomposed in an equilibrium and a fluctuating component , so .
The perpendicular velocity is provided by
where is the unit vector in the toroidal direction. The gradient parallel to the magnetic field is
Here, is the electrostatic potential, the parallel current density is , and . The resistivity is , the viscosity is , and the perpendicular diffusivity is . and are the parallel and perpendicular thermal diffusivity, respectively. is the ratio of the plasma pressure, p, to the magnetic pressure, , at the plasma axis, , where is the toroidal magnetic field and is the vacuum permeability; is the resistive time at the magnetic axis, , where is the resistivity at the magnetic axis and is the Alfvén time, , where and are the ion mass and density, respectively. and a are the major and minor radius, respectively, yielding the inverse aspect ratio . The Lundquist number is . , where is the electron diamagnetic frequency; , where is the ion cyclotron frequency.
In the calculations for magnetic configuration 100_48 () of the TJ-II stellarator presented here, we have used , inverse aspect ratio , and Lundquist number . In the calculations, all times are normalized to the resistive time. With this choice of parameters, this configuration is unstable to resistive interchange modes.
References
- Gohil, P.; Evans, T.; Fenstermacher, M.; Ferron, J.; Osborne, T.; Park, J.; Schmitz, O.; Scoville, J.; Unterberg, E. L–H transition studies on DIII-D to determine H-mode access for operational scenarios in ITER. Nucl. Fusion 2011, 51, 103020. [Google Scholar] [CrossRef]
- Plank, U.; McDermott, R.M.; Birkenmeier, G.; Bonanomi, N.; Cavedon, M.; Conway, G.D.; Eich, T.; Griener, M.; Grover, O.; Schneider, P.A.; et al. Overview of L- to H-mode transition experiments at ASDEX Upgrade. Plasma Phys. Control. Fusion 2022, 65, 014001. [Google Scholar] [CrossRef]
- Howlett, L.; Cziegler, I.; Freethy, S.; Meyer, H.; the MAST Team. L-H transition studies on MAST: Power threshold and heat flux analysis. Nucl. Fusion 2023, 63, 052001. [Google Scholar] [CrossRef]
- Hirsch, M.; Akiyama, T.; Estrada, T.; Mizuuchi, T.; Toi, K.; Hidalgo, C. H-mode in helical devices. In Proceedings of the 23rd IAEA Fusion Energy Conference Proceedings, Daejeon, Republic of Korea, 11–16 October 2010; p. EXC/2–5Ra. [Google Scholar]
- Ascasíbar, E.; López-Bruna, D.; Castejón, F.; Vargas, V.I.; Tribaldos, V.; Maassberg, H.; Beidler, C.D.; Brakel, R.; Dinklage, A.; Geiger, J.; et al. Effect of Rotational Transform and Magnetic Shear on Confinement of Stellarators. Plasma Fusion Res. 2008, 3, S1004. [Google Scholar] [CrossRef]
- Hirsch, M.; Baldzuhn, J.; Beidler, C.; Brakel, R.; Burhenn, R.; Dinklage, A.; Ehmler, H.; Endler, M.; Erckmann, V.; Feng, Y.; et al. Major results from the stellarator Wendelstein 7-AS. Plasma Phys. Control. Fusion 2008, 50, 053001. [Google Scholar] [CrossRef]
- Estrada, T.; Hidalgo, C. H-mode transition in the TJ-II stellarator plasmas. Philos. Trans. R. Soc. Math. Phys. Eng. Sci. 2023, 381, 20210229. [Google Scholar] [CrossRef] [PubMed]
- Hidalgo, C.; Pedrosa, M.; Sánchez, E.; Gonçalves, B.; Alonso, J.; Calderón, E.; Chmyga, A.; Dreval, N.; Eliseev, L.; Estrada, T.; et al. Physics of sheared flow development in the boundary of fusion plasmas. Plasma Phys. Control. Fusion 2006, 48, S169. [Google Scholar] [CrossRef]
- Velasco, J.; Alonso, J.; Calvo, I.; Arévalo, J. Vanishing Neoclassical Viscosity and Physics of the Shear Layer in Stellarators. Phys. Rev. Lett. 2012, 109, 135003. [Google Scholar] [CrossRef] [PubMed]
- Estrada, T.; Ascasíbar, E.; Happel, T.; Hidalgo, C.; Blanco, E.; Jiménez-Gómez, R.; Liniers, M.; López-Bruna, D.; Tabarés, F.; Tafalla, D. L-H transition experiments in TJ-II. Contrib. Plasma Phys. 2010, 50, 501–506. [Google Scholar] [CrossRef]
- López-Bruna, D.; Ochando, M.; López-Fraguas, A.; Medina, F.; Ascasíbar, E. Relationship between MHD events, magnetic resonances and transport barriers in TJ-II plasmas. Nucl. Fusion 2013, 53, 073051. [Google Scholar] [CrossRef]
- Happel, T.; Estrada, T.; Blanco, E.; Hidalgo, C.; Conway, G.; Stroth, U.; the TJ-II Team. Scale-selective turbulence reduction in H-mode plasmas in the TJ-II stellarator. Phys. Plasmas 2011, 18, 102302. [Google Scholar] [CrossRef]
- van Milligen, B.; Estrada, T.; Carreras, B.; Ascasíbar, E.; Hidalgo, C.; Pastor, I.; Fontdecaba, J.; Balbín, R.; the TJ-II Team. The causal impact of magnetic fluctuations in slow and fast L–H transitions at TJ-II. Phys. Plasmas 2016, 23, 072305. [Google Scholar] [CrossRef]
- Harris, J.; Cantrell, J.; Hender, T.; Carreras, B.; Morris, R. A flexible heliac configuration. Nucl. Fusion 1985, 25, 623. [Google Scholar] [CrossRef]
- Hidalgo, C.; Ascasíbar, E.; Alegre, D.; Alonso, A.; Alonso, J.; Antón, R.; Baciero, A.; Baldzuhn, J.; Barcala, J.; Barrera, L.; et al. Overview of the TJ-II stellarator research programme towards model validation in fusion plasmas. Nucl. Fusion 2022, 62, 042025. [Google Scholar] [CrossRef]
- Liniers, M.; Wolfers, G.; Sebastián, J.A.; Rojo, B.; Martín, F.; Carrasco, R.; Guasp, J.; Martín, F.; Sánchez, E.; Jiménez, A.; et al. Beamline duct monitoring of the TJ-II neutral beam injectors. Fusion Eng. Des. 2013, 88, 960–963. [Google Scholar] [CrossRef]
- Ascasíbar, E.; Estrada, T.; Castejón, F.; López-Fraguas, A.; Pastor, I.; Sánchez, J.; Stroth, U.; Qin, J.; TJ-II Team. Magnetic configuration and plasma parameter dependence of the energy confinement time in ECR heated plasmas from the TJ-II stellarator. Nucl. Fusion 2005, 45, 276. [Google Scholar] [CrossRef]
- Castejón, F.; López-Bruna, D.; Estrada, T.; Ascasíbar, E.; Zurro, B.; Baciero, A. Influence of low-order rational magnetic surfaces on heat transport in TJ-II heliac ECRH plasmas. Nucl. Fusion 2004, 44, 593. [Google Scholar] [CrossRef]
- Melnikov, A.; Ochando, M.; Ascasibar, E.; Castejon, F.; Cappa, A.; Eliseev, L.; Hidalgo, C.; Krupnik, L.; Lopez-Fraguas, A.; Liniers, M.; et al. Effect of magnetic configuration on frequency of NBI-driven Alfvén modes in TJ-II. Nucl. Fusion 2014, 54, 123002. [Google Scholar] [CrossRef]
- Ascasíbar, E.; Qin, J.; López-Fraguas, A.; Jiménez, J.; Fedyanin, O.; Delgado, J.; Estrada, T.; de la Luna, E.; García-Cortés, I.; Sánchez, J.; et al. Energy content and magnetic configuration scan in the TJ-II stellarator. In Proceedings of the 12th International Stellarator Workshop, Madison, WI, USA, 3–7 October 1999. [Google Scholar]
- Strauss, H. Nonlinear, three-dimensional magnetohydrodynamics of noncircular tokamaks. Phys. Fluids 1976, 19, 134–140. [Google Scholar] [CrossRef]
- Lynch, V.; Carreras, B.; Hicks, H.; Holmes, J.; Garcia, L. Resistive MHD studies of high β tokamak plasmas. Comput. Phys. Commun. 1981, 24, 465–476. [Google Scholar] [CrossRef]
- Van Milligen, B.; Nicolau, J.; García, L.; Carreras, B.; Hidalgo, C.; the TJ-II Team. The impact of rational surfaces on radial heat transport in TJ-II. Nucl. Fusion 2017, 57, 056028. [Google Scholar] [CrossRef]
- Van Milligen, B.; Sánchez, R. Analysis of Turbulence in Fusion Plasmas; IOP Series in Plasma Physics; IOP Publishing: Bristol, UK, 2022. [Google Scholar] [CrossRef]
- Van Milligen, B.; Voldiner, I.; Carreras, B.; García, L.; Ochando, M.; the TJ-II Team. Rational surfaces, flows and radial structure in the TJ-II stellarator. Nucl. Fusion 2023, 63, 016027. [Google Scholar] [CrossRef]
- García, L.; Carreras, B.; Lynch, V.; Pedrosa, M.; Hidalgo, C. Sheared flow amplification by vacuum magnetic islands in stellarator plasmas. Phys. Plasmas 2001, 8, 4111–4119. [Google Scholar] [CrossRef]
- García-Cortés, I.; McCarthy, K.J.; Estrada, T.; Tribaldos, V.; Medina-Roque, D.; van Milligen, B.; Ascasíbar, E.; Carrasco, R.; Chmyga, A.A.; García, R.; et al. Enhanced confinement induced by pellet injection in the stellarator TJ-II. Phys. Plasmas 2023, 30, 072506. [Google Scholar] [CrossRef]
- Estrada, T.; Happel, T.; Eliseev, L.; López-Bruna, D.; Ascasíbar, E.; Blanco, E.; Cupido, L.; Fontdecaba, J.; Hidalgo, C.; Jiménez-Gómez, R.; et al. Sheared flows and transition to improved confinement regime in the TJ-II stellarator. Plasma Phys. Control. Fusion 2009, 51, 124015. [Google Scholar] [CrossRef]
- Mulas, S.; Cappa, Á.; Martínez-Fernández, J.; Bruna, D.L.; Velasco, J.; Estrada, T.; Gómez-Manchón, J.; Liniers, M.; McCarthy, K.; Pastor, I.; et al. Validating neutral-beam current drive simulations in the TJ-II stellarator. Nucl. Fusion 2023, 63, 066026. [Google Scholar] [CrossRef]
- Van Milligen, B.; Estrada, T.; Ascasíbar, E.; Tafalla, D.; López-Bruna, D.; López-Fraguas, A.; Jiménez, J.; García-Cortés, I.; Dinklage, A.; Fischer, R.; et al. Integrated data analysis at TJ-II: The density profile. Rev. Sci. Instrum. 2011, 82, 073503. [Google Scholar] [CrossRef] [PubMed]
- Losada, U.; Estrada, T.; Liu, B.; van Milligen, B.; Cheng, J.; Silva, C.; Pastor, I.; Fontdecaba, J.M.; Hidalgo, C.; the TJ-II Team1. Role of isotope mass and evidence of fluctuating zonal flows during the L–H transition in the TJ-II stellarator. Plasma Phys. Control. Fusion 2018, 60, 074002. [Google Scholar] [CrossRef]
- Estrada, T.; Maragkoudakis, E.; Carralero, D.; Windisch, T.; Velasco, J.; Killer, C.; Andreeva, T.; Geiger, J.; Dinklage, A.; Krämer-Flecken, A.; et al. Impact of magnetic islands on plasma flow and turbulence in W7-X. Nucl. Fusion 2021, 61, 096011. [Google Scholar] [CrossRef]
- Van Milligen, B.; Estrada, T.; García, L.; López-Bruna, D.; Carreras, B.; Xu, Y.; Ochando, M.; Hidalgo, C.; Reynolds-Barredo, J.; López-Fraguas, A. The role of magnetic islands in modifying long range temporal correlations of density fluctuations and local heat transport. Nucl. Fusion 2016, 56, 016013. [Google Scholar] [CrossRef]
- Garbet, X.; Idomura, Y.; Villard, L.; Watanabe, T. Gyrokinetic simulations of turbulent transport. Nucl. Fusion 2010, 50, 043002. [Google Scholar] [CrossRef]
- Estrada, T.; Happel, T.; Hidalgo, C.; Ascasíbar, E.; Blanco, E. Experimental observation of coupling between turbulence and sheared flows during L-H transitions in a toroidal plasma. Eur. Phys. Lett. 2010, 92, 35001. [Google Scholar] [CrossRef]
- Estrada, T.; Hidalgo, C.; Happel, T.; Diamond, P. Spatiotemporal Structure of the Interaction between Turbulence and Flows at the L-H Transition in a Toroidal Plasma. Phys. Rev. Lett. 2011, 107, 245004. [Google Scholar] [CrossRef] [PubMed]
- Estrada, T.; Ascasíbar, E.; Blanco, E.; Cappa, A.; Castejón, F.; Hidalgo, C.; van Milligen, B.; Sánchez, E. Limit cycle oscillations at the L–I–H transition in TJ-II plasmas: Triggering, temporal ordering and radial propagation. Nucl. Fusion 2015, 55, 063005. [Google Scholar] [CrossRef]
- Van Milligen, B.; Carreras, B.; García, L.; Nicolau, J. The radial propagation of heat in strongly driven non-equilibrium fusion plasmas. Entropy 2019, 21, 148. [Google Scholar] [CrossRef] [PubMed]
- Van Milligen, B.; Carreras, B.; García, L.; Martin de Aguilera, A.; Hidalgo, C.; Nicolau, J.; the TJ-II Team. The causal relation between turbulent particle flux and density gradient. Phys. Plasmas 2016, 23, 072307. [Google Scholar] [CrossRef]
- Geiger, J.; Andreeva, T.; Dinklage, A.; Hirsch, M.; Thomsen, H.; Beidler, C.D.; Beurskens, M.; Bozhenkov, S.; Brakel, R.; Brandt, C.; et al. Confinement and equilibrium with internal islands in a configuration scan with respect to iota in W7-X. In Proceedings of the 28th IAEA Fusion Energy Conference, Online, 10–15 May 2021; p. IAEA–CN–EX/P6–4. [Google Scholar]
- Andreeva, T.; Geiger, J.; Dinklage, A.; Wurden, G.; Thomsen, H.; Rahbarnia, K.; Schmitt, J.; Hirsch, M.; Fuchert, G.; Nührenberg, C.; et al. Magnetic configuration scans during divertor operation of Wendelstein 7-X. Nucl. Fusion 2022, 62, 026032. [Google Scholar] [CrossRef]
- Chaudhary, N.; Hirsch, M.; Andreeva, T.; Geiger, J.; Hoefel, U.; Rahbarnia, K.; Wurden, G.A.; Wolf, R.C.; the W7-X Team. Radial localization of electron temperature pedestal and ELM-like events using ECE measurements at Wendelstein 7-X. EPJ Web Conf. 2023, 277, 03004. [Google Scholar] [CrossRef]
Disclaimer/Publisher’s Note: The statements, opinions and data contained in all publications are solely those of the individual author(s) and contributor(s) and not of MDPI and/or the editor(s). MDPI and/or the editor(s) disclaim responsibility for any injury to people or property resulting from any ideas, methods, instructions or products referred to in the content. |
© 2024 by the authors. Licensee MDPI, Basel, Switzerland. This article is an open access article distributed under the terms and conditions of the Creative Commons Attribution (CC BY) license (https://creativecommons.org/licenses/by/4.0/).