Article

Plasma Electrolytic Polishing of Porous Nitinol Structures

1
Beckmann Institute for Technology Development e.V., Annaberger Str. 73, 09111 Chemnitz, Germany
2
Institute of Machine Elements, Engineering Design and Manufacturing, Technical University Bergakademie Freiberg, Agricolastrasse 1, 09599 Freiberg, Germany
3
Department of Mechanical Engineering, Chemnitz Technical University, Reichenhainer Str. 217, 09125 Chemnitz, Germany
*
Author to whom correspondence should be addressed.
Plasma 2022, 5(4), 555-568; https://doi.org/10.3390/plasma5040039
Submission received: 30 September 2022 / Revised: 18 November 2022 / Accepted: 28 November 2022 / Published: 30 November 2022
(This article belongs to the Special Issue Feature Papers in Plasma Sciences)

Abstract

:
In this study, for the first time, the application of plasma electrolytic polishing (PEP) of porous Nitinol structures, mimicking a trabecular bone structure, that were additively manufactured, is reported. The cube-shaped samples were polished in a diagonal position three different times. The effect of PEP was evaluated in terms of the polishing depth, the effect on sample chemical composition and a possible shift of the phase transition temperature using microscopy, the energy dispersive X-ray spectroscopy (EDX), and the differential scanning calorimetry (DSC) techniques, respectively. The obtained results demonstrated that the PEP technique is suitable for polishing porous structures up to a certain depth into the sample inner structure and does not have any influence on the chemical composition and the phase transformation temperatures. However, small changes in the specific enthalpy were observable among the investigated samples. These changes could be attributed to the sample chemical inhomogeneity, measurement error, and/or differences in sample size and shape.

1. Introduction

The intermetallic NiTi compound, also known as Nitinol due to its commercial availability, mechanical durability and reliable functionality [1,2], is used for the manufacturing of products such as bone, dental, and/or (non)vascular implants/stents [3,4,5], solid-state regenerators for elastocaloric cooling [2,6,7], and actuators and sensors [8]. However, mainly due to the high reactivity of titanium, Nitinol is difficult to process [9], resulting in high tool wear and long machining times using conventional manufacturing methods [10]. To overcome this challenge, an additive manufacturing (AM) processes for fabricating Nitinol was established [8,11,12,13,14,15], after which the shape memory effect of Nitinol could be successfully recovered [16]. However, an important issue limiting the applicability of the additive manufactured Nitinol, and other metallic parts as well, is the low surface quality. As-built AM parts usually contain partly molten particles on their surface [17,18,19], resulting in tremendously increased surface roughness, which compromises their mechanical integrity [5] and/or hinders the cell adherence to an implant of a bone [20]. In addition, it was experimentally demonstrated that the quality of the surface finish of Nitinol parts has a tremendous effect on the operational life of the parts [21]. Furthermore, due to the high reactivity of titanium and a low evaporation temperature of nickel, various precipitates are formed during the AM process, resulting in shifts in the phase transformation temperature of final Nitinol products [11,12,13,17,22]. Nitinol is also sensitive to thermal treatments or changes in its chemical composition as it affects its phase transformation behaviour [23]. Any shift of the phase transformation temperature could cause operation failure of the Nitinol part as it might not “respond” at the set operational conditions. Moreover, it was experimentally demonstrated that by using electro-discharge machining to fabricate Nitinol goods, so-called heat-affected zones are developed [24]. In these zones, material mechanical and functional properties differ from those of the rest of the material, compromising the service life of the produced parts. Therefore, it is very important to develop a process chain for manufacturing Nitinol goods that that are fully mechanically and functionally stable and have application-relevant properties.
To improve the surface integrity of AM parts, an effective post-treatment of such parts is inevitable. While a large number of post-treatment techniques is available, not all of them are equally suitable for polishing complex AM geometries, such as the porous structures investigated in this study. Moreover, a number of these conventional post-treatment technologies, such as particle blasting and electrochemical polishing (EP) cause serious environmental problems. For example, sand blasting creates large amounts of dust [25] and EP uses strong, hazardous and highly toxic acid, i.e., perchloric, hydrofluoric and nitric acids, that cannot be properly recycled [5,26,27,28,29]. However, a study on additively manufactured Nitinol bone fixation plates that were electrochemically polished in two different concentrations of hydrofluoric and nitric acids was reported in Ref. [14]. The study reported efficient removal of partly molten particles form the surface of the samples and the highest consistency with the CAD data after two min of EP process. However, longer treatment caused dissolution of some geometrical features.
Another way of polishing porous Nitinol structures is mechanical polishing. However, such structures are polished as separate units and are assembled into a single structure later on [2,21]. Naturally, such a polishing method is not applicable on additively manufactured porous structures produced as a single unit.
In this study, a highly time-efficient post-processing technique that is well suited for complex geometries and uses more environmentally friendly electrolytes [29,30,31,32,33,34] compared to the conventional EP technology, known as plasma electrolytic polishing (PEP) was investigated. There are two types of PEP processes—the bath-PEP, shown in Figure 1, and the jet-PEP [35,36,37]. The main difference between them is that during the bath-PEP process, the part (7) is immersed into an electrolyte (6) tank (9), while during the jet-PEP, an electrolyte jet is selectively applied on the part’s surface through a nozzle moving over the part.
From Figure 1, one can see that part (7) is connected and acting as an anode (2) and is immersed into electrolyte (6) tank (9), which is connected and acting as a cathode (4). Note that only electrically conductive metal parts can be post-processed using PEP. To achieve a stable PEP process, electrolyte (6), which is a material-specific low-concentration weak salt water-based low-viscosity fluid [30], is heated above Θel = 50 °C [27,33]. Then the direct voltage, U, in between 180 V and 400 V is applied [32] generating a highly conductive plasma (8) and water vapour envelope (5) around part (7). This allows the electric discharge to take place between the highest surface peak of the part and the electrolyte resulting in a smoother and sterilized surface with optically improved gloss. The duration of the PEP process depends on the initial surface quality of the part and can take upwards from a few seconds to half an hour. It is believed that PEP is a predominantly electrochemical process during which a metal dissolution reaction providing surface smoothening is preferred over the anodic water electrolysis reaction [38]. It must be emphasized that during the PEP process a less energetically intensive process, i.e., metal dissolution, takes place. More elaborated theories on the PEP mechanism can be found in Refs. [33,38]. Furthermore, the PEP process is in a way self-regulating, by inducing the discharge where the distance between the part surface and the electrolyte is the shortest, i.e., between the highest peaks and the electrolyte.
Until now, PEP was successfully applied for polishing conventional materials such as stainless steel, titanium and copper [30,31,39]. Attempts to apply the PEP technique on bulk Nitinol samples produced out of a cold drawn wire and/or a cold rolled Nitinol sheet as well as additively manufactured samples, have been made [8,32]. In both studies, the mechanical and functional properties of the analysed samples were investigated using differential scanning calorimetry (DSC) and cyclical mechanical loading. While no significant changes in mechanical and functional properties of the bulk Nitinol after the PEP process were observed [32], additive manufactured samples showed some dramatic differences in their mechanical properties as well as the phase transformation temperatures compared to the reference samples produced out of the bulk Nitinol [8]. However, the observed changes could have been caused by chemical inhomogeneity of the samples, which could have been caused by the AM process as described above.
There is a gap in the literature regarding experimental results obtained on porous structures, manufactured out of any metallic alloy, and polished using PEP. To the best of the authors’ knowledge, no studies have been reported on PEP applied on porous structures produced out of Nitinol or other materials. This could be partly attributed to the relative novelty of the technique. However, the main reason is the limitation of the PEP process itself. A conventional bath-PEP process is not suitable for polishing the mesh-like structures due to the Faraday’s cage effect. Furthermore, polishing of inner surfaces and small cavities is one of the current limitations of the PEP process. However, these limitations can be partly overcame by inducing targeted electrolyte streams as reported in Ref. [19]. Another approach to push the limits of the PEP process was demonstrated by adapting the PEP process for polishing inner surfaces of medium-carrying pipes [40,41]. However, small cavities, like those in porous structures investigated in this study, remain challenging. Therefore, this study, which is the first to report experimental results obtained on plasma electrolytic polishing of porous structures, aims to fill in the existing literature gap and provide preliminary guidance on post-treatment of complex and/or porous structures using an effective and efficient polishing technique.
Another limitation of the bath-PEP process is the maximum size of a treated part. Since the amount of current drawn by the PEP process is directly proportional to the surface area of a part and is limited by the process energy source (1), its capacity determines the maximum surface area of a part to be processed.
Taking into the consideration the potential of the applicability of porous Nitinol structure in medical and other engineering fields, and the existing limitations of the PEP process and the AM process chain of Nitinol goods, this study aimed to fill in the existing knowledge gap on suitability of PEP for polishing porous AM structures fabricated out of Nitinol. Therefore, the current study was designed so that the depth of the polishing effect using PEP treatment on porous Nitinol structures with branch diameter, d, of 300 µm was investigated. For this purpose, a Nitinol structure with a porosity of 50% was additive manufactured using the laser beam melting (LBM) technique.
As discussed above, the chemical composition of Nitinol parts determines their functionality and also the applicability in medical engineering field [14] as there are strict requirements for the surface chemical composition of the bone implants. Therefore, the part was analysed before and after the PEP treatment using EDX technique paying extra attention to the possible surface contamination with adsorbents that could adhere to the sample surface during the PEP process. Finally, DSC was used to quantitatively determine any shift in the phase transformation temperatures of the samples due to the possible side effects of the PEP process. One can argue that the Brunauer, Emmett and Teller (BET) theory should be applied in this study for determining the effectiveness of the PEP process on the porous Nitinol structures. This method is a commonly used for determining the sample specific surface area based on the gas adsorption technique. However, owing to the limitations of PEP to polish inner cavities, as described above, it is expected that any changes in a specific surface area of the analysed samples using the BET technique could not be confidently discriminated from the measurement inaccuracies. Therefore, this technique was not used in the present study.

2. Nitinol Samples and Experimental Methodology

2.1. Nitinol Samples

Four Nitinol cubes in the size of, 20 mm × 20 mm × 20 mm with a porosity of 50% having the branch diameter, d, of 300 µm were additively manufactured using the laser beam melting technology (LBM) and the parameters are given in Table 1. The commercially available Nitinol powder with the chemical composition of Ni50.8Ti49.2 in at.% was used for producing the samples. Note that the samples for this study were purchased.
Aiming to develop a process chain for efficiently manufacturing and post-processing medical implants, the designed sample structures replicate the inner structure of a trabecular bone [42]. Figure 2 presents the characteristic sample investigated in this study. Figure 3 shows the micrograph obtained on the top, respectively, to the building direction of a characteristic sample.

2.2. Plasma Electrolytic Polishing

A bath-PEP process as schematically depicted in Figure 1 was used in this study. The Nitinol cubes one-by-one were polished by submerging them diagonally into the electrolyte for half of the polishing time, i.e., experiment 1, and then rotating them by 180°, submerging them again into the electrolyte and polishing for the rest half of the time, i.e., experiment 2, as indicated in Table 2. The used electrolyte was a Nitinol-specific weak-salt-water-based solution with the pH value of around 4.3. Note that the process parameters, such as electrolyte temperature, Θstart, were selected based on obtained previous experimental experience on polishing bulk Nitinol samples. The used process energy source does not permit adjustments in applied voltage. Thus, the only possible setting was used.
To maintain the electrolyte temperature as stable as possible during the process, an active cooling system was used. Since, generally, cooling/heating systems are rather inert, it was turned on after 1 min of the PEP process start and turned off after the electrolyte was cooled down to 1 °C above the electrolyte start temperature, Θstart. This cooling system consists of a plastic heat exchanger coil placed into the process tank, a pump and a heat sink that is, thermodynamically speaking, infinitely large compared to the volume of the process tank. Note that plastic heat exchanger coil is used so that the electric circuit of the PEP process would not be breached. Cold water was used as a cooling agent.
The applied current,¸ I, values were read from an analogue Socomec amperemeter with 5 A resolution, thus small fluctuations of the applied current that occurred due to changes in the surface area of the samples caused by the PEP process could not be precisely read. However, the fluctuations in applied current directly affected the voltage readings, which were taken from a digital Meterman HD160B multimeter with an accuracy of ±0.25% rdg. It must be also mentioned that the process current depends on the electrolyte temperature and its properties, e.g., electric conductivity etc. The electric charge, Q, given in Table 2, was measured using AZ 2000 ampere hour counter with accuracy of 0.1%. The temperature was measured using testo 108 thermometer, which accuracy is ±0.5 °C ±0.5% of measured value. The mass of the samples was measured by KERN S72 balance with the precision of 0.001 g.
After the PEP process, samples were rinsed in distilled water to remove the residuals of the electrolyte, then dried using compressed air and left for 12 h to air dry completely. Then, the further measurements were conducted.

2.3. Energy Dispersive X-ray Spectroscopy

The EDX measurements were carried out on Sample 1, Sample 2, Sample 3 and on the as-built sample. The specimens for EDX measurements were specially polished to establish a flat plane, enabling reliable measurement results. Note that EDX measurements were conducted on the outer sample surface, which was treated using PEP. The EDX analysis of the deeper sample layers was not carried out. This is due to the assumption that in the case that PEP had an effect on a treated sample chemical composition, these effects would be the most pronounced at the sample areas that were the most exposed to the PEP process, i.e., the sample surface. The measurements were conducted using a scanning electron microscope LEO 1455VP equipped with EDX PV7715/81-ME. The specimen topography was analysed using the microscope NEON 40EsB equipped with EDX ELECT PLUS.

2.4. Differential Scanning Calorimetry

For the DSC measurements specimens of Sample 1, Sample 2 and as-built sample were used. The specimens for the DSC tests were cut out of the corners of each sample. These specimens had the diameter of 5 mm and height of 2 mm. Then each specimen was etched for 1 min in 3.2% HF, 14% HNO3 and 82.8% distilled water in order to remove the oxide layer on the samples. The etched samples were cleaned in an ultrasonic bath filled with acetone and then placed in air-tight containers with a substance prohibiting the development of the oxide layer. The DSC measurements were conducted using a Toledo DSC 1 apparatus at the ramping rate of 10 K/min. The measurement procedure started by cooling the samples down to −110 °C and holding the temperature for 20 min, then the samples were warmed up at the selected temperature ramping rate up to 110 °C and held at that temperature for another 20 min. Then, analogously, the measurements by cooling down the samples were carried out.

3. Results and Discussion

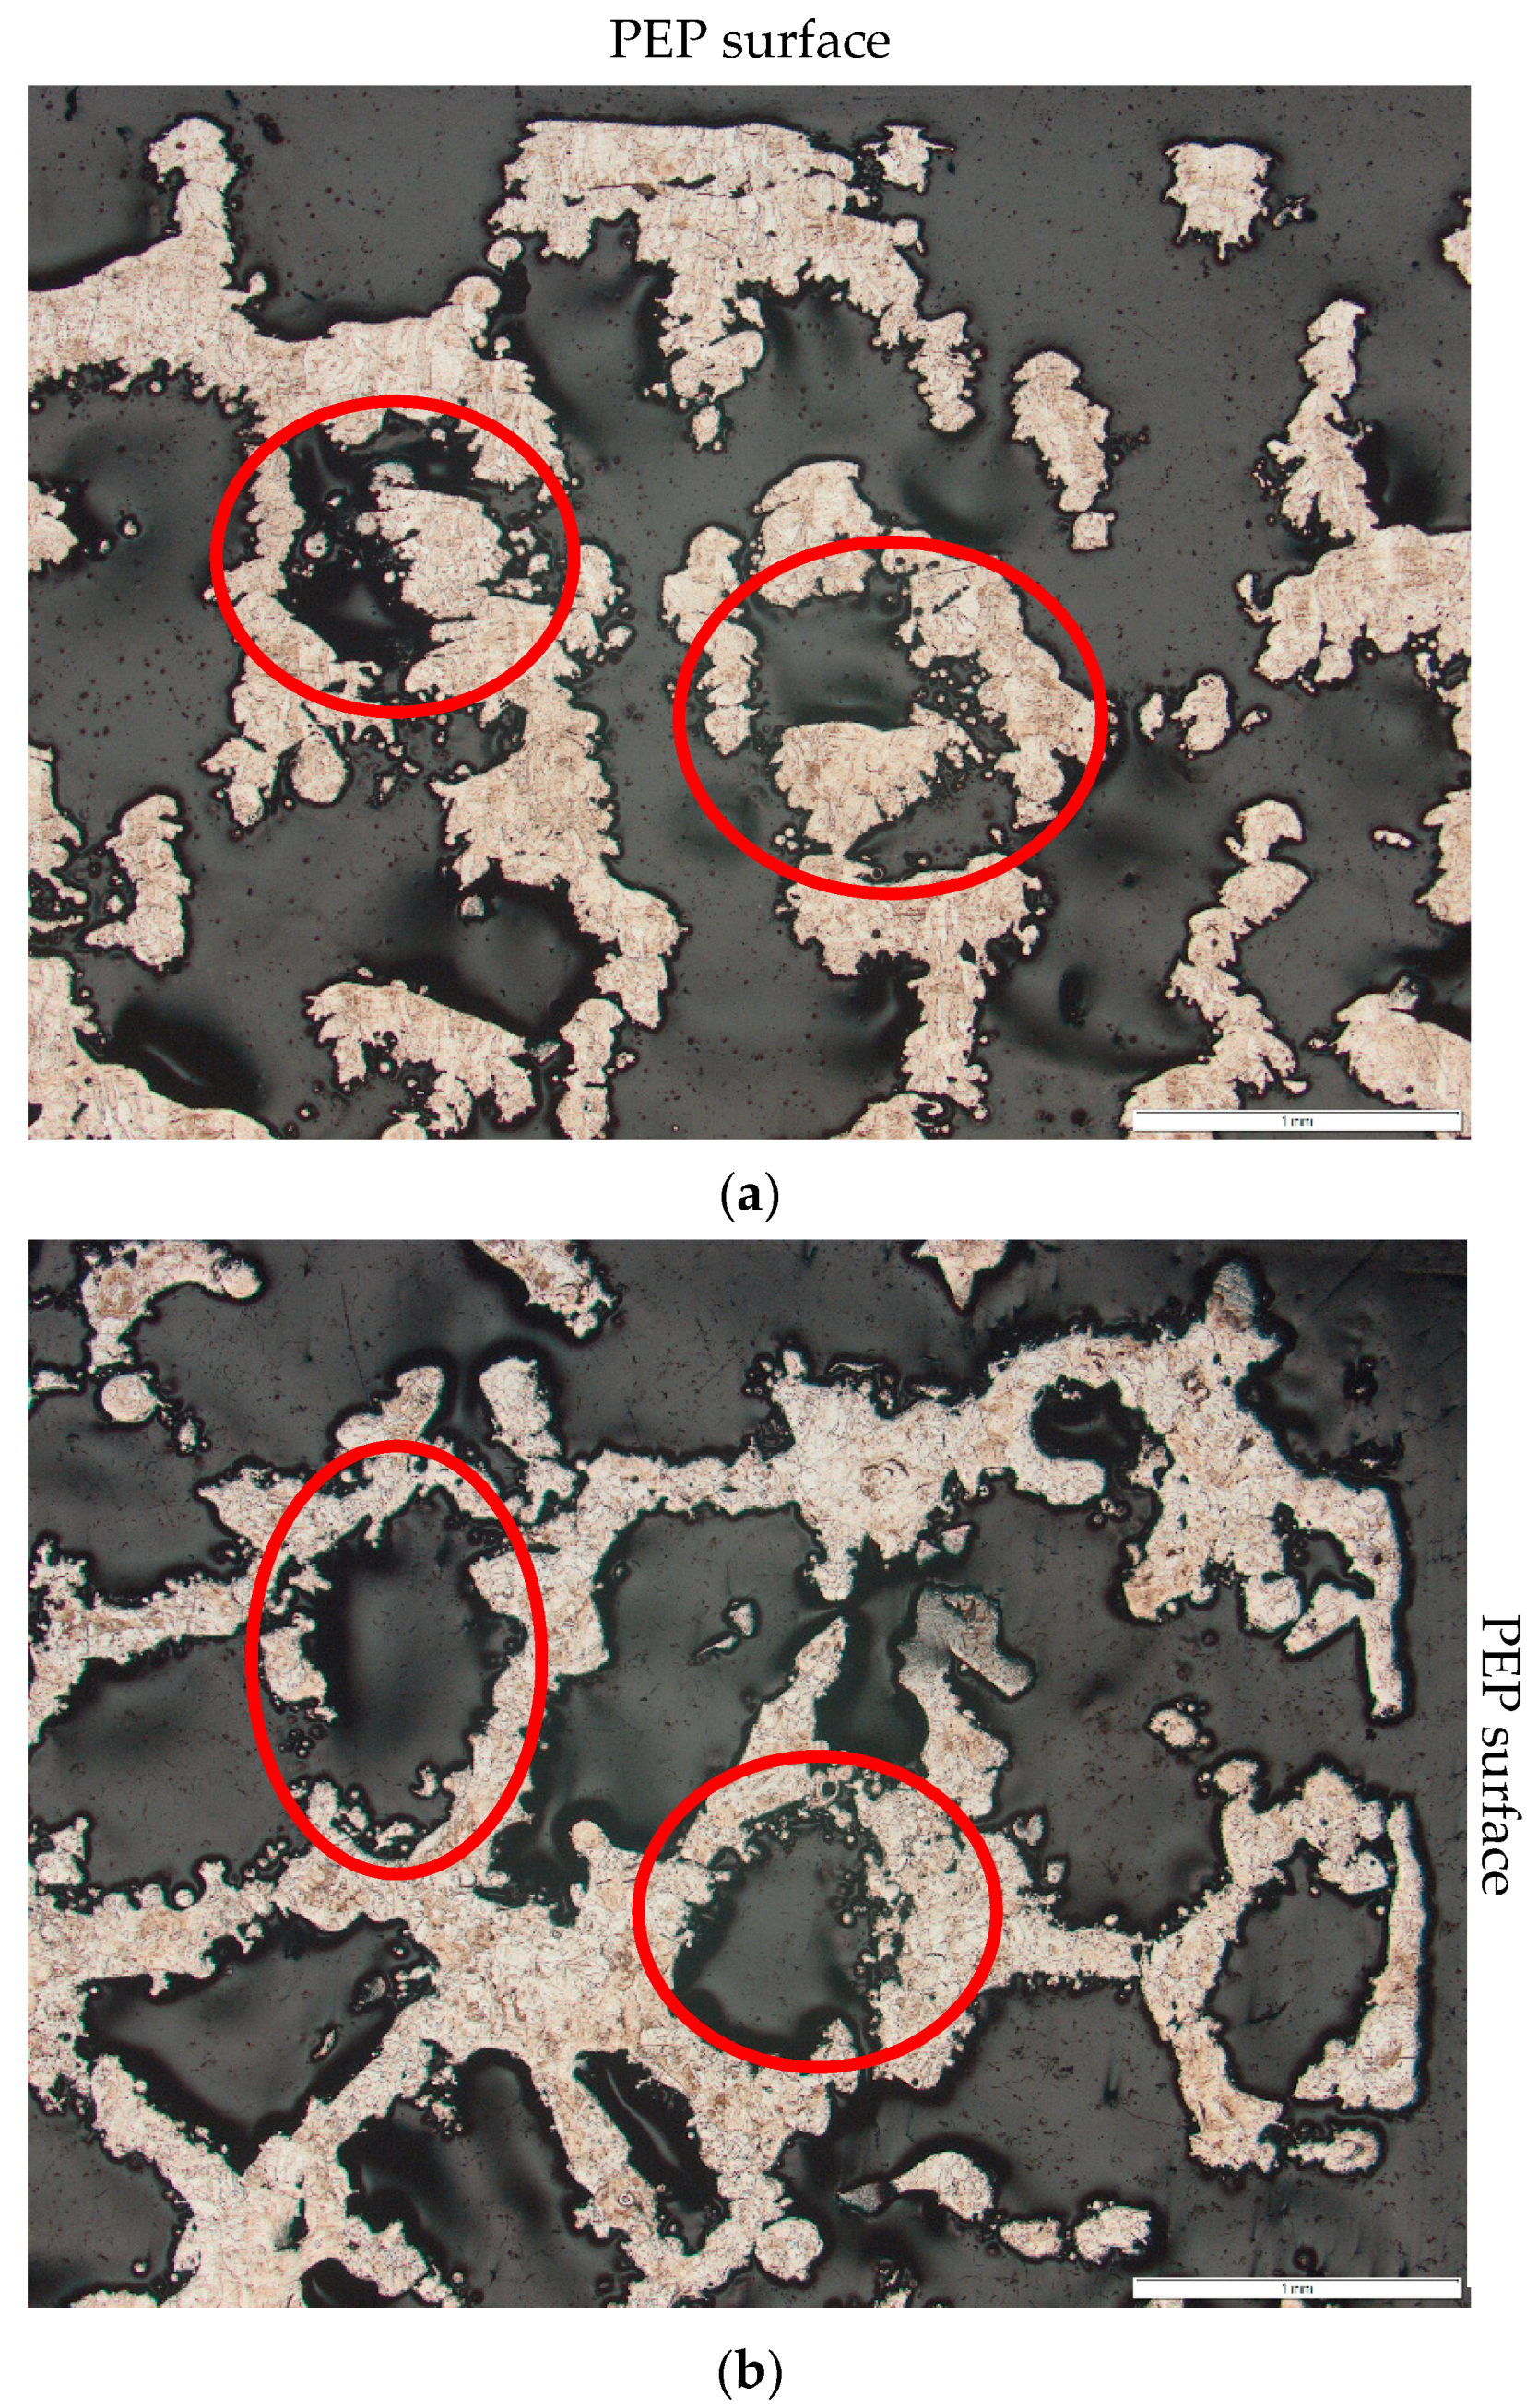
3.1. The Depth of the PEP

As mentioned above, one of the limitations of the PEP process is the possibility to polish inner cavities. Using porous samples, it was possible to investigate the depth of the PEP effect. The specimens for obtaining the micrographs shown in Figure 4 and Figure 5 were cut off using Secotom-60 precision machine. Each specimen was 3 mm in thickness cut off in a building direction as well as direction perpendicular to it.
The micrographs in Figure 4 show how the duration of the PEP process affects the contours of the branch of the porous structures. One can see that the specimens cut from the as-received sample have partly molten particles attached to their surface and the contours of the branches have more sharp edges compared to the polished specimens. The roundness of the contours increases with the increase of the polishing time. The partly molten particles still could be observed after the specimens were polished for 2 min and 4 min. However, no partly molten particles could be observed for specimen polished for 8 min. It is interesting to note that even for Sample 2, the partly molten particles could be observed only in the direction perpendicular to the building direction. This could have been caused by multiple reasons. First, the duration of 2 min of the PEP time is not sufficient to remove the partly molten particles from the surface of the analysed samples. Second, the local geometrical constrains, like narrow passages, enclosed surfaces etc., could have prevented the effective removal of partly molten particles from these surfaces.
Another interesting observation is that the roundness of the branch contours was increased more in the building direction compared to the direction perpendicular to it. This might be due to the differences in the surface quality of the samples in as-received conditions. Note that all samples were polished by orienting them in exactly the same manner.
Figure 5 shows micrographs obtained for Sample 3, which was polished for 8 min in total. For an easier orientation, sample surfaces that were directly exposed to the PEP process, i.e., outer sample surface, are marked “PEP surface”. By analysing the evolution of the changes in surface appearance with the PEP time shown in Figure 4, from Figure 5 one can estimate an approximate depth of PEP, evaluated perpendicular to the “PEP surface”, to be around 1 mm for this specific sample. However, this is a very subjective observation, which cannot be extended to other porous samples outside this study as the depth of the PEP effect depends on the pathway, which is free for the motion of the electrolyte stream. It is also noticeable that some polished areas could be seen deeper into the specimens. However, these areas occur only if a sufficiently large pathway for the electrolyte to flow occurs that has no significant obstacles, e.g., other branches of the structure. Furthermore, feature surfaces facing the inside of the structure, as highlighted with red circles in Figure 5, remained not polished even within the “effective” polishing depth. This is because the gas forming during the PEP process are not efficiently removed from these locations preventing the surface and electrolyte contact and thus hindering the local polishing process.
Finally, the depth of the PEP treatment does not depend on the building direction of the sample, as it is seen from Figure 5. Still, it does depend on the sample orientation inside the process tank and could be manipulated by artificially creating the electrolyte flow by applying an electrolyte nozzle system, which would create an electrolyte stream directed to the sample surface as described in Ref. [19]. One should remember that even during the bath-PEP process, electrolyte is moving due to the convective forces causing the removal of the formed gas around the part, thus enabling the electric discharge. Therefore, if the part is oriented so that these convective forces are disturbed, the possibility of obtaining uneven polishing results increases.

3.2. Energy Dispersive X-ray Spectroscopy

Figure 6 presents the results obtained from the EDX measurements on the as-built sample, Sample 1, Sample 2 and Sample 3. The data on the atomic percentage of the raw powder were obtained from the powder manufacturer and were not repeated in this study. One can see that the chemical composition of the manufactured structures is mostly affected by the LBM process, while the PEP process, despite its duration, does not seem to have any influence on the chemical composition of the samples. As it is explained in the Introduction section, titanium is highly reactive and tends to form oxides and various precipitates during the manufacturing process, while due to the low evaporation temperature nickel evaporates to the process chamber [11,12,13,17,22]. Thus, from Figure 6, one can observe such a significant decrease of nickel in manufactured samples, which effectively increase the content of titanium in the alloy. It is worth mentioning that when not sufficiently adapted electrolytes are used during the PEP process, selective polishing effect might occur as described in Ref. [43]. By carefully analysing Figure 6, it could be concluded that the electrolyte used in this study is properly adapted for polishing Nitinol and no selective material removal has occurred. It is important to emphasised that the minor deviation in both atomic as well as weight percentages of the as-received, and polished, samples is within the accuracy of the EDX measurement procedure. Therefore, it can be concluded that PEP does not have any effect on the chemical composition of the analysed samples. Moreover, no adsorbents were found on the sample surface after the PEP treatment.
From Figure 6a, it is clear that the necessity for further optimization of the chemical composition of the raw Nitinol powder used for the AM processes and/or their parameters to improve the quality of the final parts exists. As was explained above, any deviation from the specific chemical composition of the Nitinol part could lead to its operational failure due to the caused shifts in the phase transition temperature.

3.3. Differential Scanning Calorimetry

Figure 7 presents the DSC results obtained on Sample 1, Sample 2 and the sample in as-built condition. By comparing the results obtained on the as-built sample and the PEP-treated samples, one can see that the temperature range, where the phase transformation takes place, is not affected by the PEP process. Yet, peaks of the DSC signal of the treated samples are smaller compared to the as-built sample, emphasizing the decrease in the specific enthalpy of the polished samples. The specific enthalpy of the as-built sample, Sample 1 and Sample 2 are 14.3 J/g, 5.1 J/g and 7.6 J/g, respectively, obtained during the cooling phase, and −14.7 J/g, −4.6 J/g and −9.3 J/g, respectively, obtained during the heating phase. From the comparison of the specific enthalpy results obtained on the polished samples, one can note that the duration of the PEP process does not influence the changes in the specific enthalpy as drastically as comparing the results obtained on the as-built sample and a polished sample. Experimental investigation on the effects of the enthalpy changes in additively manufactured and PEP treated samples on their functionality has not yet been reported in the literature or conducted in this study. However, the obtained DSC results imply that the LBM and PEP processes are causing some, not yet understood, changes in the material microstructure that lead to the enthalpy reduction of the final parts. While this might not cause any performance issues for Nitinol parts in a shape memory phase, it could be a crucial drawback for superelastic Nitinol parts that are used for energy engineering applications such as elastocaloric cooling [7]. To finalise this hypothesis, an experimental study focusing on the thermal performance of Nitinol regenerators that were polished using various techniques, must be conducted.
It is worth emphasizing that no such changes in the specific enthalpy of bulk samples that were treated using PEP were observed in Ref. [32]. Thus, these differences can be also attributed to the chemical inhomogeneity of the additive manufactured samples, which is known to be cause by the AM process as explained above. Another plausible explanation could be the variation in contact surface between the test crucible and each sample. The specimens for the DSC measurements were cut out of porous samples. They had approximately the same volume and mass, m, of 89.6 mg, 79.1 mg and 79.6 mg as the as-built sample, Sample 1 and Sample 2, respectively. However, the contact surface between the test crucible and each specimen, which could affect the accuracy of the measurements, was not measured. Therefore, to eliminate at least the later possibility, for further DSC analysis of additive manufactured Nitinol samples that were PEP treated, non-porous specimens should be used.

4. Conclusions

Porous Nitinol structures, designed for medical application, were additively manufactured and plasma-electrolytic polished. The samples with the branch diameter of 300 µm and the porosity of 50% manufactured using the LBM technique and then PEP-treated for three different process times. It was demonstrated that the superficial polishing effect of porous Nitinol structures can be successfully achieved by applying the PEP technique. However, the inner structures, after a certain sample depth is reached, remained unpolished due to the technical limitations of an existing bath-PEP technology. It was also shown that the depth as well as the quality of the PEP treatment for porous structures depends on the sample orientation during the process and the electrolyte flow conditions, i.e., obstacles existing in the free pathway of the electrolyte flow, but does not depend on the sample building direction during the AM process. To achieve a deeper polishing effect of porous structures, a nozzle system could be applied for inducing the electrolyte flow. However, one must keep in mind that there is a pore size limit at which the PEP process in not physically possible due to the Faraday’s cage effect and difficulties in removing the formed gas. It must be also mentioned that the inner structure of the analysed samples was randomly organised, which could have a higher negative impact on the electrolyte flow dynamic compared to porous samples with organised inner structures. However, the investigation of the suitability of PEP with and without the adapted nozzle system on samples with organised inner structures is in the scope of future studies.
The effects on chemical composition, a shift of the phase transformation temperature caused by PEP were analysed. It was concluded that in this process chain, the biggest impact on the chemical composition of the final sample is caused by the LBM process, while the PEP step does not cause any measurable changes to additively manufactured samples. Therefore, more research efforts should be made on developing Nitinol powder adapted for additive manufacturing processes, so that the final product will have specific application-driven properties.
Finally, the DSC analysis showed that the phase transformation of the as-received, and the PEP-treated, samples occurs at the same temperature range, indicating that PEP does not induce undesirable shifts. A reduction in the specific enthalpy of the polished samples could be observed, which could have been caused by the chemical inhomogeneity among the tested specimens and/or significant differences in the contact surface area between the test crucible and each specimen.
Further research on PEP treating porous structures focus on optimizing the electrolyte flow conditions for achieving higher depth of the PEP affected area within the samples. A more comprehensive understanding of the possible effects of the PEP treatment on the functionality of Nitinol parts will be conducted on additive manufactured non-porous samples.

5. Limitations of This Study

This study was conducted acknowledging the following experimental limitations:
  • Due to the construction of the test set-up, the maintenance of constant electrolyte temperature during the PEP process was not possible;
  • Due to the resolution of the built-in ampermeter, no precise readings of the resulting process current could be obtained;
  • Due to the nature of the samples chosen for this study, no qualitative surface roughness measurement could be conducted.

Author Contributions

Conceptualization, K.R., K.N. (Kristina Navickaitė) and F.B.-H.; methodology, K.R., K.N. (Kristina Navickaitė) and F.B.-H.; software, K.N. (Kristina Navickaitė); validation, K.R. and K.N. (Kristina Navickaitė); formal analysis, K.N. (Kristina Navickaitė); investigation, K.R., K.N. (Kristina Navickaitė) and K.N. (Klaus Nestler); resources, F.B.-H., H.Z., T.L.; data curation, K.R., K.N. (Kristina Navickaitė) and F.B.-H.; writing—original draft preparation, K.N. (Kristina Navickaitė); writing—review and editing, K.N. (Kristina Navickaitė), M.P., K.R., K.N. (Klaus Nestler), F.B.-H., T.G., T.L. and H.Z.; visualization, K.N. (Kristina Navickaitė) and M.P.; supervision, F.B.-H., T.L. and T.G. All authors have read and agreed to the published version of the manuscript.

Funding

This research received no external funding.

Institutional Review Board Statement

Not applicable.

Informed Consent Statement

Not applicable.

Data Availability Statement

The obtained research data are available on a reasonable request to the corresponding author.

Conflicts of Interest

The authors declare no conflict of interest.

References

  1. Kauffman, G.B.; Mayo, I. The Story of Nitinol: The Serendipitous Discovery of the Memory Metal and Its Applications. Chem. Educ. 1997, 2, 1–21. [Google Scholar] [CrossRef]
  2. Kabirifar, P.; Žerovnik, A.; Ahčin, Ž.; Porenta, L.; Brojan, M.; Tušek, J. Elastocaloric Cooling: State-of-the-art and Future Challenges in Designing Regenerative Elastocaloric Devices. Stroj. Vestn.-J. Mech. Eng. 2019, 65, 615–630. [Google Scholar] [CrossRef] [Green Version]
  3. Duerig, T.; Pelton, A.; Stöckel, D. An overview of nitinol medical applications. Mater. Sci. Eng. A 1999, 273–275, 149–160. [Google Scholar] [CrossRef]
  4. Biscarini, A.; Mazzolai, G.; Tuissi, A. Enhanced Nitinol Properties for Biomedical Applications. Recent Pat. Biomed. Eng. 2010, 1, 180–196. [Google Scholar] [CrossRef]
  5. Kim, J.; Park, J.-K.; Kim, H.K.; Unnithan, A.R.; Kim, C.S.; Park, C.H. Optimization of Electropolishing on NiTi Alloy Stents and Its Influence on Corrosion Behavior. J. Nanosci. Nanotechnol. 2017, 17, 2333–2339. [Google Scholar] [CrossRef]
  6. Engelbrecht, K.; Tušek, J.; Eriksen, D.; Lei, T.; Lee, C.-Y.; Tušek, J.; Pryds, N. A regenerative elastocaloric device: Experimental results. J. Phys. D Appl. Phys. 2017, 50, 424006. [Google Scholar] [CrossRef] [Green Version]
  7. Tušek, J.; Engelbrecht, K.; Millán-Solsona, R.; Mañosa, L.; Vives, E.; Mikkelsen, L.P.; Pryds, N. The Elastocaloric Effect: A Way to Cool Efficiently. Adv. Energy Mater. 2015, 5, 1500361. [Google Scholar] [CrossRef]
  8. Stepputat, V.; Zeidler, H.; Safranchik, D.; Strokin, E.; Böttger-Hiller, F. Investigation of Post-Processing of Additively Manufactured Nitinol Smart Springs with Plasma-Electrolytic Polishing. Materials 2021, 14, 4093. [Google Scholar] [CrossRef]
  9. Weinert, K.; Petzoldt, V.; Kötter, D. Turning and Drilling of NiTi Shape Memory Alloys. CIRP Ann. 2004, 53, 65–68. [Google Scholar] [CrossRef]
  10. Mwangi, J.W.; Weisheit, L.; Bui, V.D.; Zanjani, M.Y.; Schubert, A. Influence of Micro-EDM on the Phase Transformation Behaviour of Medical-Grade Nitinol. Shape Mem. Superelasticity 2018, 4, 450–461. [Google Scholar] [CrossRef]
  11. Andani, M.T.; Haberland, C.; Walker, J.; Elahinia, M. An Investigation of Effective Process Parameters on Phase Transfor-mation Temperature of Nitinol Manufactured by Selective Laser Melting. In Proceedings of the ASME 2014 Conference on Smart Materials, Adaptive Structures and Intelligent Systems, Newport, RI, USA, 8–10 September 2014; pp. 1–5. [Google Scholar]
  12. Walker, J.; Andani, M.T.; Haberland, C.; Elahinia, M. Additive Manufacturing of Nitinol Shape Memory Alloys to Overcome Challenges in Conventional Nitinol Fabrication. In Proceedings of the ASME International Mechanical Engineering Congress and Exposition, Montreal, QC, Canada, 14–20 November 2014. [Google Scholar] [CrossRef]
  13. Haberland, C.; Elahinia, M.; Walker, J.; Meier, H. Visions, Concepts and Strategies for Smart Nitinol Actuators and Complex Nitinol Structures Produced by Additive Manufacturing. In Proceedings of the ASME 2013 Conference on Smart Materials, Adaptive Structures and Intelligent Systems, Snowbird, UT, USA, 16–18 September 2013. [Google Scholar] [CrossRef]
  14. Jahadakbar, A.; Nematollahi, M.; Safaei, K.; Bayati, P.; Giri, G.; Dabbaghi, H.; Dean, D.; Elahinia, M. Design, Modeling, Additive Manufacturing, and Polishing of Stiffness-Modulated Porous Nitinol Bone Fixation Plates Followed by Thermomechanical and Composition Analysis. Metals 2020, 10, 151. [Google Scholar] [CrossRef] [Green Version]
  15. Bram, M.; Bitzer, M.; Buchkremer, H.P.; Stover, D. Reproducibility Study of NiTi Parts Made by Metal Injection Molding. J. Mater. Eng. Perform. 2012, 21, 2701–2712. [Google Scholar] [CrossRef]
  16. Hou, H.; Simsek, E.; Stasak, D.; Al Hasan, N.; Qian, S.; Ott, R.; Cui, J.; Takeuchi, I. Elastocaloric cooling of additive manufactured shape memory alloys with large latent heat. J. Phys. D Appl. Phys. 2017, 50, 404001. [Google Scholar] [CrossRef] [Green Version]
  17. DebRoy, T.; Wei, H.L.; Zuback, J.S.; Mukherjee, T.; Elmer, J.W.; Milewski, J.O.; Beese, A.M.; Wilson-Heid, A.; Zhang, W. Additive manufacturing of metallic components—Process, structure and properties. Prog. Mater. Sci. 2018, 92, 112–224. [Google Scholar] [CrossRef]
  18. Navickaitė, K.; Liang, J.; Bahl, C.; Wieland, S.; Buchenau, T.; Engelbrecht, K. Experimental characterization of active magnetic regenerators constructed using laser beam melting technique. Appl. Therm. Eng. 2020, 174, 115297. [Google Scholar] [CrossRef]
  19. Navickaitė, K.; Nestler, K.; Kain, M.; Tosello, G.; Pedersen, D.B.; Penzel, M.; Böttger-Hiller, F.; Zeidler, H. Effective polishing of inner surfaces of additive manufactured inserts for polymer extrusion using Plasma Electrolytic Polishing. In Proceedings of the RapidTech3D Additive Manufacturing Hub, Erfurt, Germany, 17–19 May 2022; pp. 1–10. [Google Scholar]
  20. Hansen, A.W.; Beltrami, L.V.R.; Antonini, L.M.; Villarinho, D.J.; das Neves, J.C.K.; Marino, C.E.B.; Malfatti, C.D.F. Oxide Formation on NiTi Surface: Influence of the Heat Treatment Time to Achieve the Shape Memory. Mater. Res. 2015, 18, 1053–1061. [Google Scholar] [CrossRef] [Green Version]
  21. Engelbrecht, K.; Tušek, J.; Sanna, S.; Eriksen, D.; Mishin, O.V.; Bahl, C.R.H.; Pryds, N. Effects of surface finish and mechanical training on Ni-Ti sheets for elastocaloric cooling. APL Mater. 2016, 4, 064110. [Google Scholar] [CrossRef] [Green Version]
  22. Bormann, T.; Schumacher, R.; Müller, B.; Mertmann, M.; de Wild, M. Tailoring Selective Laser Melting Process Parameters for NiTi Implants. J. Mater. Eng. Perform. 2012, 21, 2519–2524. [Google Scholar] [CrossRef]
  23. Kapoor, D. Nitinol for Medical Applications: A Brief Introduction to the Properties and Processing of Nickel Titanium Shape Memory Alloys and their Use in Stents. Johns. Matthey Technol. Rev. 2017, 61, 66–76. [Google Scholar] [CrossRef]
  24. Mwangi, J.W.; Zeidler, H.; Schubert, A.; Wohlschloegel, M.; Braeuner, C.; Wohlschlögel, M.; Bräuner, C. Heat affected zone analysis for laser and micro-electrical discharge machined nitinol. In Proceedings of the International Conference on Shape Memory and Superelastic Technologies SMST, San Diego, CA, USA, 15–19 May 2017; pp. 179–180. [Google Scholar]
  25. Kashapov, L.N.; Kashapov, N.F.; Denisov, D.G. Plasma electrolytic treatment of products after selective laser melting. J. Phys. Conf. Ser. 2016, 669, 012029. [Google Scholar] [CrossRef]
  26. Zeidler, H.; Nestler, K.; Boettger-Hiller, F.; Schubert, A.; Previtali, B.; Gökhan, A.D.; Demir, A.G. Finishing of la-ser-machined coronary stents by plasma electrolytic polishing Henning. In Proceedings of the Euspen’s 16th International Conference & Exhibition, Bedfordshire, UK, 30 May–3 June 2016; Volume 49, pp. 83–87. [Google Scholar]
  27. Belkin, P.N.; Silkin, S.A.; D’Yakov, I.G.; Burov, S.V.; Kusmanov, S.A. Influence of Plasma Electrolytic Polishing Conditions on Surface Roughness of Steel. Surf. Eng. Appl. Electrochem. 2019, 55, 55–62. [Google Scholar] [CrossRef] [Green Version]
  28. Rokicki, R.; Hryniewicz, T. Nitinol surface finishing by magnetoelectropolishing. Trans. IMF 2008, 86, 280–285. [Google Scholar] [CrossRef]
  29. Barbosa, F.O.G.; Gomes, J.A.D.C.P.; de Araújo, M.C.P. Influence of Electrochemical Polishing on the Mechanical Properties of K3 Nickel-Titanium Rotary Instruments. J. Endod. 2008, 34, 1533–1536. [Google Scholar] [CrossRef] [PubMed]
  30. Nestler, K.; Böttger-Hiller, F.; Adamitzki, W.; Glowa, G.; Zeidler, H.; Schubert, A. Plasma Electrolytic Polishing—An Overview of Applied Technologies and Current Challenges to Extend the Polishable Material Range. Procedia CIRP 2016, 42, 503–507. [Google Scholar] [CrossRef]
  31. Navickaitė, K.; Nestler, K.; Böttger-Hiller, F.; Matias, C.; Diskin, A.; Golan, O.; Garkun, A.; Strokin, E.; Biletskiy, R.; Safranchik, D.; et al. Efficient polishing of additive manufactured titanium alloys. Procedia CIRP 2022, 108, 346–351. [Google Scholar] [CrossRef]
  32. Navickaitė, K.; Ianniciello, L.; Tušek, J.; Engelbrecht, K.; Bahl, C.R.H.; Penzel, M.; Nestler, K.; Böttger-Hiller, F.; Zeidler, H. Plasma Electrolytic Polishing of Nitinol: Investigation of Functional Properties. Materials 2021, 14, 6450. [Google Scholar] [CrossRef]
  33. Belkin, P.; Kusmanov, S.; Parfenov, E. Mechanism and technological opportunity of plasma electrolytic polishing of metals and alloys surfaces. Appl. Surf. Sci. Adv. 2020, 1, 100016. [Google Scholar] [CrossRef]
  34. Zatkalíková, V.; Podhorský, Š.; Štrbák, M.; Liptáková, T.; Markovičová, L.; Kuchariková, L. Plasma Electrolytic Polishing—An Ecological Way for Increased Corrosion Resistance in Austenitic Stainless Steels. Materials 2022, 15, 4223. [Google Scholar] [CrossRef]
  35. Quitzke, S.; Martin, A.; Schubert, A. Correlation between current density and ablation rate of Jet-PeP. In Proceedings of the 16th International Symposium on Electrochemical Machining Technology INSECT, Chemnitz, Germany, 24–25 November 2020; Volume 2020, pp. 181–188. [Google Scholar]
  36. Kranhold, C.; Schulze, H.P.; Kröning, O.; Zeidler, H. Classification and evaluation of optical phenomena in Jet-PeP with respect to the characteristic of plasma electrolytic polishing. In Proceedings of the International Symposium on Electrochemical Machining Technology INSECT, Saabrücken, Germany, 24–25 November 2019; pp. 153–158. [Google Scholar]
  37. Quitzke, S.; Martin, A.; Schubert, A. Influence of ignition and polishing phase on jet shape and electric current in Jet- Plasma electrolytic Polishing. In Proceedings of the Euspen’s 21st International Conference & Exhibition, Cambridge, UK, 7–10 June 2021. [Google Scholar]
  38. Parfenov, E.; Farrakhov, R.; Mukaeva, V.; Gusarov, A.; Nevyantseva, R.; Yerokhin, A. Electric field effect on surface layer removal during electrolytic plasma polishing. Surf. Coat. Technol. 2016, 307, 1329–1340. [Google Scholar] [CrossRef]
  39. Myкаева, Е.В.; Пaрфенов, М.В.; Гoрбатков; Нeвьянцева, Р.Р. Optimal process control of electrolyte-plasma polishing on the basis of control of the state of the object by impedance spectra. Вестник Уфимского Государственного Авиационного Технического Университета 2014, 3, 150–157. [Google Scholar]
  40. Cornelsen, M.; Deutsch, C.; Seitz, H. Electrolytic Plasma Polishing of Pipe Inner Surfaces. Metals 2017, 8, 12. [Google Scholar] [CrossRef] [Green Version]
  41. Cornelsen, M.; Deutsch, C.; Seitz, H. Influence of the Velocity and the Number of Polishing Passages on the Roughness of Electrolytic Plasma Polished Pipe Inner Surfaces. Metals 2018, 8, 330. [Google Scholar] [CrossRef]
  42. Voo, L.; Armand, M.; Kleinberger, M. Stress fracture risk analysis of the human femur based on computational biomechanics. Johns Hopkins APL Tech. Dig. (Appl. Phys. Lab.) 2004, 25, 223–230. [Google Scholar]
  43. Ivanova, H.P.; Sinkevic, Y.V.; Sheleg, V.K.; Jankovskii, I.N. ИССЛЕДОВАНИЕ МОРФОЛОГИИ И ХИМИЧЕСКОГО СОСТАВА ЭЛЕКТРОИМПУЛЬСНО ПОЛИРОВАННОЙ ПОВЕРХНОСТИ УГЛЕРОДИСТЫХ И КОРРОЗИОННОСТОЙКИХ СТАЛЕЙ (Investigation of morphology and chemical composition of carbon steel and stainless steel polished using electric impuls). Sci. Technol. 2012, 3–10. [Google Scholar]
Figure 1. A principal scheme of a bath-PEP setup adapted with permission from Ref. [31].
Plasma 05 00039 g001
Figure 2. An additive manufactured characteristic Nitinol samples used in this study.
Plasma 05 00039 g002
Figure 3. A micrograph of a characteristic sample.
Plasma 05 00039 g003
Figure 4. A micrograph of: (a) an as-received sample obtained in (1) a building direction and (2) perpendicular to the building direction; (b) Sample 1; (c) Sample 2; and (d) Sample 3.
Plasma 05 00039 g004
Figure 5. The micrographs obtained on Sample 3: (a) in a building direction; and (b) in a perpendicular to building direction. Note that the distance of the cut was 3 mm from the sample edges.
Plasma 05 00039 g005
Figure 6. The results of EDX measurements on the as-built sample, Sample 1, Sample 2 and Sample 3, presented in: (a) atomic percentage; and (b) weight percentage. Note that the values for the raw powder were obtained from the manufacturer.
Plasma 05 00039 g006
Figure 7. The results of the DSC measurements of the Sample 2.
Plasma 05 00039 g007
Table 1. The LBM process parameters for producing the porous Nitinol structures.
ParameterValue
MachineEOS M290
Hatch Spacing, h70 µm
Laser power, P100 W
Laser speed, v620 mm/s
Layer thickness, σ40 µm
Particle size distribution16–45 µm
Table 2. The PEP process parameters for polishing the porous Nitinol structures with the temperature recorded at the start and at the end of the process and the current recorded at the start and in the middle of the process.
Sample NameExp. No.Time, t, sElectrolyte Temp., Θ, °CVoltage, U, VCurrent, I, AElectric Charge, Q, A minMass before PEP, m, gMass after PEP, m, gDifference, Δm, g
StartEndStartMiddle
116076.082.7333106719.20218.7710.431
26075.882.0332967
2112076.386.2330961319.13818.3690.769
212075.585.03329614
3124075.880.43301072919.14518.0271.118
224076.380.73319628
Publisher’s Note: MDPI stays neutral with regard to jurisdictional claims in published maps and institutional affiliations.

