1. Introduction
Plasma medicine is an emerging discipline that involves the use of atmospheric pressure cold plasmas for biomedical uses [
1]. The applications proposed in recent years are numerous. They concern, among the most important and known, disinfection [
2,
3,
4,
5], wound healing [
6,
7], blood coagulation [
8,
9] and the treatment of cancer cells [
10,
11,
12]. Several plasma production concepts and different plasma source designs have been proposed [
13,
14,
15]. In all cases, a neutral gas is ionized by a time-varying High Voltage (HV) applied to one or more electrodes. The plasma thus produced is characterized by a population of energetic electrons and a population of cold ions at room temperature.
A common feature of these plasmas is the abundance of reactive species, in particular the so-called Reactive Oxygen and Nitrogen Species (RONS), which are currently considered as the main agent responsible for the therapeutic effects of low temperature plasma on biological tissues [
10,
16]. However, a global understanding of the chemical and physical mechanisms that determine the action of cold plasmas on living matter is still missing. We still need to understand what role the electric field has, for instance, on the treated substrate, as well as the electric current or the UV photons. Hence, the characterization of the atmospheric cold plasmas used by the various research groups operating in the plasma medicine field is required, in order to study their peculiar aspects, to understand their similarities and differences, and thus, to provide an interpretation of such mechanisms. Moreover, due to its complex nature, plasma medicine requires knowledge of the biological effects that the chemical and physical agents produced by plasma have on living matter. Therefore, collaboration between researchers, such as physicists, biologists, physicians, chemists, and engineers, operating in different fields of science, is needed.
In this contribution, the characterization of the PCC source, specifically designed to induce blood coagulation, is presented by describing electrical and optical measurements.
It must be said that several atmospheric cold plasma sources have been presented in the literature to investigate the ability of non-thermal plasmas to induce blood coagulation [
17,
18,
19]. Just to give a few examples, researchers from Advanced Industrial Science and Technology (AIST) in Tsukuba (Japan) showed that a DBD-based helium plasma is capable of blocking bleeding of a mouse femoral artery in about 10 s [
20,
21]. Researchers at Drexel University (U.S.) showed strongly-accelerated coagulation in human tissues, performing both in vitro and ex vivo experiments [
8]. The first biological tests of in vitro blood coagulation conducted with the Plasma Coagulation Controller (PCC) source were presented in [
22].
The advantage of the source presented in this work is its flexibility, which allows working in a rather wide range of operating conditions. It should also be emphasized that, given that the mechanisms inducing accelerated blood coagulation are not yet completely clear, it is important to know the physical and chemical properties of the plasmas used for experimental biological tests.
The structure of this article is described here. The PCC cold plasma source is presented in
Section 2, by describing the main electrical characteristics and the plasma source geometry. In
Section 3, the optical emission spectroscopy measurements are described. The characteristic emission lines are highlighted, and the variation in their intensity is discussed as the position changes along the plasma plume. In
Section 4, the plasma fast imaging by means of an intensified CCD camera is reported. It is shown that the plasma plume is not spatially uniform. In contrast, the PCC source produces localized structures, associated with plasma streamers propagating at high speed (several tens of km/s). The analysis conducted hear confirms that the propagation speed of such streamers is proportional to the electron drift velocity.
2. Plasma Coagulation Controller
PCC is a plasma source based on the concept of the Dielectric Barrier Discharge (DBD) [
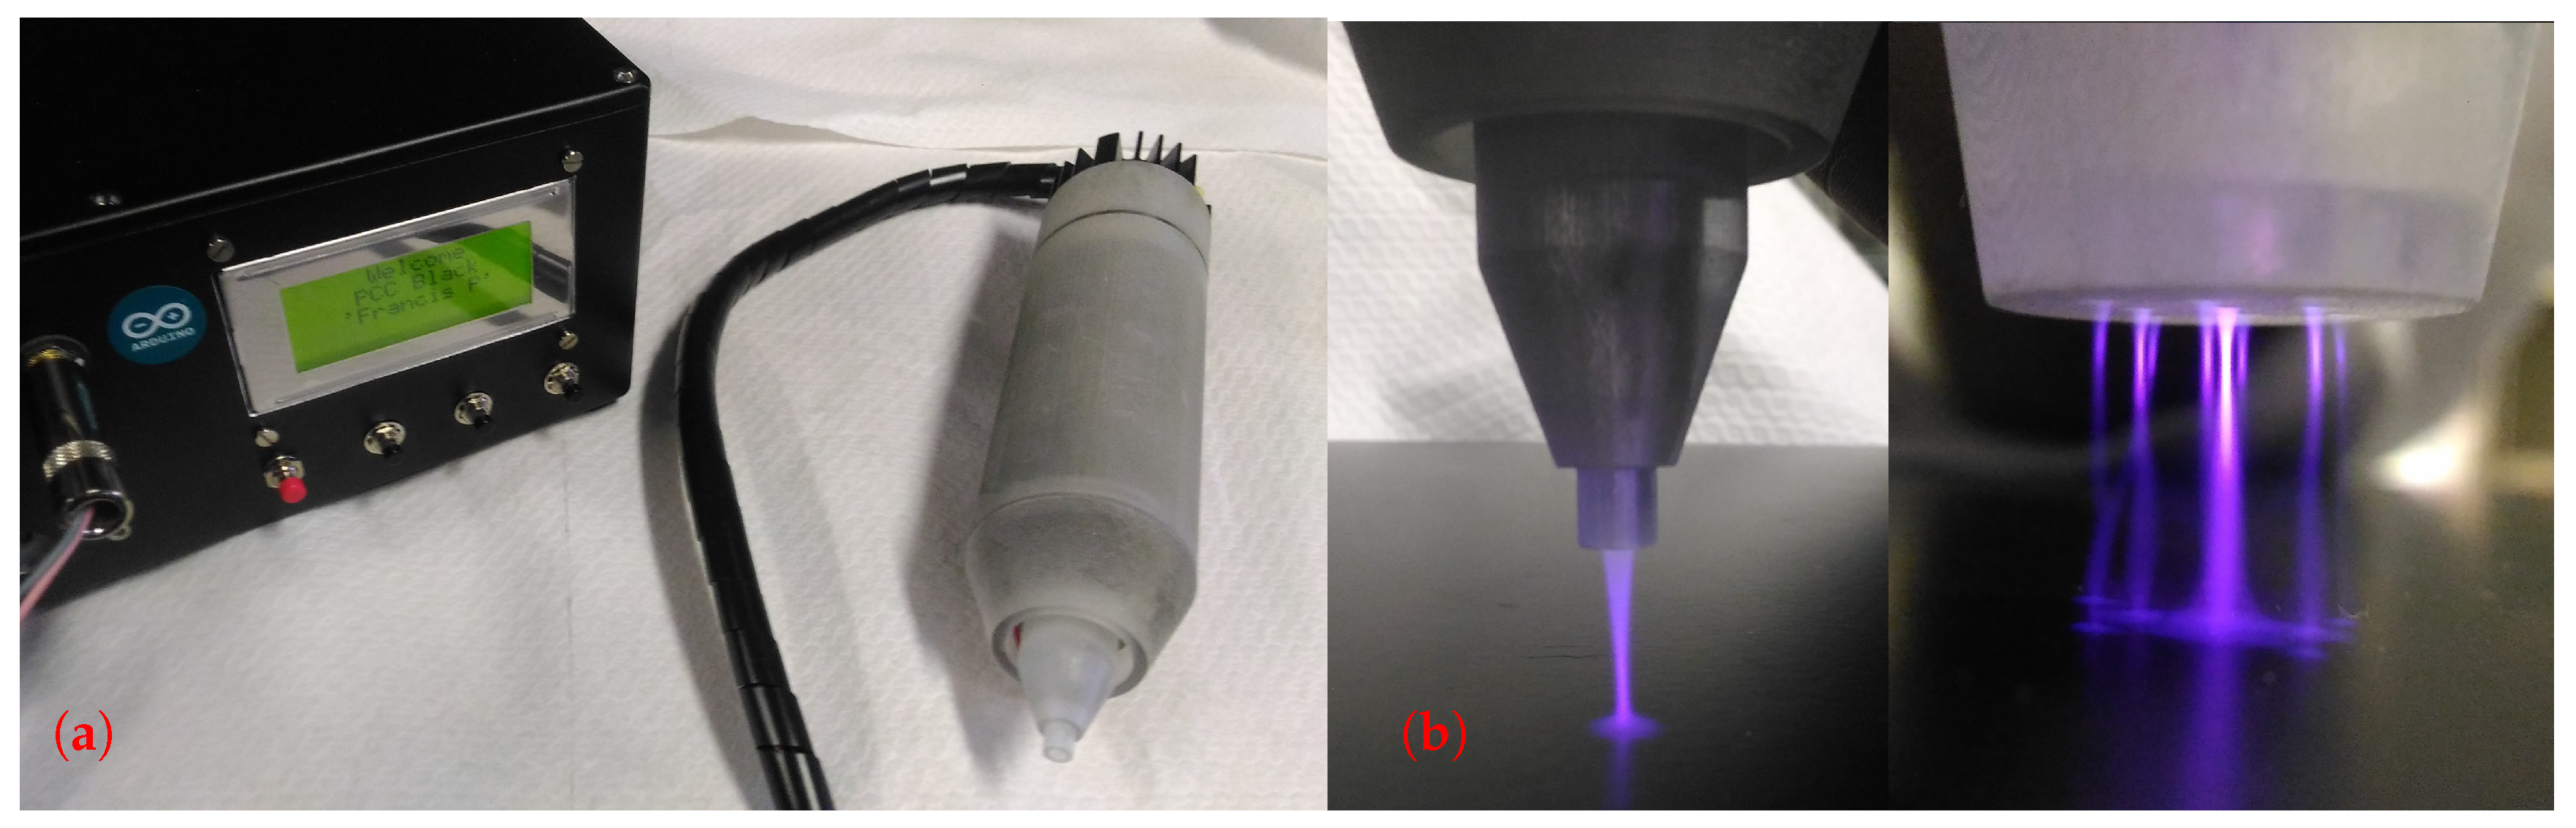
22], which consists of producing the plasma between electrodes isolated by means of dielectric materials. PCC consists of two main modules, shown in
Figure 1a: a control box, containing the main power supply and the control system, and a source head, in which the plasma was generated, containing the HV pulse generator and the plasma nozzle. The latter, whose casing was completely made by 3D printing, had a shape and size such that it could be easily handled by a medical operator.
A gas, flowing into the source head, was ionized by rapid HV pulses (∼1
s long), applied to an electrode covered by a 2 mm-diameter borosilicate tube closed at the end. The plasma thus produced was expelled through the nozzle, resulting in a plasma jet, a few centimeters long, which can be directly applied to the substrate to be treated. A flow meter as used to set the gas flow rate. Several types of nozzles can be mounted on the PCC source head, providing the possibility of obtaining single or multiple plasma jets, with different cross-sections, as shown in
Figure 1b.
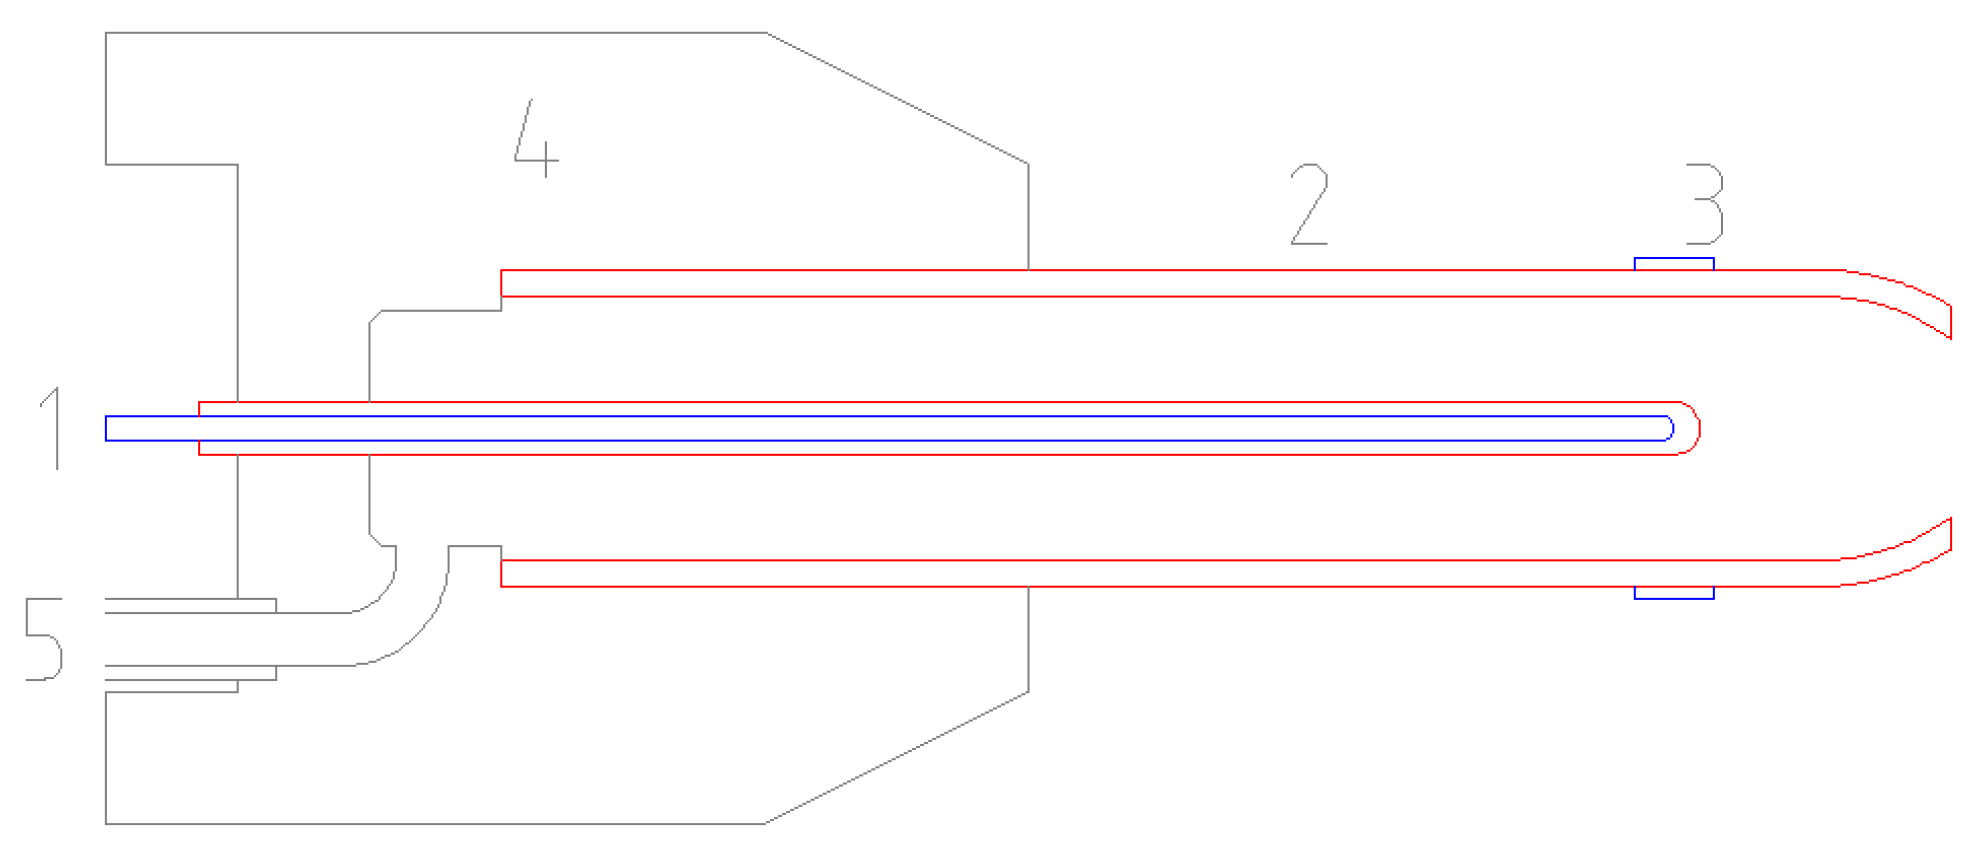
Cross-section schematics of the source head are shown in
Figure 2. It is possible to identify the gas inlet, the central high voltage electrode, covered by a borosilicate capillary, the nozzle, and a removable ground metal ring. The analyses presented in this work refer to the plasma without ground ring, whose function is the plasma stabilization at low power values.
The high voltage pulses were generated by a ferrite core transformer, whose secondary was directly connected to the HV electrode, mounted directly on the source head. A control system, based on an Arduino Leonardo micro-controller, can manage the output voltage by varying in open loop the charging time of the primary winding. The calibration for the reference values has been performed with plasma load and without any substrate. Both output voltage and pulse repetition rate f can be varied in a broad range ( range: 2–12 kV, f range: 1–40 kHz), hence allowing the possibility to control the plasma dose on the treated substrate.
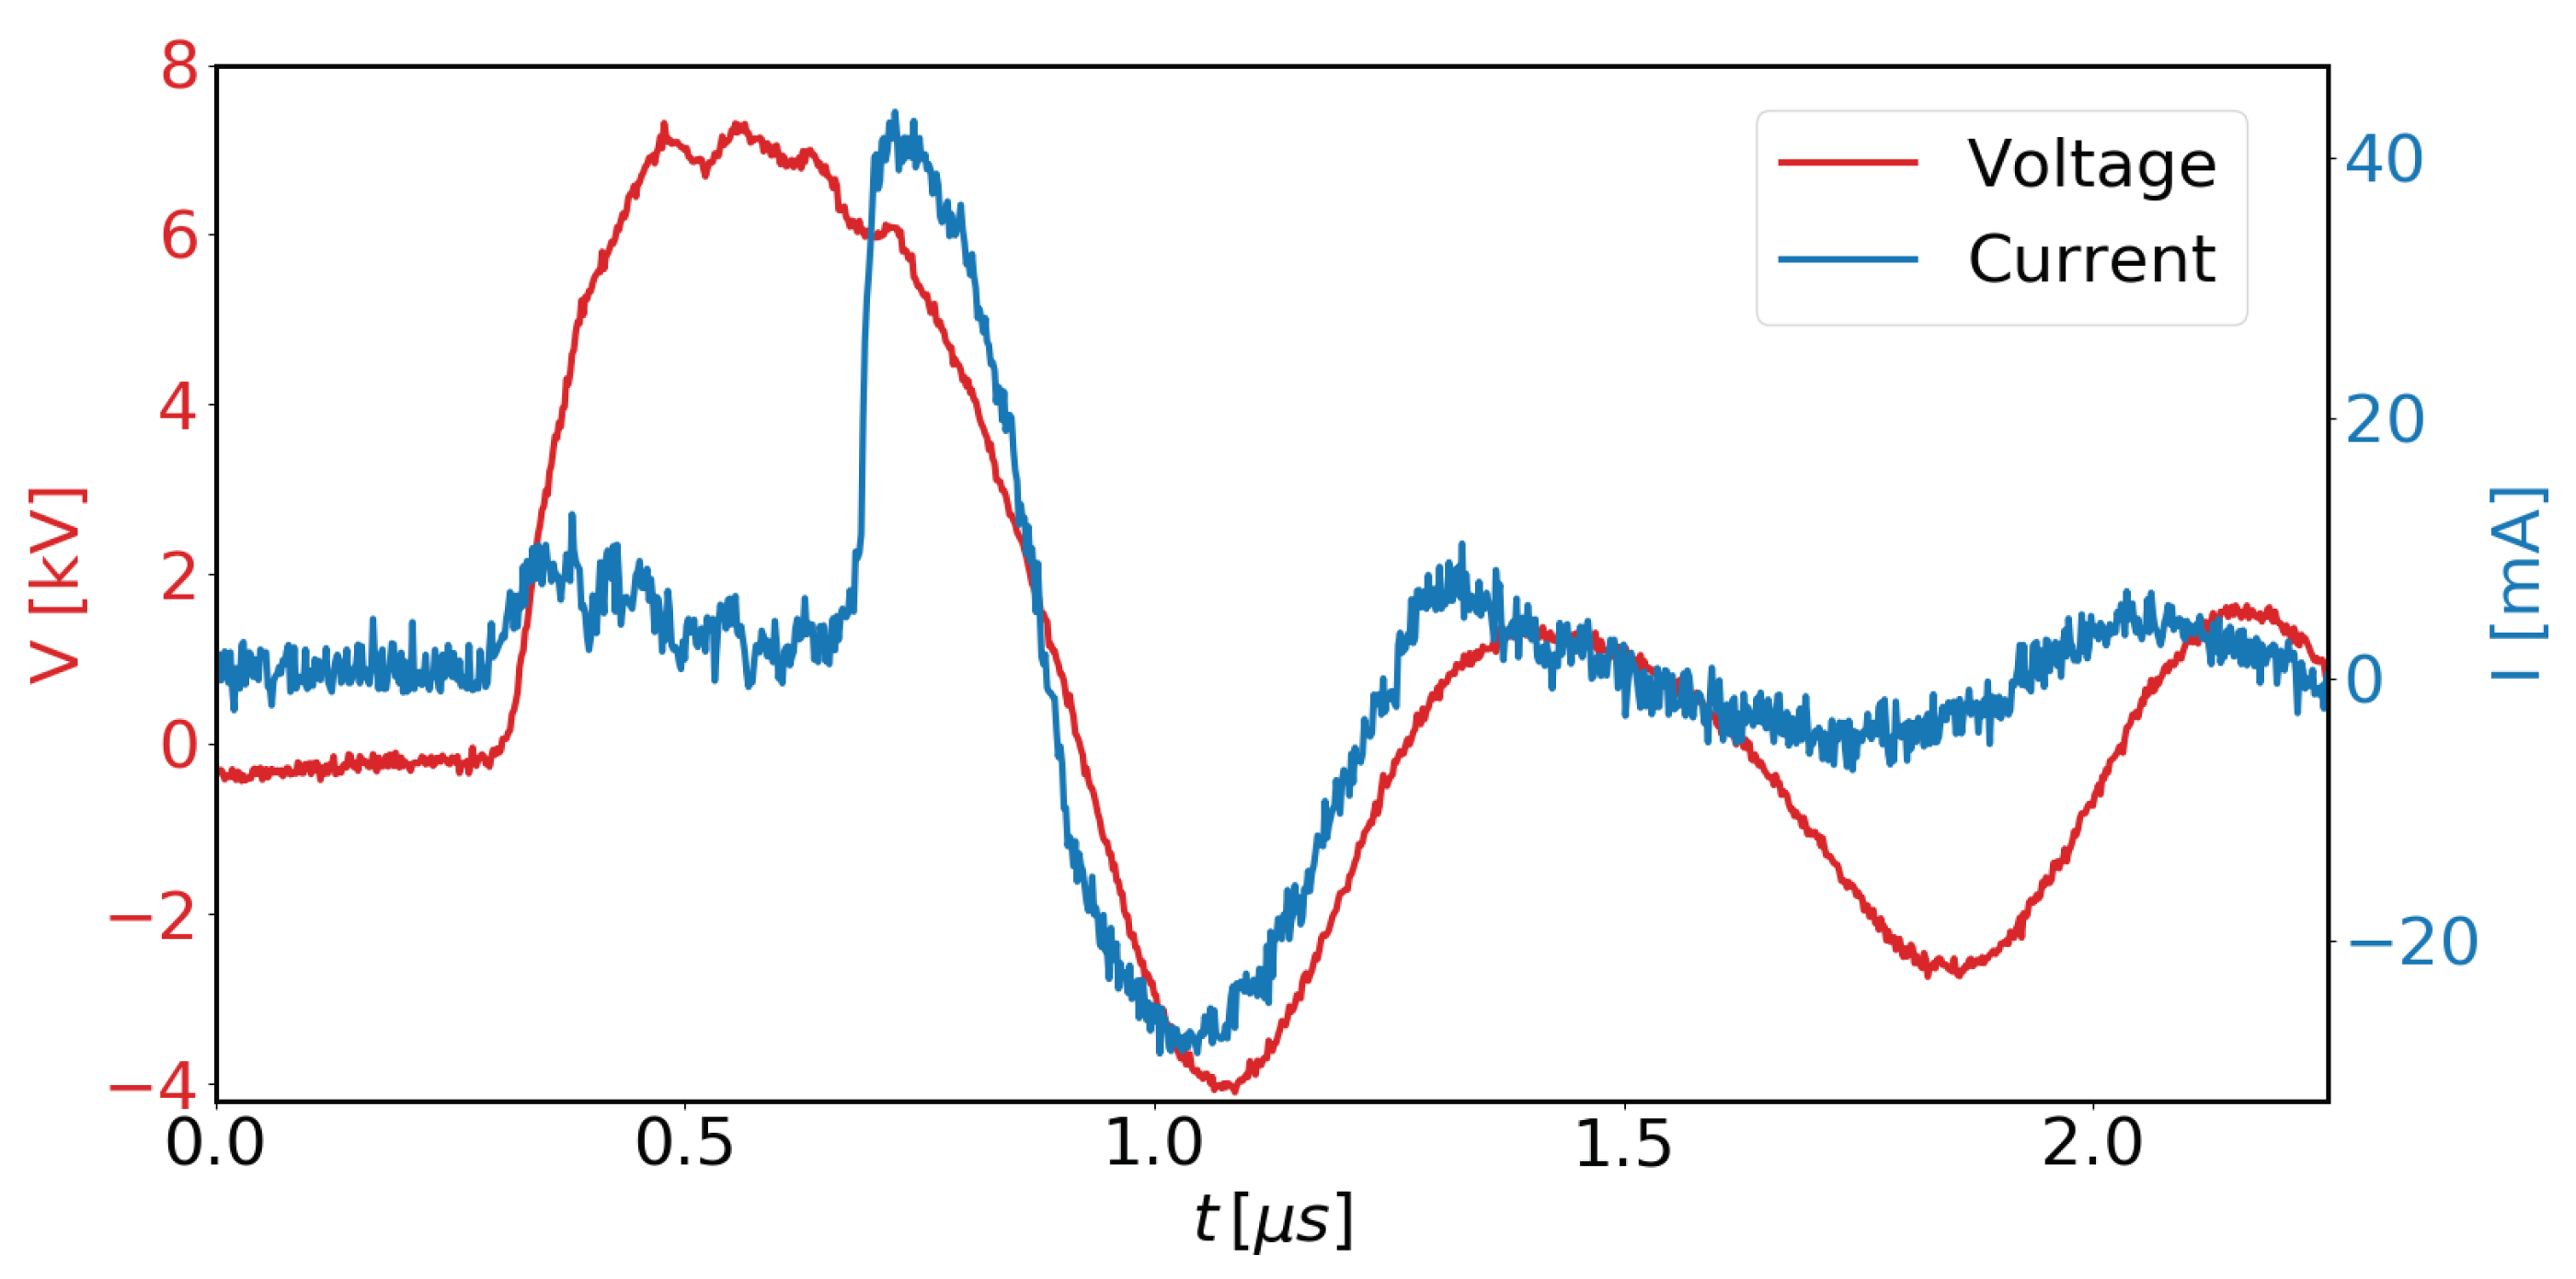
Figure 3 shows a time trace of a typical voltage pulse applied to the electrode, acquired by means of a Yokogawa DL9040 digital oscilloscope using a Tektronix P6015A HV probe. The output pulse can be modeled as a damped sine wave with a characteristic time of a few microseconds. The rising front was about 100 ns.
A user-friendly graphical interface gave the operator the possibility to easily choose the operation parameters. This makes the PCC an extremely flexible plasma source, suitable for the study and application of plasmas with different characteristics.
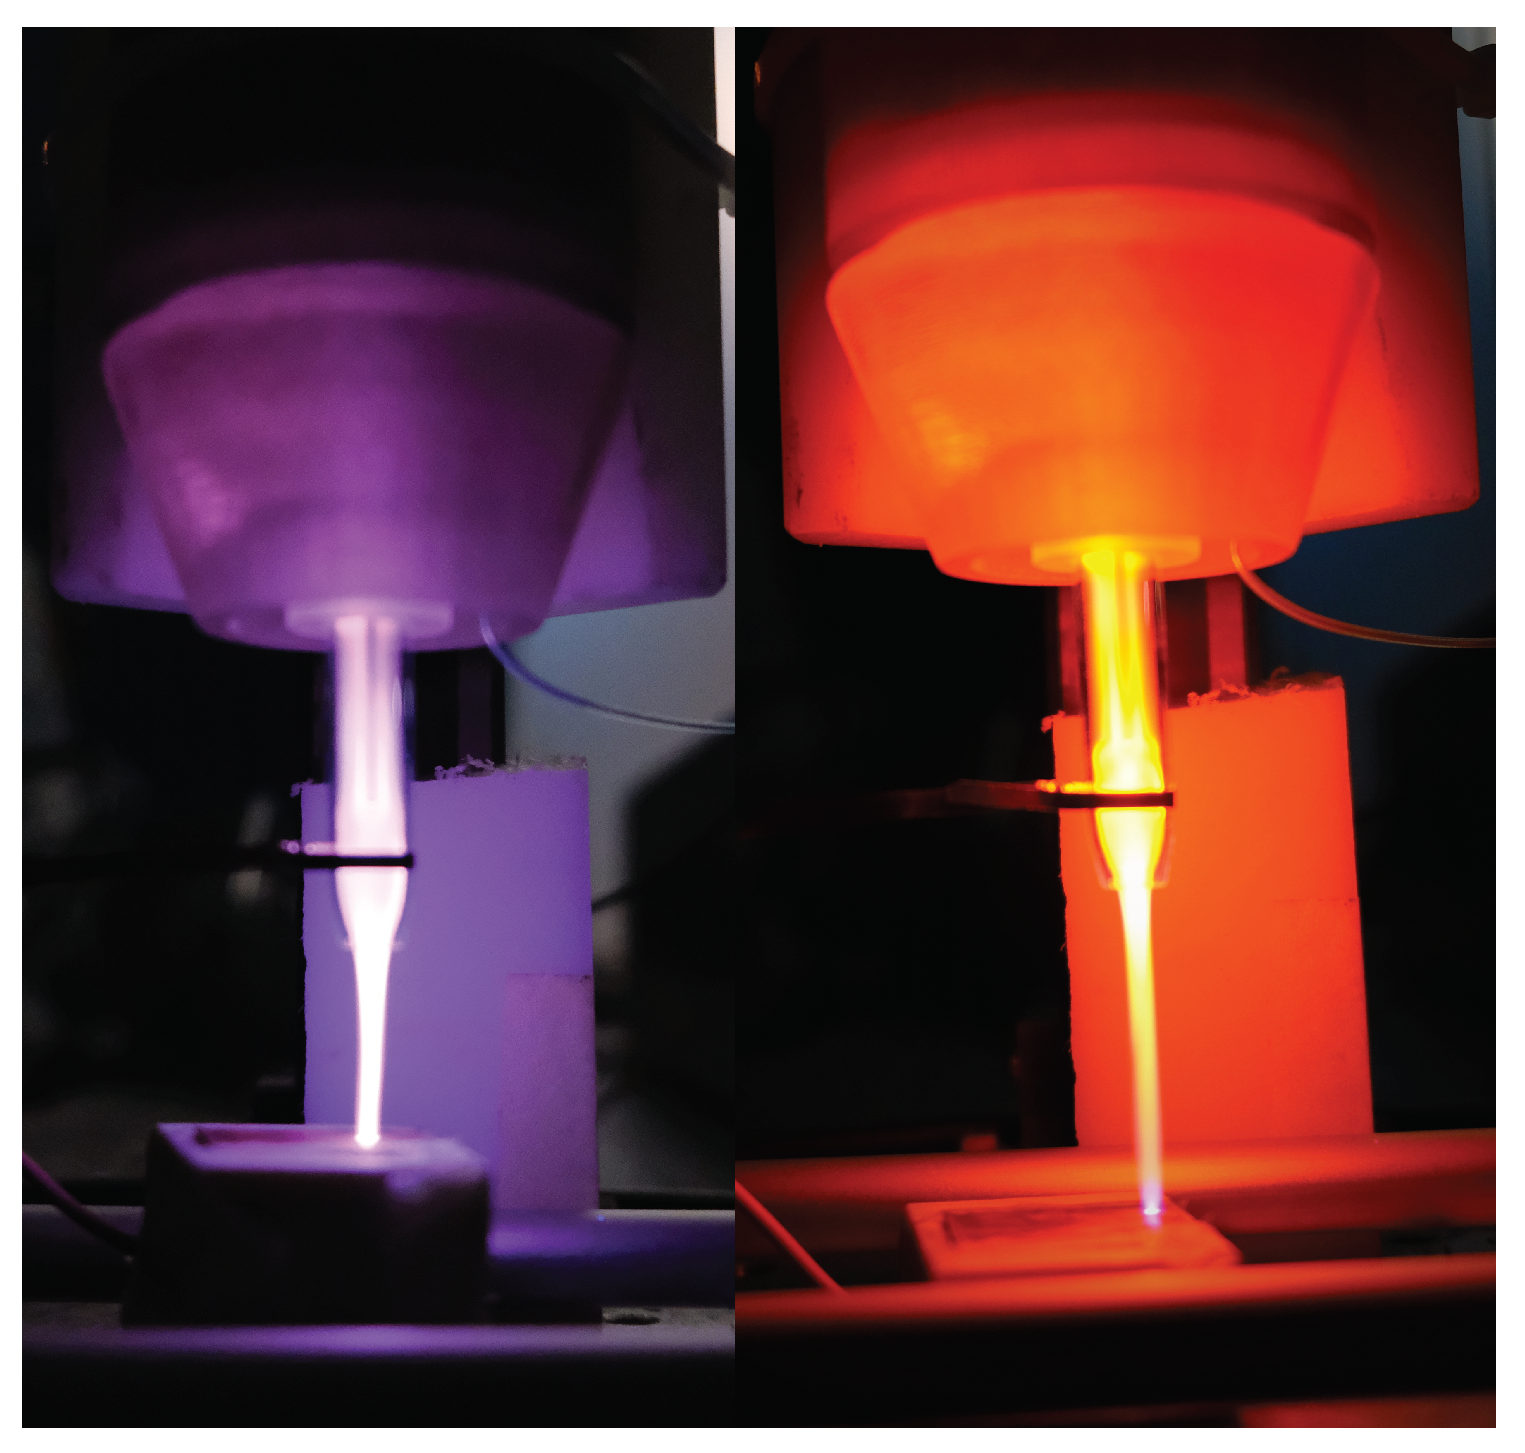
Several gases can be used on PCC to obtain stable plasma plumes. The PCC device was tested at this moment to operate with helium, neon, and argon as working gases. In this paper, analysis of helium and neon plasmas only is reported. Two photos of the plasma plumes obtained are reported in
Figure 4. In order to perform the spectroscopic and image measurements that are described in the next sections, a glass gas nozzle has been adopted instead of the “standard” 3D-printed plastic ones. Such a glass tube had an internal diameter of 6 mm and narrowed at the tip up to a diameter of 3 mm. The nozzle outlet was located about 13 mm from the electrode end.
3. Spectroscopy
The gas flushing in the source head mixed in the nozzle outlet channel with surrounding atmospheric gases; hence, large populations of chemical species were produced, including working gas excited states and the the aforementioned RONS. The scientific community agrees that the latter play an important role in the therapeutic action induced by plasma on living tissues [
10,
11,
16]. For this reason, knowledge of the plasma chemical composition is required.
In this section, the emission spectra of PCC plasmas are presented, as measured by Optical Emission Spectroscopy (OES) in the visible and near-ultraviolet range. The experimental setup consisted of a mini-spectrometer Hamamatsu C10082CAH mounted with a 2048 pixel CCD sensor S10420-1106. The spectrometer had a wavelength resolution of 1 nm and covered a spectral bandwidth between 200 and 800 nm. The system has been absolute calibrated (both in wavelength and intensity) with a Labsphere lamp in the wavelength range between 330 and 800 nm. The plasma optical emission has been collected coupling a Fused Silica (FS) fiber by means of a 25-mm, F = 4 quartz lens with magnification M = 1.
Several spectra have been acquired using both high purity (N50, 99.999% pure) helium and neon as working gases. The spectra have been acquired along a line of sight perpendicular to the plasma plume, at four different axial positions: near the central electrode (x = −5 mm), the nozzle outlet (x = 0 mm), and two positions outside the dielectric tube (namely x = 5, 10 mm). Plasmas were created in the same conditions of applied voltage and pulse repetition rate ( = 7 kV, f = 5 kHz). The gas flow was set to 2 L/min for all the measurement campaigns reported in this paper.
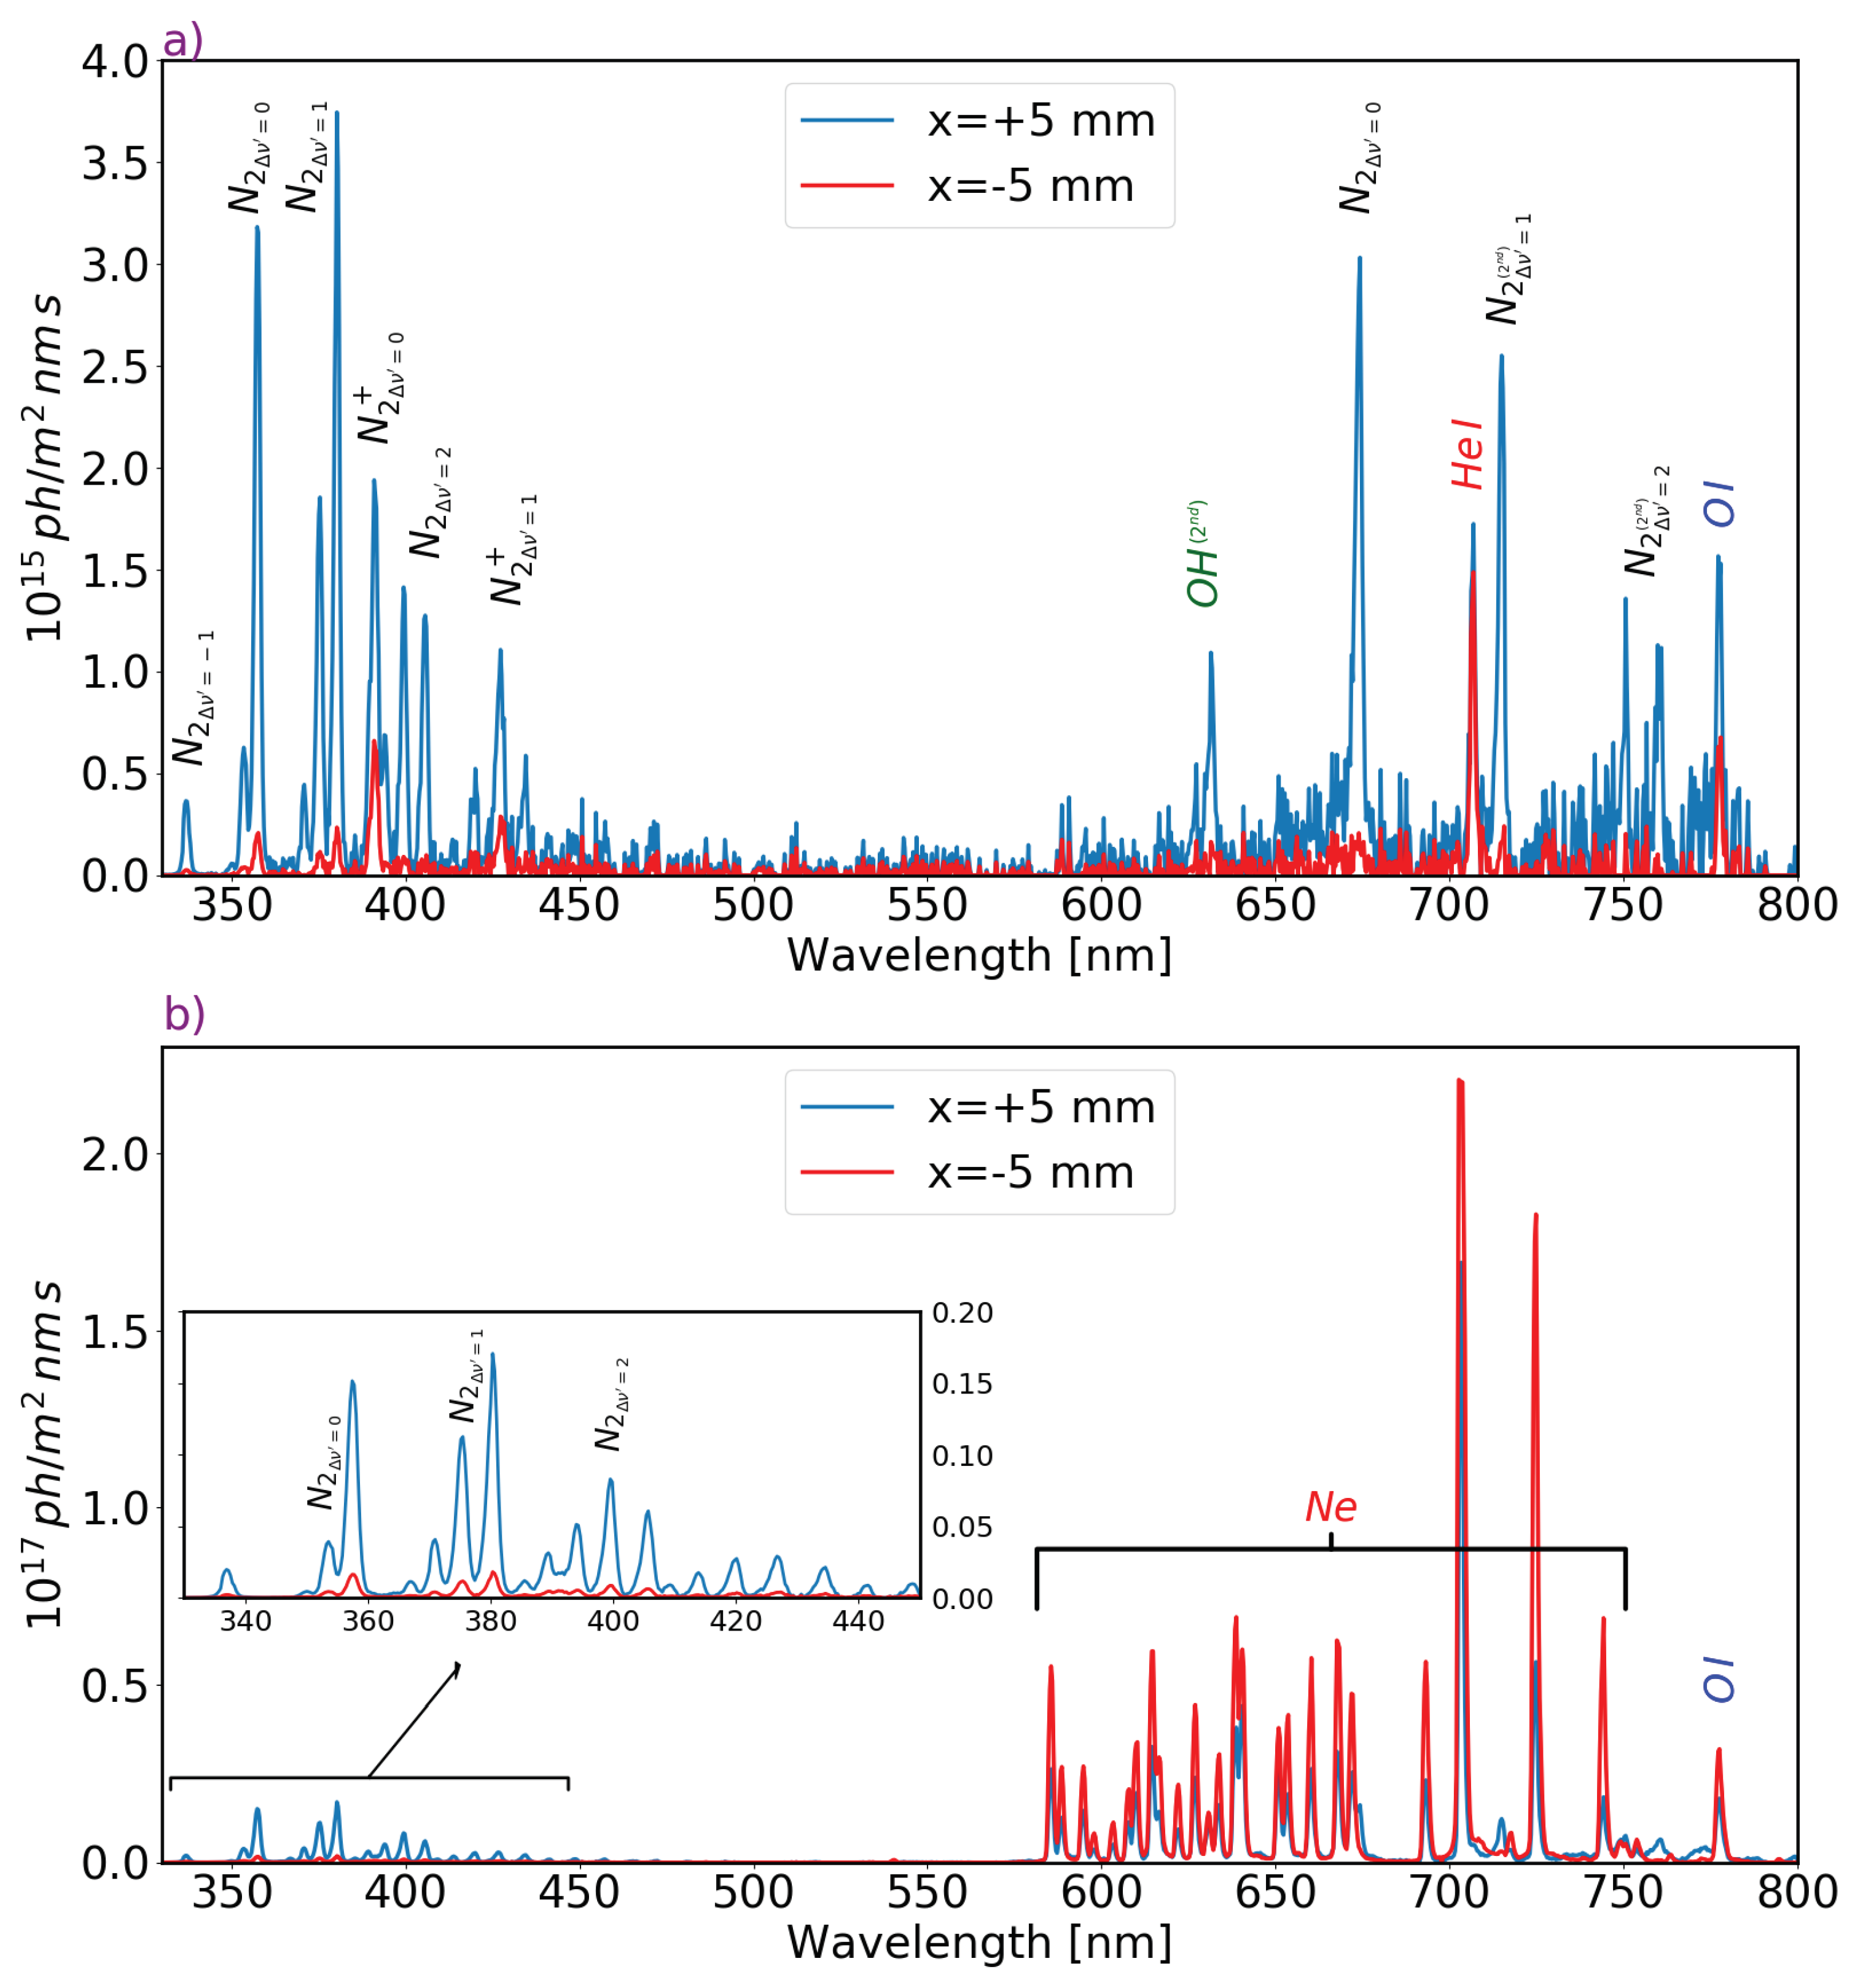
Figure 5 shows two examples of spectra acquired for both helium (top) and neon (bottom) plasmas in two different positions, inside the glass tube and outside the nozzle. The main emission lines are highlighted. In particular, in the 330–450-nm wavelength range, the Second Positive System (SPS) rotational-vibration lines of
and the First Negative System (FNS) lines of
can be recognized. In the 580–780-nm interval, the spectra present the main gas emission lines and the
emission at 777 nm. It must be noted that, in the helium plasma spectrum, the presence of
and
second order emission lines has been identified, even if an optical filter was attached to the mini-spectrometer image sensor to cut-off high order light. The presence of
and
emission lines in the plasma plume highlights the presence of RONS, whose effects on biological tissues have been widely reported in the literature [
23]. The results of the first biological tests of PCC plasma on biological samples have been recently shown in [
22], in which the effects of bacteria removal and blood coagulation were presented. In the neon plasma, we also observed the presence of
; however, it was not possible to observe
lines since all the 580–750-nm range was dominated by the
emission lines.
A remarkable variation of the spectral intensities of the nitrogen characteristic lines could be observed as the line of sight was moved along the plume axis, for both plasmas.
The relative intensity of the emission lines to the main gas grew as the distance from the nozzle exit increased. This can be interpreted as the result of diffusion in the laminar regime () of atmospheric nitrogen inside the main gas column. It should be noticed, however, that this is a qualitative result, since the line ratio cannot provide quantitative information on the mixing ratio.
It can be also observed that the intensity of the nitrogen emission lines is not negligible even within the nozzle ( mm). Using a telescope, we were confident we collected emission only from the plasma volume on the plume corresponding to the fiber image. We cannot rule out a marginal presence of stray light, but it should be orders of magnitude lower, so we assumed nitrogen lines were present a few mm inside the nozzle. Hence, we hypothesize that this could be due to the diffusion of air molecules from the external environment, since the high degree of purity of the gases (99.999% pure) led us to exclude the presence of impurities coming from the gas line. Further analyses, which are beyond the scope of this work, will be conducted to deepen this aspect.
4. Plasma Fast Imaging
Plasma has been imaged with an Intensified CCD camera (ICCD), allowing the reconstruction of the plume evolution with a time resolution down to tens of ns. The first image of the plume was obtained with a fused silica doublet (25 mm, f = 50 mm) on the surface of a quartz window MicroChannel Plate (MCP) GaAS image intensifier (ITT FS9925B); the use of FS lenses allowed the detection of radiation down to about 350 nm, where the photo-cathode response fell. The phosphor output of the MCP, which consisted of green visible light, was then acquired with a standard machine vision camera (680 × 480 pixels PoinGrey Flea 3 FW).
The frame rate of the system was limited by the camera shutter time and the triggering chain to about 20 Hz. On the other hand, the MCP was controlled with a variable-width gate signal whose minimum width was 15 ns and corresponded to the shutter time. The MCP gate generator and the HV circuit of the plasma head were triggered by a common source; the MCP was indirectly triggered through a variable delay line, in order to account for the HV coil circuit to be charged and opened (few microseconds). The jitter in the voltage waveform timing was the few ns range, allowing a precise scanning of the plume evolution.
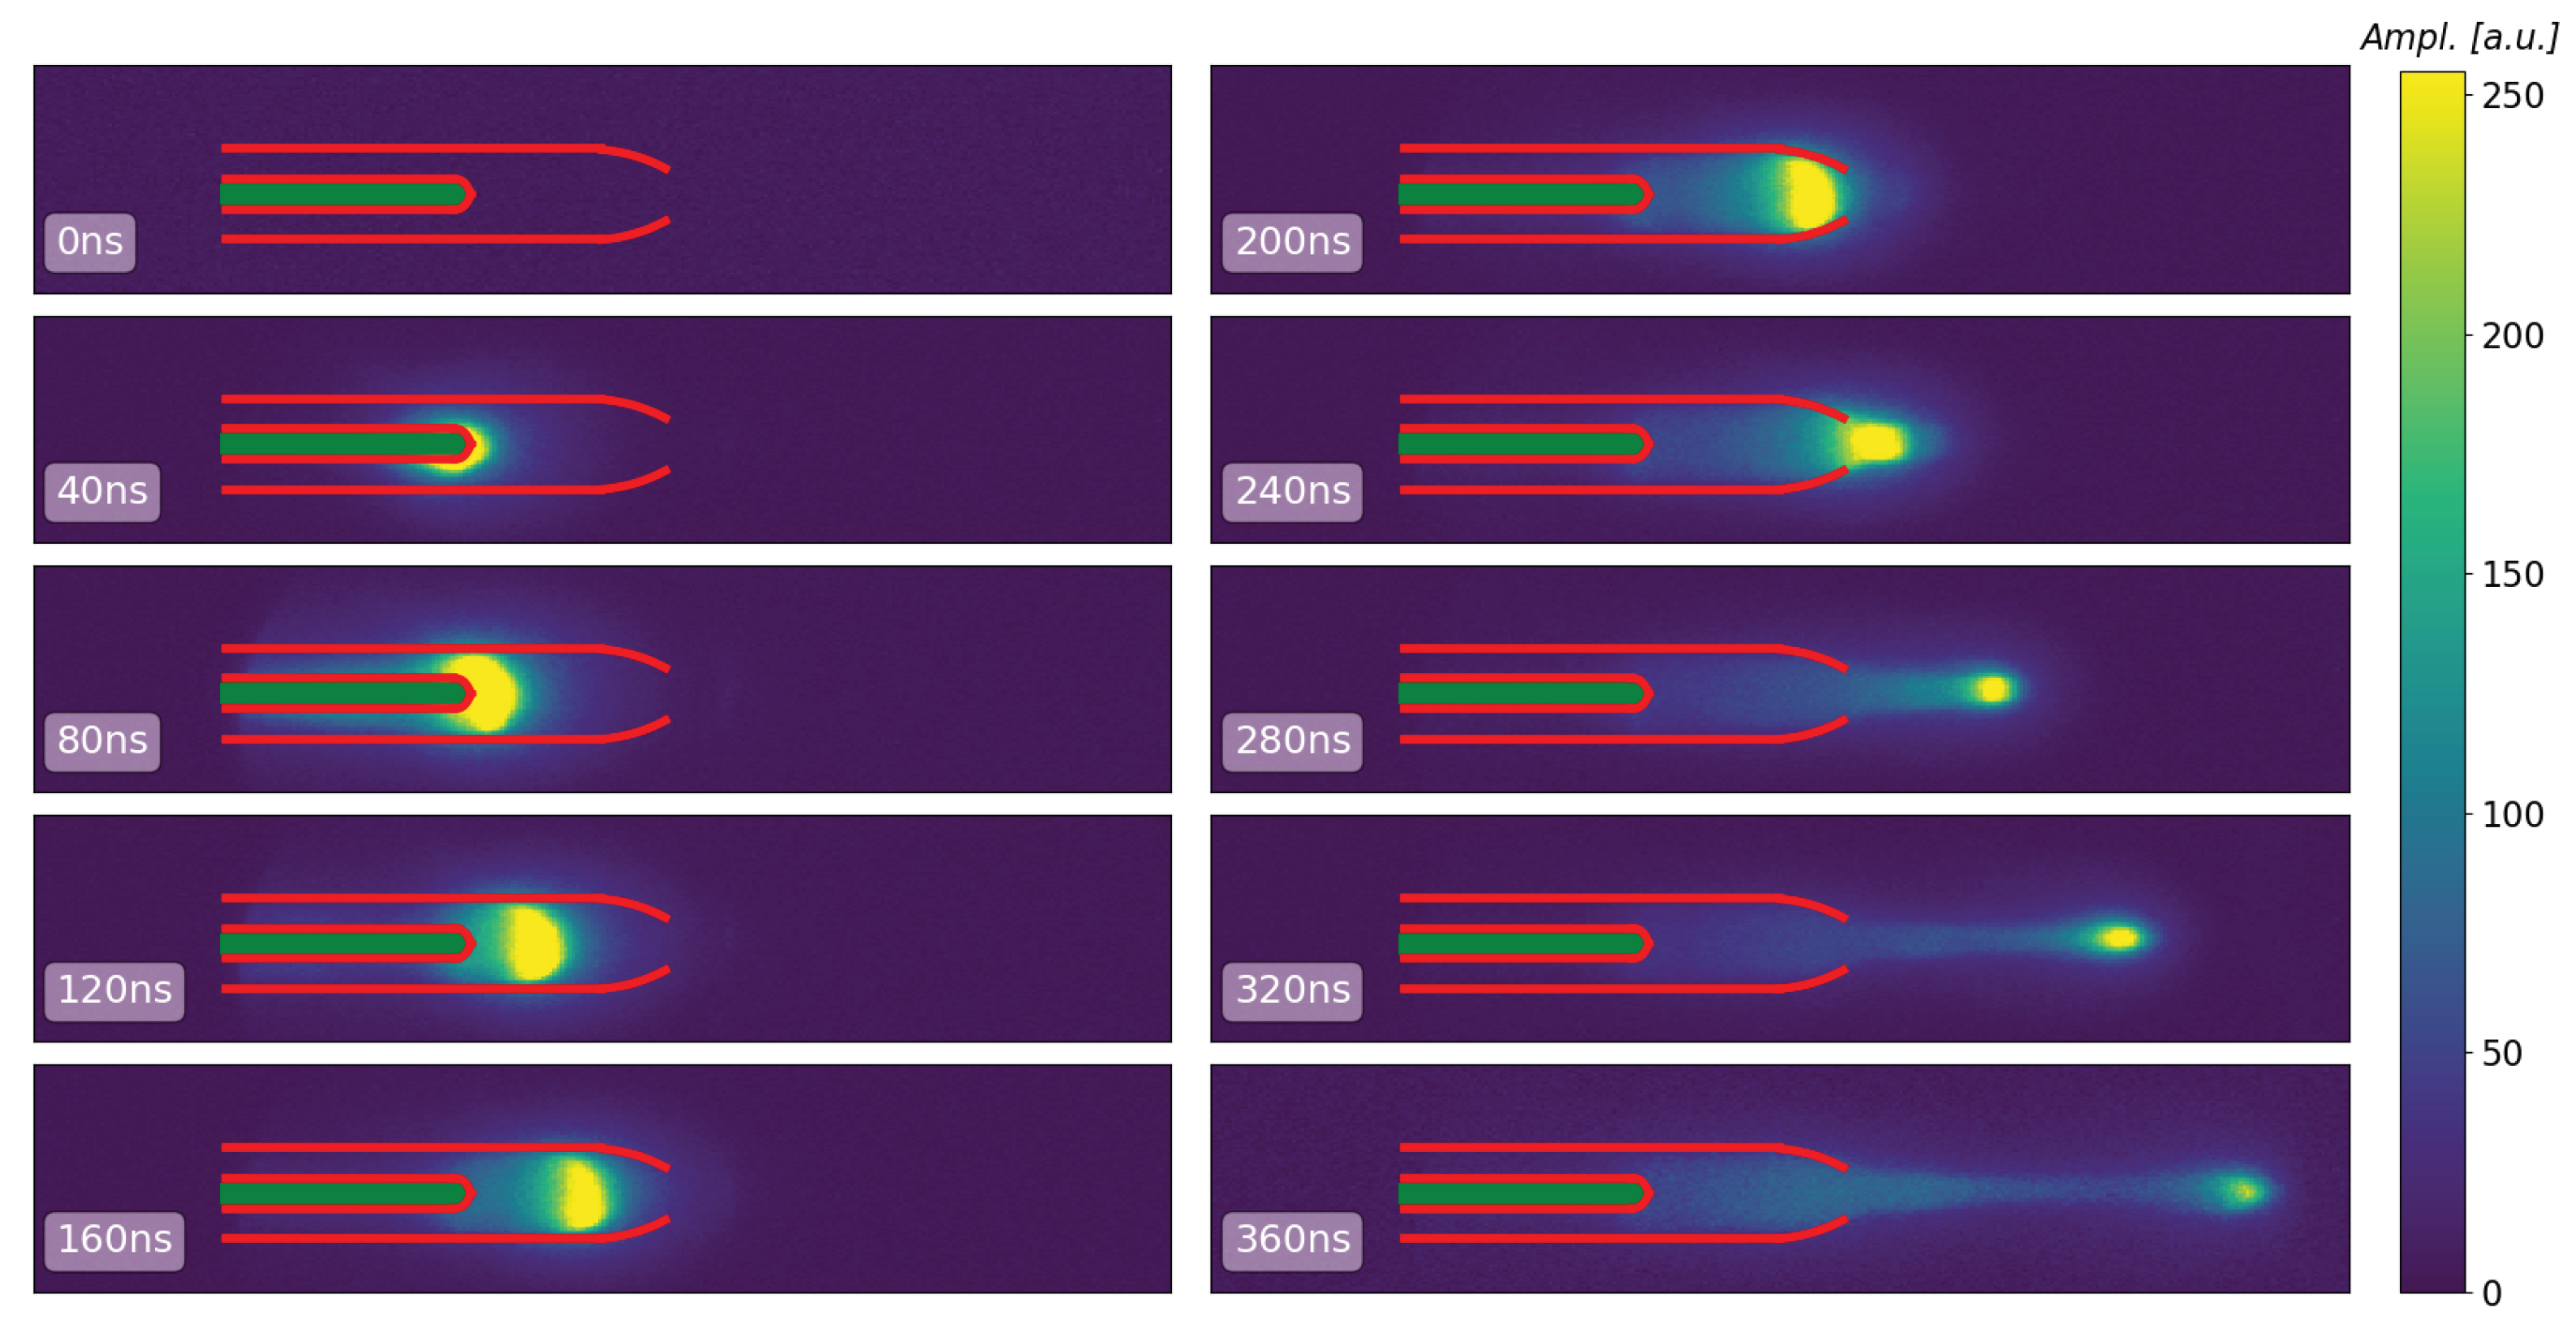
Figure 6 shows a sequence of high-speed images of a helium plasma produced by applying voltage pulses of about 7 kV. The gas flow has been set to 2 L/min. The images represent instants of time 40 ns apart from each other. In each picture, the profile of the external glass nozzle and the internal capillary covering the high voltage electrode is schematized by red lines. It appears clear that the plasma plume was not uniformly distributed in a continuous volumetric region, the plasma being concentrated in localized structures propagating from the electrode towards the outside, in the same direction as the gas flow [
24]. These structures are now generically known as Pulsed Atmospheric-pressure Plasma Streams (PAPS) [
25].
It was observed that plasma was initially formed just around the electrode end, for a minimum voltage of about 4.5 kV. The luminous region then grew in size and brightness until, as soon as its diameter reached the inside nozzle diameter, it was expelled towards the outside. Inside the nozzle, the streamer showed a D-shape, while in the external environment, it took on an ellipsoidal shape. Such a plasma streamer ended, gradually decreasing both in size and luminosity intensity, somewhere in the air outside the nozzle. A secondary discharge, which seemed to not propagate, appeared on the electrode during the negative phase of the voltage pulse, but will not be discussed here.
The PCC source produced a plasma plume up to about 5 cm long. It must be observed that these streamers were not completely decoupled with respect to the voltage electrode. In fact, a continuous volumetric plasma, with a lower emission, existed between the plasma streamer and the central electrode, as can be seen in
Figure 6. This continuous plasma represents an electrical conduction channel that keeps the streamer head connected to the electrode.
A similar experiment was conducted in the presence of a copper target, in order to measure the current carried by the plasma plume. This target, 1 cm
in size, was connected to the ground potential through a 1 k
resistor. The electric current was thus measured as a voltage differential at the ends of the resistor.
Figure 3 presents the current measured on such a metal sheet, along with the voltage measured on the primary HV electrode. A peak current was observed at about 0.7
s, which was coincident with the arrival of the plasma stream on the copper plate. Such a peak was due to the interaction of a conductive channel behind the streamer head to the target plate. That is, the streamer was associated with a fast ionization wave propagating very fast, as already discussed in recent literature [
25,
26,
27].
An estimate of the power deposited on the plasma can be obtained from the product of the voltage and current curves shown in
Figure 3. The power thus measured, which was an overestimation of the one actually deposited on the plasma, provided peak values of about 300 W, while the average power was approximately 30 W. The measured power, taking the same charging time (discussed in
Section 2) and pulse repetition frequency, was always less for neon than helium (typically 60% less).
An estimate of the streamer position has been made by identifying the center of mass of the emissive region, selecting only the points whose brightness was above a threshold level.
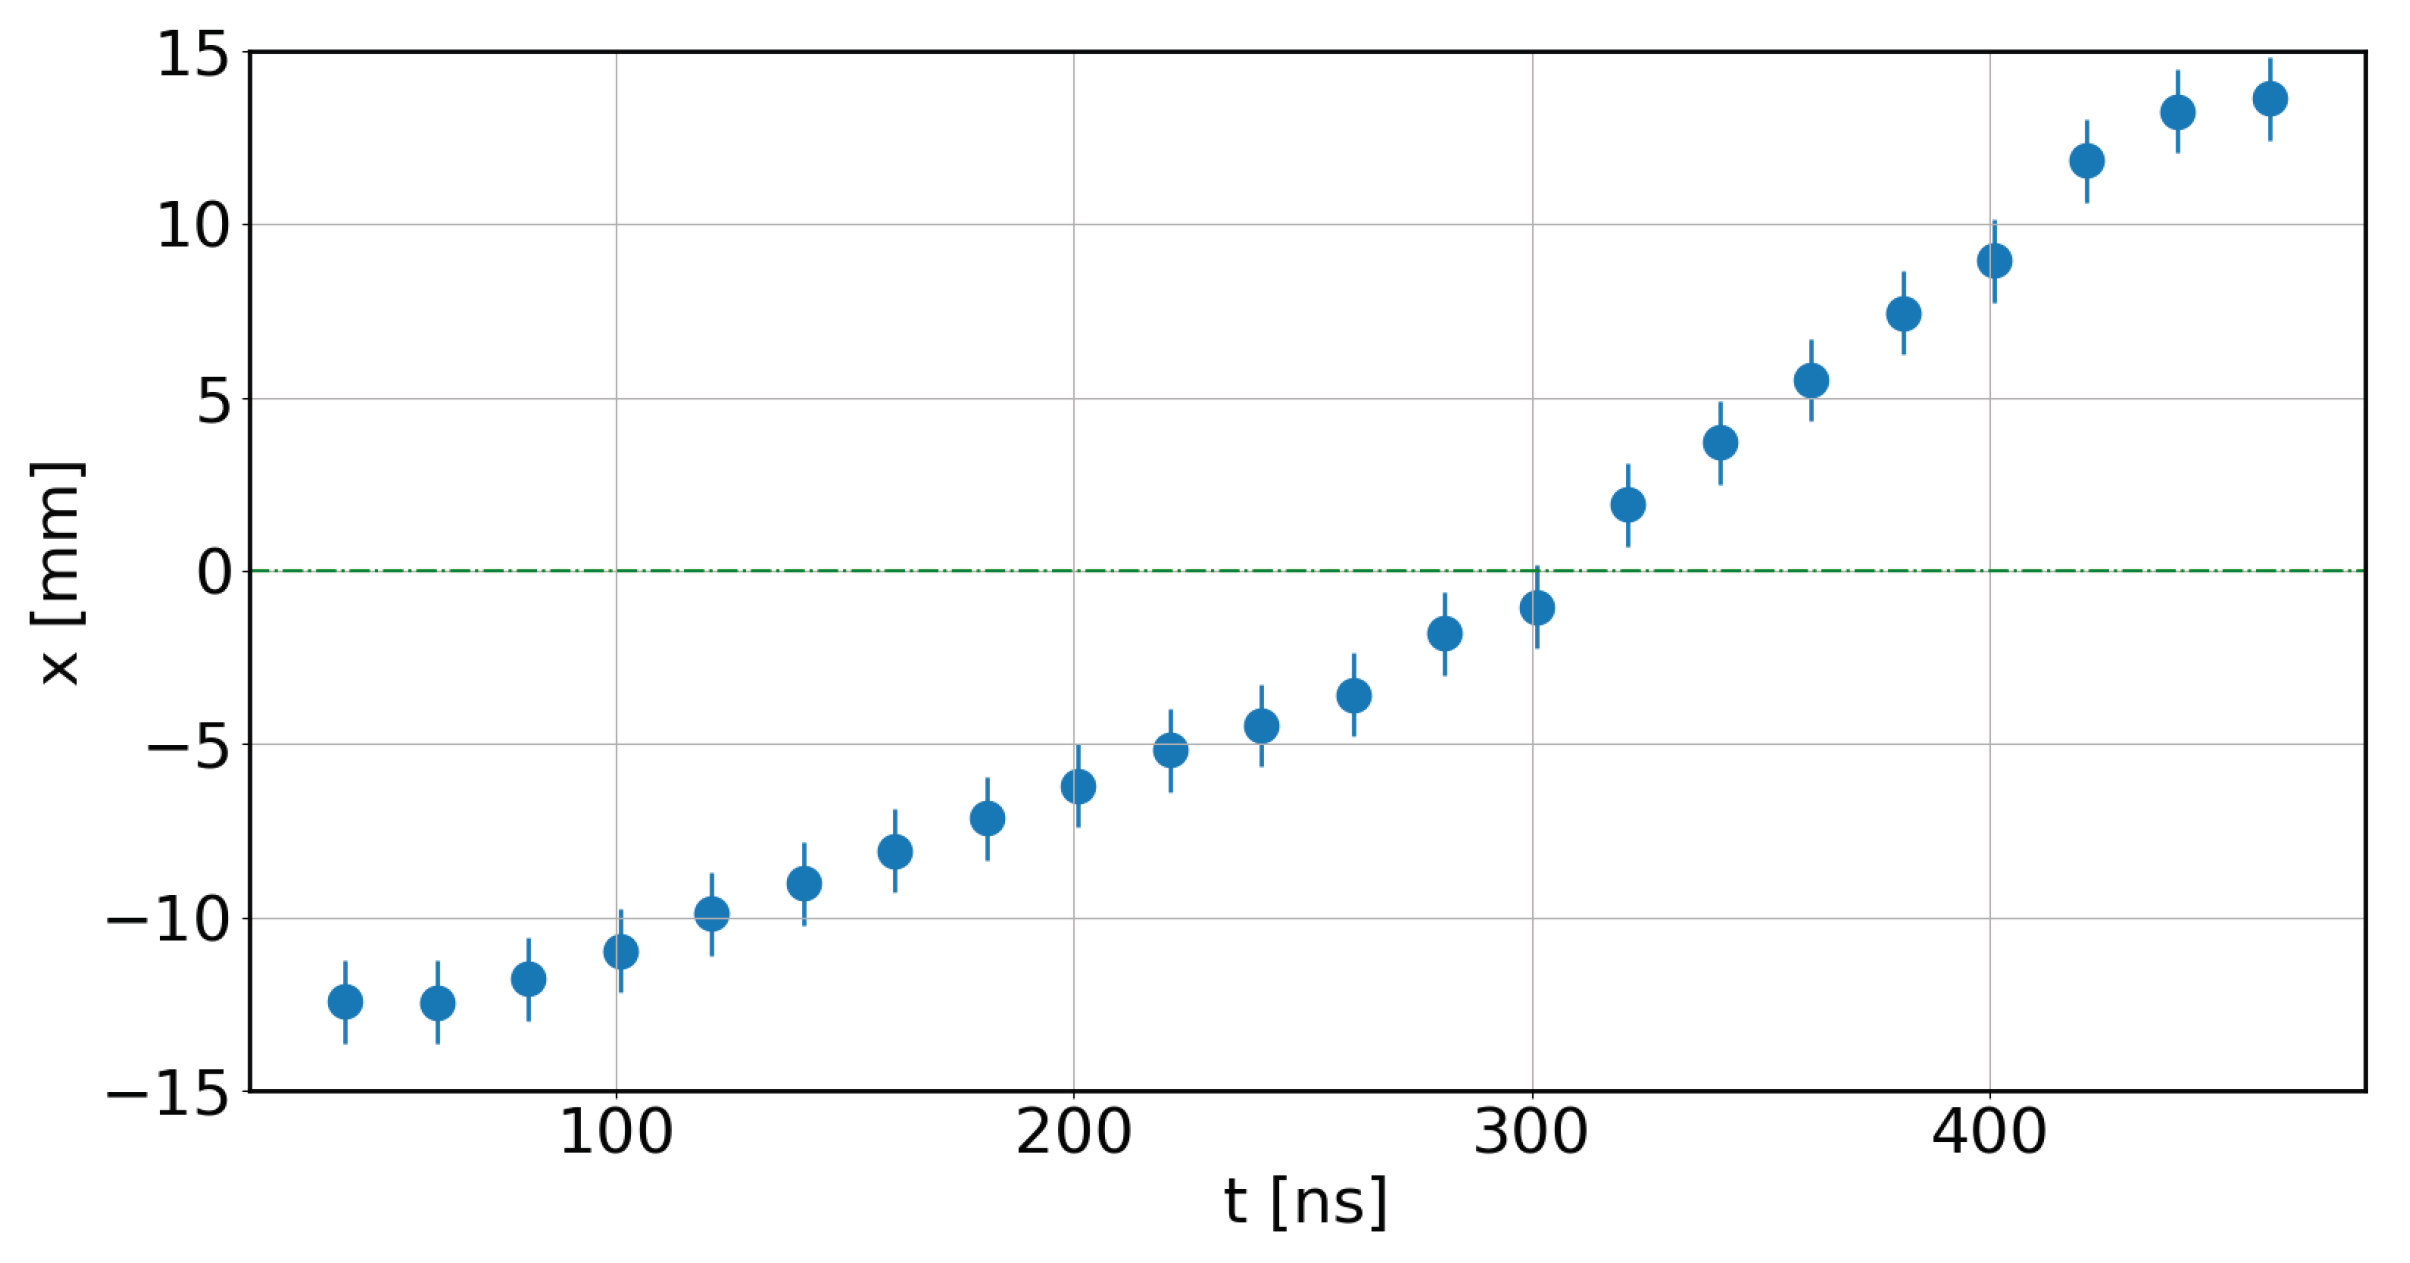
Figure 7 shows such a position as a function of time for a helium plasma without any target, by applying a peak voltage
kV. The uncertainty on the streamer position was mainly due to the limited resolution of the image intensifier and the vision camera. It was observed that the streamer was ejected at an approximately constant speed inside the nozzle (
km/s). At the nozzle exit, the plasma streamer rapidly increased its velocity as soon as it entered into the surrounding room air. This speed was maintained almost constant (
km/s) for about one centimeter, after which the stream slowed down quickly before dissolving, as the applied voltage decreased to a value of about 4 kV. This acceleration has already been observed, and it has been associated with the diffusion of ionized nitrogen molecules in the helium column [
28]. This is in agreement with the emission intensity increase of the
and
lines that we have observed.
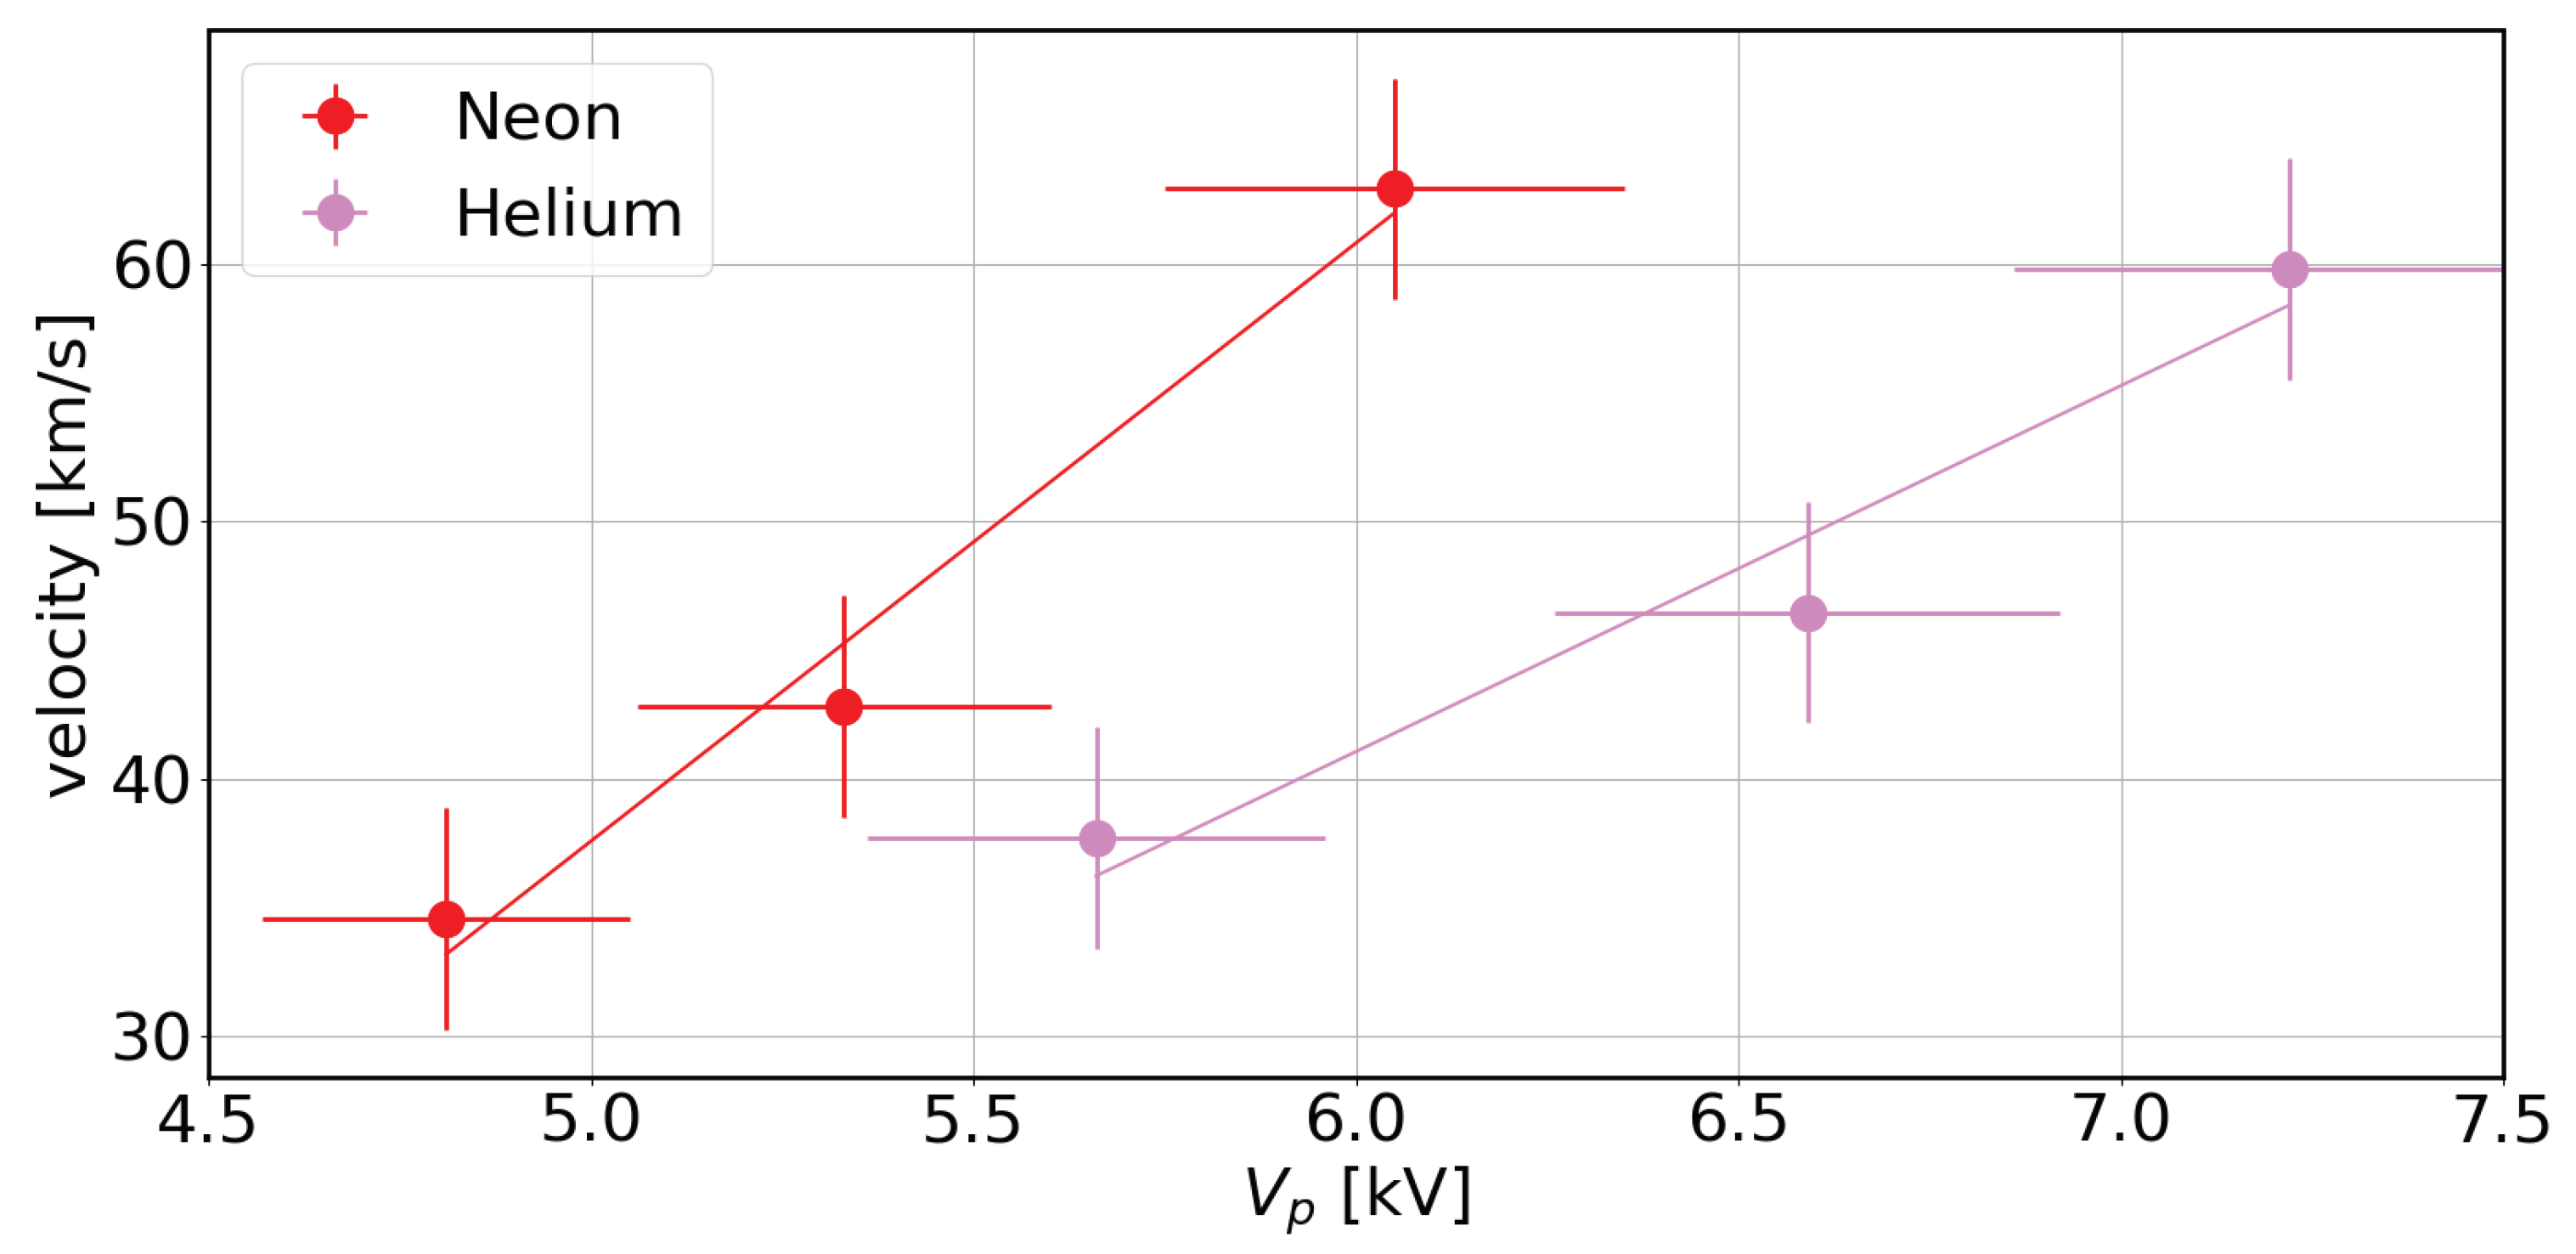
Several measurement campaigns have been conducted by varying the maximum applied voltage. It was observed that the propagation speed of the bullet, estimated inside the glass tube, increased as the applied voltage increased, as shown in
Figure 8. Furthermore, such a streamer velocity was, for the same applied voltage, higher for the neon than the helium plasma. This observation has led us to verify whether the streamer propagated at the ion sound velocity, which depends inversely on the square root of the ion mass
[
29]. Since the ion temperature can be neglected in such a plasma, the electron temperature
only must be estimated in order to be able to carry out this verification (
).
The BOLSIG+ code, a Boltzmann equation solver for electrons in weakly-ionized gases [
30], has been used to obtain electron transport and collision rate coefficients from cross-section data. Electron-neutral collision cross-sections versus electron energy for pure helium and neon plasmas, listed in
Table 1, have been taken into account. Several quantities have been estimated as a function of the reduced electric field
, that is the ratio of the electric field
E to the concentration
N of neutral particles. In this regard, the lower limit to
has been set considering a uniform electric field between the inner electrode and the substrate to be treated (
7 kV/3 cm,
8 Td). If we instead assumed the streamer as a propagating conductor whose front had a finite curvature radius of ≈3 mm,
went up to ≈50 Td; hence, the BOLSIG+ simulation was performed in the
range between 5 and 50 Td. This range can indeed be reasonable, given that it has been experimentally confirmed, by means of the Stark polarization spectroscopy method, in a helium plasma source analogous to the PCC [
31].
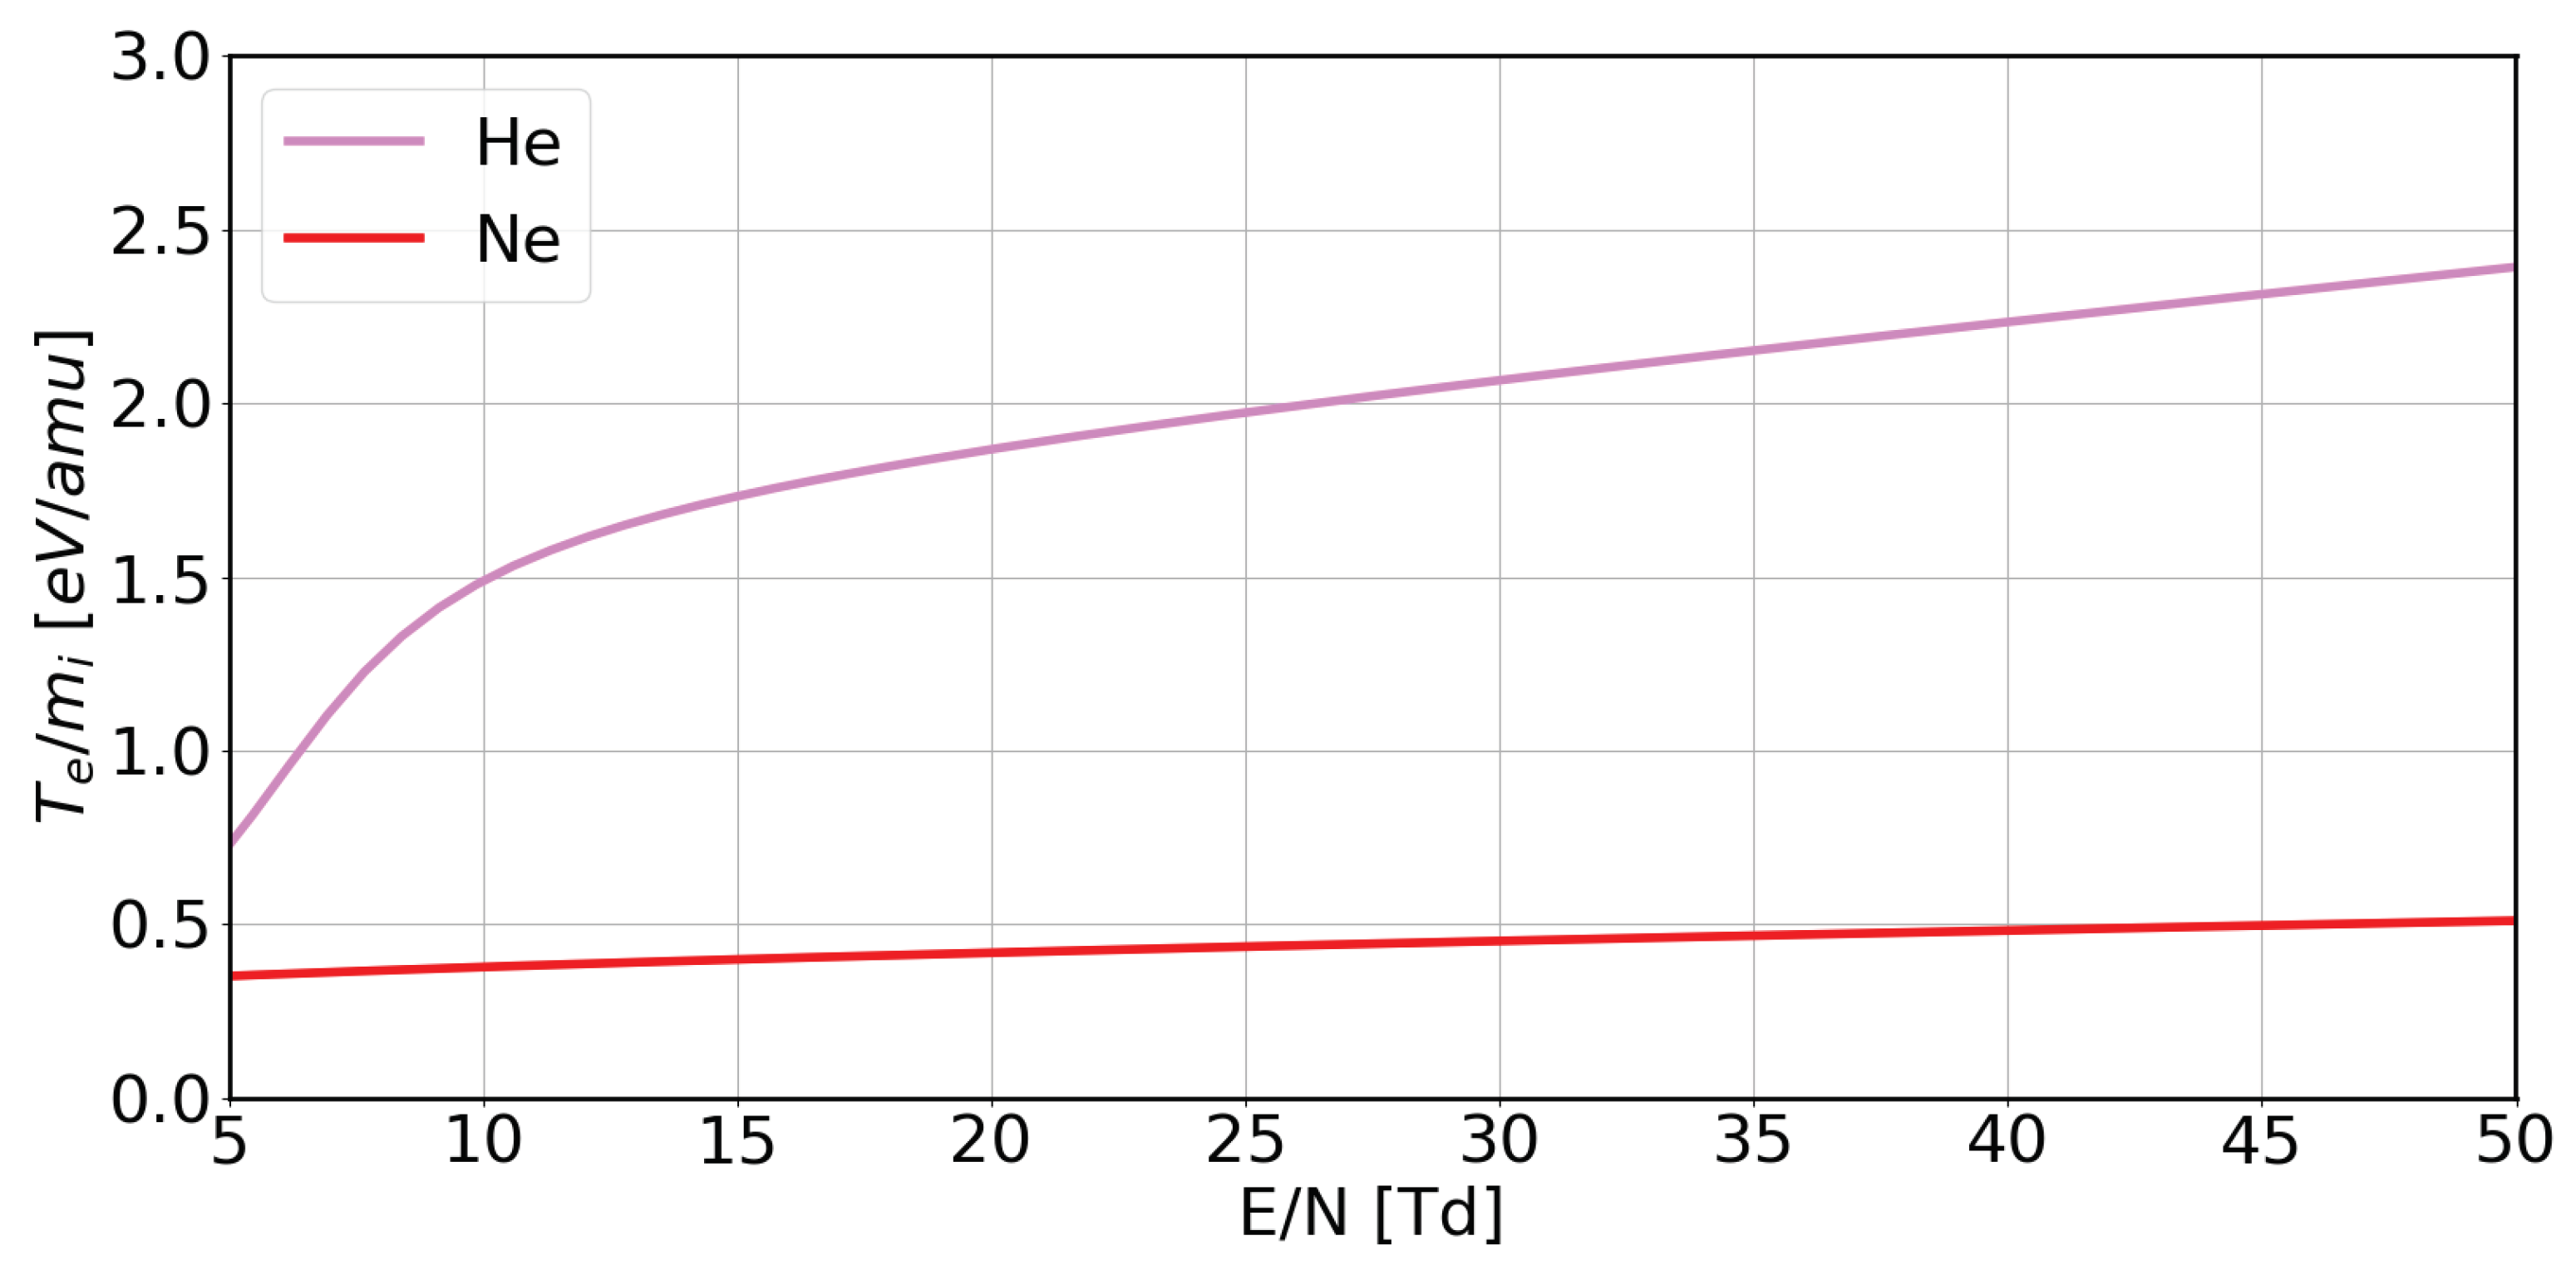
Figure 9 shows the ratio of the electron temperature to the ion mass
for pure helium and neon plasmas, as estimated by BOLSIG+. It can be observed that helium had a higher
value with respect to the neon, for all values of the reduced electric field range. This confirms that the streamer did not propagate to the ion sound velocity; otherwise, we would have observed higher streamer propagation velocities in helium plasmas than those in neon.
Another quantity we have tried to estimate is the electron mobility
, in order to verify a possible correlation between the streamer propagation and the electron drift velocity
.
Figure 10 shows such a quantity for both helium and neon plasmas. It can be observed that the neon electron mobility was higher with respect to the helium one, as well as the streamer propagation speed, when the same voltage was applied to the HV electrode (see
Figure 8). It should also be noted that, in the considered interval of
(5:50 Td), the ratio of the neon to the helium electronic mobility varied in the range between 1.38 and 1.61. The experimentally-observed neon-to-helium streamer velocity ratio was about 1.45. This result provides an indication that the streamer behaves like an ionization wave whose propagation speed is proportional to the electron drift velocity.
It must be observed that, on the other hand, the correlation between the streamer velocity and the electron mobility cannot be inferred in a strictly quantitative way, lacking any measurements on the electric field in the streamer proximity of PCC plasma and hence in the value of the reduced electric field . We must also consider that the BOLSIG+ code assumes that the electric field is uniform; as the system had a cylindrical symmetry; this condition is only a local approximation. Furthermore, the considerations made on the electronic mobility that have been presented concern only plasmas of pure helium or neon only, without taking into account the effect of the air molecules mixing with the main gas. Hence, we intend to carry out, as future work, new simulations that better take into account the chemistry of the plasma plume and the source geometry. It also seems clear that a local measure of the local field must be made, in order to better understand the dynamics of streamer propagation in the plasma plume.
5. Conclusions
Emission spectra and fast camera imaging of the PCC atmospheric plasma source have been presented, for both helium and neon plasmas, showing spatial dependence of emissivity and streamer velocity along the plasma plume.
The characteristic plasma emission lines have been shown, highlighting the presence of RONS, considered the main candidate for the therapeutic action of plasma on biological tissues. It was also observed that the nitrogen contribution to the emission spectra increased along the plume, as could be expected as a consequence of diffusive mixing of ambient gas.
The fast ICCD imaging of helium and neon plasmas has shown the production of streamers, known as pulsed atmospheric pressure plasma streams, which propagate at high speed (several tens of km/s). The analysis of such streamer dynamics led, by comparison with the plasma parameters produced by the BOLSIG+ code, to verifying the proportionality between the PAPS propagation speed and electron drift velocity.
The rapid streamer velocity increase along the plasma plume has been also observed at the nozzle exit, where the surrounding atmospheric air mixed with the column of the main gas coming from the source head.
Further analyses will be carried out to determine the local electric field along the plasma plume. Besides that, other measurements will be performed to understand how the streamer dynamics is linked to the source geometry and to the chemical and physical properties of the plasma.

 ,
, 


