Article

Room Temperature Surfactant-Free Synthesis of Cobalt-Doped CaMoO4 Nanoparticles: Structural and Microstructural Insights

ERSIC Research Group, Department of Chemistry, Polydisciplinary Faculty of Beni Mellal (FPBM), Sultan Moulay Slimane University (USMS), Mghila, P.O. Box 592, Beni Mellal 23000, Morocco
*
Author to whom correspondence should be addressed.
Ceramics 2025, 8(3), 110; https://doi.org/10.3390/ceramics8030110
Submission received: 7 July 2025 / Revised: 19 August 2025 / Accepted: 28 August 2025 / Published: 31 August 2025

Abstract

This study reports the successful synthesis of pure cobalt-substituted calcium molybdate powders (Co-doped CaMoO4) through a co-precipitation method conducted at room temperature, without the use of surfactants or hazardous organic solvents. The formation of solid solutions with x values ranging from 0.00 to 0.08 was confirmed by X-ray diffraction, Rietveld refinement, and Raman spectroscopy analyses. Elemental analysis using energy-dispersive X-ray spectroscopy showed a strong correlation between the experimental and nominal stoichiometries. The synthesized molybdate powders consist of micrometer-sized particles exhibiting diverse morphologies, including microspheres, flower-like architectures, and dumbbell-shaped particles. These agglomerates are composed of primary particles smaller than 43 nm. The specific surface area increased from 3.59 m2/g for the undoped CaMoO4 to 10.74 m2/g for the 6% Co-doped CaMoO4. These nanostructured powders represent promising host materials for 4f ions, making them potential candidates for solid-state lighting applications.

1. Introduction

Metal molybdates with the general formula AMoO4 have a wide range of industrial and technological applications. Due to their excellent structural, electronic, thermal, and optical properties, these compounds are widely used in several cutting-edge fields. In particular, they serve as electrode materials in lithium-ion batteries, active media in lasers, host matrices for phosphors, scintillation detectors, humidity sensors, microwave systems, as well as in catalysis and photocatalysis [1,2,3,4,5,6,7,8,9]. Among these compounds, alkaline earth molybdates such as CaMoO4 have attracted intense interest over the last decade due to their excellent and tunable properties. The crystal structure of molybdates with the general formula AMoO4, where A is an alkaline earth metal cation, strongly depends on the ionic radius. Smaller cations such as Mg2+ (r(A2+) ≤ 0.99 Å) lead to the formation of wolframite-type monoclinic structures (space group P2/c), where both A2+ and Mo6+ are in octahedral coordination. In contrast, larger cations such as Ca2+, Sr2+, and Ba2+ (r(A2+) ≥ 0.99 Å) stabilize the scheelite-type tetragonal structure (space group I41/a), characterized by eightfold oxygen coordination for A2+ and tetrahedral coordination for Mo6+ [10,11].
However, despite their intrinsic advantages, the performance of AMoO4 molybdates remains limited in certain applications, notably due to their poor visible light absorption and inefficient photoinduced charge separation. To overcome these limitations, several studies have shown that their properties can be significantly enhanced by a targeted doping strategy, aimed at introducing foreign ions into the matrix in order to modify their electronic structure, band gap, and crystalline structure [12].
For example, Dixit et al. demonstrated that introducing Eu3+ and Mn2+ ions into the CaMoO4 matrix modifies the local structure, reduces the band gap, and improves its luminescence properties [13]. These authors showed that the photoluminescence properties of rare-earth ions can be tuned by Mn2+ co-doping through modulation of the energy transfer between activators and sensitizers within the host lattice. Phuruangrat et al. reported that doping CaMoO4 with Ce3+ induces a structural modification, marked by a reduction in crystallite size, and improves its photocatalytic activity due to better charge separation and an increase in specific surface area [14]. Jeseentharani et al. prepared nanocrystalline Ca1−xCoxMoO4 (where x = 0, 0.3, 0.5, 0.7, and 1) using the co-precipitation method followed by heat treatment at 500 °C for 5 h. However, regardless of the composition, the samples are composed of a mixture of monoclinic CoMoO4 and tetragonal CaMoO4 phases, which are less suitable for certain functional applications [15]. Moreover, these studies are generally limited to basic structural characterization by the XRD technique, without Rietveld crystallographic refinement, which prevents a fine understanding of doping-induced distortions in the crystal lattice. They also neglect the effects of low-concentration doping (x ≤ 0.08), which is crucial in real devices, where structural stability and compatibility with the host material architecture are essential.
It has been shown that the physical and chemical properties of molybdate materials can be tuned by controlling their size and particle shape. Therefore, desired properties can be achieved by adjusting the microstructural parameters. This explains the significance of research groups’ interest in developing innovative synthesis methods aimed at producing molybdate powders with controlled size, morphology, and specific surface area. Solid-state reaction, while being a simple process, requires temperatures in excess of 800 °C, which can induce non-stoichiometry and chemical inhomogeneity, in addition to the difficulty in controlling particle size and morphology [16,17]. Other approaches, such as crystal growth methods like Czochralski, Bridgman, or flux evaporation [18,19,20], enable the production of high-quality, single crystals but require expensive, sophisticated equipment and demanding maintenance. These issues can be addressed using wet chemical approaches, such as sol–gel, hydrothermal or solvothermal methods, co-precipitation, molten salt synthesis, microemulsion, polymeric precursor processes, or electrochemical and sonochemical methods [21,22,23,24,25,26,27,28,29]. In this context, the co-precipitation method stands out for its simplicity, low cost, and ability to produce homogeneous powders at room temperature. It also allows good control over morphology, grain size, and specific surface area by adjusting the process parameters (e.g., temperature, pH, and precursor sources).
Numerous recent studies have reported the synthesis of a wide variety of nanometric morphologies of metal molybdates, including nanospheres, nanorods, octahedra, peanuts–dumbbells-like structures, and nanoflowers [30,31,32]. These structures are generally obtained through methods involving the use of surfactants, or capping agents, which serve to facilitate crystal growth or promote the self-assembly of nanoparticles. However, these approaches present drawbacks, particularly in terms of cost, toxicity, and implementation complexity.
In this work, we report the preparation of nanocrystalline Co-doped CaMoO4 materials (with Co content ≤ 8 at.%) using a room temperature co-precipitation method, without the use of harmful surfactants or toxic organic solvents. This study examines the effect of moderate Co2+ doping on the structural and microstructural properties of CaMoO4. A detailed characterization of the prepared samples is provided, including XRD with structural refinement, Raman spectroscopy analysis, determination of chemical composition, and evaluation of crystal size and powder morphology.

2. Materials and Methods

2.1. Nanoparticles Preparation

The Co-doped CaMoO4 powders were synthesized using high-purity starting materials, including calcium chloride CaCl2·2H2O (99% purity, Sigma-Aldrich, St. Louis, MO, USA), cobalt chloride hexahydrate CoCl2·6H2O (99% purity, Sigma-Aldrich), ammonium heptamolybdate (NH4)6Mo7O24·4H2O (99% purity, Sigma-Aldrich), and sodium hydroxide (NaOH, 97% purity, Sigma-Aldrich). All reagents were used as received without further purification.
The powders were synthesized by a co-precipitation technique at room temperature. Initially, a molybdate solution (Solution A) was prepared by dissolving 1 mmol of ammonium heptamolybdate in 100 mL of deionized water. Solution B was prepared separately by dissolving calcium and cobalt salts (total 7 mmol) in 50 mL of deionized water, maintaining the molar ratio: x = Co/(Co + Ca) = 0, 0.02, 0.04, 0.06, and 0.08.
The pH of the ammonium molybdate solution was adjusted to 8.5–9.5 with a concentrated solution of NaOH. The solution containing mixed metal cations was slowly added dropwise (30 min) to Solution A with constant magnetic stirring. The pH remained within the 8.5–9.5 range during the experiment. The appearance of a white-bluish precipitate indicated the crystallization of metal molybdate.
The suspension was agitated for an additional 30 min, and the resulting powders were collected by centrifugation, washed three times with deionized water (50 mL each time), and dried at 110 °C for 16 h.

2.2. Nanoparticles Characterization

At room temperature, X-ray diffraction (XRD) measurements were performed to examine the phase purity and crystal structure. A Bruker D8 diffractometer (Bruker Scientific LLC, Billerica, MA, USA) equipped with a CuKα radiation source was employed for sample analysis. The data were collected with a step size of 0.0105° and an acquisition time of 5 s per step. Lattice parameters, coherence domain sizes, and atomic parameters were determined by structural refinement of the XRD data using FullProf software (version 5.20, December 2023). Raman spectra were acquired using a Horiba Jobin-Yvon HR800 LabRam spectrometer (HORIBA Scientific, Lyon, France). Laser irradiation with a wavelength of 514.5 nm was utilized as the excitation source, and the data were collected in the spectral range of 50–1000 cm−1. A JEOL JSM-6400 microscope(JEOL Ltd., Tokyo, Japan).equipped with an energy-dispersive X-ray (EDS) detector and operated at an accelerating voltage of 30 kV was used to acquire scanning electron microscopy images and determine the chemical composition of the prepared powders. A Micromeritics Tristar 3020 device (Micromeritics Instrument Corp., Norcross, GA, USA). operating at 77 K was employed to analyze the specific surface area and average pore diameter through N2 adsorption–desorption isotherms.

3. Results and Discussion

Co-doped CaMoO4 powders were prepared by a co-precipitation reaction in an aqueous medium at room temperature as follows:
(1−x) Ca2+ + x Co2+ + MoO42−→Ca(1−x)CoxMoO4
According to Pourbaix’s diagram for a molybdenum–water system [33], polymolybdate ions (e.g., Mo7O246− and Mo8O246−) are the stable molybdenum species in acidic media, while the orthomolybdate ion MoO42− is stable only in neutral or basic media. The addition of NaOH solution to the ammonium molybdate solution promotes the conversion of polymolybdate species into orthomolybdate ions, as shown in Equations (2) and (3). This alkalinization is also crucial for preventing the precipitation of insoluble molybdic acid (H2MoO4 or MoO3·H2O), which can occur, as shown in Reaction (4). Consequently, Co-doped calcium molybdates are prepared by precipitation in an alkaline medium (pH 9–10).
Mo7O246− + 4H2O ⇌ 7MoO42− + 8H+
Mo8O264− + 6H2O ⇌ 8MoO42− + 12H+
MoO42− + 2H+ ⇌ H2MoO4

3.1. X-Ray Diffraction and Rietveld Refinement

Figure 1 presents the XRD patterns of Ca(1−x)CoxMoO4 synthesized under ambient conditions via the co-precipitation method, without any calcination. All samples display patterns with well-defined and intense peaks, suggesting the formation of well-crystallized powders at room temperature. The XRD peaks observed in the pattern of the undoped sample can be indexed to the tetragonal scheelite structure of CaMoO4 (JCPDS 29-0351). The absence of additional XRD peaks confirms the formation of single-phase powders.
The XRD patterns of the doped samples closely resemble those of the undoped sample. Consequently, all XRD peaks can be indexed to a tetragonal scheelite phase, belonging to the I41/a space group. Moreover, no additional XRD peaks corresponding to binary or ternary oxides (e.g., Co3O4 and CoMoO4) are observed in any of the patterns, confirming the phase purity of the samples. A shift in peak positions with increasing Co content was observed, which is attributed to changes in the unit cell parameters. These results indicate that the samples are single-phase and preserve the scheelite structure, demonstrating the successful incorporation of Co into the CaMoO4 crystal lattice.
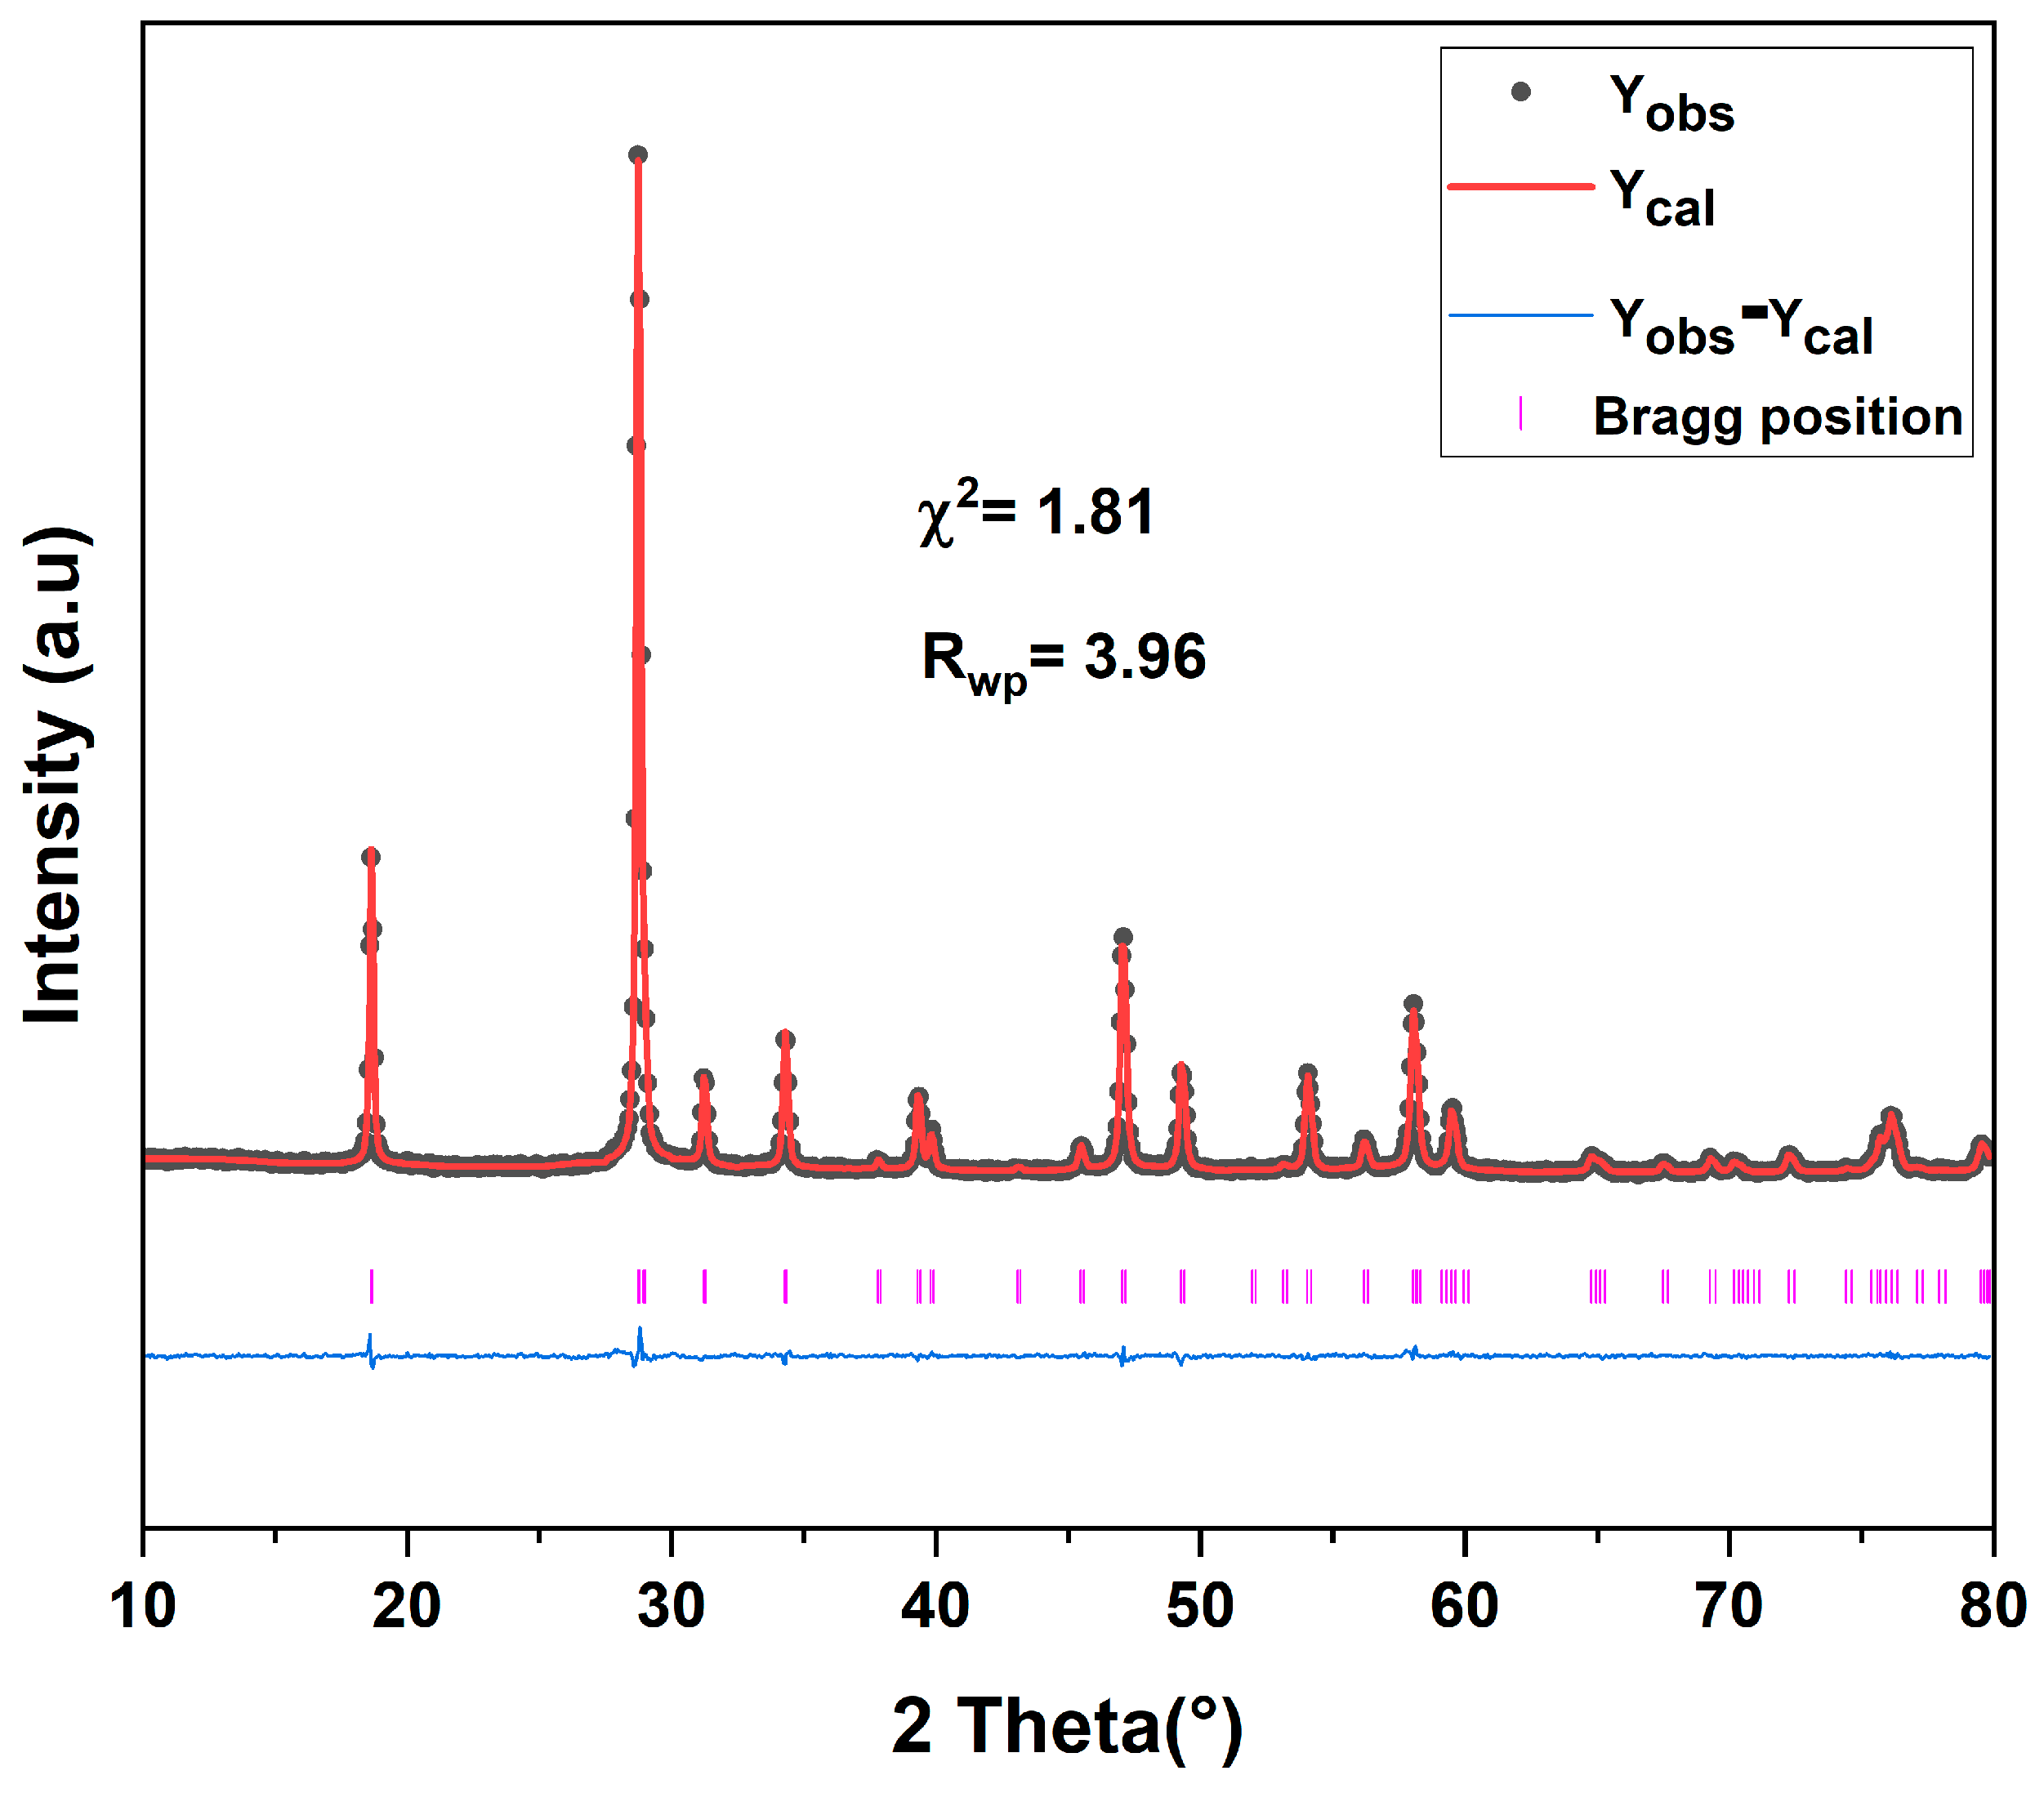
To further confirm that the prepared samples belong to the scheelite family, Rietveld refinement [34] analysis was performed using the FullProf software suite [35]. The Rietveld analysis was conducted with the tetragonal I41/a space group. The Rietveld refinement plots of Ca(1−x)CoxMoO4 (x = 0.04) are shown in Figure 2 as a typical example. Rietveld refinement plots of the other compositions are presented in the Supplementary Materials (Figure S1). The R-factors, cell parameters, and atomic parameters determined for the Co-CaMoO4 powders are summarized in Table 1.
For all compositions, the difference between the observed and calculated XRD patterns (Yobs—Ycalc) remains close to zero on the intensity scale. Additionally, the low R-factor values further confirm the excellent agreement between the observed and refined XRD patterns, verifying that the samples are single-phase and belong to the tetragonal scheelite family. The lattice parameters increase slightly from a = 5.2217 Å and c = 11.4246 Å for CaMoO4 to a = 5.2331 Å and c = 11.4569 Å for 8% Co-doped CaMoO4.This behavior is similar to that reported in the literature for doped scheelite materials prepared using different methods [36,37,38]. For example, Andrade Neto et al. [37] found that the lattice parameters of Zn2+-doped CaWO4 nanoparticles, prepared by the sonochemical method, change slightly from a= 5.2439Å and c = 11.3777 Å for CaWO4 to a = 5.2413 Å and c = 11.3799 Å for 5% Zn2+-doped CaWO4.
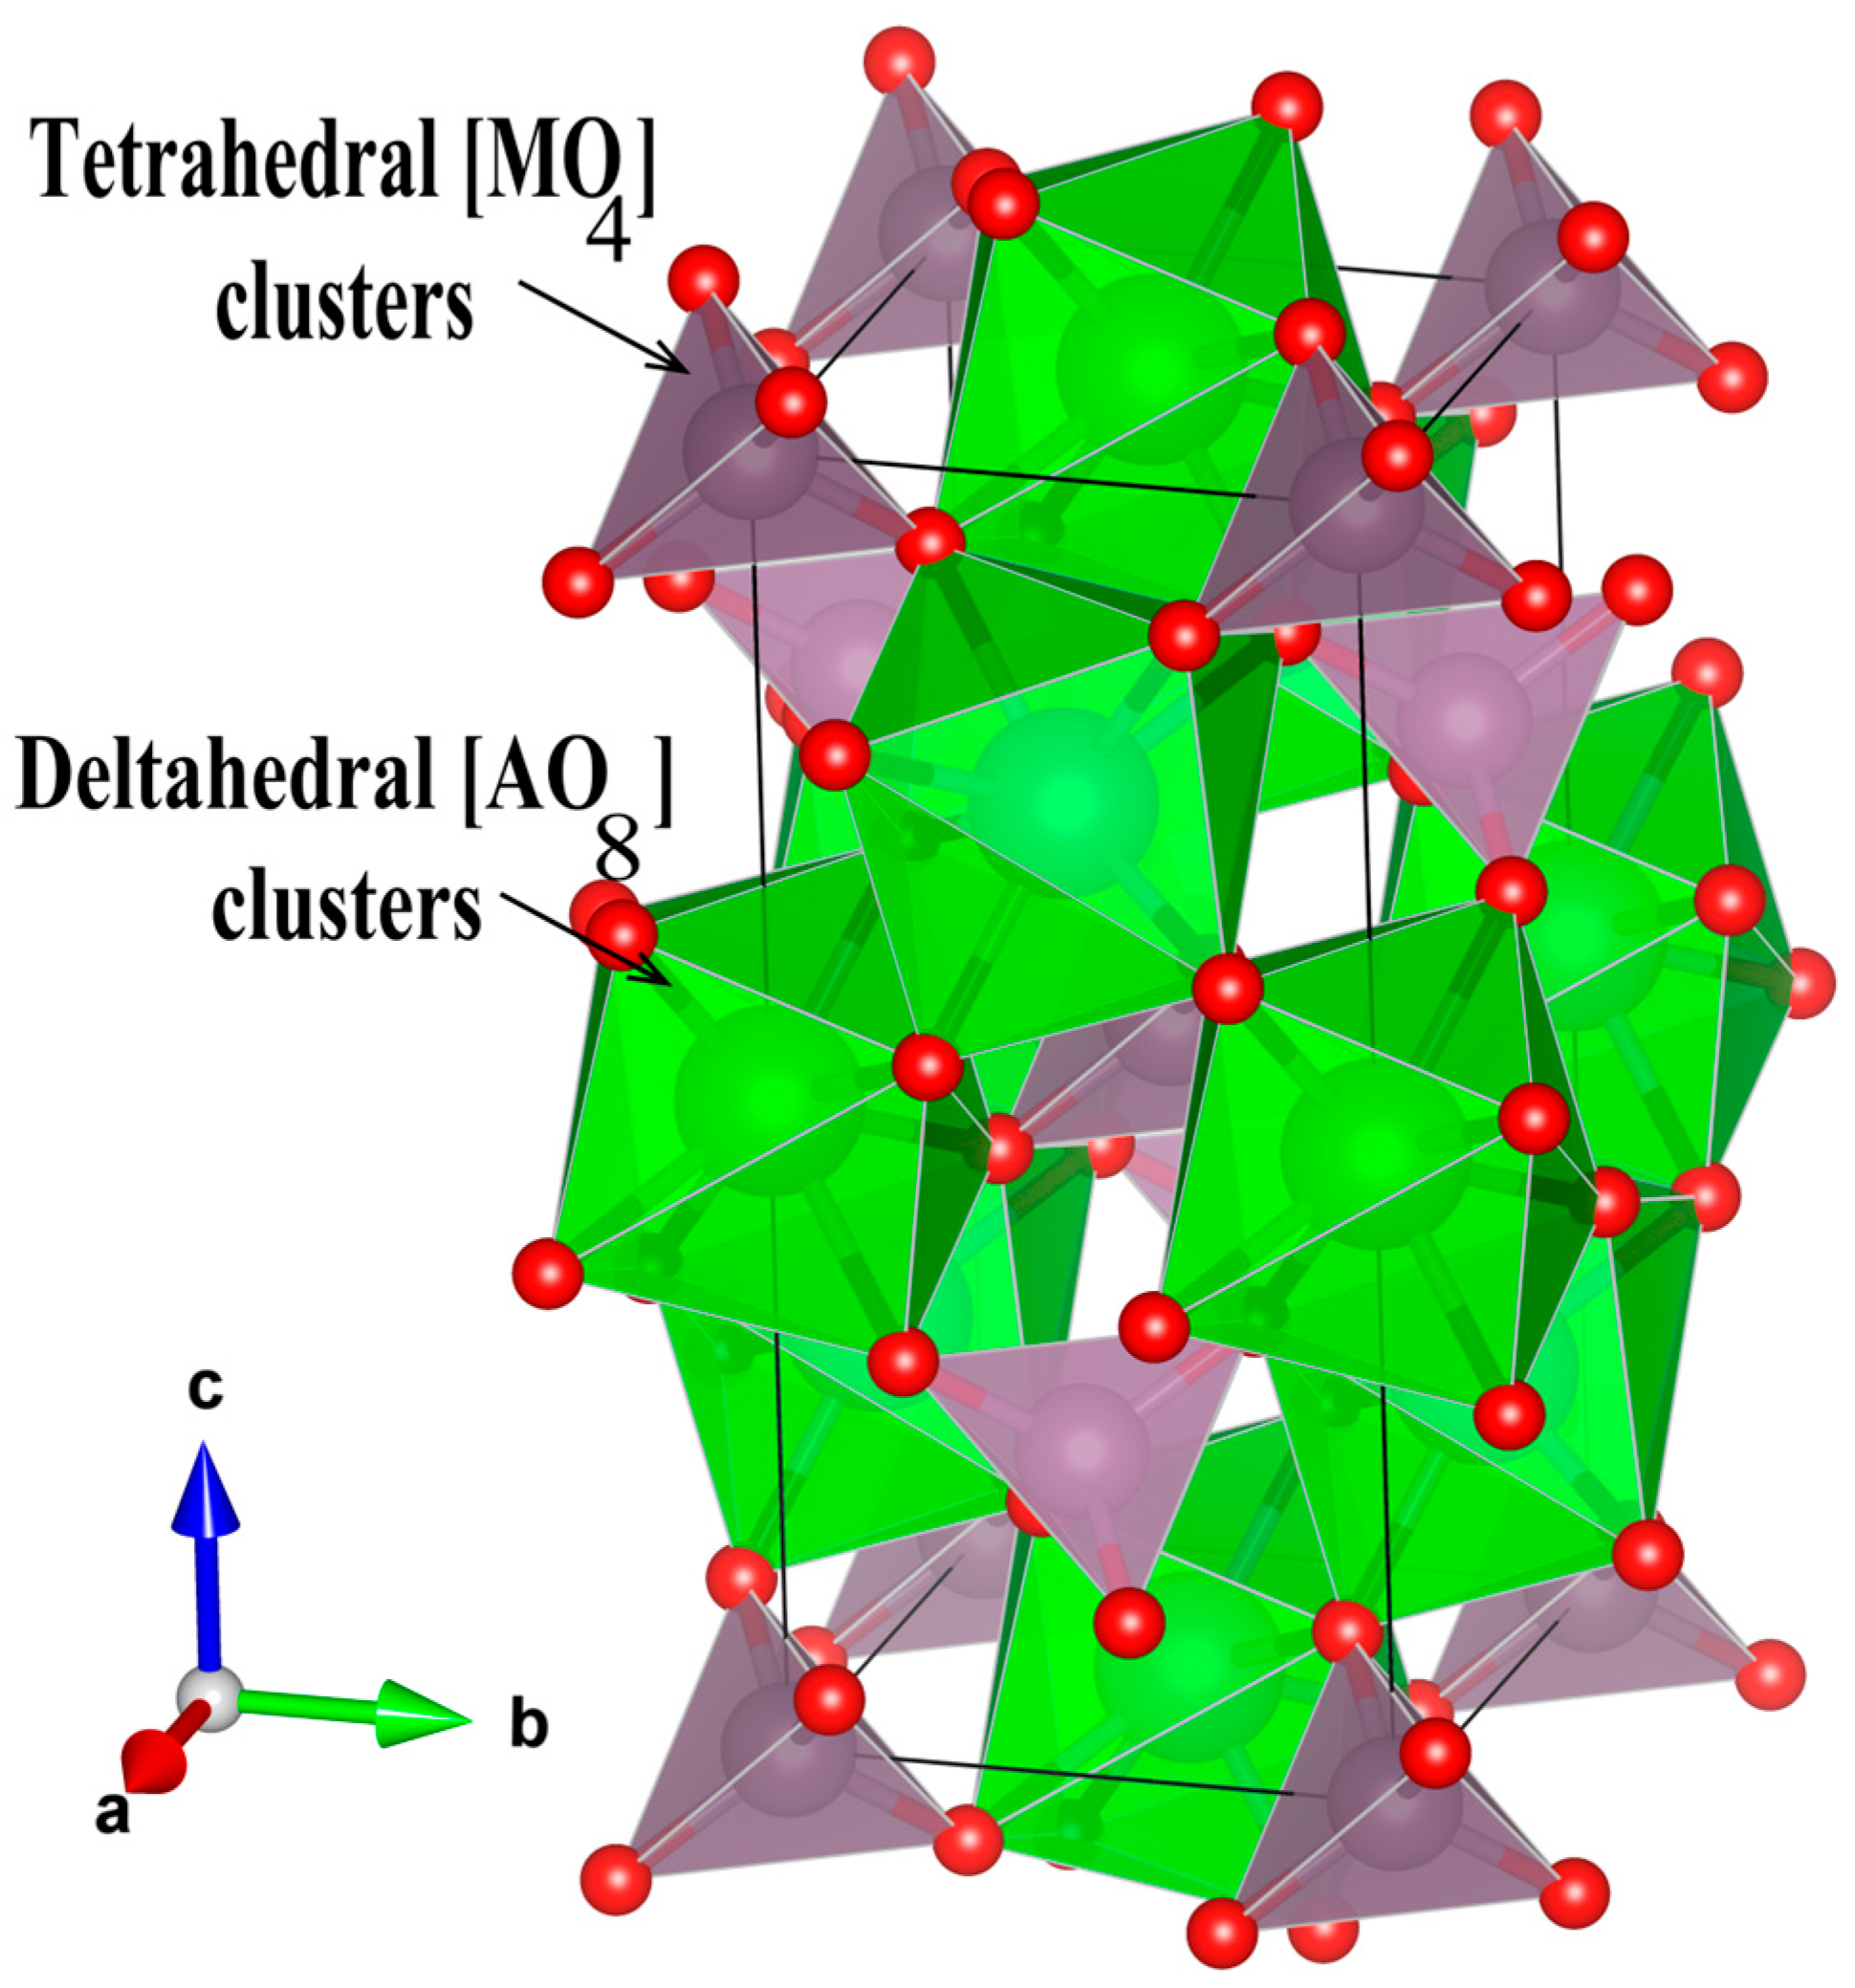
The CaMoO4 lattice is formed by a large Ca2+ cation in dodecahedral coordination (1.12 Å) and relatively small Mo6+ cations in tetrahedral coordination (0.41 Å). Since Co2+ ions are unlikely to occupy interstitial sites, the most plausible strategy for Co2+ incorporation into the CaMoO4 lattice is the substitution at either the Mo or Ca sites. It has been demonstrated that the stability of substitutional solid solutions is primarily governed by differences in electronegativity, valence, crystal structure, and ionic radius [39]. The ionic radius of Co2+ (0.74 Å in octahedral coordination) is intermediate between those of Ca2+ and Mo6+. However, the Pauling electronegativity of Co (1.8) is much closer to that of Mo (1.8) and significantly different from that of Ca (1.0) [40], suggesting a limited solid solution stability range in this system. The substitution of Ca2+ by Co2+, which has the same valence but a relatively smaller size, is expected to result in a slight decrease in the lattice parameters. On the other hand, replacing Mo6+ with Co2+, which has a lower valence and a larger size, should generate anionic vacancies in the crystal lattice. Skibiński et al. studied the magnetic properties of Co-doped PbMoO4 single crystals with a scheelite structure, grown by the Czochralski method and analyzed using EPR spectroscopy [41]. They found that Co2+ ions preferentially occupy the Pb2+ (1.29Å) sites at low concentrations while occupying both Pb and Mo sites at higher dopant levels. Another critical factor influencing lattice parameters in mixed oxide solid solutions is the transition metal oxidation state [42]. In cobalt-doped CaMoO4, some Co may adopt the +III oxidation state, potentially creating non-stoichiometry through cation or oxygen vacancies. A detailed chemical and structural investigation is necessary to assess the oxidation state of cobalt in our samples and to understand the origin of the structural changes observed upon doping. Ongoing studies employing XPS, EPR analysis, and theoretical calculations aim to elucidate the Co environment in our samples, as well as to explore its electronic and magnetic properties. The atomic positions of oxygen atoms (Table 1), extracted from XRD data, show slight variation with the Co content, indicating distortions in both the MoO4 tetrahedra and the AO8 dodecahedra.
The atomic coordinates and unit cell parameters extracted from the XRD data were used to model the unit cell of the Ca0.96Co0.04MoO4 crystal using VESTA visualization software [43] (Figure 3). The scheelite structure has tetragonal symmetry with space group I41/a. In AMoO4 scheelite-structured compounds, both cation sites exhibit S4 point symmetry. The Mo6+ cations are bonded to four oxygen atoms, forming MoO4 tetrahedra, while the bivalent cation (A) is coordinated by eight oxygen atoms to form AO8 dodecahedra. The presence of two distinct A–O bond lengths indicates that the AO8 dodecahedra are distorted. Each AO8 dodecahedron shares four edges with neighboring AO8 units, whereas each MoO4 tetrahedron shares all four corners with adjacent AO8 polyhedra.
To examine the effect of Co substitution on the microstructural characteristics of molybdate powders, the crystallite size (D) was estimated from XRD data using the Scherrer equation [44]:
D= (Kλ)/βcosθ
where λ represents the wavelength of the radiation used, K = 0.9 is the crystallite shape factor, β corresponds to the experimental full width at half maximum (FWHM) of the diffraction peak, and θ is the Bragg angle. As illustrated in Table 1, the crystallite size values of Co-doped CaMoO4 solid solutions range between 37 and 43 nm. The co-precipitation method developed in this work enables the preparation of pure molybdates at room temperature, limiting crystal growth and maintaining the particle size below 43 nm.

3.2. Raman Spectroscopy

Raman spectroscopy was used to complete the structural characterization and confirm our samples as belonging to the scheelite family. Based on group theory analysis, tetragonal scheelite-structured materials with the space group I41/a exhibit 26 vibrational modes at the center of the Brillouin zone, described by the following irreducible representation [45]:
Γ= 3Ag + 5Bg+ 5Eg+ 5Au+ 3Bu+ 5Eu
The even vibrations (Ag, Bg, and Eg) and the odd vibrations (4Au and 4Eu) are Raman-active and infrared-active, respectively. Meanwhile, all Bu vibrations are silent, and one Au and one Eu correspond to acoustic vibrations.
The optical modes are classified into external and internal modes. The external modes, also referred to as the lattice phonons, correspond to the movement of the Ca2+ cation relative to the rigid [MoO4]2− tetrahedral units. The internal modes are associated with vibrations within the [MoO4]2− tetrahedra, with their center of mass remaining stationary.
In free space, [MoO4]2− tetrahedrons, with Td symmetry, exhibit four internal modes: (ν1(A1), ν2(E), ν3(F2), and ν4(F2)); one free rotation (f.r.) mode (νf.r.(F1)); and one translation mode (F2). However, when these tetrahedra are integrated into a scheelite structure, their point symmetry is reduced to S4, and the Raman vibration can be described by the following decomposition (Equation (7)) [46]:
ΓRaman = υ1(Ag) + υ2(Ag) + υ2(Bg) + υ3(Bg) + υ3(Eg) + υ4(Bg) + υ4(Eg) + R(Ag) + R(Eg) +2T(Bg)+ 2T(Eg)
where the MoO4 groups exhibit internal modes characterized as υ1 (symmetric stretching), υ2 (symmetric bending), υ3 (asymmetric stretching), and υ4 (asymmetric bending), which correspond to vibrations of the [MoO4]2− groups. R and T represent the rotational and translational external modes, respectively, observed in scheelite-structured compounds. The Raman spectra recorded on the as-prepared Ca1−xCoxMoO4 powders are presented in Figure 4.
The Raman spectrum of the undoped sample shows eight distinct vibrational bands in the spectral range 150–950 cm−1, all attributable to scheelite-phase vibrational modes [46]. The intense peak observed at approximately 880 cm−1 corresponds to the internal mode υ1(Ag), which originated from the symmetric stretching of MoO4 groups. The internal asymmetric stretching vibration υ3(Bg) was observed around 847 cm−1. The Raman band located at 795 cm−1 is assigned to the internal mode υ 3(Eg), corresponding to the asymmetric stretching vibration. The relatively broad peak centered at 394 cm−1 can be attributed to the asymmetric bending internal modes υ4(Bg) and υ4(Eg). The relatively intense peak located at 325 cm−1 is assigned to both υ2(Ag) and υ2(Eg). These modes correspond to the symmetric bending vibrations within the [MoO4]2− group. The shoulder feature near 204–206 cm−1 can be assigned to the rotational external mode (R(Ag) of the scheelite-structured phase. The relatively intense peak at approximately 143 cm−1 corresponds to the external translational mode T(Eg). Finally, the translational mode T(Bg) was observed around 112 cm−1. The assignment of the vibrational peaks is consistent with previous reports on bulk molybdate prepared by high-temperature methods [45,46,47,48]. The Raman spectrum confirms that no secondary phases, such as Ca(OH)2 (360 cm−1), CaCO3 (1080 cm−1), and MoO3 (976 cm−1), are present in the sample [49,50].
The Raman spectra of the doped samples closely resemble that of undoped CaMoO4, further confirming the formation of a single-phase scheelite-structured solid solution. No traces of impurities (e.g., CoMoO4 and Co3O4) are detected in any Raman spectra. Notably, the main Raman peaks are intense and well defined in all spectra, indicating the formation of well-crystallized molybdates at room temperature with minimal structural disorder [51]. This observation is in agreement with the XRD results, which indicate that the as-prepared samples exhibit low structural disorder. No post-synthesis heat treatment is required to improve structural ordering, making this synthesis process energy-efficient and environmentally benign. Indeed, many research groups have demonstrated the importance of structural disorder in optimizing optical and electrical properties [52,53].
After deconvoluting the Raman spectra using the pseudo-Voingt function, the full width at half maximum (FWHM) of the primary internal υ1(Ag) peak and main external T(Bg) peak were determined and are presented in Table 2. The fitted curves are given in the Supplementary Materials (Figures S2 and S3).
As shown in Table 2, the cobalt content slightly affects the FWHM of the internal mode υ1(Ag), whereas that of the external mode T(Bg) decreases significantly. This behavior is likely due to the substitution of Ca2+ by Co2+ at the A-site, which affects the lattice phonons [54]. In addition, the relaxation of phonon confinement effects occurs, as larger crystallite sizes reduce the breakdown of the long-range order, influencing both the structural and vibrational properties of the solid solutions [54]. Other factors may also contribute to the FWHM variation in Raman peaks, such as crystallite size distribution and surface strain [55,56,57].

3.3. Scanning Electron Microscopy

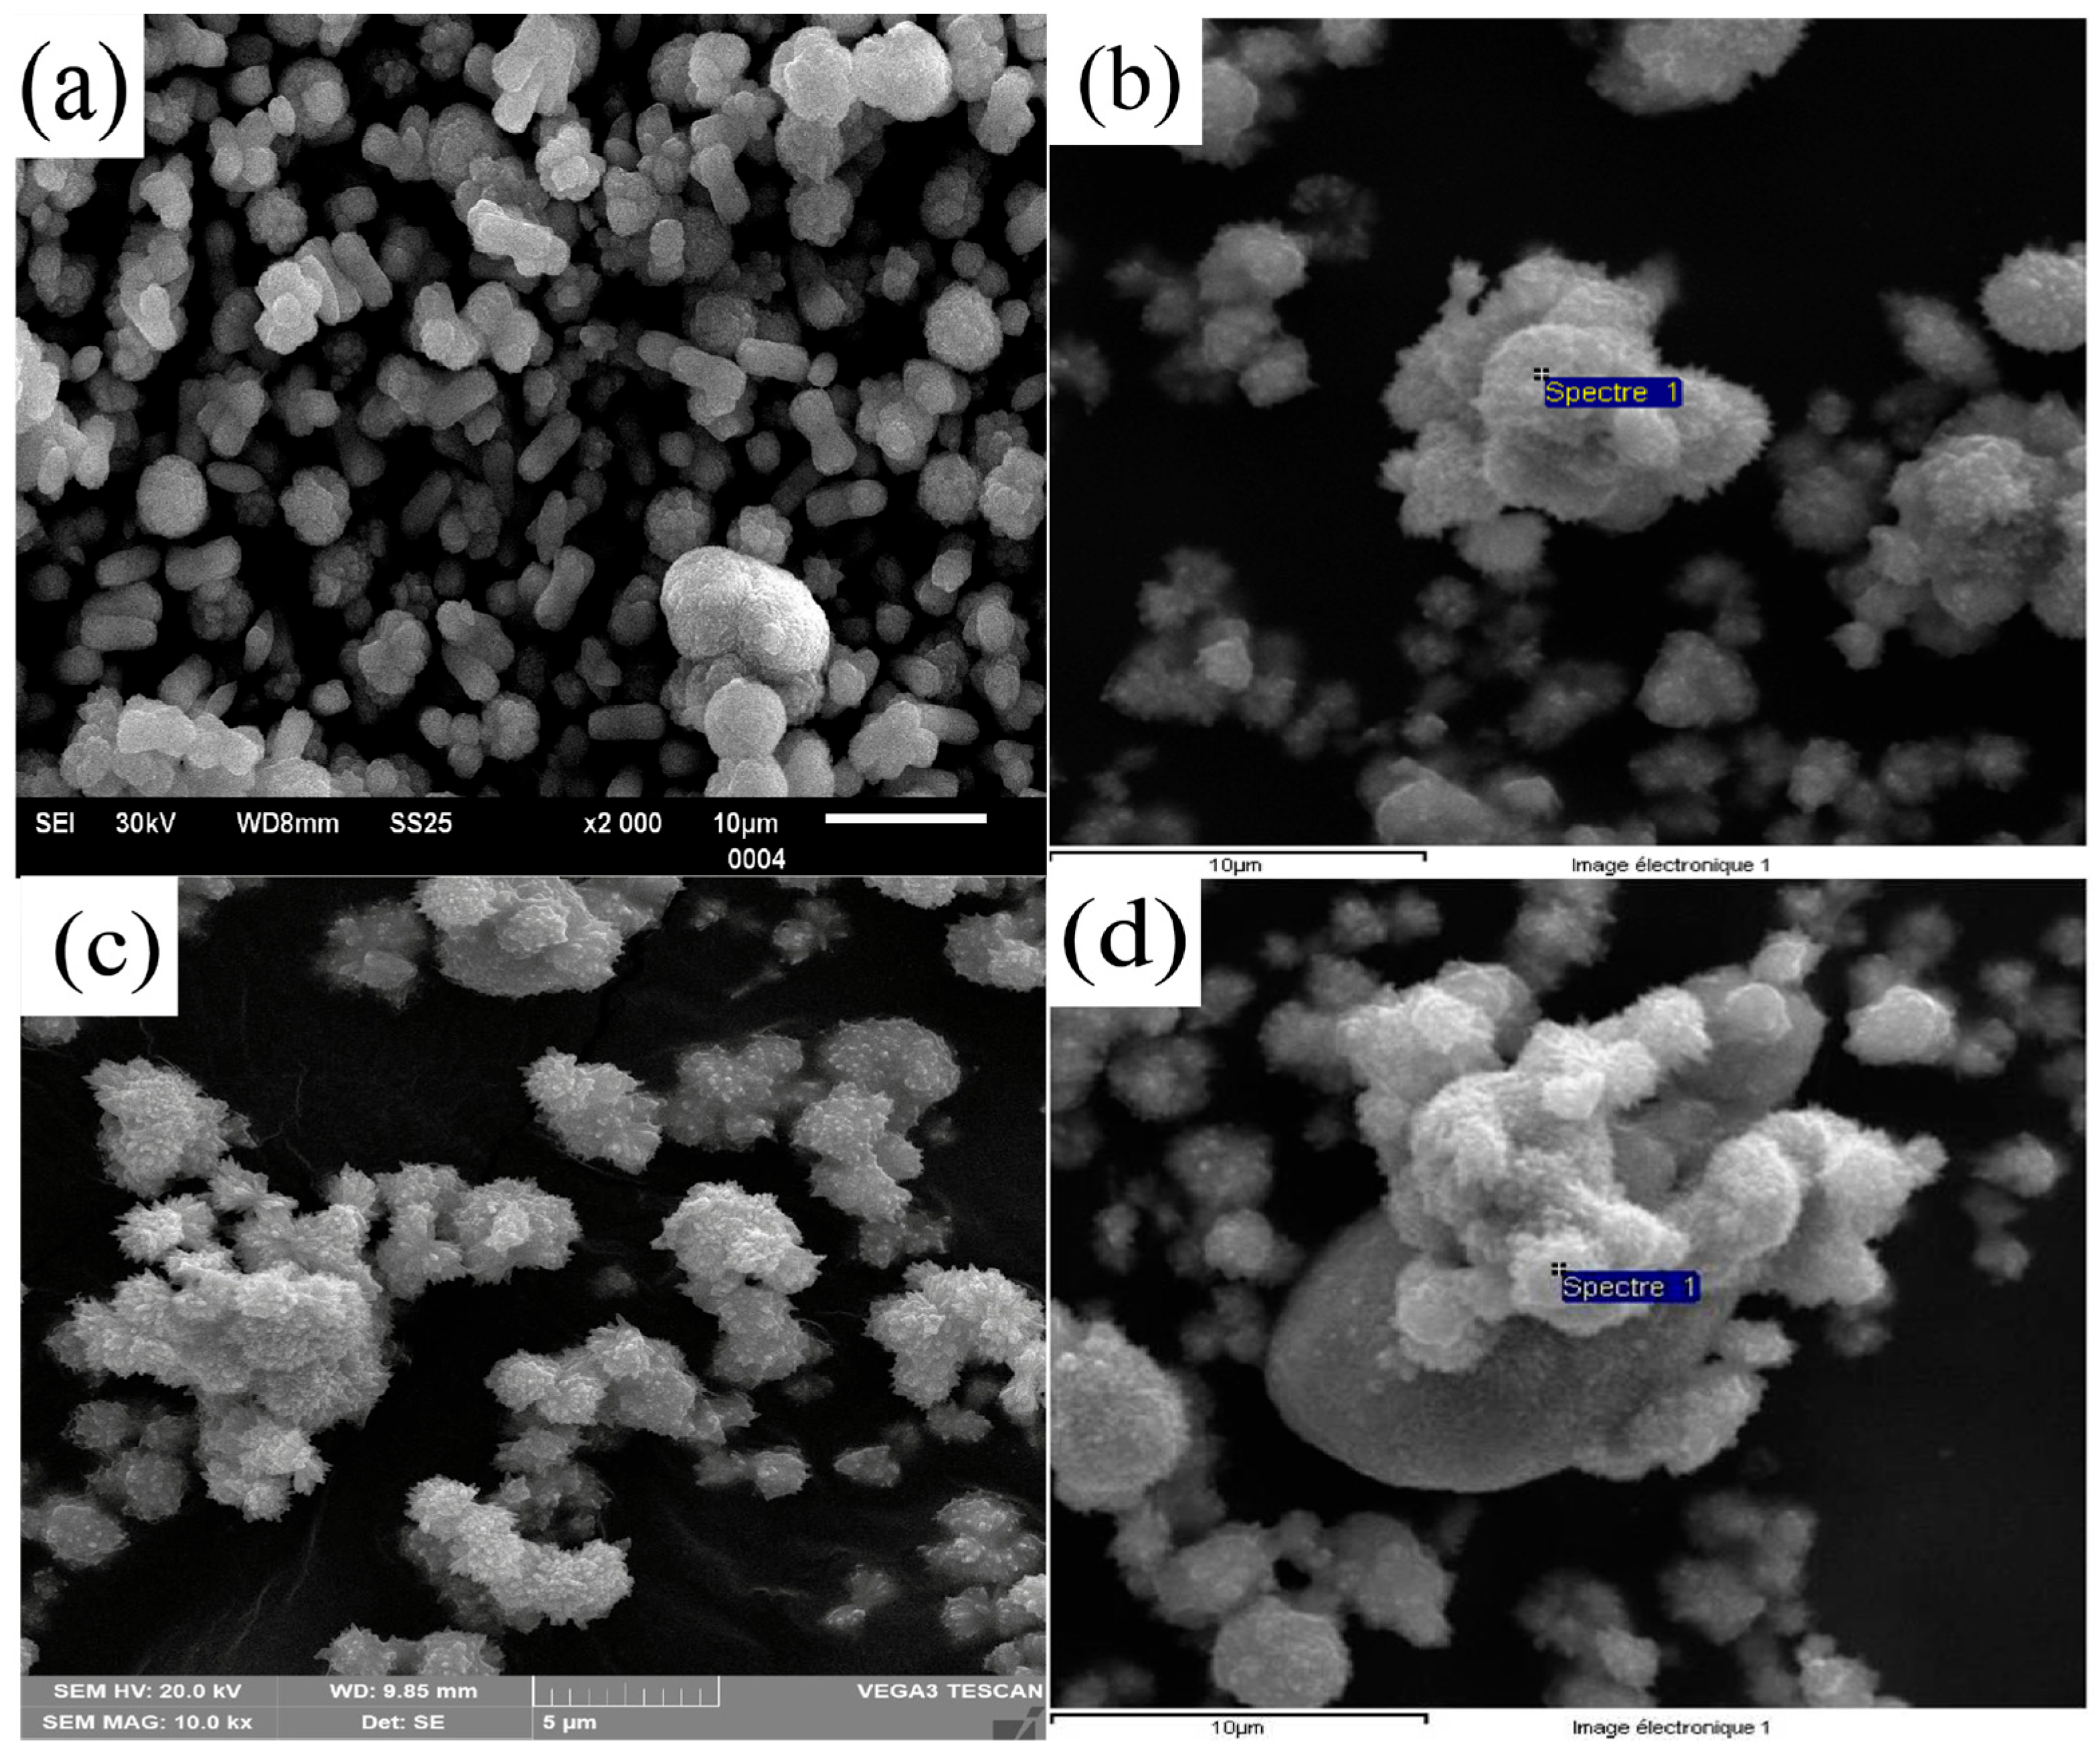
As a complementary technique to XRD, scanning electron microscopy was used to directly assess the morphology and particle size of the synthesized powders. SEM micrographs of the undoped sample and the 6% Co-doped sample are shown in Figure 5.
The micrographs reveal that all powders consist mainly of agglomerated micron-sized particles with distinct shapes. It should be noted that these latter morphologies are affected by chemical composition. The CaMoO4 micrographs (Figure 5a) show several dumbbell-shaped particles with quasi-uniform shapes and sizes ranging from 4.1 to 4.8 μm in length and 1.6 to 1.9 μm in diameter. Surface examination of these particles reveals significant roughness, suggesting their polycrystalline nature. Indeed, they form through the self-assembly of primary particles with sizes less than 50 nm, as determined by XRD analysis, to minimize surface energy [23]. The presence of several microspheres and flower-like morphologies is also observed, which are likely the result of the cross-growth of multiple dumbbells. All Co-doped CaMoO4 powders exhibit an ultra-fine microstructure (Figure 5b–d). The doped samples consist of agglomerated particles smaller than 5 μm with heterogeneous shapes. These agglomerates appear less compact compared to those observed in the undoped powder. Cobalt doping in CaMoO4 promotes the formation of a finer microstructure while inhibiting the development of well-defined particle morphologies.
Furthermore, the chemical composition of all prepared powders was determined through EDS analysis. As shown in Table 3, the Co/(Ca + Co) and Mo/(Ca + Co) ratios are in good agreement with the intended stoichiometry. These findings indicate that the chemical composition of the powders is primarily governed by the concentration of the initial solution.

3.4. N2 Adsorption–Desorption Isotherm

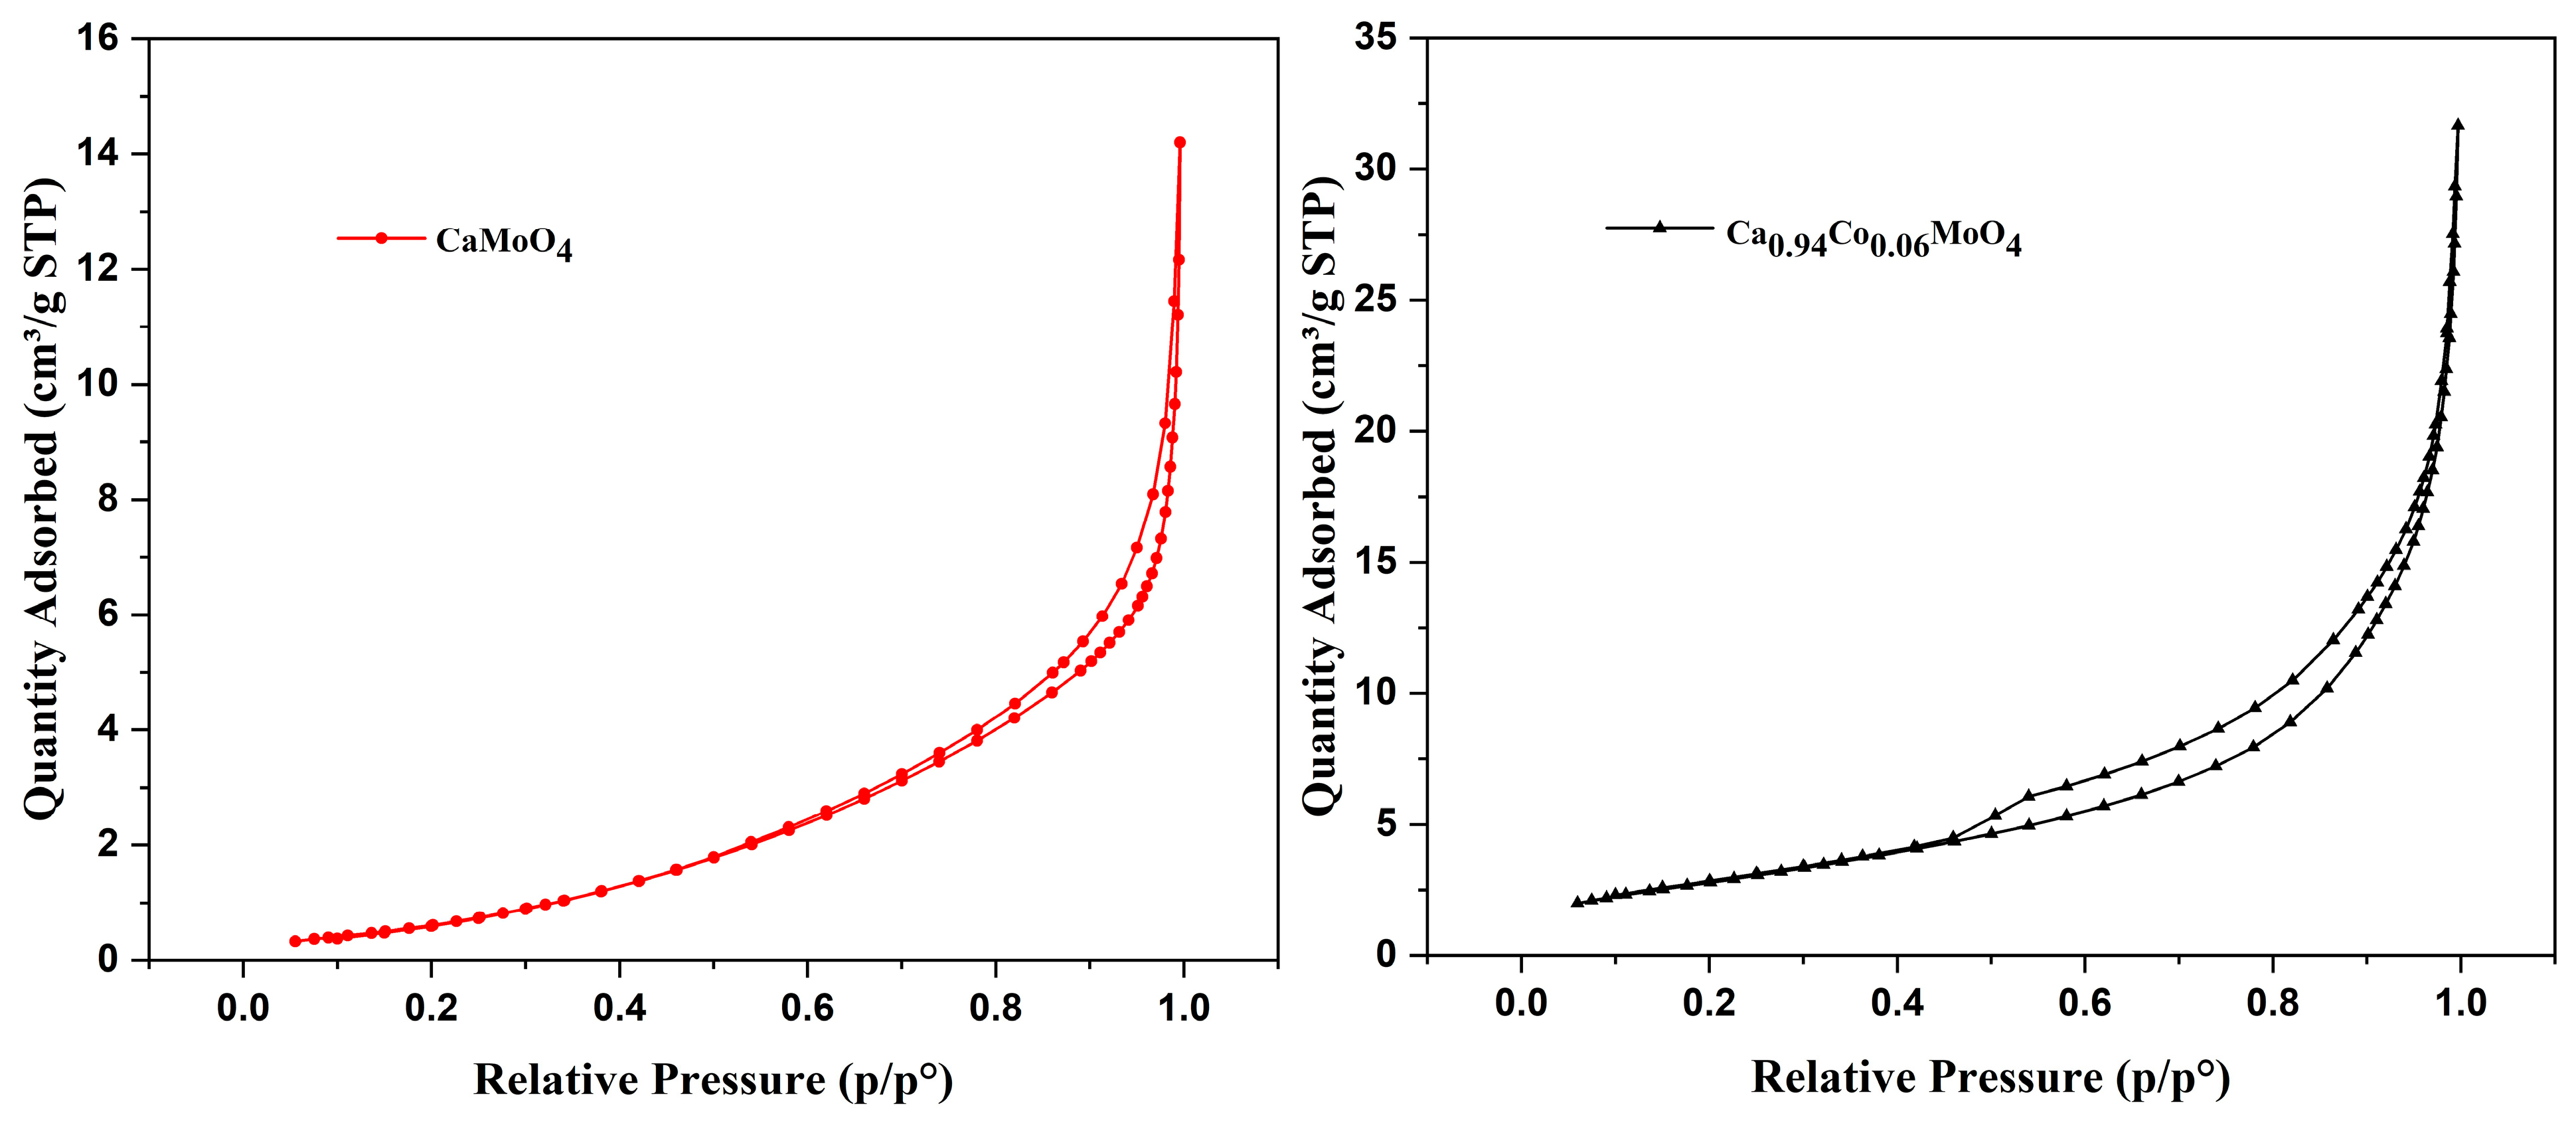
The specific surface area and porous structure of the as-prepared molybdate powders were examined using Brunauer–Emmett–Teller (BET) N2 adsorption–desorption analysis. Figure 6 presents the adsorption–desorption isotherm curves for CaMoO4 and 6% Co-doped CaMoO4, which reveal a mesoporous structure, as evidenced by the presence of H3-type hysteresis loops. The average pore size, calculated using the Barrett–Joyner–Halenda (BJH) method, is 13.07nm for CaMoO4 and 13.09 nm for 6% Co-doped CaMoO4. The specific surface areas are determined to be 3.59 m2/g and 10.74 m2/g, respectively (Table 4).
Cobalt doping leads to an increase in average pore size and specific surface area, reflecting a modification of the material’s porosity. This change promotes a more open structure and better pore accessibility, which is crucial for applications such as heterogeneous catalysis and gas and humidity sensors. It is well known that doping can enhance specific surface areas through alterations in surface energy, crystal structure, the kinetics of nucleation and growth processes or the agglomeration state of particles [58,59]. Surface defects have also been reported to affect the specific surface area of metal oxide powders [60,61]. In our samples, the increase in specific surface area can be mainly attributed to the porosity resulting from particle agglomeration and the surface state of the particles. Previous studies have further demonstrated that ultrafine particles of doping elements decorating host material particles can enhance the surface area [62,63]. Although XRD, Raman, and SEM-EDS analyses did not reveal any cobalt oxides in our samples, the presence of cobalt oxide particles decorating the surface of molybdate powders cannot be entirely excluded. Further characterization through TEM observations is required to confirm this point, which will be addressed in an upcoming article.

4. Conclusions

In conclusion, cobalt-doped calcium molybdate powders (Ca1−xCoxMoO4, with x ≤ 0.08) were successfully synthesized using a simple and eco-friendly co-precipitation method at room temperature without the use of surfactants or hazardous organic solvents. XRD and Raman spectroscopy confirm the formation of pure and well-crystallized molybdate phases at room temperature, with no need for post-synthesis heat treatment. All prepared samples are homogeneous solid solutions exhibiting a scheelite structure with space group I41/a. Rietveld refinement of the XRD data further confirms the incorporation of Co into the CaMoO4 crystal lattice. SEM observations reveal that cobalt doping promotes the formation of finer agglomerates while inhibiting the development of well-defined particle morphologies. The N2 adsorption–desorption isotherms reveal the formation of mesoporous structures, with a specific surface area of 3.59m2/g for the undoped CaMoO4 and 10.74m2/g for the 6% Co-doped CaMoO4. These structural and morphological features—namely, nanostructured architectures with enhanced specific surface area obtained under mild synthesis conditions—highlight the potential of this method for tailoring the functional properties of scheelite-type materials for photonic, catalytic, and energy-related applications.

Supplementary Materials

The following supporting information can be downloaded at https://www.mdpi.com/article/10.3390/ceramics8030110/s1: Figure S1: Rietveld refinement plots for the Co-doped CaMoO4 powders synthesized at room temperature. Figure S2: Pseudo-Voigt fitting of the internal ν1(Ag) Raman mode in Co-doped CaMoO4 powders. Experimental data (solid line) and fitting results (dotted line) are shown. Figure S3: Pseudo-Voigt fitting of the external T(Bg) Raman mode in Co-doped CaMoO4 powders. Experimental data (solid line) and fitting results (dotted line) are shown.

Author Contributions

Conceptualization, investigation, methodology, software, formal analysis, and writing—original draft preparation, S.A.; methodology, visualization, resources, and writing—review and editing, M.B. All authors have read and agreed to the published version of the manuscript.

Funding

This research received no external funding.

Institutional Review Board Statement

Not applicable.

Informed Consent Statement

Not applicable.

Data Availability Statement

The original contributions presented in this study are included in the article. Further inquiries can be directed at the corresponding author.

Conflicts of Interest

The authors declare no conflicts of interest.

References

  1. Sawant, D.S.; Kulkarni, S.B.; Dubal, D.P.; Lohar, G.M. Transition Metal Molybdates Emerging Materials for High-Performance Supercapacitors: A Machine Learning Analysis. Battery Energy 2025, 4, e20240073. [Google Scholar] [CrossRef]
  2. Ge, X.; Zhu, Y.; Cao, Z.; Jia, J.; Zhao, Q.; Chang, S.; Liu, S.; Yang, X.; Feng, K. High-Specific-Capacity Molybdate Anode Materials for Lithium-Ion Batteries with Good Low-Temperature Performance. J. Alloys Compd. 2022, 903, 163914. [Google Scholar] [CrossRef]
  3. Kaminskii, A.A.; Bagaev, S.N.; Ueda, K.; Takaichi, K.; Eichler, H.J. High-Order Picosecond SRS and Self-SRS Generation in Nd3+-Doped CaMoO4, SrMoO4, and SrWO4 Laser Crystals. Crystallogr. Rep. 2002, 47, 653–657. [Google Scholar] [CrossRef]
  4. Yi, S.-S.; Jung, J.-Y. Barium Molybdate White Emitting Phosphor Synthesized at Room Temperature by Co-Precipitation. RSC Adv. 2022, 12, 21827–21835. [Google Scholar] [CrossRef]
  5. Mikhailik, V.B.; Elyashevskyi, Y.; Kraus, H.; Kim, H.J.; Kapustianyk, V.; Panasyuk, M. Temperature Dependence of Scintillation Properties of SrMoO4. Nucl. Instrum. Methods Phys. Res. Sect. Accel. Spectrometers Detect. Assoc. Equip. 2015, 792, 1–5. [Google Scholar] [CrossRef]
  6. Edwin Suresh Raj, A.M.; Mallika, C.; Swaminathan, K.; Sreedharan, O.M.; Nagaraja, K.S. Zinc(II) Oxide-Zinc(II) Molybdate Composite Humidity Sensor. Sens. Actuators B Chem. 2002, 81, 229–236. [Google Scholar] [CrossRef]
  7. Choi, G.-K.; Kim, J.-R.; Yoon, S.H.; Hong, K.S. Microwave Dielectric Properties of Scheelite (A=Ca, Sr, Ba) and Wolframite (A=Mg, Zn, Mn) AMoO4 Compounds. J. Eur. Ceram. Soc. 2007, 27, 3063–3067. [Google Scholar] [CrossRef]
  8. Chaturvedi, S.; Rodriguez, J.A.; Hanson, J.C.; Albornoz, A.; Brito, J.L. Properties of Pure and Sulfided NiMoO4 and CoMoO4 Catalysts: Tpr, Xanes and Time-Resolved XRD Studdzs. MRS Online Proc. Libr. 1997, 497, 41–46. [Google Scholar] [CrossRef]
  9. Huerta-Flores, A.M.; Juárez-Ramírez, I.; Torres-Martínez, L.M.; Carrera-Crespo, J.E.; Gómez-Bustamante, T.; Sarabia-Ramos, O. Synthesis of AMoO4 (A = Ca, Sr, Ba) Photocatalysts and Their Potential Application for Hydrogen Evolution and the Degradation of Tetracycline in Water. J. Photochem. Photobiol. Chem. 2018, 356, 29–37. [Google Scholar] [CrossRef]
  10. Sleight, A.W. Accurate Cell Dimensions for ABO4 Molybdates and Tungstates. Acta Crystallogr. B 1972, 28, 2899–2902. [Google Scholar] [CrossRef]
  11. Errandonea, D.; Manjón, F.J. Pressure Effects on the Structural and Electronic Properties of ABX4 Scintillating Crystals. Prog. Mater. Sci. 2008, 53, 711–773. [Google Scholar] [CrossRef]
  12. Wu, W.-T.; Tiong, K.-K.; Lee, Y.-W.; Hu, S.-Y.; Lee, Y.-C.; Huang, W. Tunable Luminescence of Sm3+/Tb3+ Co-Doped CaMoO4 Phosphors Synthesized by Microwave-Assisted Heating. Appl. Sci. 2022, 12, 7883. [Google Scholar] [CrossRef]
  13. Dixit, P.; Chauhan, V.; Kumar, P.; Pandey, P.C. Enhanced Photoluminescence in CaMoO4:Eu3+ by Mn2+ Co-Doping. J. Lumin. 2020, 223, 117240. [Google Scholar] [CrossRef]
  14. Phuruangrat, A.; Thongtem, S.; Thongtem, T. Effect of Ce Dopant on Photocatalytic Properties of CaMoO4 Nanoparticles Prepared by Microwave-Assisted Method. Mater. Res. Innov. 2022, 26, 84–90. [Google Scholar] [CrossRef]
  15. Jeseentharani, V.; Jeyaraj, B.; Dayalan, A.; Nagaraja, K.S. Fabrication and Characterisation of Nanocrystalline Composites of Ca1−xCoxMoO4 (x = 0, 0.3, 0.5, 0.7, 1) Prepared by Co-Precipitation Method as a Humidity Sensor. J. Mater. Sci. Mater. Electron. 2017, 28, 3548–3559. [Google Scholar] [CrossRef]
  16. Gancheva, M.; Iordanova, R.; Koseva, I.; Avdeev, G.; Burdina, G.; Ivanov, P. Synthesis and Luminescent Properties of Barium Molybdate Nanoparticles. Materials 2023, 16, 7025. [Google Scholar] [CrossRef] [PubMed]
  17. Millner, T.; Neugebauer, J. Volatility of the Oxides of Tungsten and Molybdenum in the Presence of Water Vapour. Nature 1949, 163, 601–602. [Google Scholar] [CrossRef]
  18. Senguttuvan, N.; Babu, S.M.; Subramanian, C. Synthesis, Crystal Growth and Mechanical Properties of Lead Molybdate. Mater. Sci. Eng. B 1997, 47, 269–273. [Google Scholar] [CrossRef]
  19. Chen, H.; Ge, C.; Li, R.; Wang, J.; Wu, C.; Zeng, X. Growth of Lead Molybdate Crystals by Vertical Bridgman Method. Bull. Mater. Sci. 2005, 28, 555–560. [Google Scholar] [CrossRef]
  20. Arora, S.K.; Trivikrama Rao, G.S. Crystal Growth of Barium Molybdate by Flux Evaporation. Bull. Mater. Sci. 1983, 5, 381–387. [Google Scholar] [CrossRef]
  21. Benchikhi, M.; El Ouatib, R.; Guillemet-Fritsch, S.; Yves Chane-Ching, J.; Er-Rakho, L.; Durand, B. Sol–Gel Synthesis and Sintering of Submicronic Copper Molybdate (α-CuMoO4) Powders. Ceram. Int. 2014, 40, 5371–5377. [Google Scholar] [CrossRef]
  22. Ding, Y.; Wan, Y.; Min, Y.-L.; Zhang, W.; Yu, S.-H. General Synthesis and Phase Control of Metal Molybdate Hydrates MMoO4·nH2O (M = Co, Ni, Mn, n = 0, 3/4, 1) Nano/Microcrystals by a Hydrothermal Approach: Magnetic, Photocatalytic, and Electrochemical Properties. Inorg. Chem. 2008, 47, 7813–7823. [Google Scholar] [CrossRef]
  23. Rani, B.J.; Swathi, S.; Yuvakkumar, R.; Ravi, G.; Kumar, P.; Babu, E.S.; Alfarraj, S.; Alharbi, S.A.; Velauthapillai, D. Solvothermal Synthesis of CoMoO4 Nanostructures for Electrochemical Applications. J. Mater. Sci. Mater. Electron. 2021, 32, 5989–6000. [Google Scholar] [CrossRef]
  24. Sakthivel, S.; Shobika, S.; Dinesh, A.; Yogalakshmi, K.; Suriyaprakash, R.; Kabilan, B.; Sathyajith, P.; Elumalai, S.; Gnanasekaran, L.; Ayyar, M.; et al. Comparative Study of Synthesis Methods and Electrochemical Performance of Nickel Molybdate (NiMoO4) Nanostructures for Supercapacitor Applications. Results Chem. 2025, 13, 101956. [Google Scholar] [CrossRef]
  25. Afanasiev, P. Molten Salt Synthesis of Barium Molybdate and Tungstate Microcrystals. Mater. Lett. 2007, 61, 4622–4626. [Google Scholar] [CrossRef]
  26. Masteri-Farahani, M.; Mahdavi, S.; Rafizadeh, M. Microemulsion-Mediated Synthesis and Characterization of Monodispersed Nickel Molybdate Nanocrystals. Ceram. Int. 2013, 39, 4619–4625. [Google Scholar] [CrossRef]
  27. Rullens, F.; Deligne, N.; Laschewsky, A.; Devillers, M. A Facile Precursor Route to Transition Metal Molybdates Using a Polyzwitterionic Matrix Bearing Simultaneously Charged Moieties and Complexing Groups. J. Mater. Chem. 2005, 15, 1668. [Google Scholar] [CrossRef]
  28. Yoshimura, M.; Ohmura, M.; Cho, W.; Yashima, M.; Kakihana, M. Preparation of Crystallized Sr1−XCaXMoO4 Solid-Solution Films by an Electrochemical Method at Room Temperature and Their Luminescence. J. Am. Ceram. Soc. 1997, 80, 2464–2466. [Google Scholar] [CrossRef]
  29. Kianpour, G.; Salavati-Niasari, M.; Emadi, H. Sonochemical Synthesis and Characterization of NiMoO4 Nanorods. Ultrason. Sonochem. 2013, 20, 418–424. [Google Scholar] [CrossRef]
  30. Barmi, M.J.; Sundaram, M.M. Role of Polymeric Surfactant in the Synthesis of Cobalt Molybdate Nanospheres for Hybrid Capacitor Applications. RSC Adv. 2016, 6, 36152–36162. [Google Scholar] [CrossRef]
  31. Harichandran, G.; Radha, S.; Yesuraj, J.; Muthuraaman, B. Synthesis and Characterization of Cobalt Molybdate Dihydrate Nanorods Arrays for Supercapacitor Electrode Application. Appl. Phys. A 2021, 127, 627. [Google Scholar] [CrossRef]
  32. Longo, V.M.; Cavalcante, L.S.; Paris, E.C.; Sczancoski, J.C.; Pizani, P.S.; Li, M.S.; Andrés, J.; Longo, E.; Varela, J.A. Hierarchical Assembly of CaMoO4 Nano-Octahedrons and Their Photoluminescence Properties. J. Phys. Chem. C 2011, 115, 5207–5219. [Google Scholar] [CrossRef]
  33. Pourbaix, M. Electrochemical Equilibria of Molybdenum, 1st ed.; Pergamon Press: Oxford, UK, 1966; pp. 273–279. [Google Scholar]
  34. Rietveld, H.M. The Crystal Structure of Some Alkaline Earth Metal Uranates of the Type M3 UO6. Acta Crystallogr. 1966, 20, 508–513. [Google Scholar] [CrossRef]
  35. Rodríguez-Carvajal, J. Abstracts of the Satellite Meeting on Powder Diffraction. In Proceedings of the XV Congress of the IUCr, Toulouse, France, 19–28 July 1990; p. 127. [Google Scholar]
  36. Regmi, C.; Kshetri, Y.K.; Kim, T.-H.; Pandey, R.P.; Lee, S.W. Visible-Light-Induced Fe-Doped BiVO4 Photocatalyst for Contaminated Water Treatment. Mol. Catal. 2017, 432, 220–231. [Google Scholar] [CrossRef]
  37. Neto, N.F.A.; Dias, B.P.; Tranquilin, R.L.; Longo, E.; Li, M.; Bomio, M.R.D.; Motta, F.V. Synthesis and Characterization of Ag+ and Zn2+ Co-Doped CaWO4 Nanoparticles by a Fast and Facile Sonochemical Method. J. Alloys Compd. 2020, 823, 153617. [Google Scholar] [CrossRef]
  38. Singh, N.; Kumar, U.; Jatav, N.; Sinha, I. Photocatalytic Degradation of Crystal Violet on Cu, Zn Doped BiVO4 Particles. Langmuir ACS J. Surf. Colloids 2024, 40, 8450–8462. [Google Scholar] [CrossRef]
  39. Hume-Rothery, W.; Raynor, G.V., XI. Atomic and Ionic Radii.—II. Application to the Theory of Solid Solubility in Alloys. Lond. Edinb. Dublin Philos. Mag. J. Sci. 1938, 26, 143–152. [Google Scholar] [CrossRef]
  40. Shannon, R.D. Revised Effective Ionic Radii and Systematic Studies of Interatomic Distances in Halides and Chalcogenides. Acta Crystallogr. Sect. A 1976, 32, 751–767. [Google Scholar] [CrossRef]
  41. Skibiński, T.; Kaczmarek, S.M.; Leniec, G.; Tsuboi, T.; Nakai, Y.; Berkowski, M.; Kowalski, Z.; Huang, W. Propriétés Magnétiques et Optiques Des Monocristaux de PbMoO4 Co-Dopés. J. Cryst. Growth 2014, 401, 802–806. [Google Scholar] [CrossRef]
  42. Roy, K.S.; Subramaniam, C.; Panchakarla, L.S. Non-Stoichiometry Induced Exsolution of Metal Oxide Nanoparticles via Formation of Wavy Surfaces and Their Enhanced Electrocatalytic Activity: Case of Misfit Calcium Cobalt Oxide. ACS Appl. Mater. Interfaces 2021, 13, 9897–9907. [Google Scholar] [CrossRef]
  43. Momma, K.; Izumi, F. VESTA3 for Three-Dimensional Visualization of Crystal, Volumetric and Morphology Data. J. Appl. Crystallogr. 2011, 44, 1272–1276. [Google Scholar] [CrossRef]
  44. Klug, H.P.; Alexander, L.E. X-Ray Diffraction Procedures for Polycrystalline and Amorphous Materials, 1st ed.; Wiley: New York, NY, USA, 1954; pp. 245–255. [Google Scholar]
  45. Basiev, T.T.; Sobol, A.A.; Voronko, Y.K.; Zverev, P.G. Spontaneous Raman Spectroscopy of Tungstate and Molybdate Crystals for Raman Lasers. Opt. Mater. 2000, 15, 205–216. [Google Scholar] [CrossRef]
  46. Porto, S.P.S.; Scott, J.F. Raman Spectra of CaWO4, SrWO4, CaMoO4, and SrMoO4. Phys. Rev. 1967, 157, 716–719. [Google Scholar] [CrossRef]
  47. Khanna, R.K.; Brower, W.S.; Guscott, B.R.; Lippincott, E.R. Laser Induced Raman Spectra of Some Tungstates and Molybdates. J. Res. Natl. Bur. Stand. Sect. Phys. Chem. 1968, 72A, 81. [Google Scholar] [CrossRef]
  48. Zhao, Z.; Sui, Z.; Wei, X.; Zuo, J.; Zhang, X.; Dai, R.; Zhang, Z.; Ding, Z. Structure Transformation and Remarkable Site-Distribution Modulation of Eu3+ Ions in CaMoO4:Eu3+ Nanocrystals under High Pressure. CrystEngComm 2015, 17, 7905–7914. [Google Scholar] [CrossRef]
  49. Guan, X.; Ren, Y.; Chen, S.; Yan, J.; Wang, G.; Zhao, H.; Zhao, W.; Zhang, Z.; Deng, Z.; Zhang, Y.; et al. Charge Separation and Strong Adsorption-Enhanced MoO3 Visible Light Photocatalytic Performance. J. Mater. Sci. 2020, 55, 5808–5822. [Google Scholar] [CrossRef]
  50. Schmid, T.; Dariz, P. Shedding Light onto the Spectra of Lime: Raman and Luminescence Bands of CaO, Ca(OH)2 and CaCO3. J. Raman Spectrosc. 2015, 46, 141–146. [Google Scholar] [CrossRef]
  51. Phuruangrat, A.; Thongtem, T.; Thongtem, S. Barium Molybdate and Barium Tungstate Nanocrystals Synthesized by a Cyclic Microwave Irradiation. J. Phys. Chem. Solids 2009, 70, 955–959. [Google Scholar] [CrossRef]
  52. Elorika, P.; Anwar, S.; Anwar, S. Impact of Synthesis-Induced Disorder on the Structural, Electrical, and Optical Properties of BaTi1−xHfxO3, 0 ≤ x ≤ 0.08. Mater. Res. Bull. 2023, 167, 112424. [Google Scholar] [CrossRef]
  53. Aafiya; Abushad, M.; Arshad, M.; Naseem, S.; Ahmed, H.; Ansari, A.; Chakradhary, V.K.; Husain, S.; Khan, W. Synthesis and Role of Structural Disorder on the Optical, Magnetic and Dielectric Properties of Zn Doped NiFe2O4 Nanoferrites. J. Mol. Struct. 2022, 1253, 132205. [Google Scholar] [CrossRef]
  54. Bersani, D.; Lottici, P.P.; Ding, X.-Z. Phonon Confinement Effects in the Raman Scattering by TiO2 Nanocrystals. Appl. Phys. Lett. 1998, 72, 73–75. [Google Scholar] [CrossRef]
  55. Korepanov, V.I.; Chan, S.-Y.; Hsu, H.-C.; Hamaguchi, H. Phonon Confinement and Size Effect in Raman Spectra of ZnO Nanoparticles. Heliyon 2019, 5, e01222. [Google Scholar] [CrossRef]
  56. Kumar, V.; Saxena, S.K.; Kaushik, V.; Saxena, K.; Shukla, A.K.; Kumar, R. Silicon Nanowires Prepared by Metal Induced Etching (MIE): Good Field Emitters. RSC Adv. 2014, 4, 57799–57803. [Google Scholar] [CrossRef]
  57. Im, H.S.; Park, K.; Kim, J.; Kim, D.; Lee, J.; Lee, J.A.; Park, J.; Ahn, J.-P. Strain Mapping and Raman Spectroscopy of Bent GaP and GaAs Nanowires. ACS Omega 2018, 3, 3129–3135. [Google Scholar] [CrossRef]
  58. Xingchen, Y.; Zhitian, F.; Rui, N.; Long, Z.; Haiyan, L. A Facile Synthesis of Flower-like NiCo-LDH for High Specific Capacitance Pseudosupercapacitor Positive Materials | Request PDF. J. Mater. Sci. 2024, 59, 4225–4235. [Google Scholar] [CrossRef]
  59. Gao, X.; Zu, W.; Wu, B.; Dong, H.; Shi, W.; Wang, Y. Effects of Transition Metal Doping on Surface Properties and Resistance to Cl Adsorption of α-Al2O3. Surf. Sci. 2021, 713, 121909. [Google Scholar] [CrossRef]
  60. Raizada, P.; Soni, V.; Kumar, A.; Singh, P.; Parwaz Khan, A.A.; Asiri, A.M.; Thakur, V.K.; Nguyen, V.-H. Surface Defect Engineering of Metal Oxides Photocatalyst for Energy Application and Water Treatment. J. Mater. 2021, 7, 388–418. [Google Scholar] [CrossRef]
  61. Tu, G.; Wang, H.; Tu, B.; Xu, P.; Ren, L.; Huang, Q.; Yang, R.; Wang, W.; Fu, Z. Achieving Near-Theoretical Transmittance in MgAl2O4 Ceramic at Reduced Sintering Temperature via Solution Substitution. J. Eur. Ceram. Soc. 2025, 45, 117382. [Google Scholar] [CrossRef]
  62. Perro, A.; Reculusa, S.; Ravaine, S.; Bourgeat-Lami, E.; Duguet, E. Design and synthesis of Janus micro- and nanoparticles. J. Mater. Chem. 2005, 15, 3745–3760. [Google Scholar] [CrossRef]
  63. Dong, X.; Zhang, X.; Wu, P.; Zhang, Y.; Liu, B.; Hu, H.; Xue, G. Divanadium-Substituted Phosphotungstate Supported on Magnetic Mesoporous Silica Nanoparticles as Effective and Recyclable Catalysts for the Selective Oxidation of Alcohols. ChemCatChem 2016, 8, 3680–3687. [Google Scholar] [CrossRef]
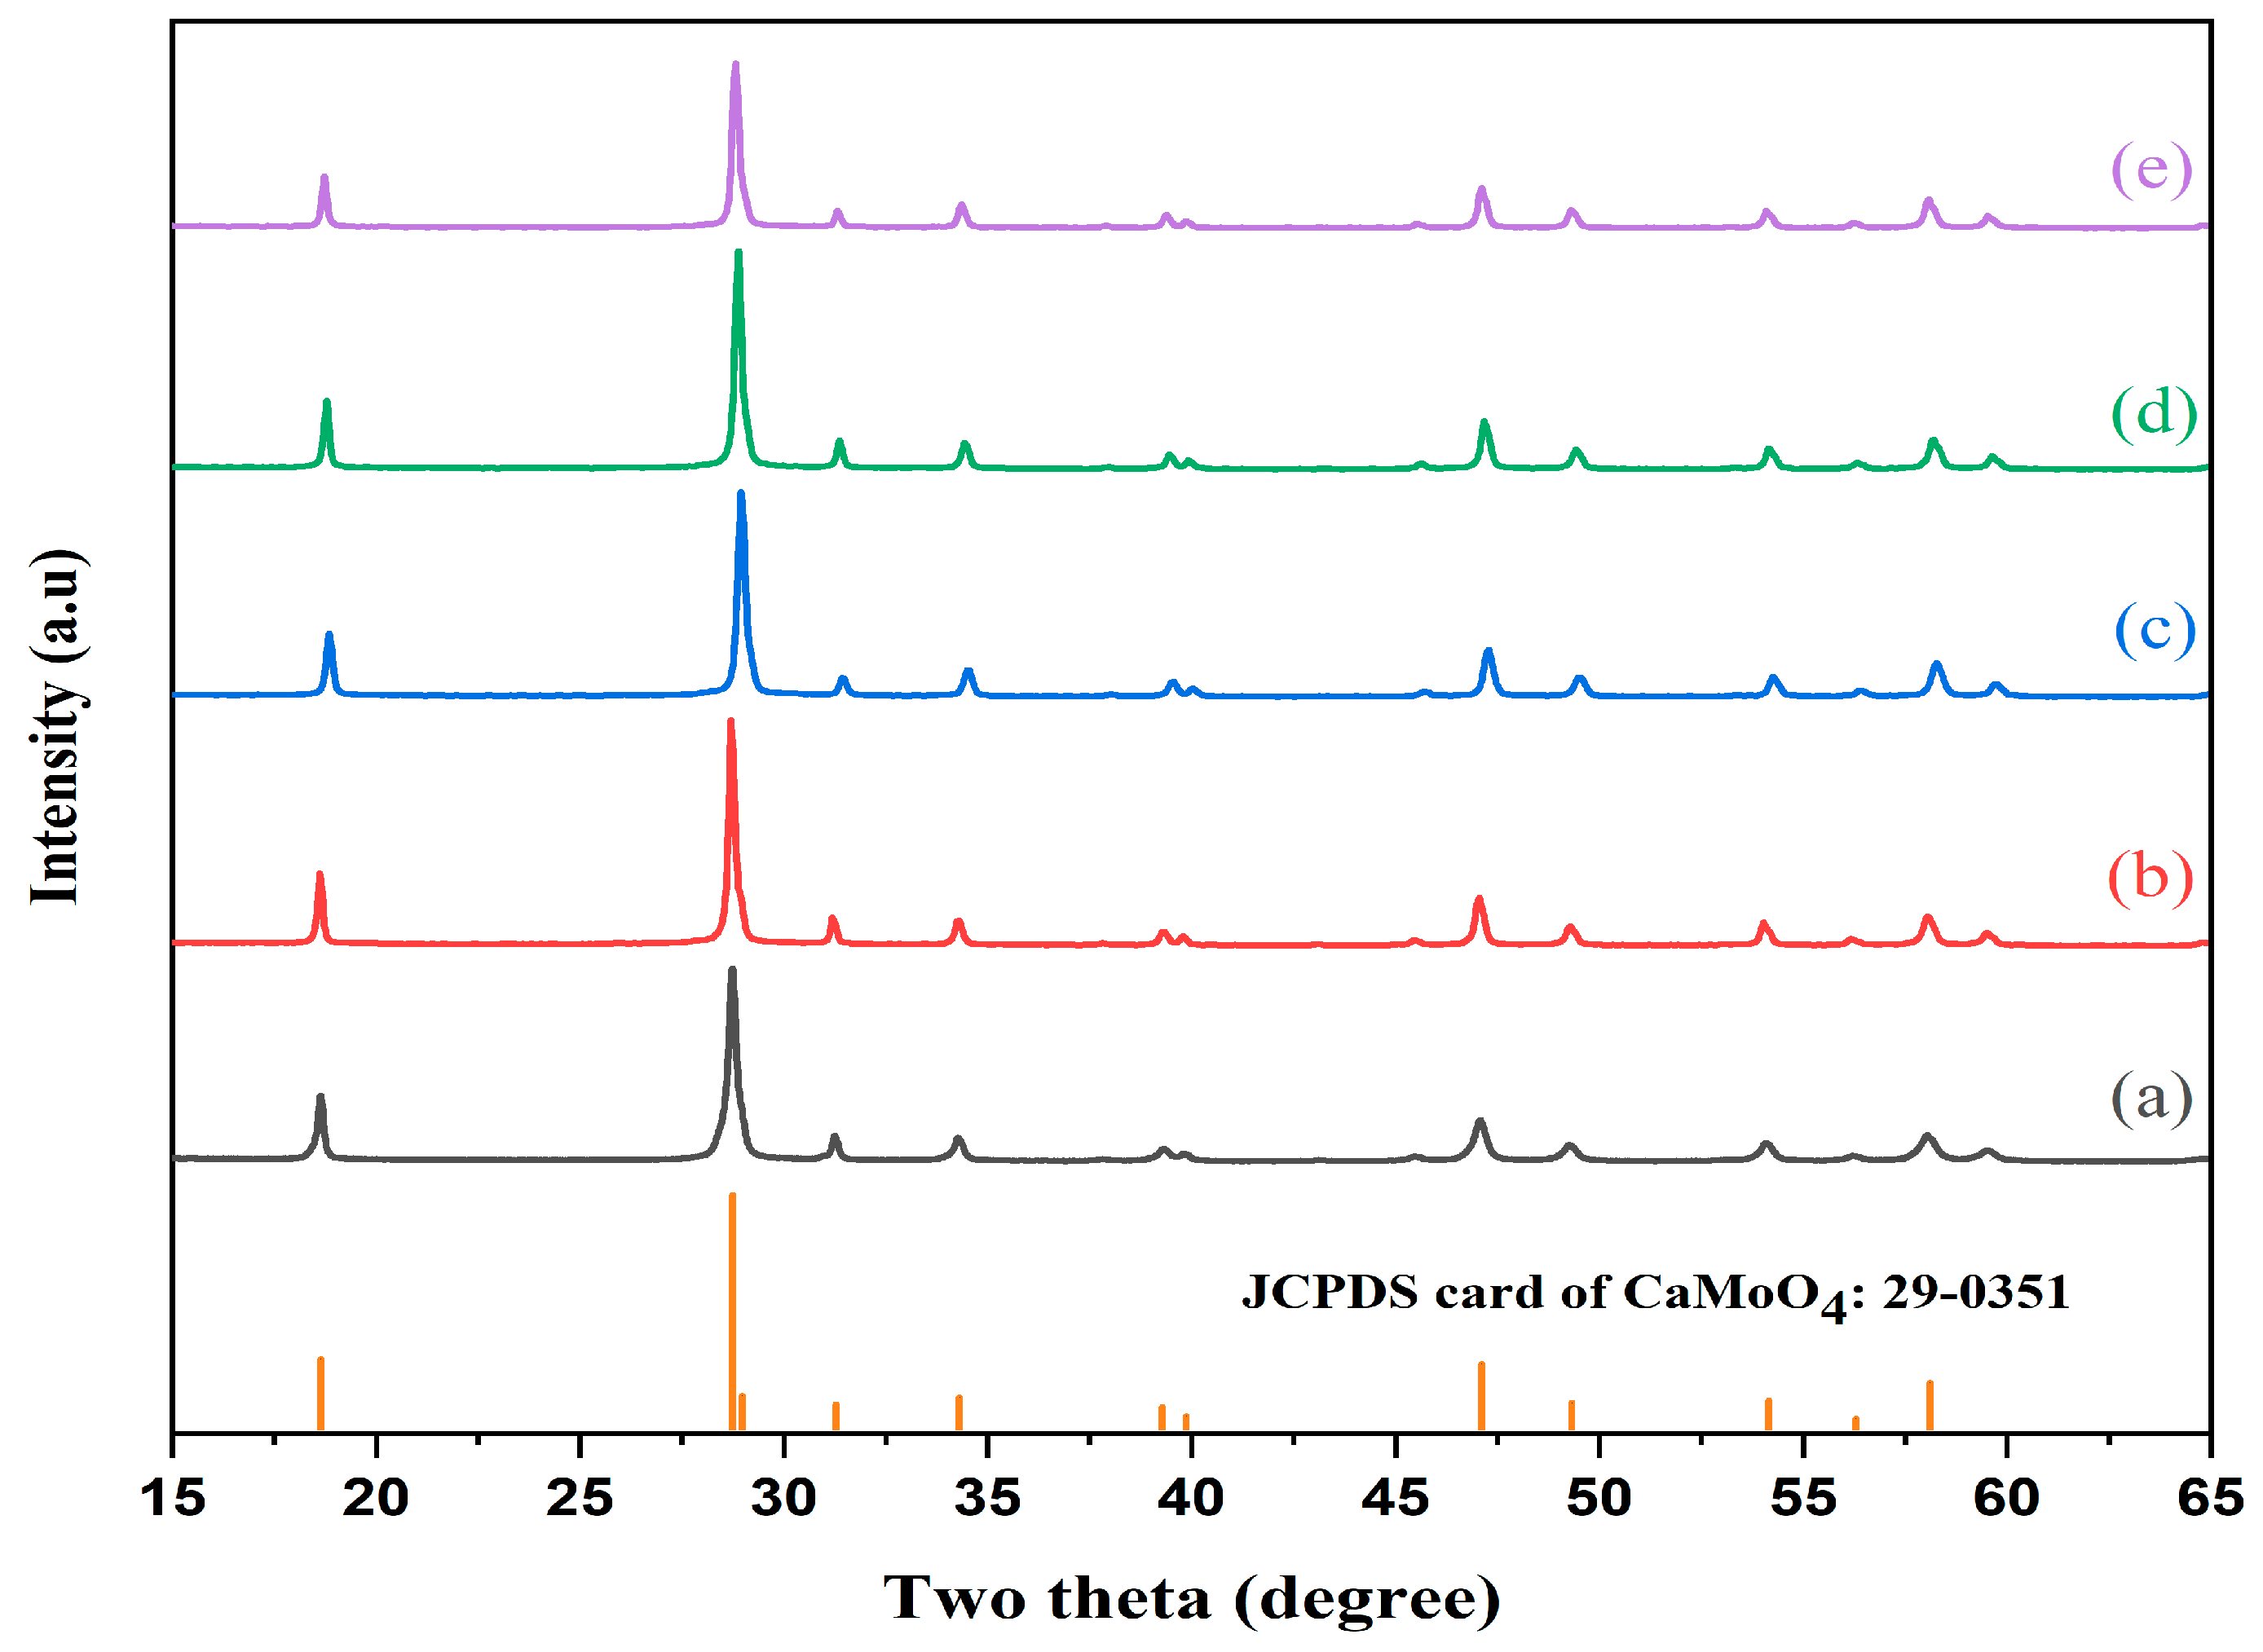
Figure 1. XRD patterns of Ca(1−x)CoxMoO4 powders prepared at room temperature: (a) x = 0.0, (b) x = 0.02, (c) x = 0.04, (d) x = 0.06, and (e) x = 0.08. The standard data for the scheelite structure of CaMoO4 (JCPDS No. 29-0351) are shown at the bottom.
Ceramics 08 00110 g001
Figure 2. Rietveld refinement plots for the Co-doped CaMoO4 (x = 0.04) powder synthesized at room temperature. The top section displays the experimental XRD data (filled circles) alongside the simulated pattern (solid line). The bottom section shows the difference between the experimental and calculated patterns. The tick marks indicate the positions of the expected Bragg reflections.
Ceramics 08 00110 g002
Figure 3. Unit cell representation of Ca0.96Co0.04MoO4 crystal. For interpretation of the references to color in this figure legend, the reader is referred to the web version of this article.
Ceramics 08 00110 g003
Figure 4. Raman spectra of Co-doped CaMoO4 powders.
Ceramics 08 00110 g004
Figure 5. SEM images of Co-doped CaMoO4 powders with Co contents of (a) 0%, (b) 4%, (c) 6%, and (d) 8%.
Ceramics 08 00110 g005
Figure 6. Adsorption–desorption isotherm curves of N2 at 77 K for CaMoO4 and 6% Co-doped CaMoO4 nanoparticles.
Ceramics 08 00110 g006
Table 1. Rietveld refinement details for Ca(1−x)CoxMoO4, where x= 0.00–0.08.
ParametersCompositions
x = 0.0x = 0.02x = 0.04x = 0.06x = 0.08
Atomic positions
Cation 4a (Mo)
x0.00000.00000.00000.00000.0000
y0.25000.25000.25000.25000.2500
z0.12500.12500.12500.12500.1250
Cation 4b (Ca/Co)
x0.00000.00000.00000.00000.0000
y0.25000.25000.25000.25000.2500
z0.62500.62500.62500.62500.6250
Anion 16f (O)
x0.152360.153840.149100.147590.14850
y0.494950.496700.496190.495830.50044
z0.208300.208800.210840.207360.21109
Lattice parameters
a (Å)5.221665.222855.227145.225675.23307
c (Å)11.4246011.4434011.4506011.4522011.45686
c/a2.187922.191032.190602.191532.18932
Unit cell volume (Å3)311.500312.154312.864312.732313.746
Bonds lengths (Å)
(Ca/Co)-O2.45635(5)2.45214(6)2.46791(3)2.45869(4)2.46208(3)
2.44428(5)2.43689(7)2.42918(3)2.45861(4)2.41577(3)
Mo-O1.78173(3)1.79593(5)1.79710(2)1.77052(3)1.81503(2)
Crystallite size (nm)32± 443± 437± 241± 343 ± 3
R factors
Rp3.473.383.083.072.88
Rwp4.524.413.964.063.71
χ22.052.131.812.101.59
Table 2. Raman shift positions and corresponding FWHM values obtained from pseudo-Voigt fitting of the Ca1−xCoxMoO4 (x = 0–0.08) spectra.
xυ1 (Ag) ModeT(Bg) Mode
Raman Shift
(cm−1)
FWHM
(cm−1)
Raman Shift
(cm−1)
FWHM
(cm−1)
0.00879.99 ± 0.1011.54 ± 0.30111.62 ± 0.2310.11 ± 0.64
0.02880.05 ± 0.1011.60 ± 0.29111.67 ± 0.2310.09 ± 0.70
0.04879.95 ± 0.1111.48 ± 0.31111.62 ± 0.2310.10 ± 0.60
0.06880.17 ± 0.1010.86 ± 0.26111.87 ± 0.249.84 ± 0.61
0.08880.13 ± 0.0910.83 ± 0.25112.48 ± 0.249.30 ± 0.66
Table 3. Chemical composition of Co-doped CaMoO4 powders as determined by EDS.
SamplesCa(at.%)Co(at.%)Mo(at.%)O(at.%)Co/(Ca + Co)Mo/(Ca + Co)
CaMoO415.51-17.6966.7901.14
2% Co-CaMoO410.450.2210.5778.760.020.99
4% Co-CaMoO417.20.5917.2464.960.030.97
6% Co-CaMoO410.590.5410.7078.160.050.96
8% Co-CaMoO410.020.8610.8378.290.080.99
Table 4. BET surface area, pore size, and pore volume of the undoped sample and 6% Co-doped CaMoO4.
Surface Area (m2/g)Pore Size (nm)Pore Volume
(cm3/g)
CaMoO43.5913.070.024
6% Co-CaMoO410.7413.090.047
Disclaimer/Publisher’s Note: The statements, opinions and data contained in all publications are solely those of the individual author(s) and contributor(s) and not of MDPI and/or the editor(s). MDPI and/or the editor(s) disclaim responsibility for any injury to people or property resulting from any ideas, methods, instructions or products referred to in the content.