Article

Design and Analysis of Thermistors in Low Temperature Cofired Ceramics

Laboratoire des Sciences et Techniques de L’information, de la Communication et de la Connaissance, UMR CNRS 6285, IMT Atlantique, F-29238 Brest, France
*
Author to whom correspondence should be addressed.
Ceramics 2025, 8(3), 103; https://doi.org/10.3390/ceramics8030103
Submission received: 6 July 2025 / Revised: 23 July 2025 / Accepted: 4 August 2025 / Published: 7 August 2025

Abstract

In this work we investigate the integration possibility of a thermistor paste from ESL (ElectroScience Laboratory, now Vibrantz) to see if it is adapted for Vibrantz Low Temperature Cofired Ceramics (LTCC) L8 and A6M-E materials. An alumina-based sample is used as a reference circuit throughout this study. Square, two-squares-in-parallel and two-squares-in-series thermistors are tested, placed internally and externally. Resistive values are measured in a range from 25 °C to 300 °C. The variation in the resistive values among similar thermistors is significant, with a maximum standard deviation of 67%. However, in all cases, there is a positive linear relationship between resistance and temperature. The Temperature Coefficient of Resistance (TCR) value is calculated before and after annealing. In general, the L8 and Al2O3 samples exhibit higher TCR values than the A6M-E sample. Additionally, when placed internally, the TCR value decreases approximately 30% for both tested LTCC materials. An Energy-Dispersive X-ray Spectroscopy (EDX) material analysis has also been conducted on the samples, revealing that the main chemical components are oxide, silicon, calcium, and ruthenium but also some barium and titanium, which indicates SiO2, TiO2, BaTiO3 and RuO2 oxides in the thermistor paste. The possibility to implement thermistors internally and externally on Vibrantz LTCC without delamination problems is endorsed by this study.

Graphical Abstract

1. Introduction

A thermistor is a resistor that changes its value as a function of temperature. Measuring the change in resistance can be much easier than measuring the temperature directly. The small formfactor and passive operation (no biasing needed) of a thermistor allows it to be easily integrated into any packaged device. Some thermistors are packaged as Surface Mount Devices (SMDs) that can be readily soldered onto a motherboard. These are fabricated by screen printing a thermistor pattern and terminals onto an alumina substrate, which is then subjected to firing and dicing.
Since quite some time, researchers who work on Low Temperature Cofired Ceramics (LTCC) have studied their integration into LTCC modules, positioned internally or externally. The advantage of this approach is that the thermistor element can be placed exactly at the position where the temperature is to be monitored. When placed inside the module, real estate area can be gained which allows for miniaturization. This is advantageous for increased integration in 5G and 6G telecommunication devices, as well as for sensing devices in health, defense or space applications. Placing the thermistor inside the LTCC material, is also profitable for use in harsh environments, as the inherently hermetic ceramic, surrounding the thermistor, provides protection. Furthermore, there are no added costs for logistics or for soldering operations.
Previous work on this subject have been published in [1] where two positive temperature coefficient (PTC) thermistor pastes from DuPont, DP5092D and DP5093D, were screen printed onto already fired DuPont 951 material, a process known as post-firing. This process proved effective; however, the possibility to integrate a thermistor internally is excluded, resulting in the loss of the advantage of multilayer integration in LTCC. Co-firing experiments combining thermistor pastes and LTCC can also be found in the literature.
The use of Negative Temperature Coefficient (NTC) paste Emca/Remex, NTC4993, and PTC paste PTC5093 from Micromax, were tested on DuPont 951 and ESL41020 material in [2,3], respectively. In both cases, it was concluded that externally placed thermistors functioned well. Conversely, internally placed (buried) thermistors resulted in delamination of the LTCC structure, which excludes them from any practical application. In [4], an NTC thermistor paste, R131, from Heraeus was used internally and externally with DuPont 951 tape. No delamination problem was reported in this work, and a very accurate temperature controlled microfluidic device was obtained; however limited data on the thermistor’s functionality was provided.
Finally, the in-house fabrication of a Ni-Co-Zn-Mn spinel NTC thermistor paste was reported for use on Heratape CT700 from Heraeus with the objective to create internal thermistors. The use of thermistor paste with CT700 tape resulted in cracks, so to circumvent this problem, a specially tailored tape was sandwiched between the CT700 and the NTC thermistor layers to avoid delamination and cracks [5]. Thus, from these reported results, primarily concerning DuPont 951 tape, to date, thermistors must be placed on the external layer by post-firing, or specially fabricated and tailored paste and tape must be used for internal applications.
According to the available literature on thermistors in LTCC, no work has been published on Vibrantz tape material, despite Vibrantz commercializing two well-established LTCC materials. Their L8 and the A6M-E tape materials have relative permittivities of 7.3 and 5.9 at 10 GHz, respectively [6]. These medium-k values facilitate miniaturization of microwave devices, as the size of the wavelength scales are inversely related to the square root of the relative permittivity. In this work we aim to test the compatibility of a PTC thermistor paste fabricated by ElectroScience Laboratory (acquired by Vibrantz a few years ago) with the LTCC materials L8 and A6M-E. The PTC thermistor paste PTC2611-I was initially developed for post-firing on alumina, meaning it is not designed to shrink during firing, unlike the LTCC materials. As observed in earlier studies, this may induce delamination between the thermistor and the ceramic layers during co-firing, which underscores the importance of this study. The research objective is to evaluate the compatibility of this thermistor paste with the Vibrantz tape materials for both internal and external thermistor applications.

Temperature Coefficient of Resistance

A thermistor’s performance is defined by its Temperature Coefficient of Resistance (TCR) value. For a linear temperature change, TCR can be calculated using the following Formula (1), where R1 and R2 are the resistor’s value in ohm at temperatures T1 and T2 expressed in °C or K.
T C R [ p p m / ° C ] = R 2 R 1 R 1 ( T 2 T 1 ) × 10 6
A PTC thermistor exhibits a positive change in resistance as the temperature rises, while an NTC thermistor shows a decrease in resistance with an increase in temperature.

2. Materials and Methods

A 50.8 mm × 50.8 mm LTCC prototype was designed with four 10-mil layers of L8 and A6M-E, from Vibrantz Technologies, Huston, Texas, USA, respectively. The manufacturing file, in gerber format, 3771658_LTCC_CK_15_scale1_1_1625_gerber.zip, can be found in the Supplementary Materials section. The PTC thermistor paste is the PTC2611-I from ElectroScience Laboratory, ESL Electroscience, King of Prussia, Pennsylvania, USA, with a resistivity reported to be 21.5 ± 1.5 Ω for 15 µm thick layer (dried print thickness), a Temperature Coefficient of Resistance (TCR) of 3100 ± 200 ppm/°C and a usage range exceeding 300 °C [7]. The terminals are made with an AuPtPd paste from Vibrantz Technologies, Huston, Texas, USA, specifically CN36-020.
Half of the thermistors were placed on the third layer, thus buried in the structure, while the other half were placed on the top (external) layer. The design contains the following models:
  • 1 mm × 1 mm square (denoted □)
  • 2 mm × 4 mm (i.e., two 2 mm × 2 mm squares in parallel, denoted □//□)
  • 4 mm × 2 mm (i.e., two 2 mm × 2 mm squares in series, denoted □-□)
Each of these thermistors can be found on the internal and external layers, as shown in Figure 1a–c. In the case of internal thermistors, the terminal pads are accessible through cavity openings in the top layer.
The PTC specification does not say if the resistivity is sheet or bulk property. However, we should logically obtain R Ω for the one-squared item (1 mm × 1 mm), R/2 Ω for the parallel-squared (2 mm × 4 mm) and 2R Ω for the series-squared item (4 mm × 2 mm). As reported in [2,3], the resistive value of buried thermistors may be higher than external ones and can differ significantly from values achieved on alumina substrate. Therefore, we must accept that these values may deviate from any predictions based on the data sheet and that it is the change in resistance with temperature that is of primary importance.
In this study we decided to fabricate one L8 and one A6M-E-based prototype. The general LTCC fabrication scheme was performed using the following steps:
  • Slitting and blanking;
  • Cavity and alignment hole creation (1064 nm fiber laser, LEM2 from Laser Cheval, Marnay, France);
  • Screen printing of terminals followed by leveling and drying (EKRA M2H screen printer, from EKRA Automatisierungssysteme GmbH, Bönnigheim‚ Germany);
  • Screen printing of thermistors followed by leveling drying (EKRA M2H screen printer, from EKRA Automatisierungssysteme GmbH, Bönnigheim‚ Germany);
  • Stacking (using sacrificial tape ESL49000, from ESL Electroscience, King of Prussia, Pennsylvania, USA, in the cavities);
  • Lamination using a uniaxial press (Colorking, Fuzhou, China);
  • Firing (Nabertherm programmable furnace from Nabertherm GmbH, Lilienthal, Germany).
A reference prototype was also produced on fired 99% alumina (Al2O3), 635 µm thick substrate. In the case of alumina, all the thermistors were placed on the top layer, as burying them would be impossible. For this prototype, the production scheme followed steps 3-4-3-4-7 as listed above. In all cases, the screens used were 45° orientation steel 325 mesh, with a 20 µm thick emulsion. After 10 min of leveling, drying was performed at +70 °C for 10 min. The lamination settings were 70 °C for a duration of 10 min with 17 MPa of uniaxial pressure. The firing profiles were programmed according to Vibrantz recommendations for each tape material, specifically a dwell time of 825 °C for 30 min for the L8 samples and 850° for 15 min for the A6M-E samples.
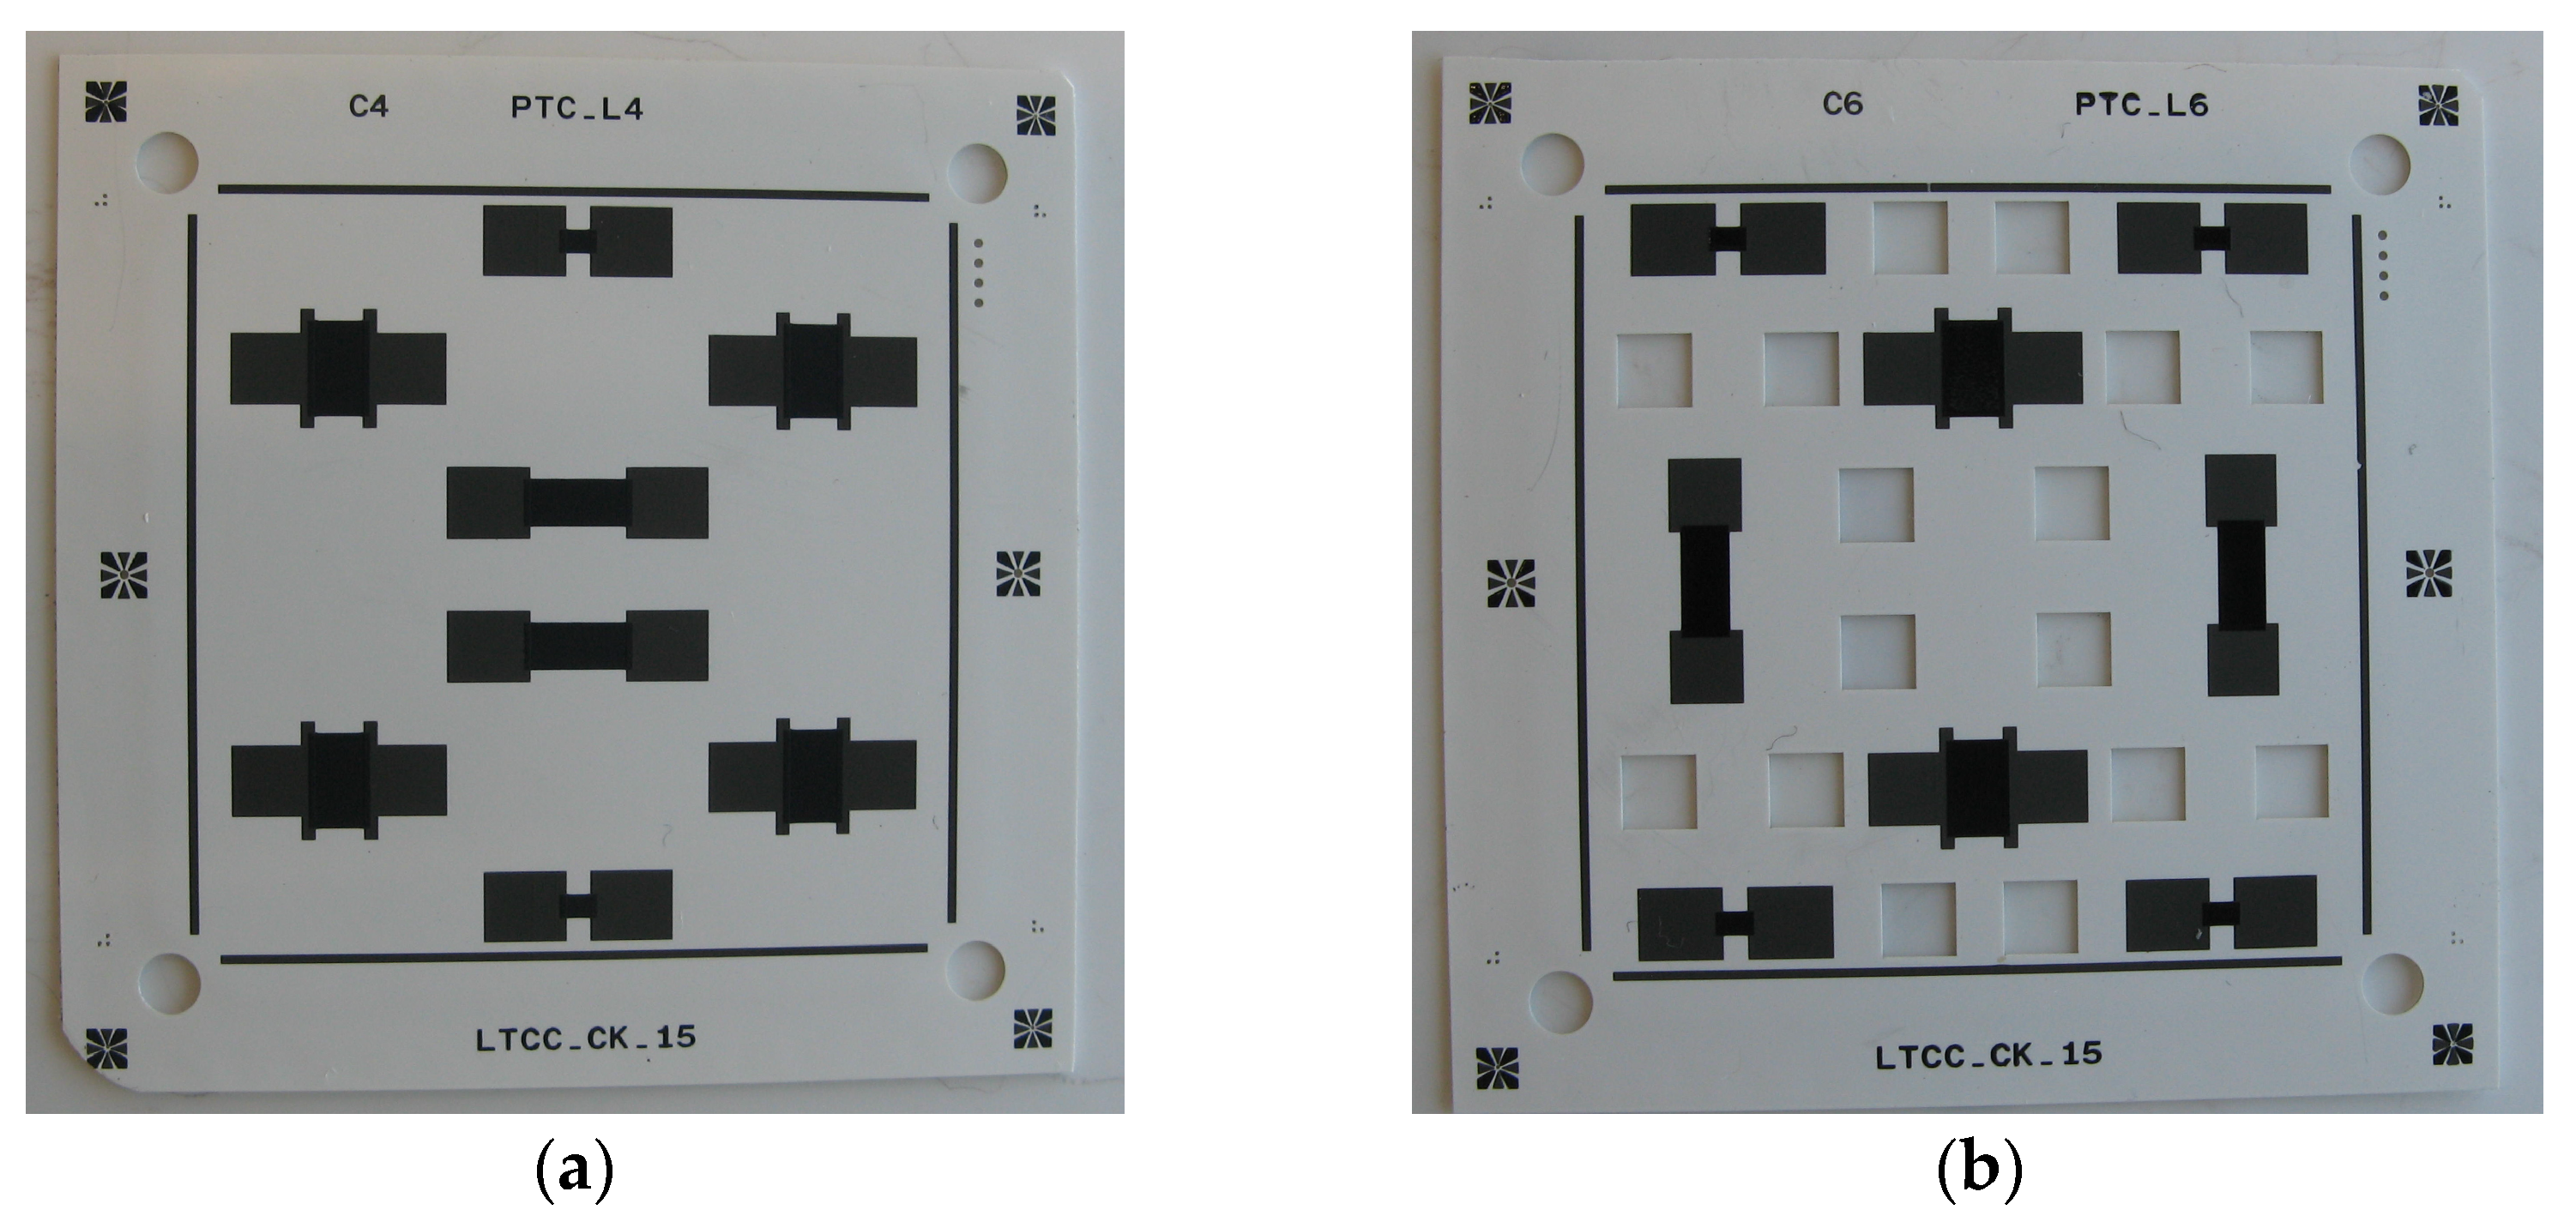
The fabrication of the prototypes can be understood from Figure 2, where the buried layer and the top layer are presented. Two additional layers were used as a base to ensure mechanical strength.
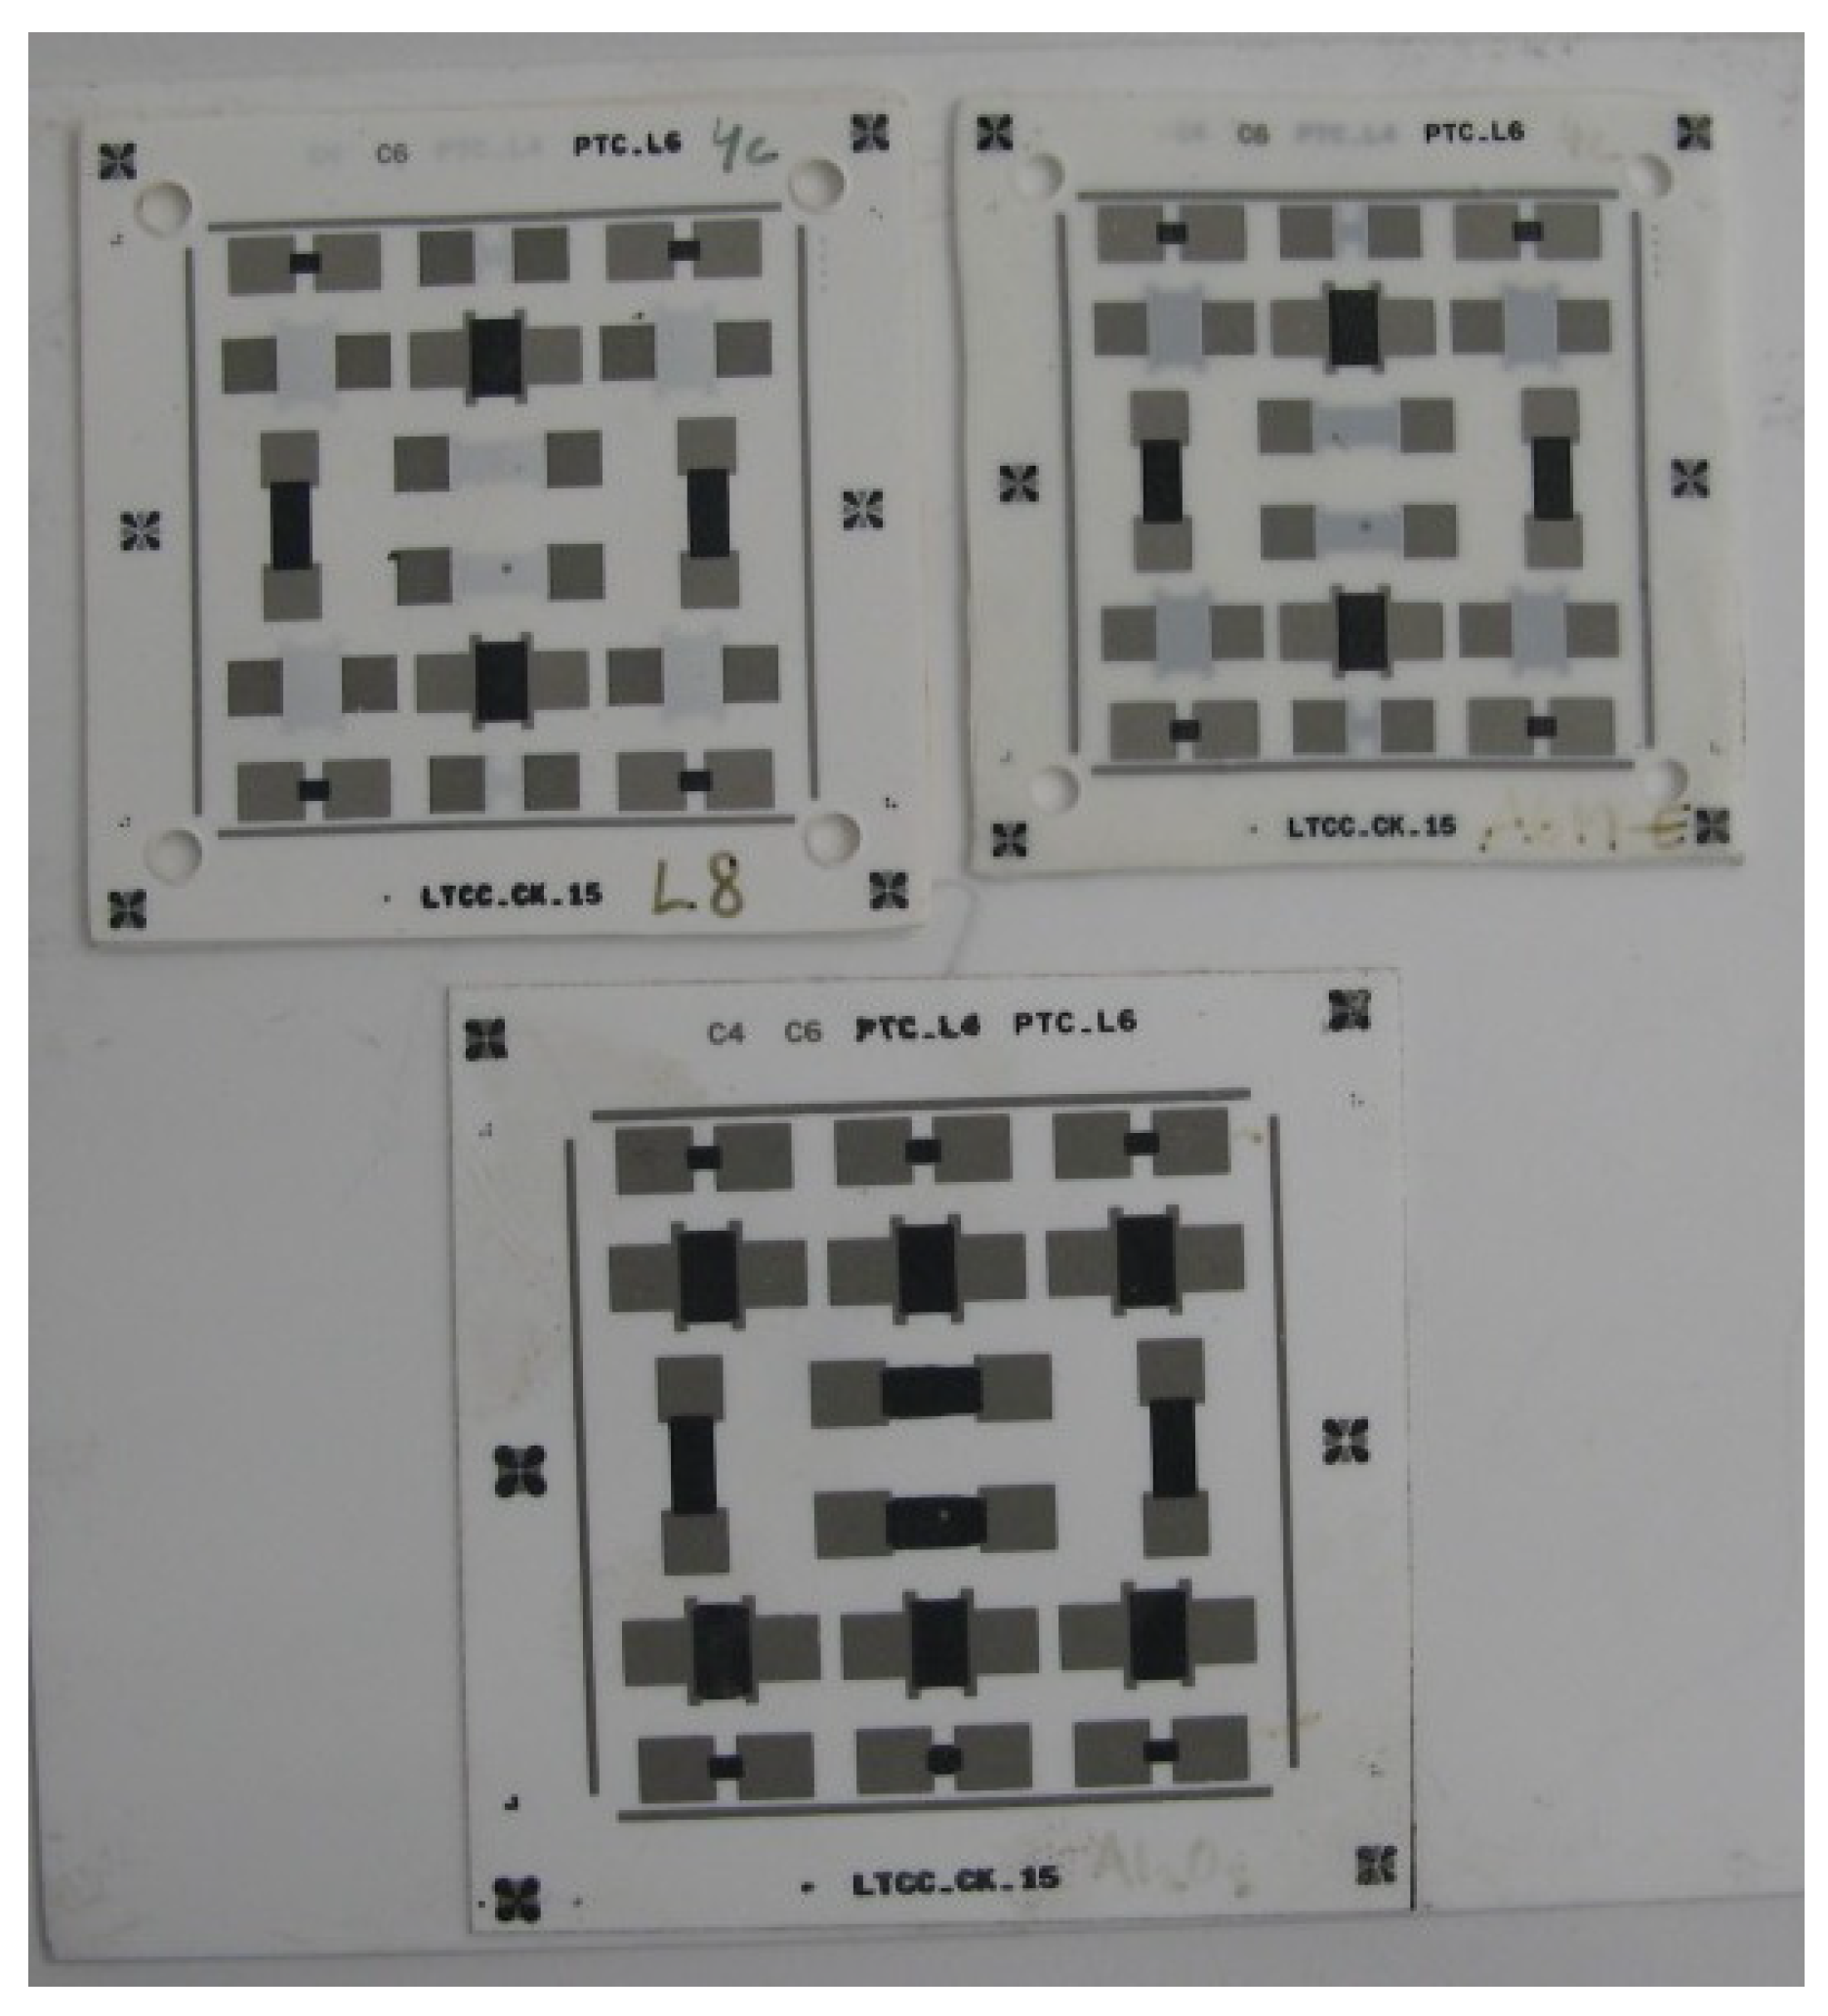
The finalized LTCC and alumina prototypes can be seen in Figure 3.

3. Results

Several analyses have been conducted during this work for the conclusions to be as valid as possible. Dimensional analysis was performed to verify the shape of the thermistors. Resistance variation from +25 °C to +300 °C have been measured on all prototypes before and after annealing (+150 °C for 136 h). All resistance data can be found in the Supplementary Materials, ceramics-08-00103_thermistor graph.xlsx. EDX analysis was performed after annealing, these data can be found in the file ceramics-08-00103_EDX.zip provided in the Supplementary Materials. Furthermore, a white-light interferometric profilometer was used, see also ceramics-08-00103-rougness-measurement in the Supplementary Materials, to perform profile measurements and print thickness, and delamination were assessed through cross sectioning.

3.1. Dimensional Analysis

As shown in Figure 3, the shrinkage is not the same for the two LTCC materials. The A6M-E is typically expected to shrink 15.4 ± 0.3% while the L8 is expected to shrink 13 ± 0.3% in x-y direction, according to the supplier. In our case, we obtained shrinkage values of 17.5% for the A6M-E and 12.5% for the L8 prototype, respectively. This difference can be attributed to an altered lamination procedure (uniaxial press instead of isostatic press), a lower pressure (17 MPa instead of the recommended 21 Mpa) and the use of a thermistor paste that is not intended for use with LTCC tapes. Notably, the A6M-E has shrunk more, while the L8 is very close to the expected values. Finally, the alumina-based circuit has not changed dimensions, as the screen printing is performed on already fired ceramics.
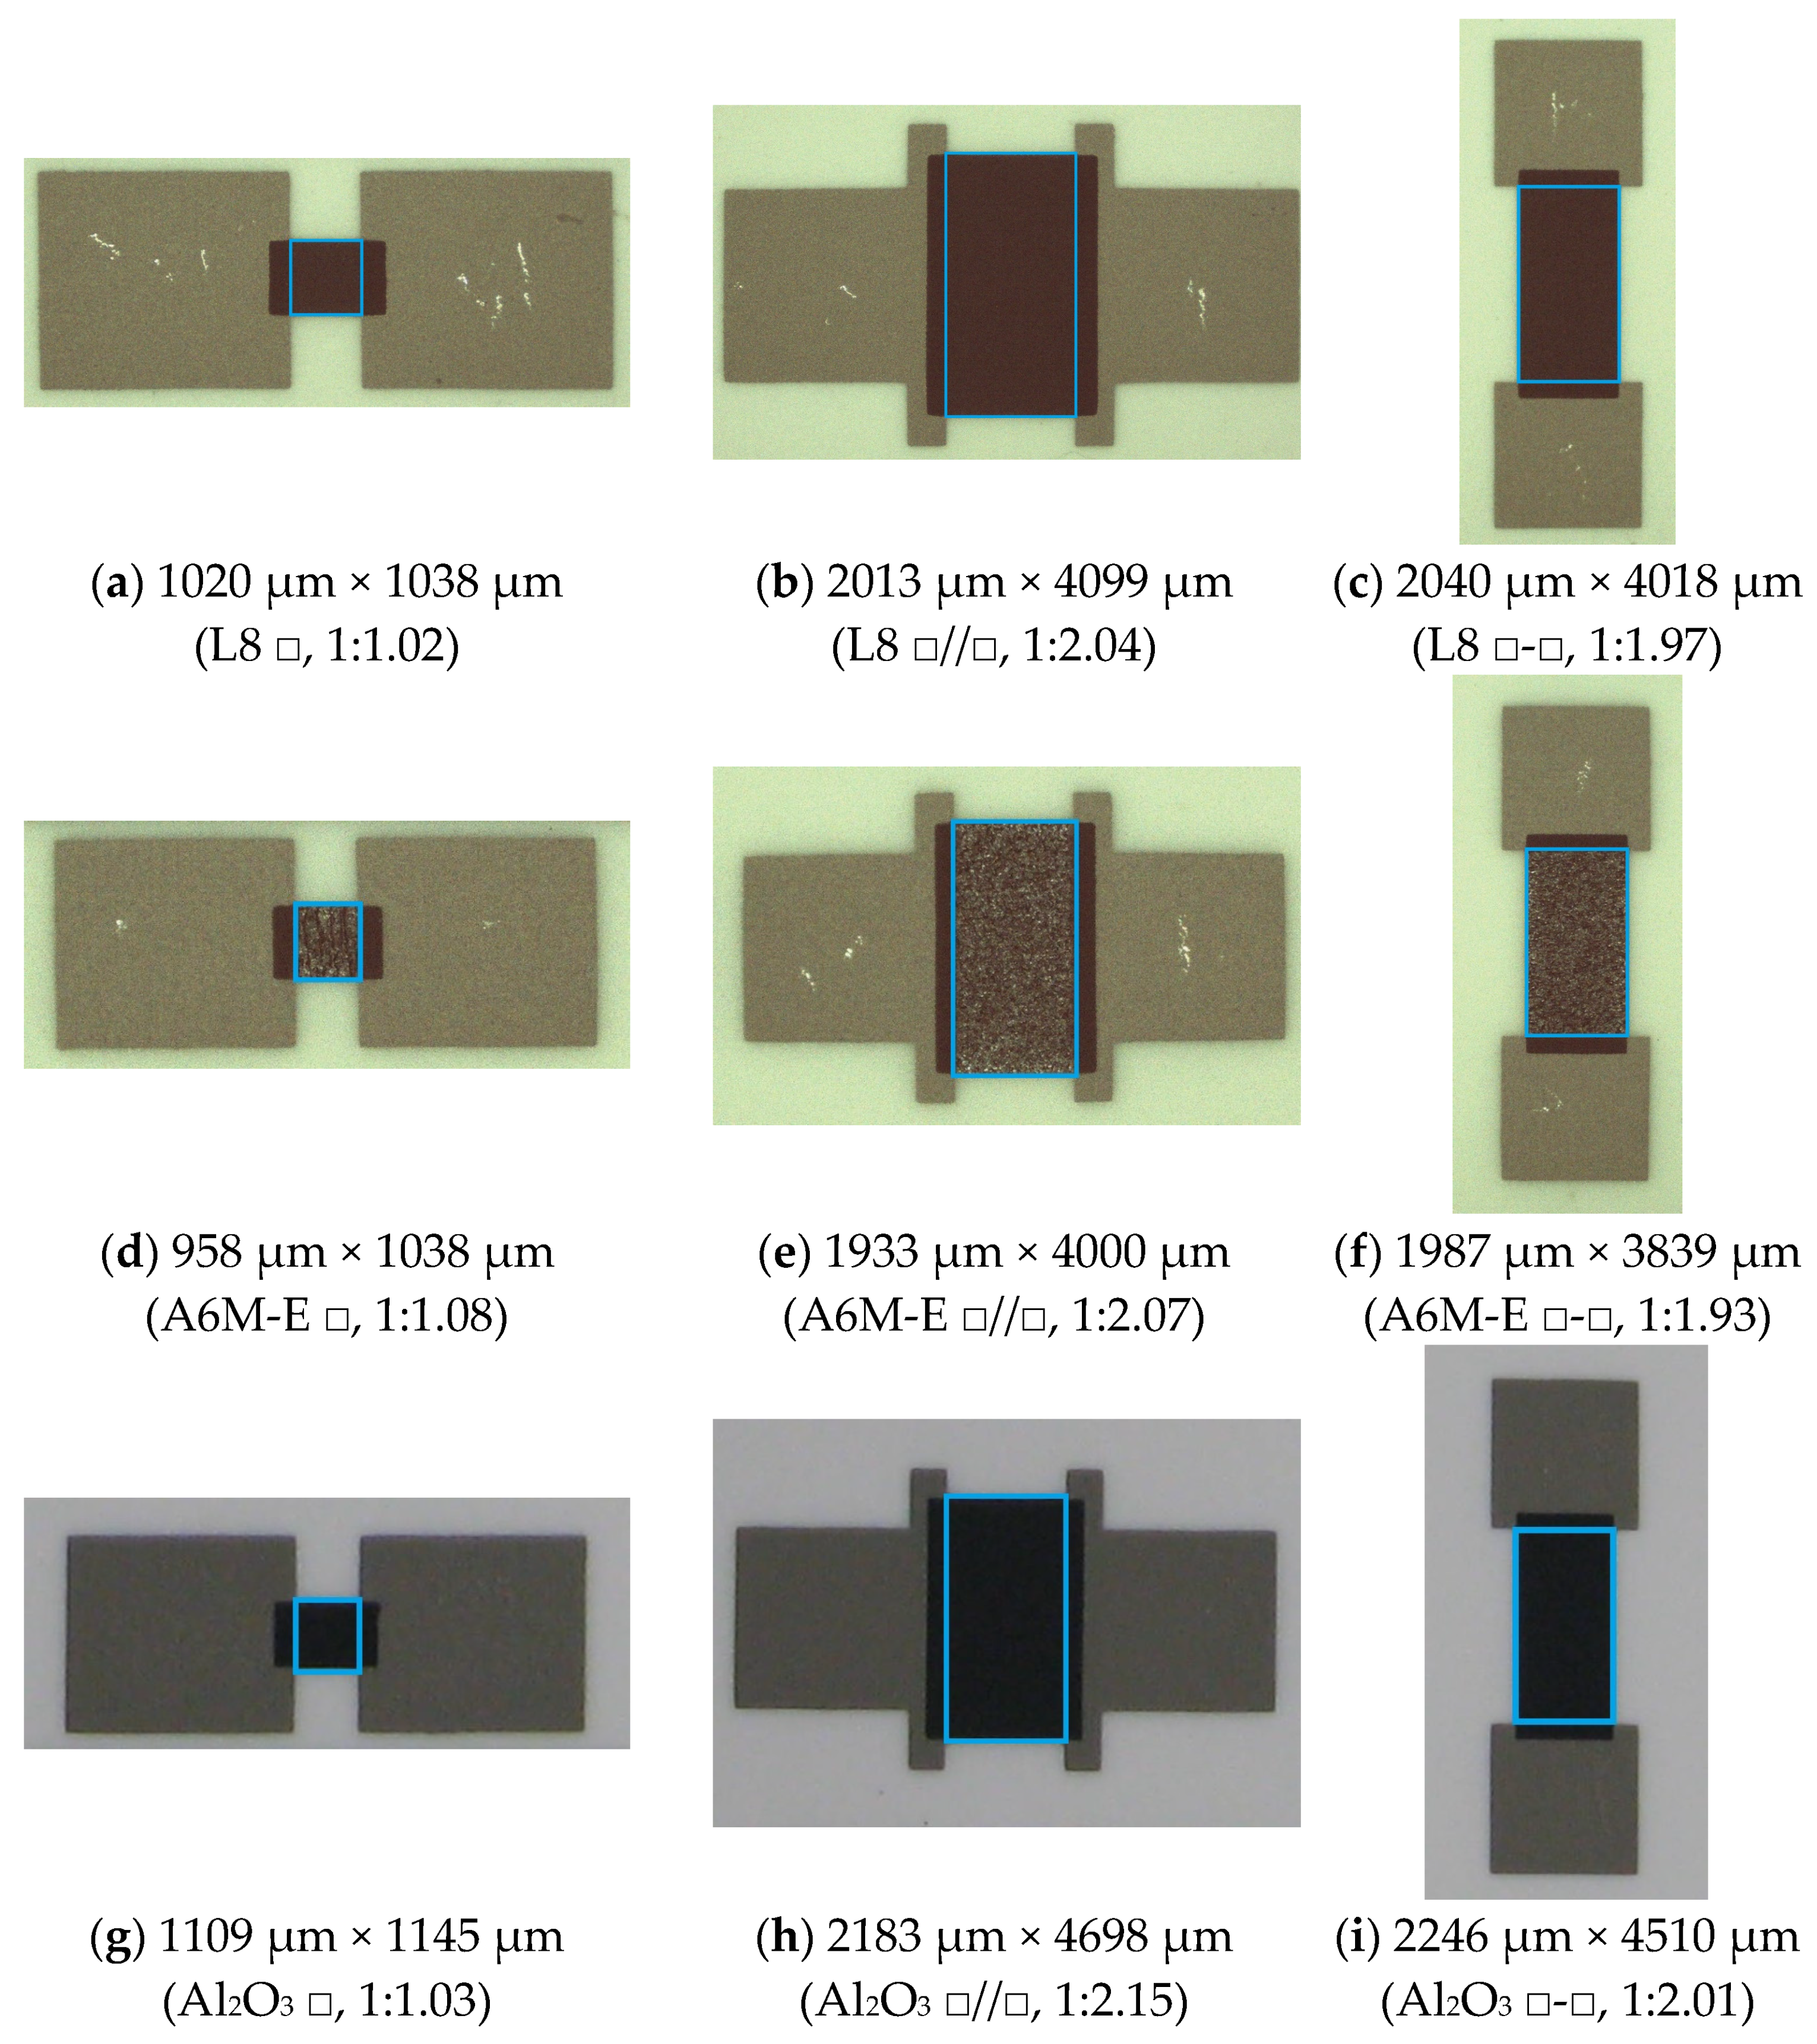
Regarding the shapes of the thermistors, the results from the top layer thermistors are presented in Figure 4. While we do not have perfect representations of the square, two-squares-parallel or two-squares-series configuration, the results fall within a small margin that is close enough to use the expected resistance formulas of R, R/2 and 2R as approximations for the three types of thermistors.
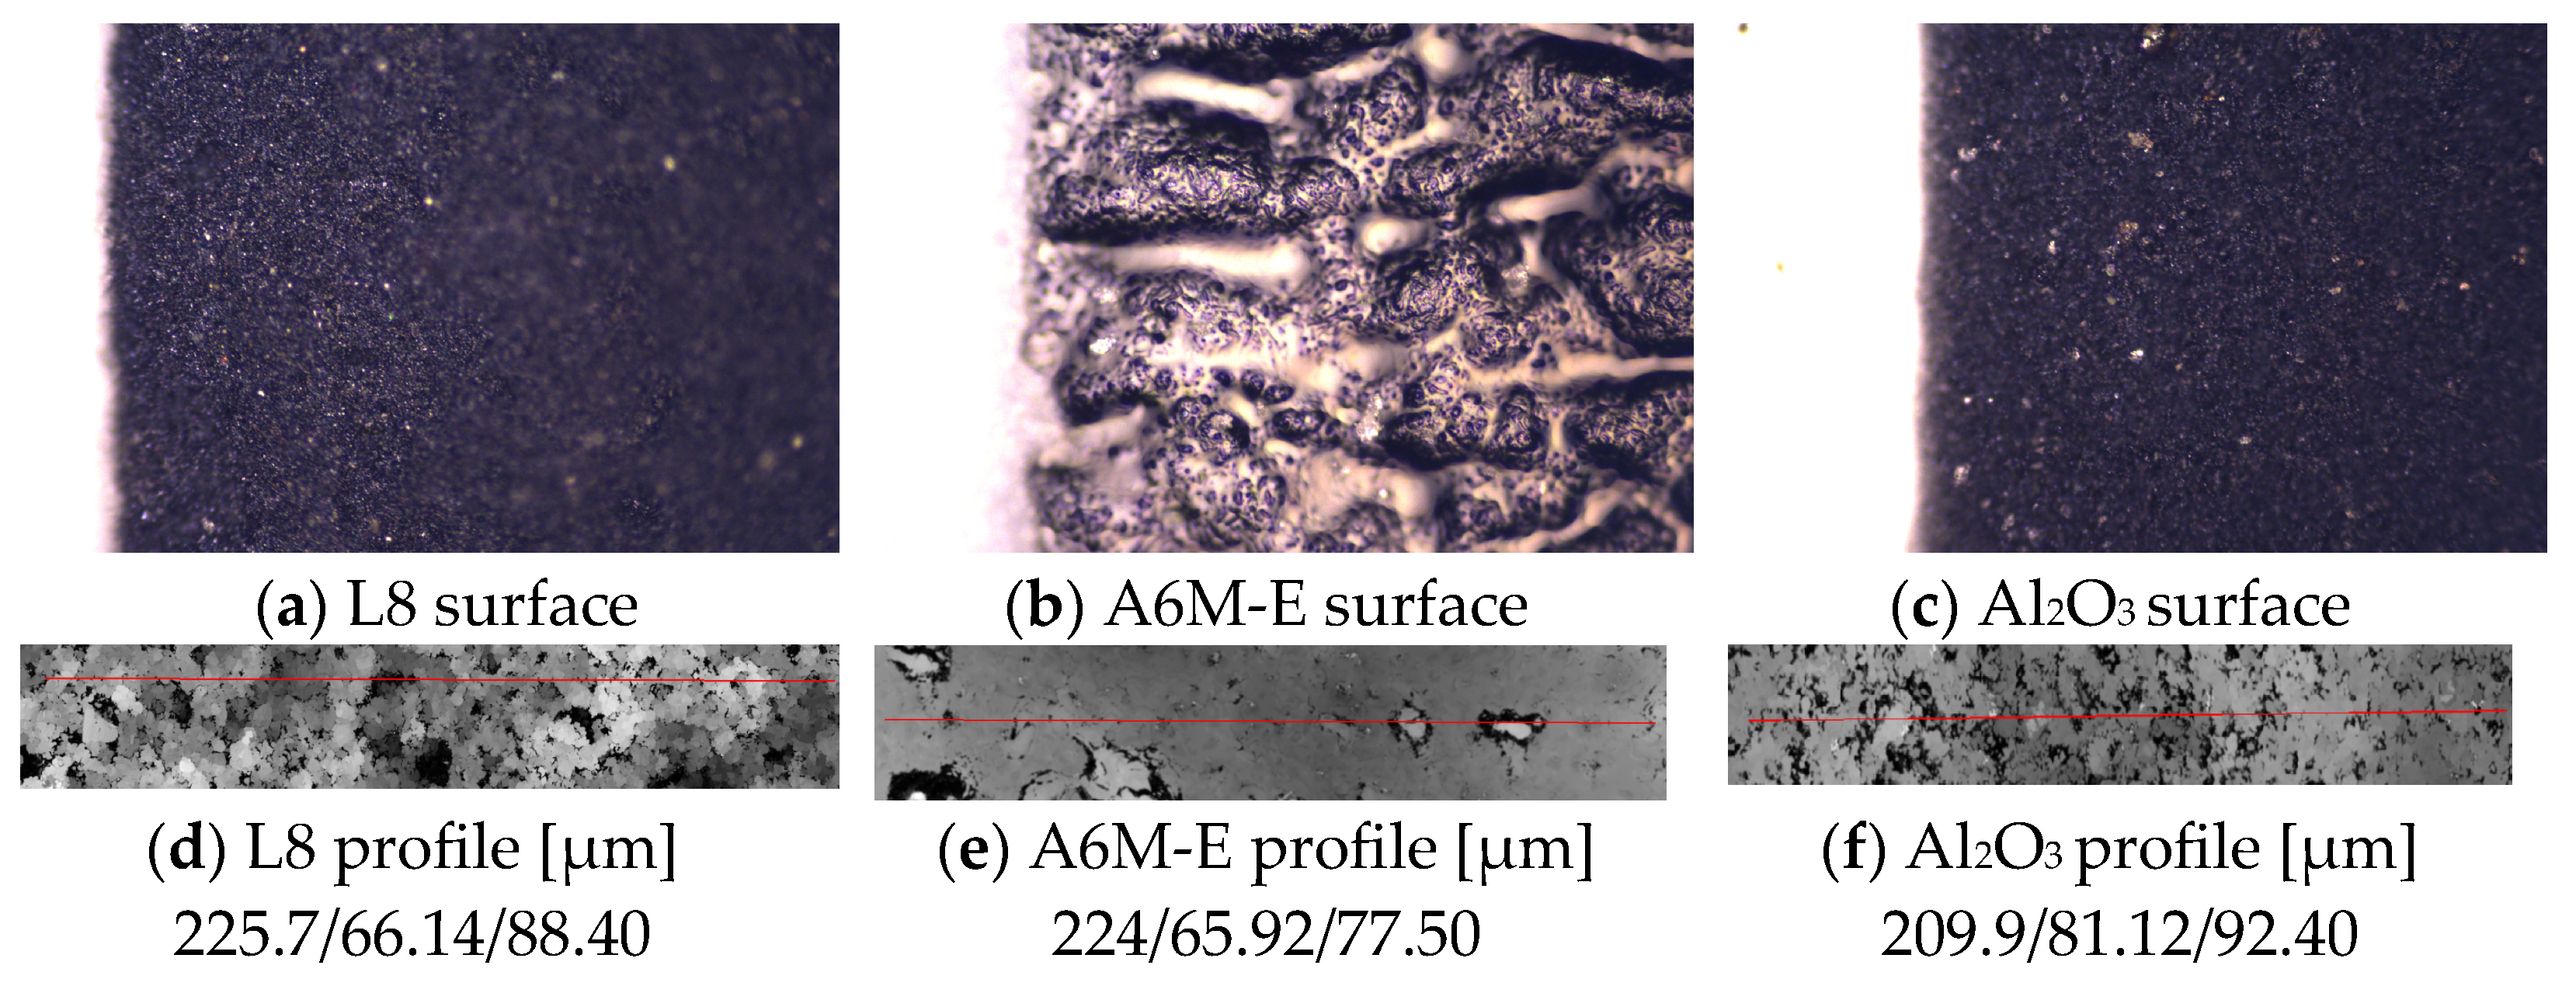
From the micrographs in Figure 5, taken with a Reichert-Jung microscope at 50× magnification, the surface appearance of the thermistor material varies among the three carrier materials. The surface on the L8 prototype is relatively matte and flat, while the A6M-E prototype exhibits a shinier and at the same time coarser texture. The surface on the alumina-based thermistor resembles that of the L8 sample. The higher shrinkage of the thermistor material on the A6M-tape, compared to the L8 material, appears to have resulted in peaks and valleys. However, white-light interferometric profilometer measurements indicate a 12 µm difference between the minimal and maximal values for the A6M-E sample, while the L8 shows a difference of 22 µm and the Al2O3 sample differs by 11 µm, as indicated in Figure 5d–f.

3.2. Resistance vs. Temperature

Resistance values were measured using the 3478A Multimeter from Hewlett Packard (2-wire measurement). The prototypes were placed on a PID-controlled hotplate, and the temperature was verified by a thermal IR thermometer, the 62 MAX from FLUKE. The IR thermometer has an accuracy of ± 1.5 °C or ± 1.5% (whichever is greater) in the measurement range.

3.2.1. Results Before Annealing

Initially, the resistance values of all thermistors were measured at room temperature. The mean values and standard deviations are presented in Table 1.
As can be seen from the data, the variation in thermistor values for any shape and any substrate material is very large. Surprisingly, for the Alumina substrate (for which the paste is initially intended) the standard variation is significantly higher than that of the LTCC-based thermistors. Most values are found to be far from the resistivity reported by the manufacturer, i.e., 21.5 ± 1.5 Ω. One might expect that the surface state, as shown in Figure 5, would impact the resistive value. However, this does not appear to be the case, as the smoothest surface, obtained for the Al2O3 sample, exhibits the largest standard deviation in resistive values, reaching 66.7% for the square-shaped thermistor. In contrast, the L8, which has the roughest surface, shows a standard deviation of 10.0% while the A6M-E has only 4.2% for the same type of structure.
The comparison of internally and externally placed thermistors on the L8 and A6M-E prototypes reveals that the buried thermistors have higher or much higher resistance than the same shaped thermistors placed on the external layer. For the L8 material, the mean resistance of the buried thermistors is approximately twice that of those on the top layer. In contrast, for the A6M-E material, the difference is between two to four times higher for the buried thermistors compared to the externally placed counterparts. Furthermore, all thermistors on the A6M-E material have higher resistive value than those created on the L8 material. Nevertheless, regardless of the initial value of the thermistor, as long as it changes with the temperature according to a known pattern, it can be effectively used for temperature monitoring in its designated location.
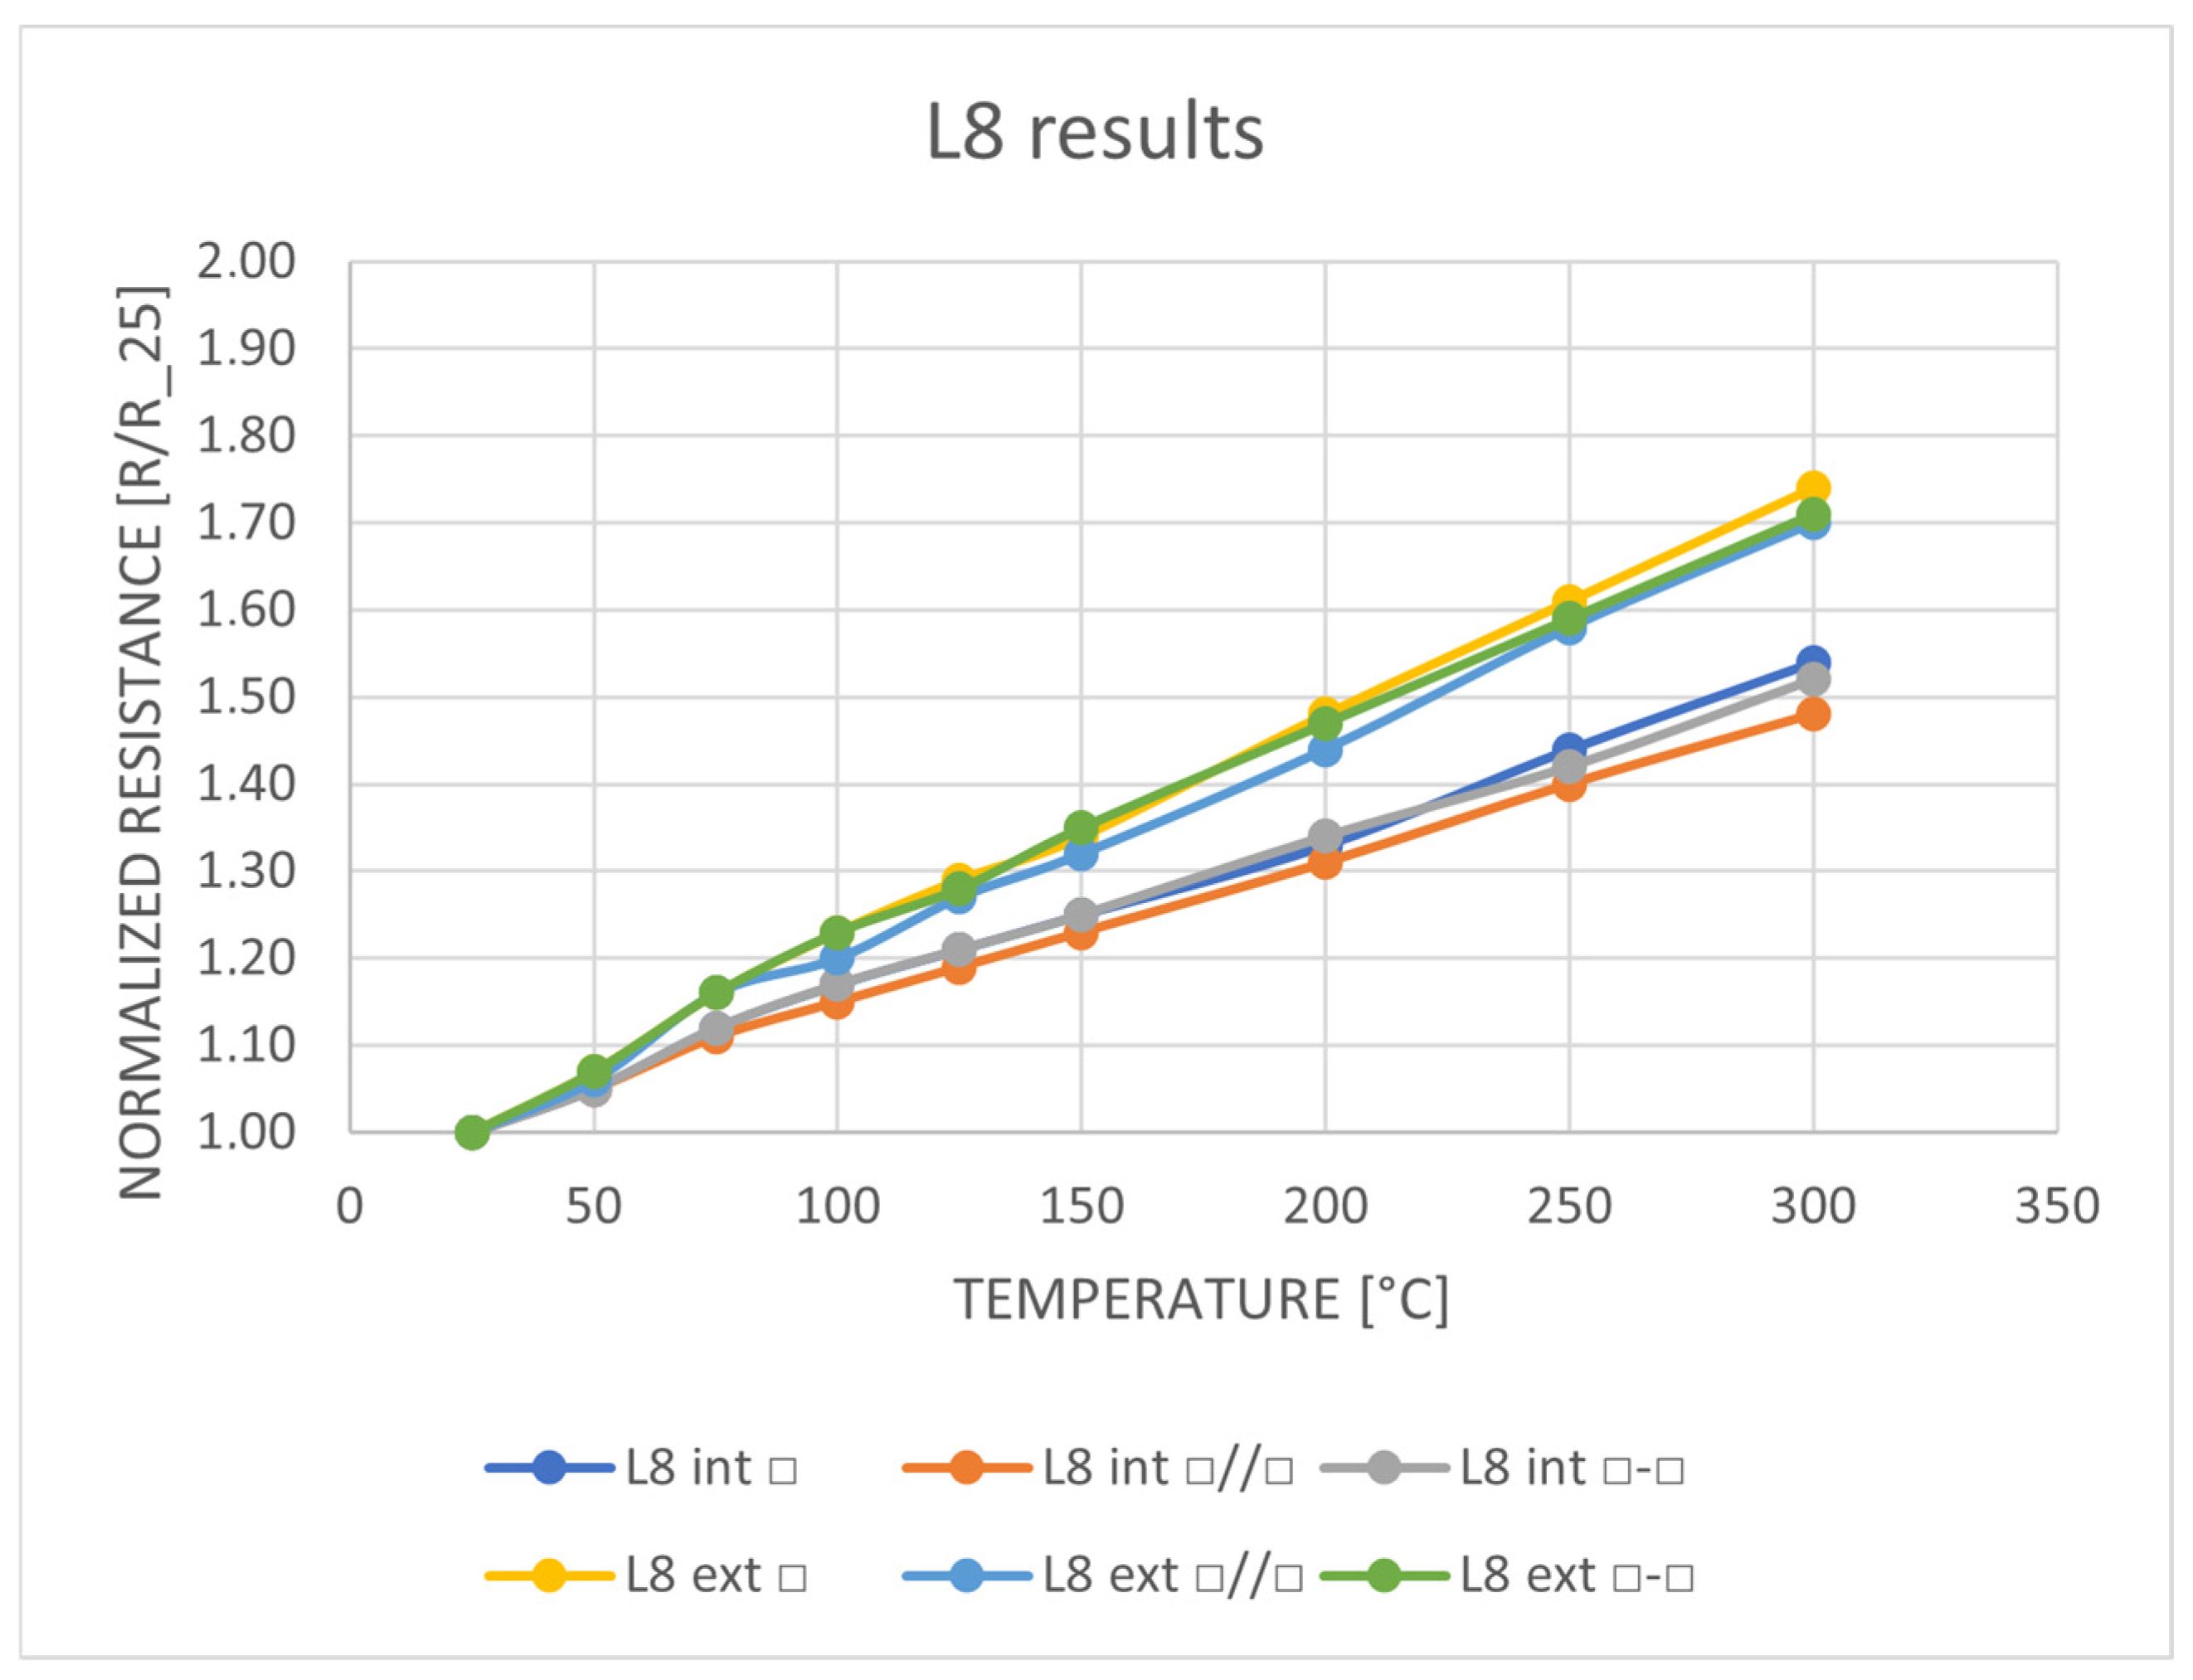
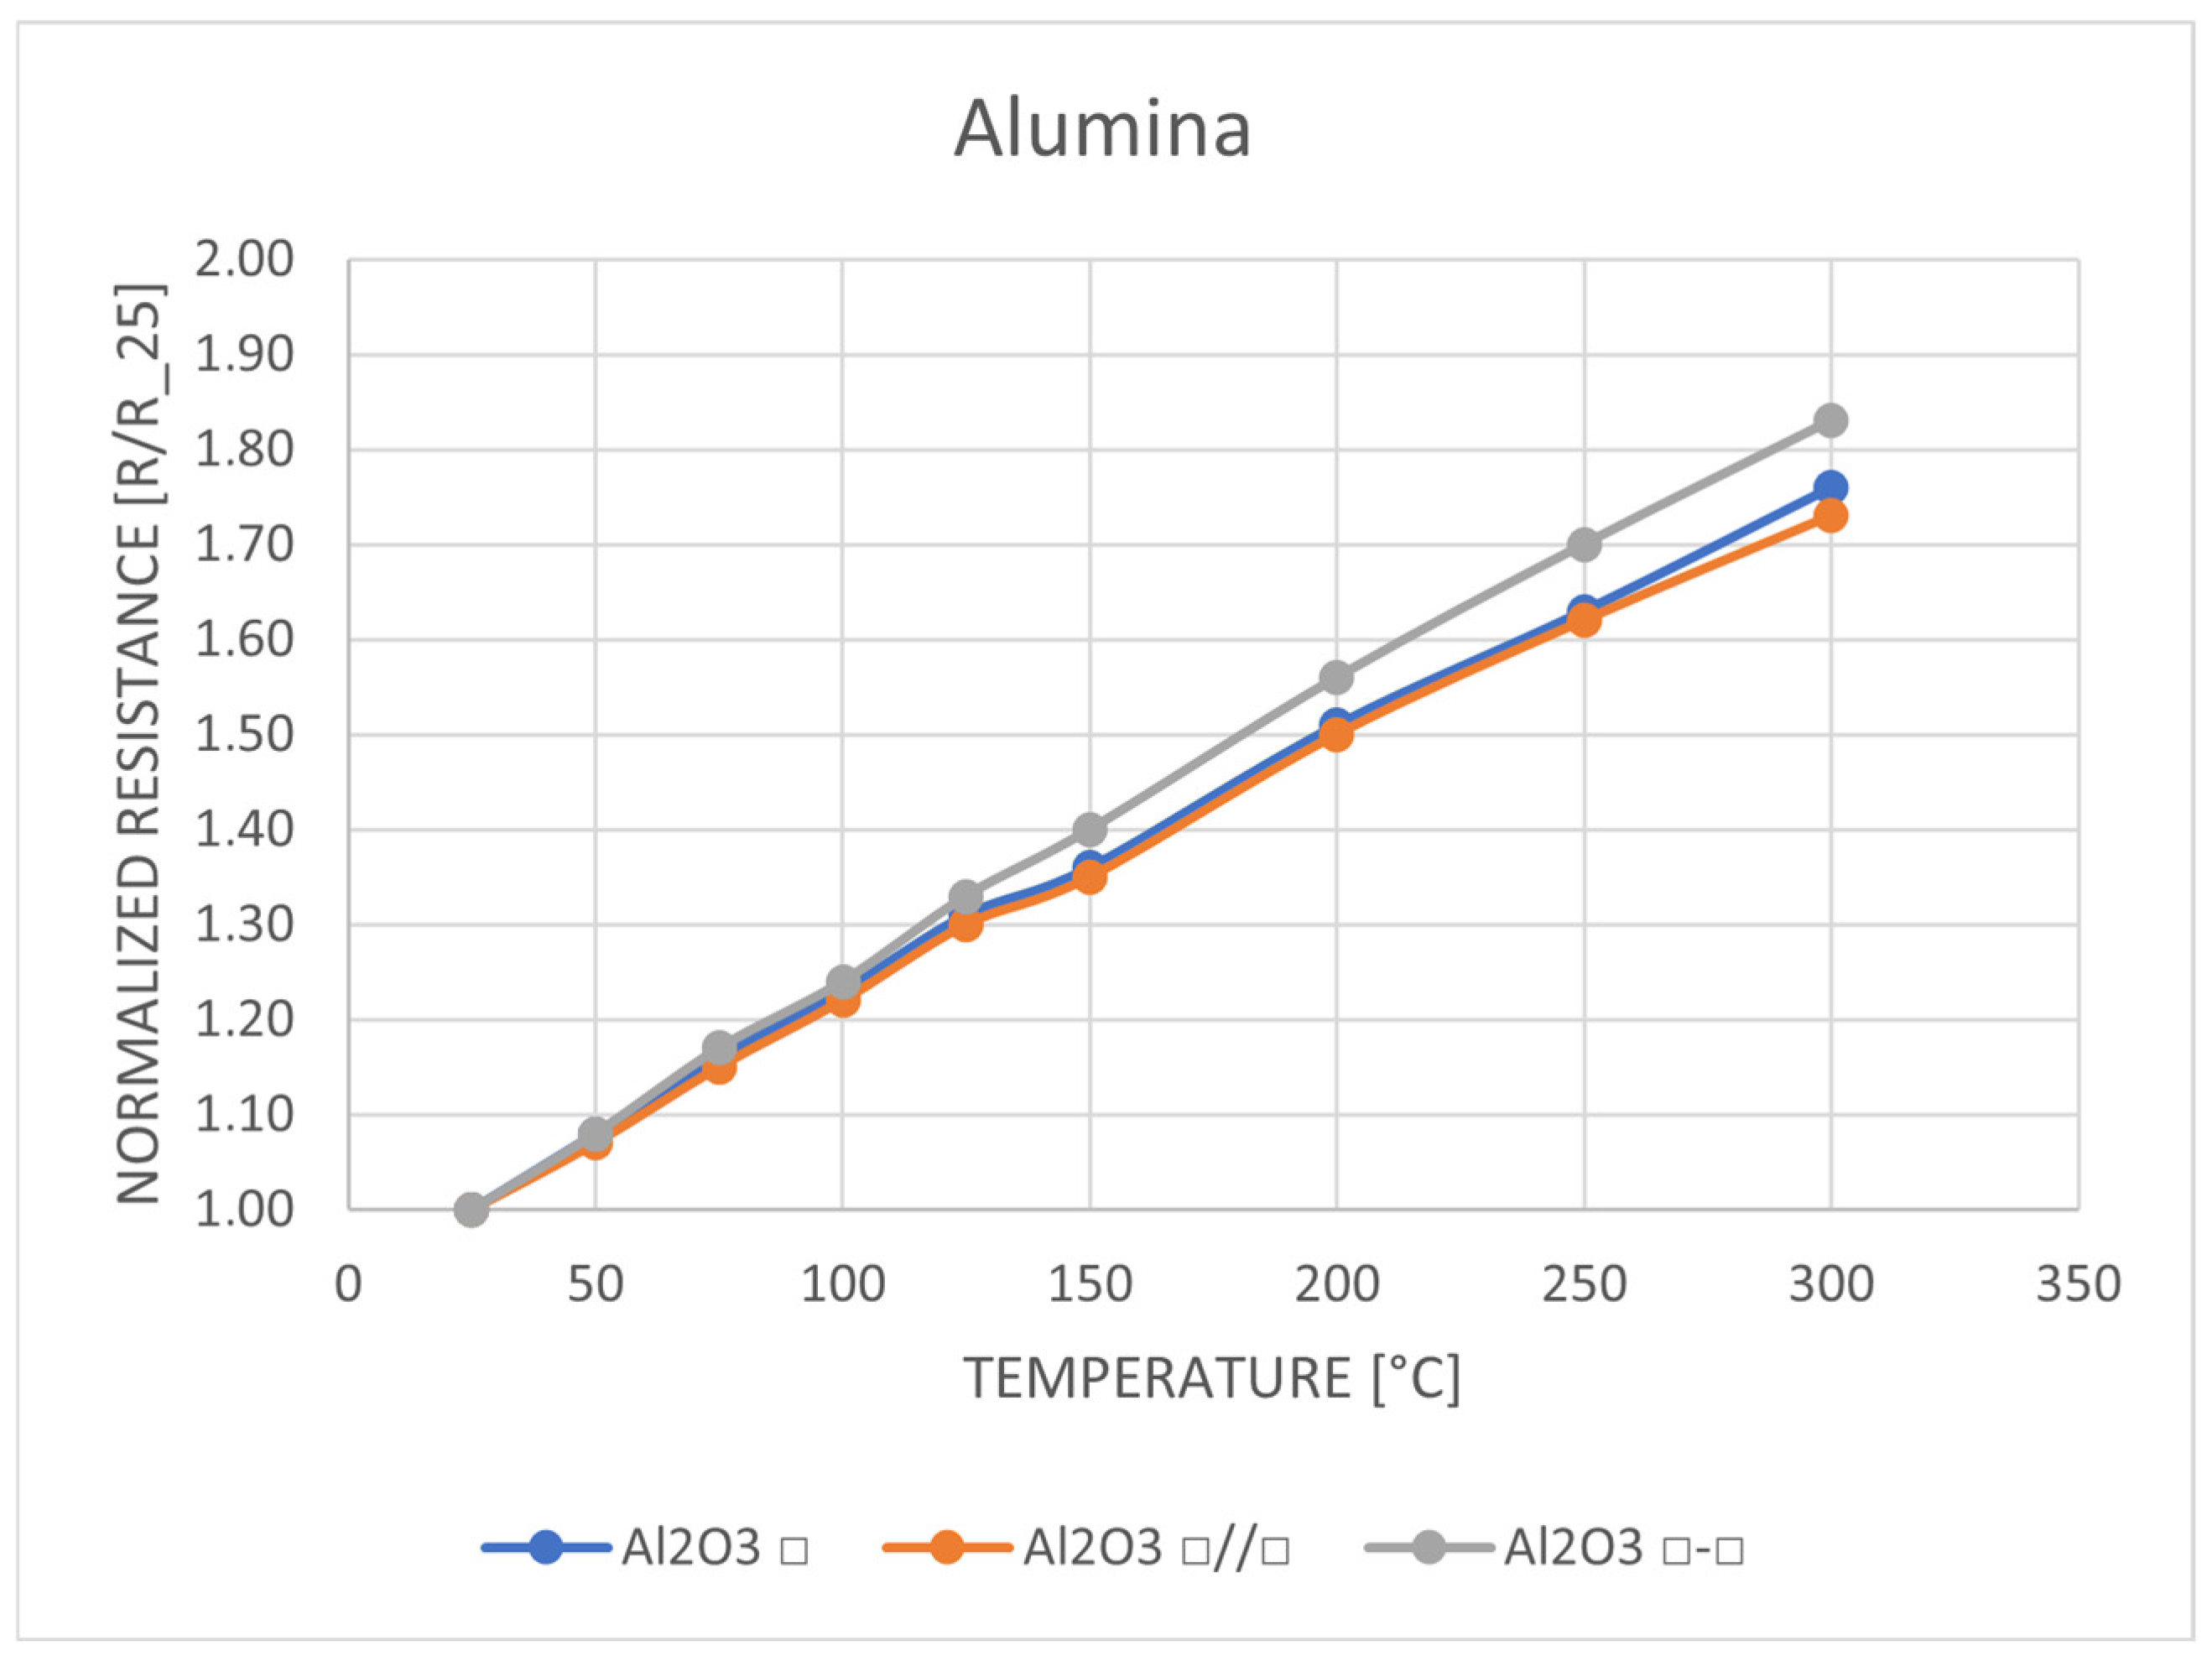
To examine the evolution of resistance with temperature, a series of tests were performed. The results, after normalizing the thermistor resistance to the value at room temperature, are presented in Figure 6, Figure 7 and Figure 8. The change in resistance is close to linear, with R2 values ranging from 0.9962 to 0.9978 for the internal thermistors and ranging from 0.9976 to 0.9983 for the external ones. By comparing the three graphs, it is evident that the internally placed thermistors exhibit less change in resistance than those placed externally for both the L8 and the A6M-E prototypes.
Using Equation (1), we calculated the TCR for our thermistors after testing them from 25 °C to 300 °C in 25 °C increments, as shown in Table 2. The TCR value for the alumina sample ranges from 2800 to 3009 ppm/°C, which aligns closely with the manufacturer’s specified value of 3100 ± 200 ppm/°C. In contrast, the TCR for the different implementations of LTCC vary significantly. Generally, the internally placed thermistors show a lower TCR than those placed externally and A6M-E show the overall lowest TCR values.

3.2.2. Results After Annealing

Annealing was conducted for 136 h at 150 °C in air, whereafter the resistive values of the thermistors were once again measured using the same measurement setup as before. This time, only four temperatures were tested: 25 °C, 100 °C, 200 °C and 300 °C. Table 3 reports the mean value in ohms and standard deviation in percent, allowing comparison with the data in Table 1. Additionally, Table 3 includes a line indicating the change in resistive value due to annealing, for each type of material and each topology and placement.
By comparing the mean values for the different samples before (Table 1) and after annealing (Table 3), it is observed that the resistive values have changed within a small range from −3% to +4.8%. Thus, the thermistors can be used without hesitation for temperature control.
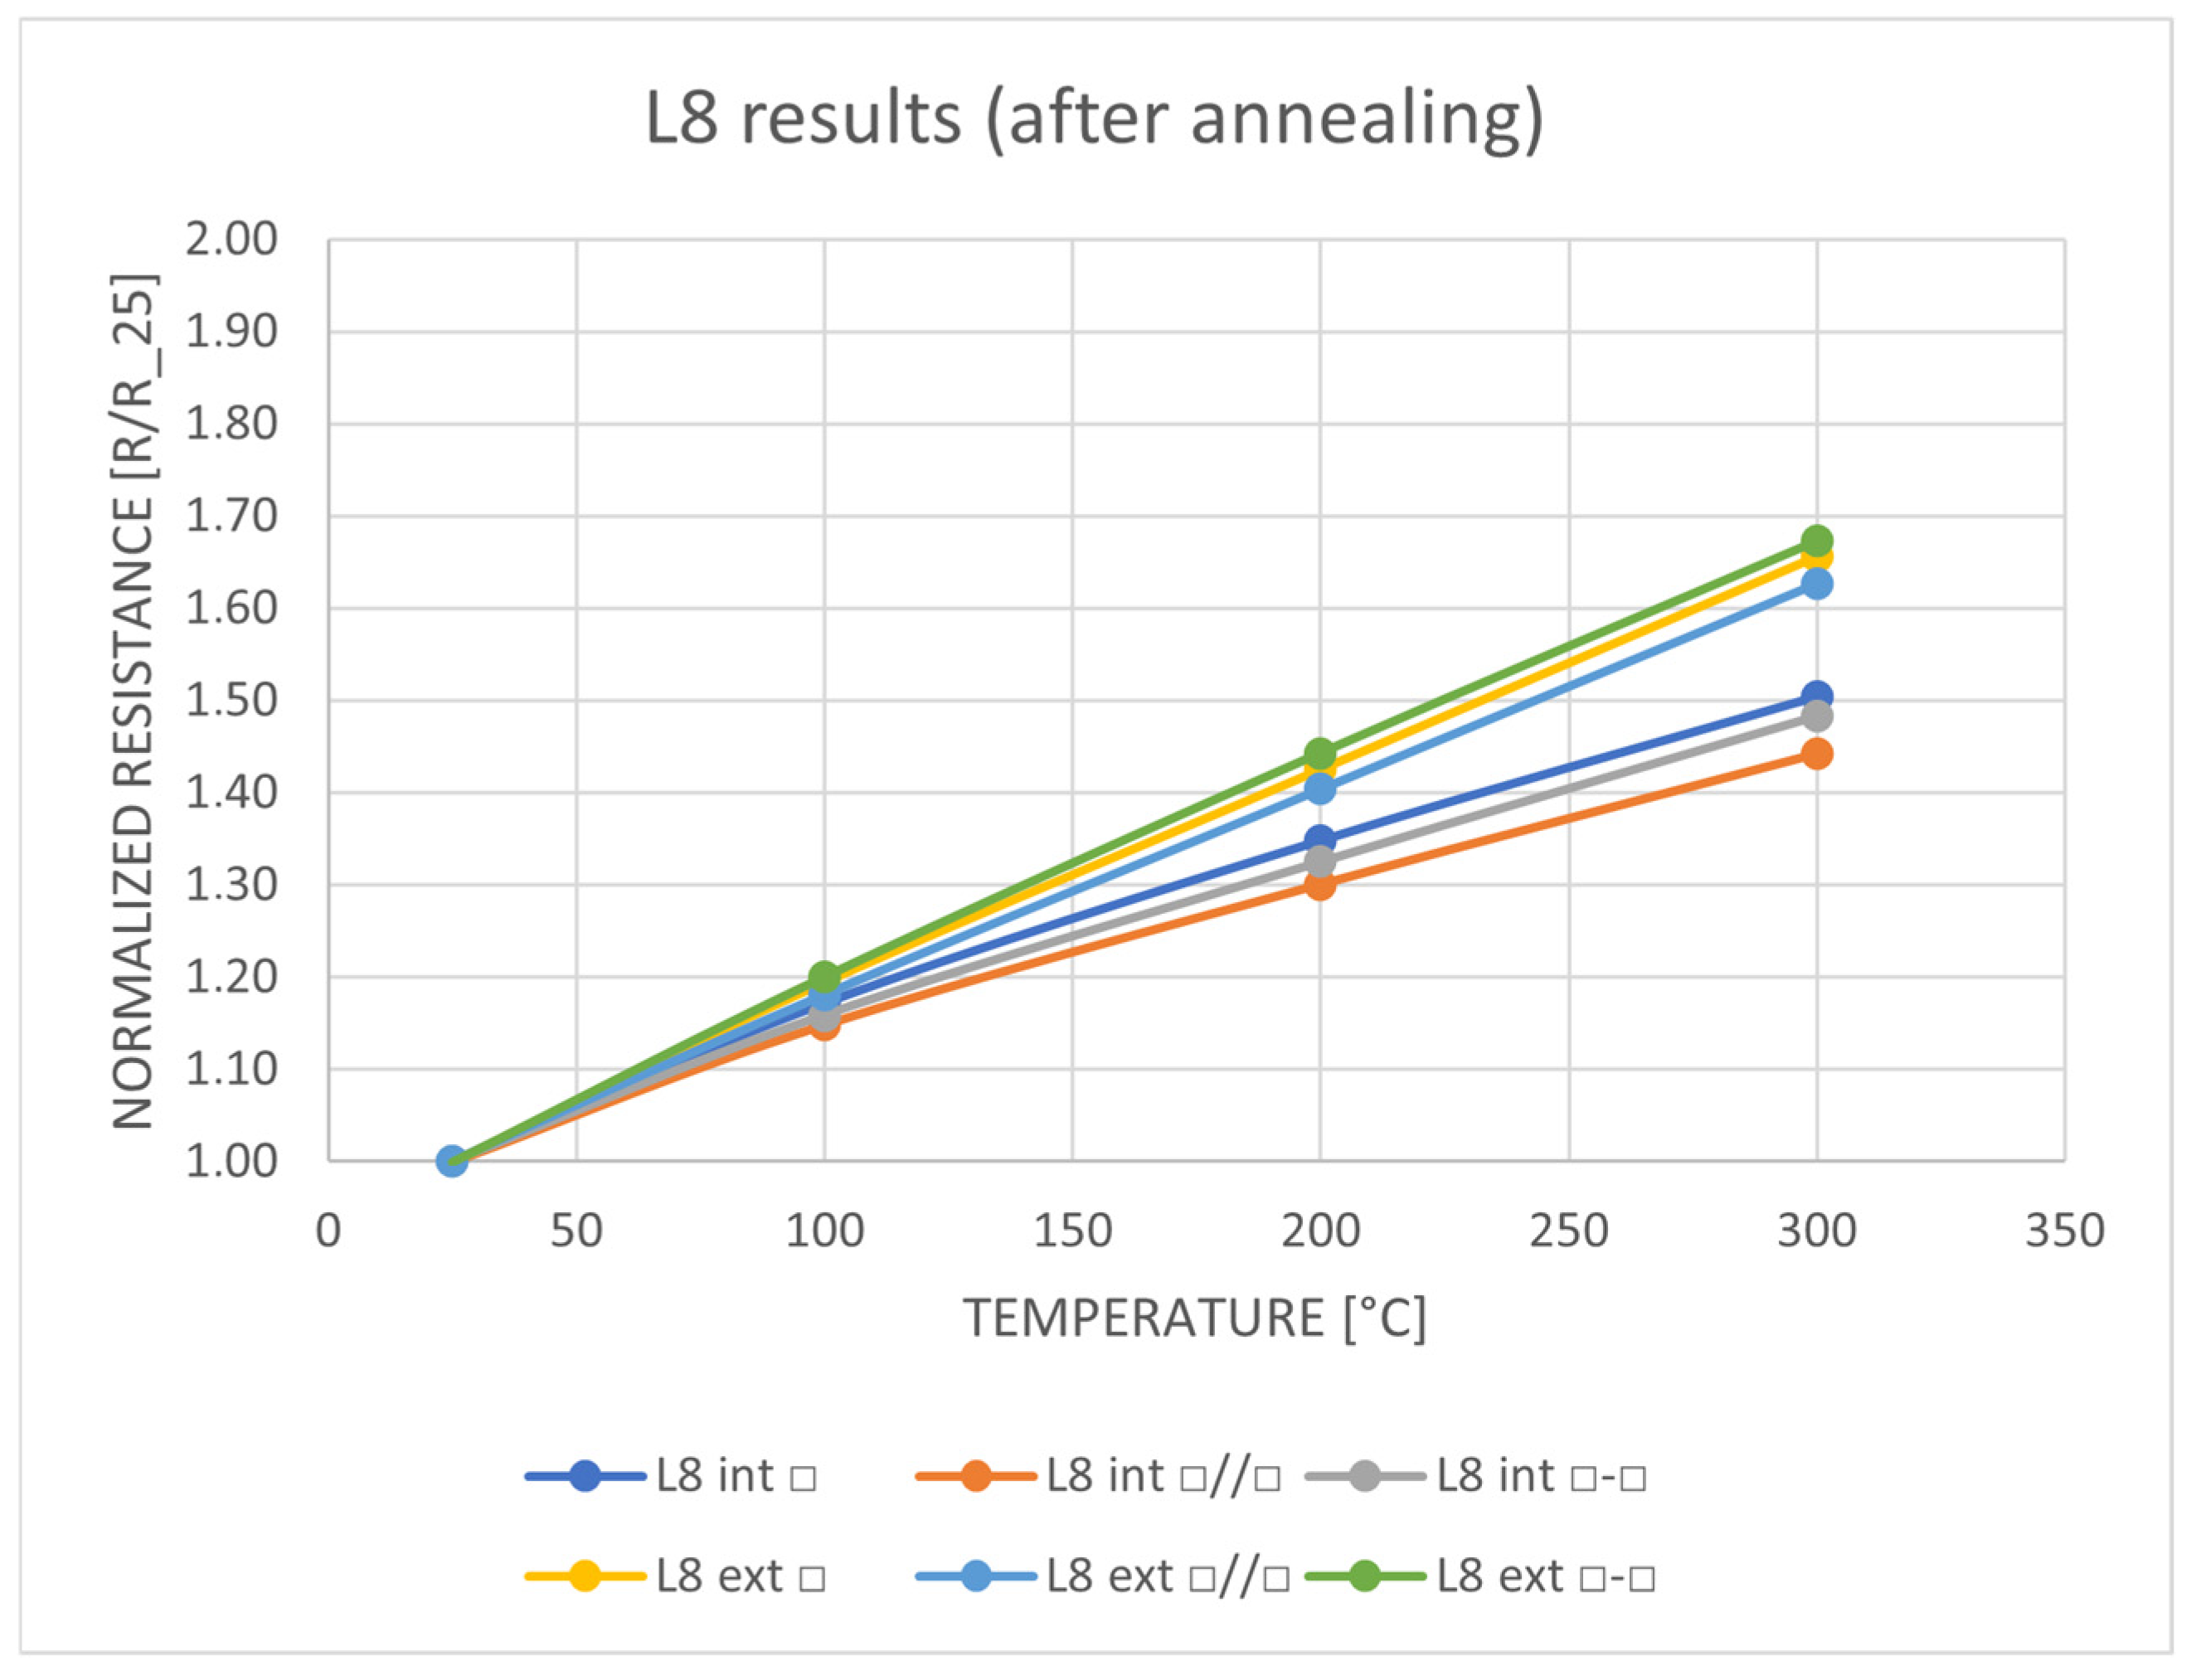
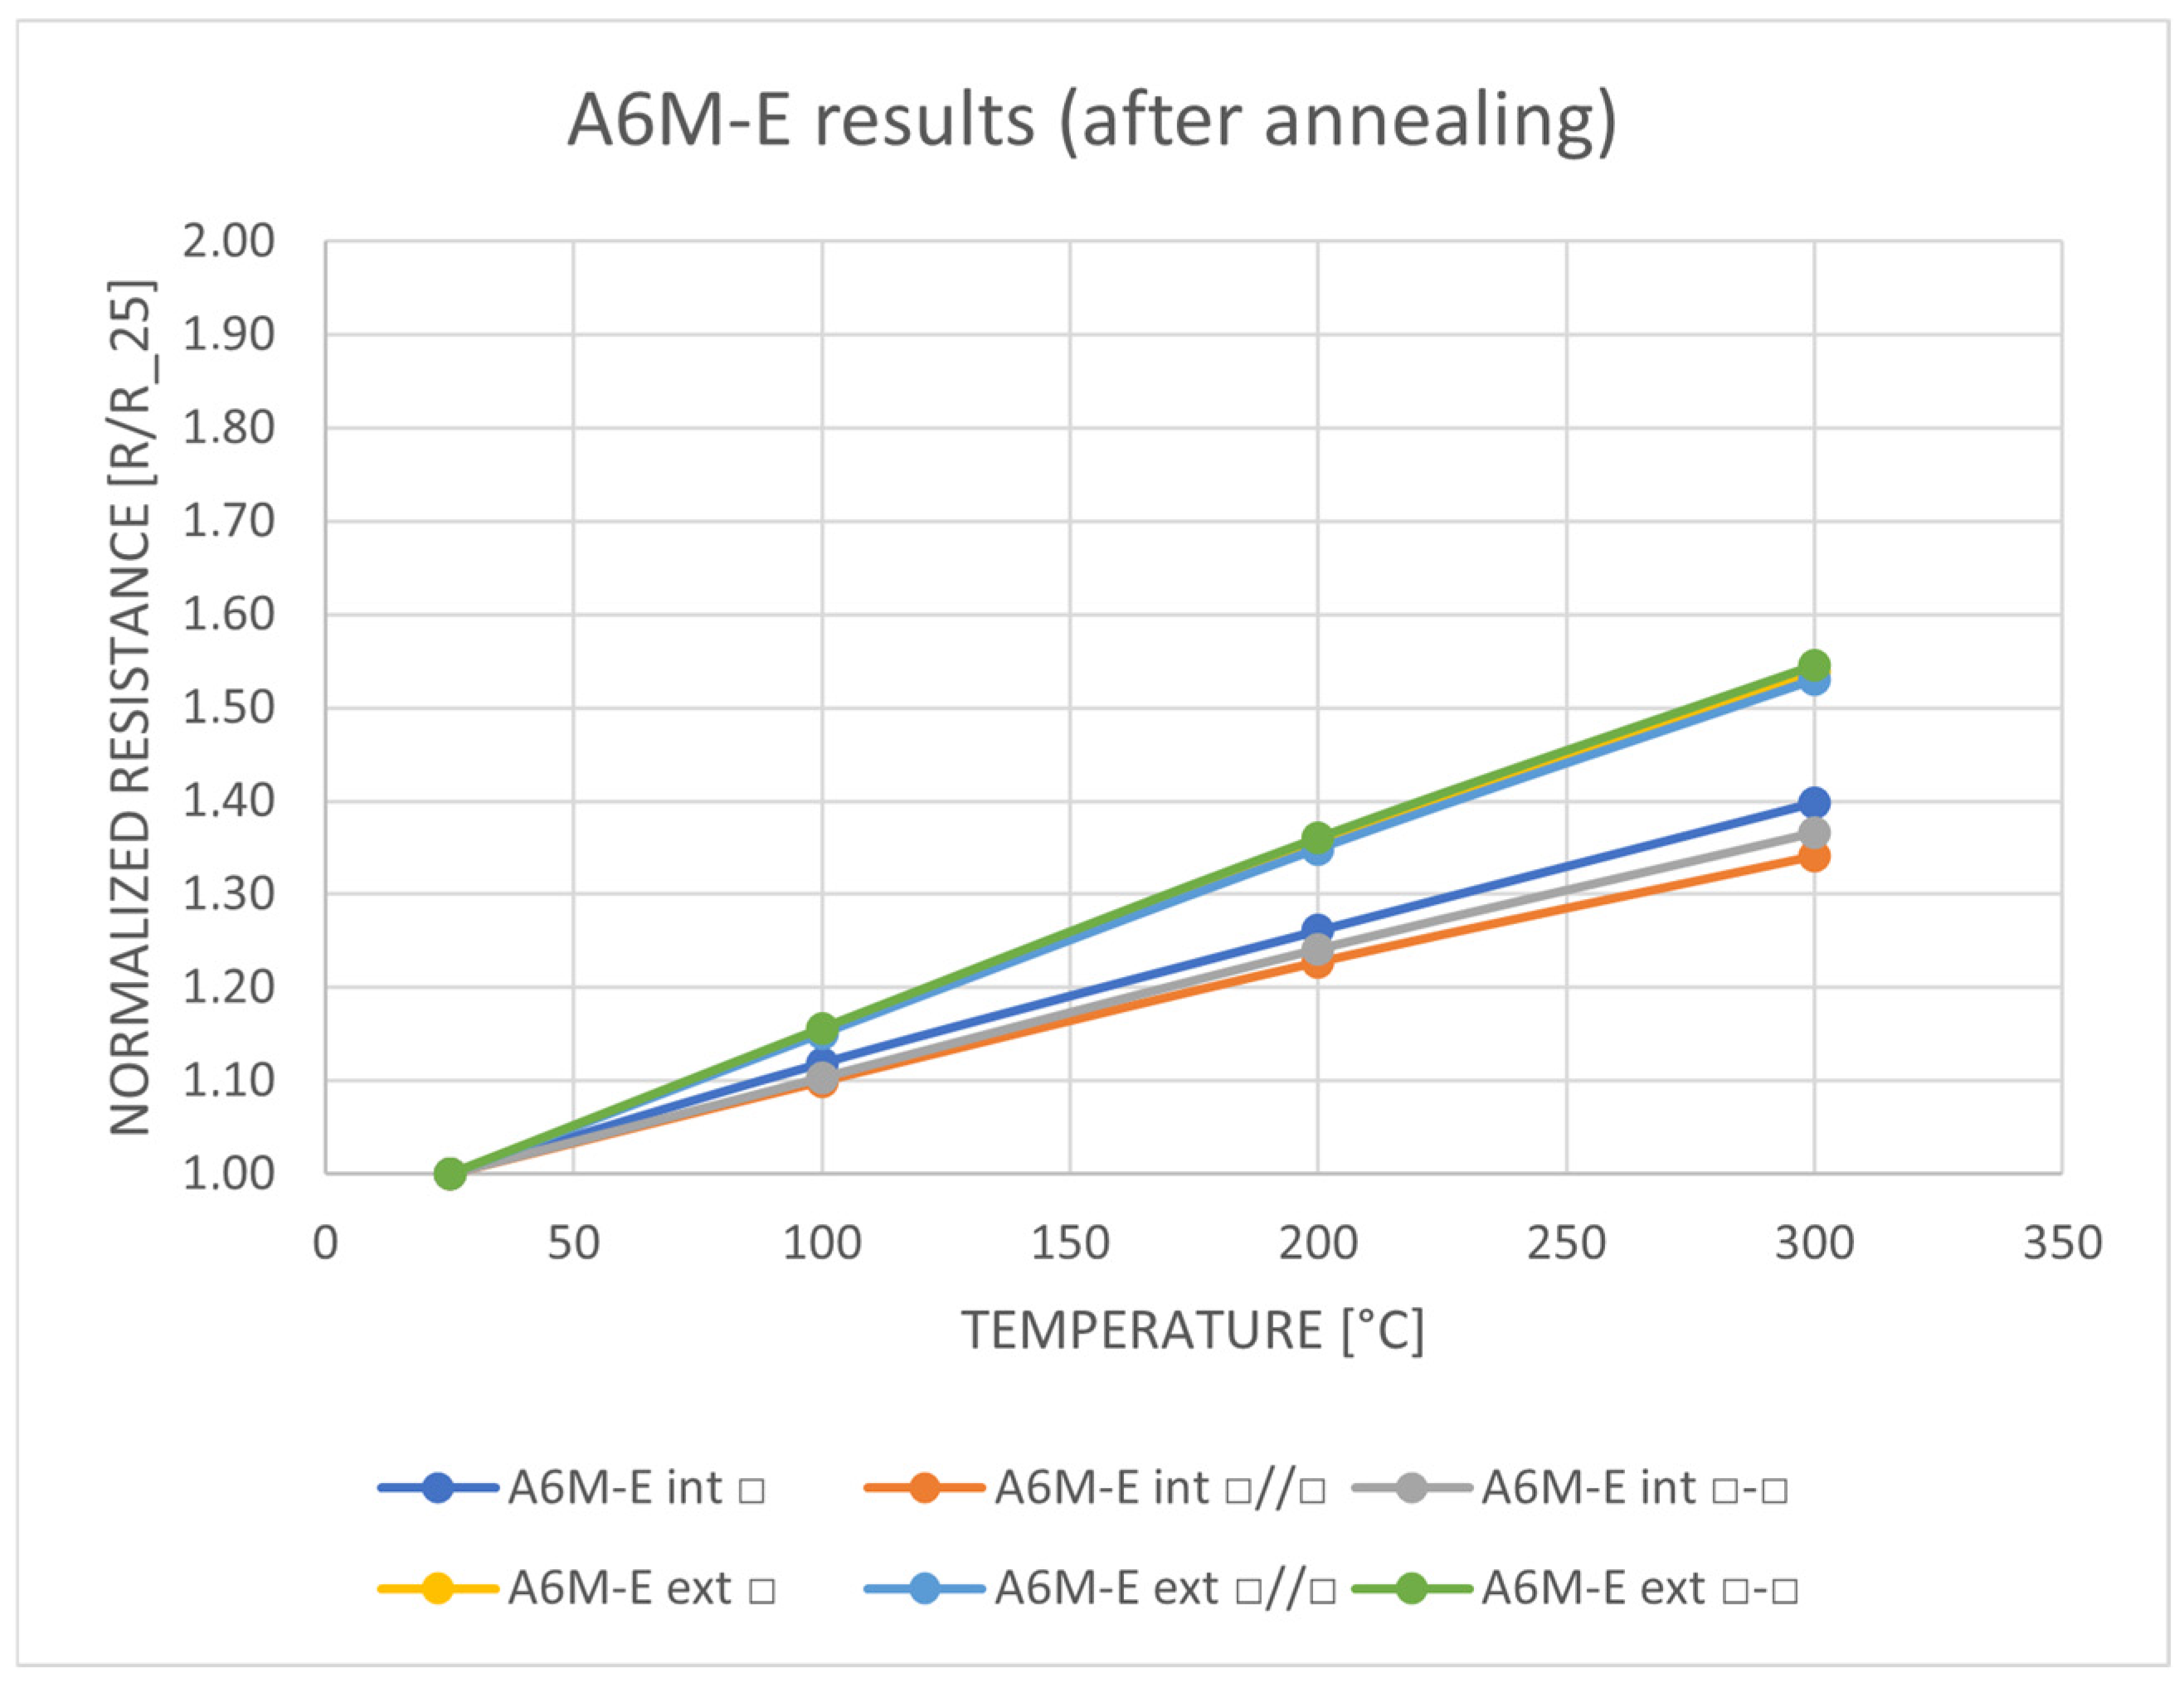
The change in resistive value was measured, as before, over a temperature range of 275 °C. The results for the various designs and base materials are presented in Figure 9, Figure 10 and Figure 11. As can be seen, the linear behavior is maintained.
From these results, we have calculated the TCR value, Table 4, using (1).
After annealing, the TCR value for all structures have decreased significantly. The most substantial drop is observed in the Al2O3 samples, where the final value is reduced by nearly 400 ppm/°C or 13%, across all topologies. The L8 samples experienced a loss of 275 ppm/°C, while the A6M-E samples decreased by a maximum of 240 ppm/°C which corresponds to 11%, in both cases for externally placed thermistors. The internally placed thermistors are better preserved with reductions of 151 ppm/°C for the L8 and 129 ppm/°C for the A6M-E at most, equating to 8%. When thermistors are placed inside the structure, whether it is L8 or A6M-E material, the TCR value decreases by approximately 30% compared to the externally placed thermistor with the same topology. As a result, the detection of temperature variation may be less pronounced when thermistors are placed internally. However, there is a significant advantage to placing them beneath a hot spot for precise measurement purpose, while at the same time it also optimizes real estate usage.
In terms of topology, the two-squares-in-parallel configuration consistently yields the lowest TCR for all materials, both before and after annealing. Therefore, a better choice would be to use a squared or two-squares-in-series topology to increase TCR readouts.

3.3. Delamination Check and Printed Thickness Measurement

Cross sectioning of the circuits was executed to investigate the occurrence of delamination or cracks, as these issues have been reported in [2,3,5]. The results, presented in Figure 12, confirm that no delamination between the thermistor paste and the ceramic material has occurred. However, some camber deformation is observed: a convex bending on the L8 sample in Figure 12a and a slight sagging above the thermistor in the A6M-E sample in Figure 12b, is seen. This is not surprising, as the thermistor paste is not designed to accommodate the inherent shrinkage that occurs during the firing of such material. From these cross sections, the printed thickness after firing is determined to be approximately 10 µm for all of the samples.

3.4. EDX Analysis

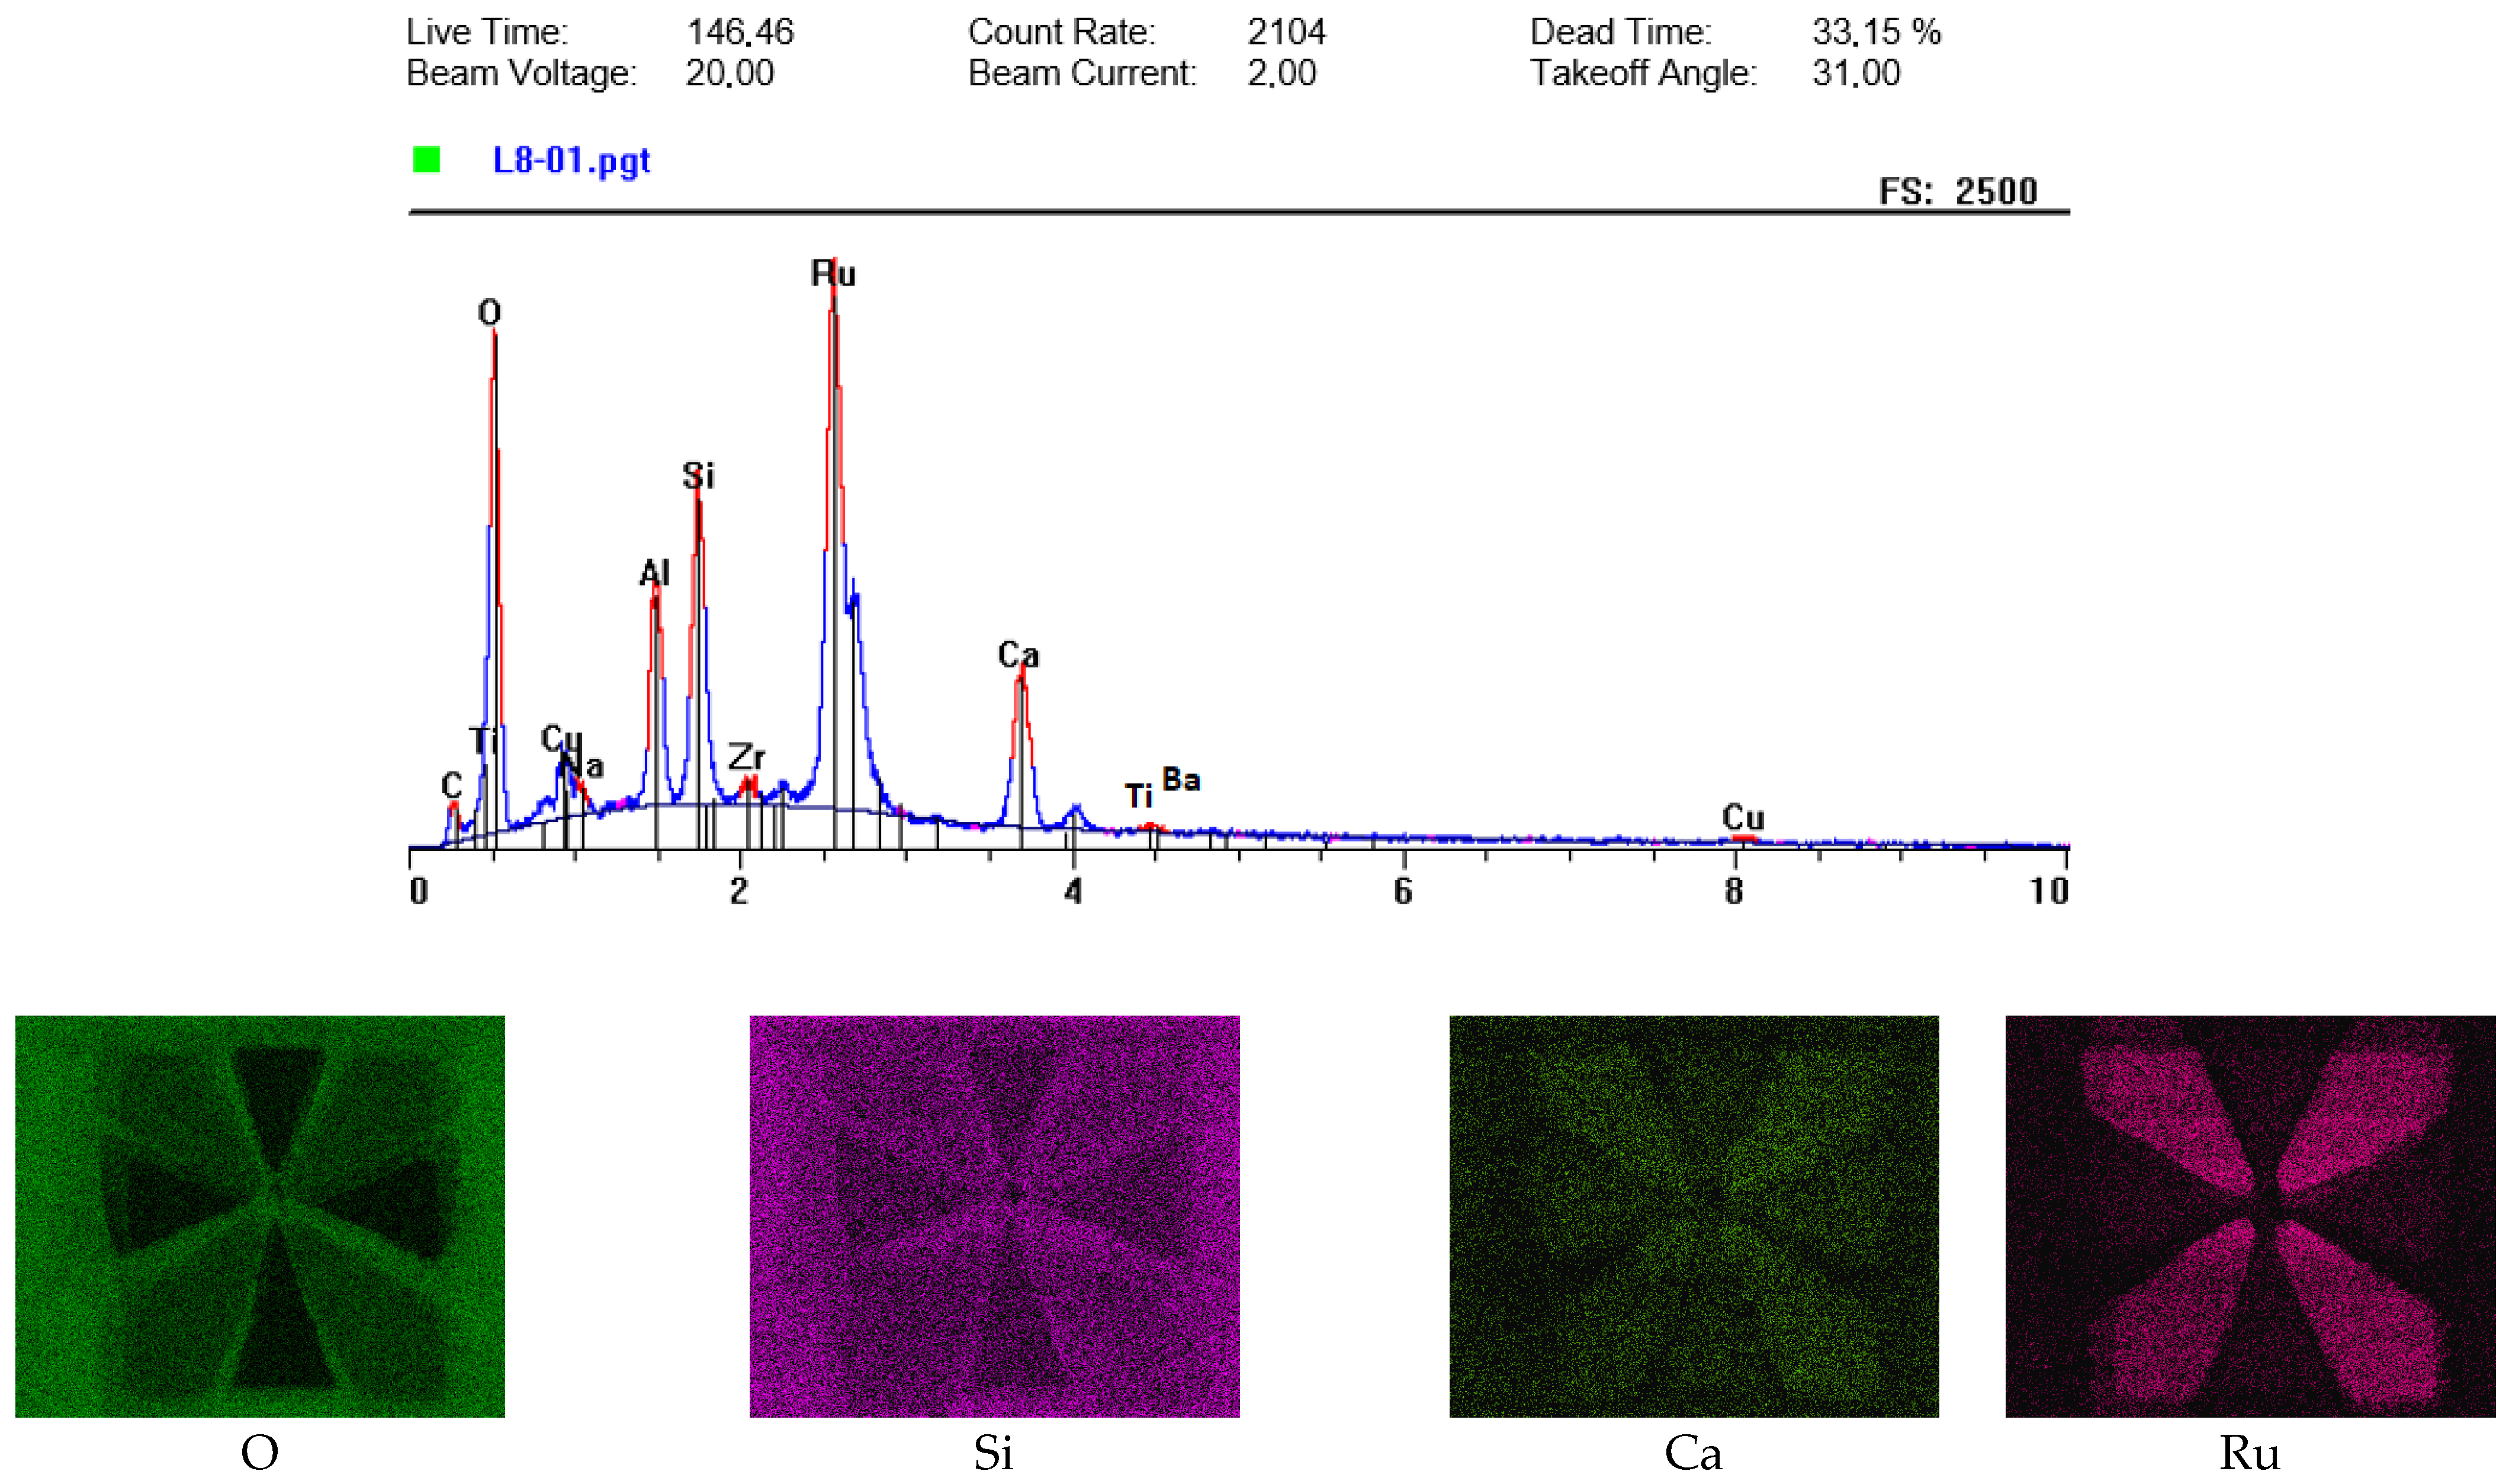
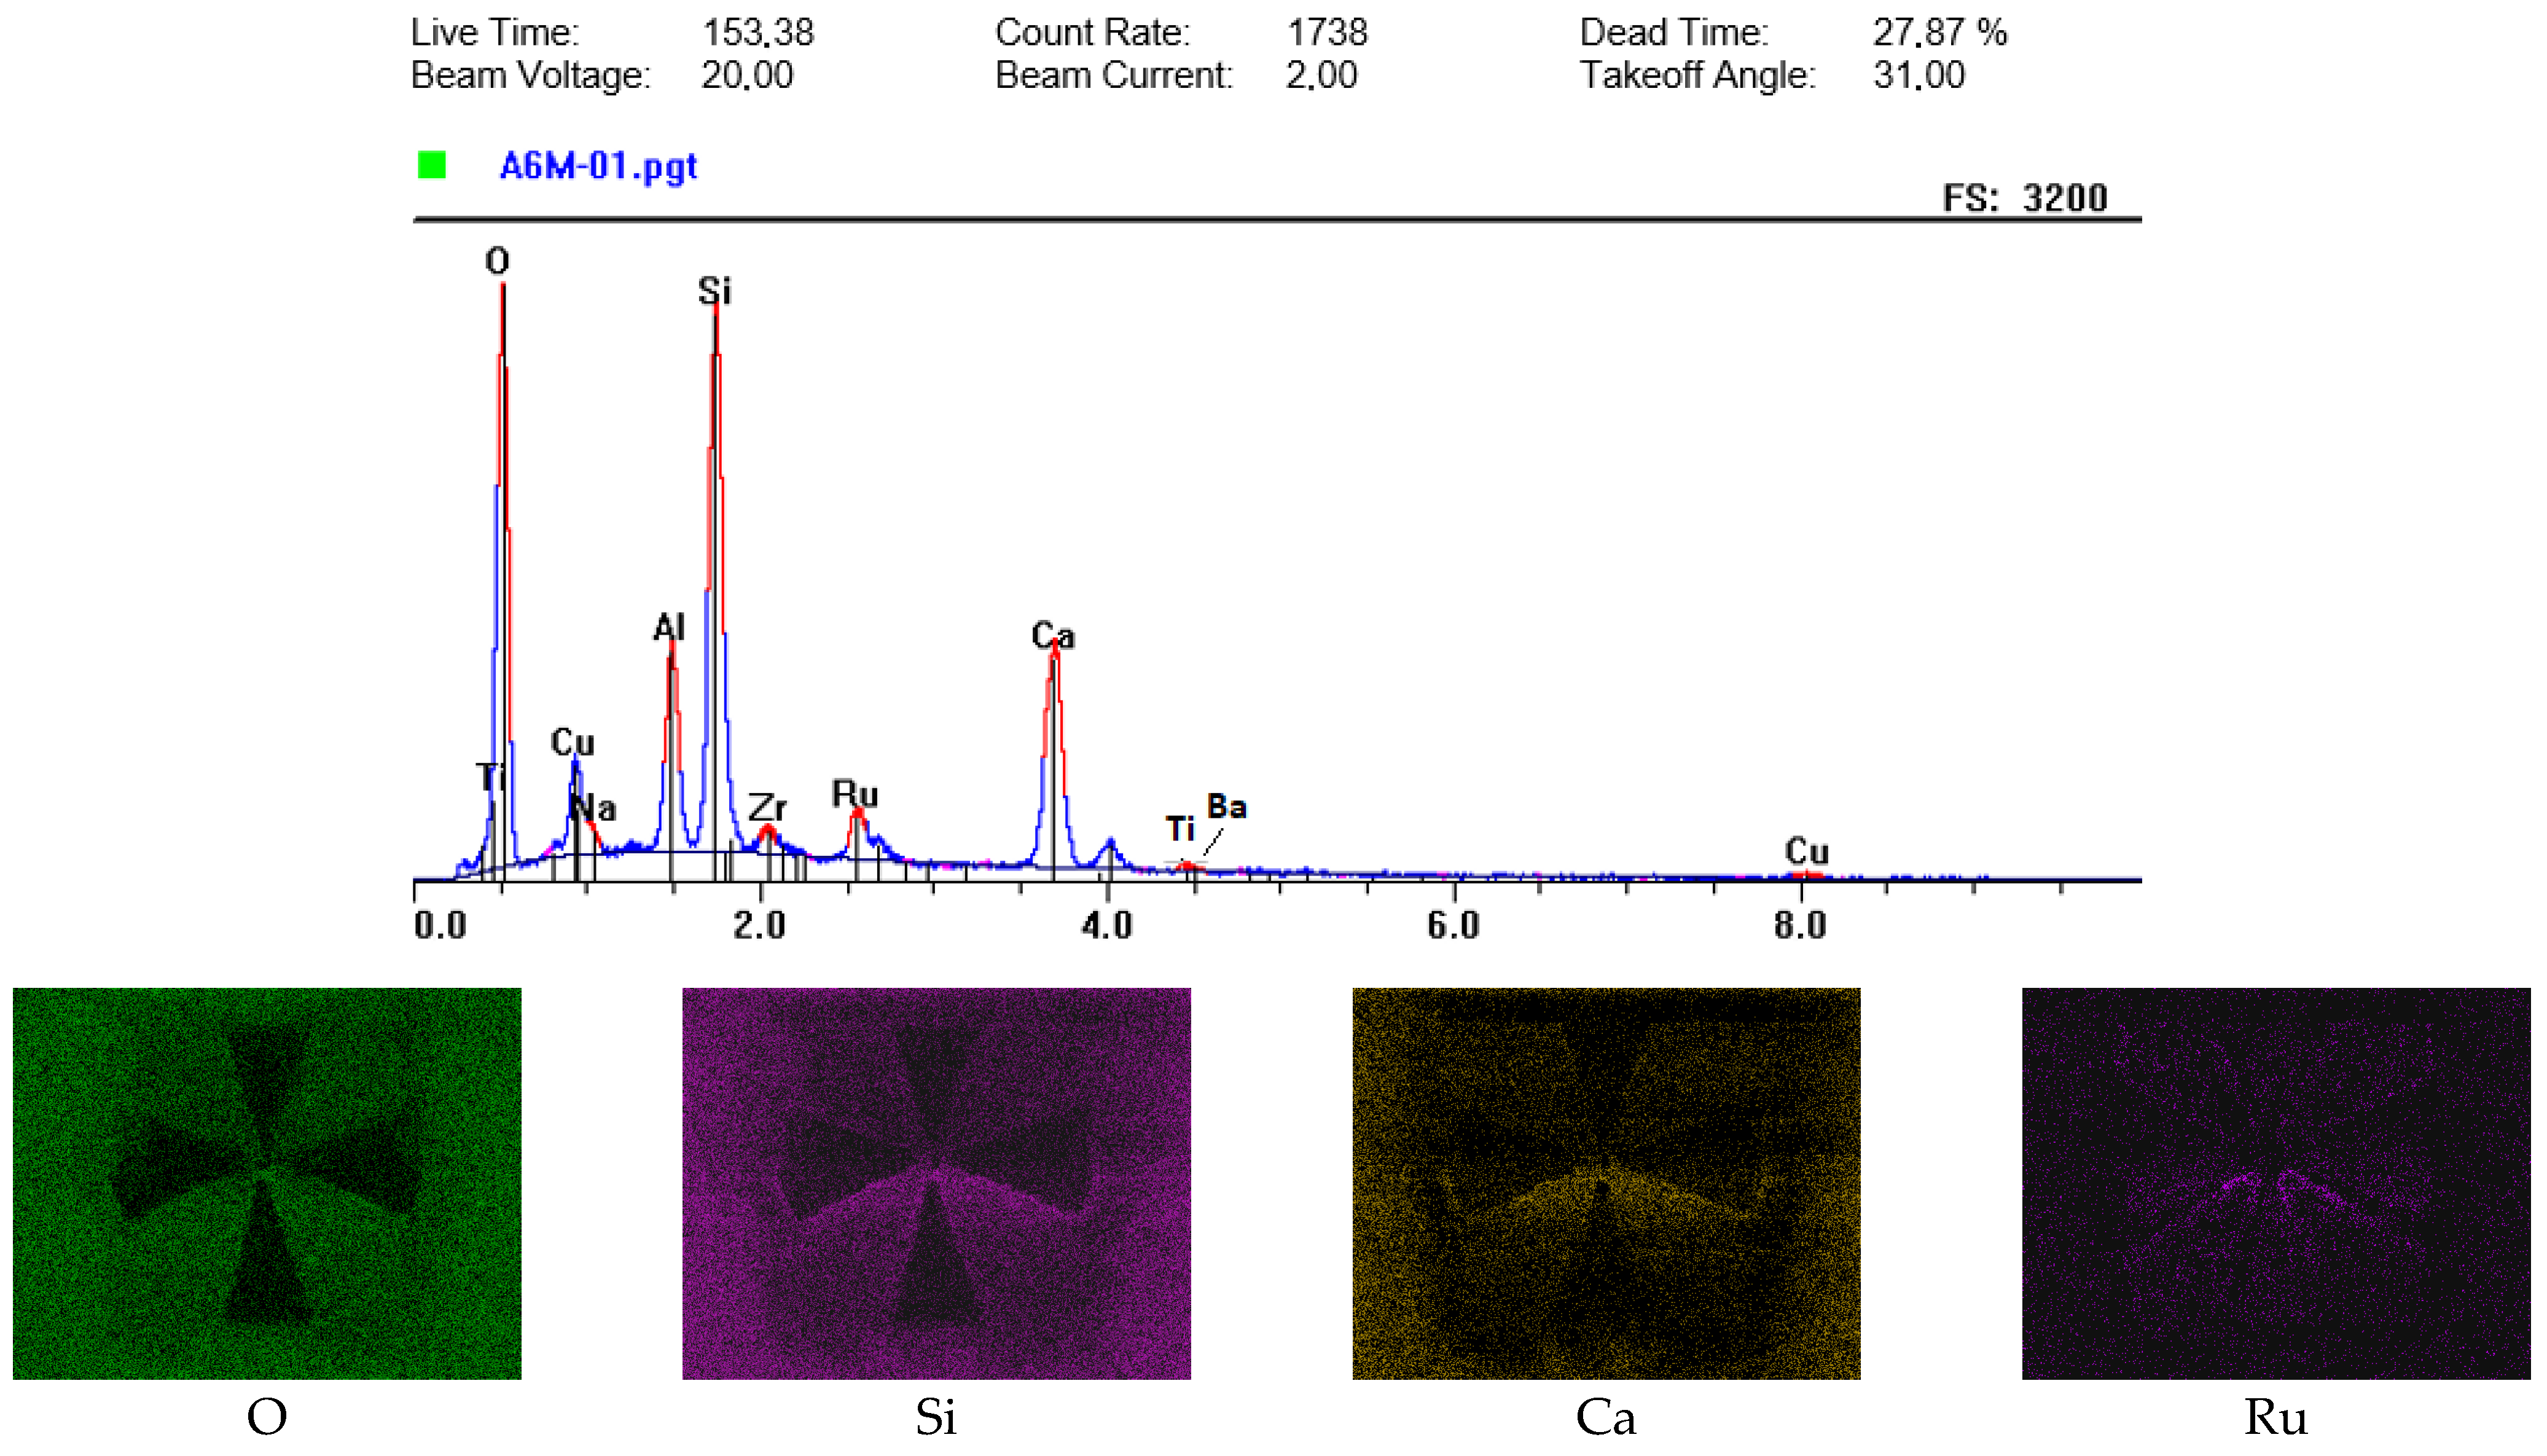
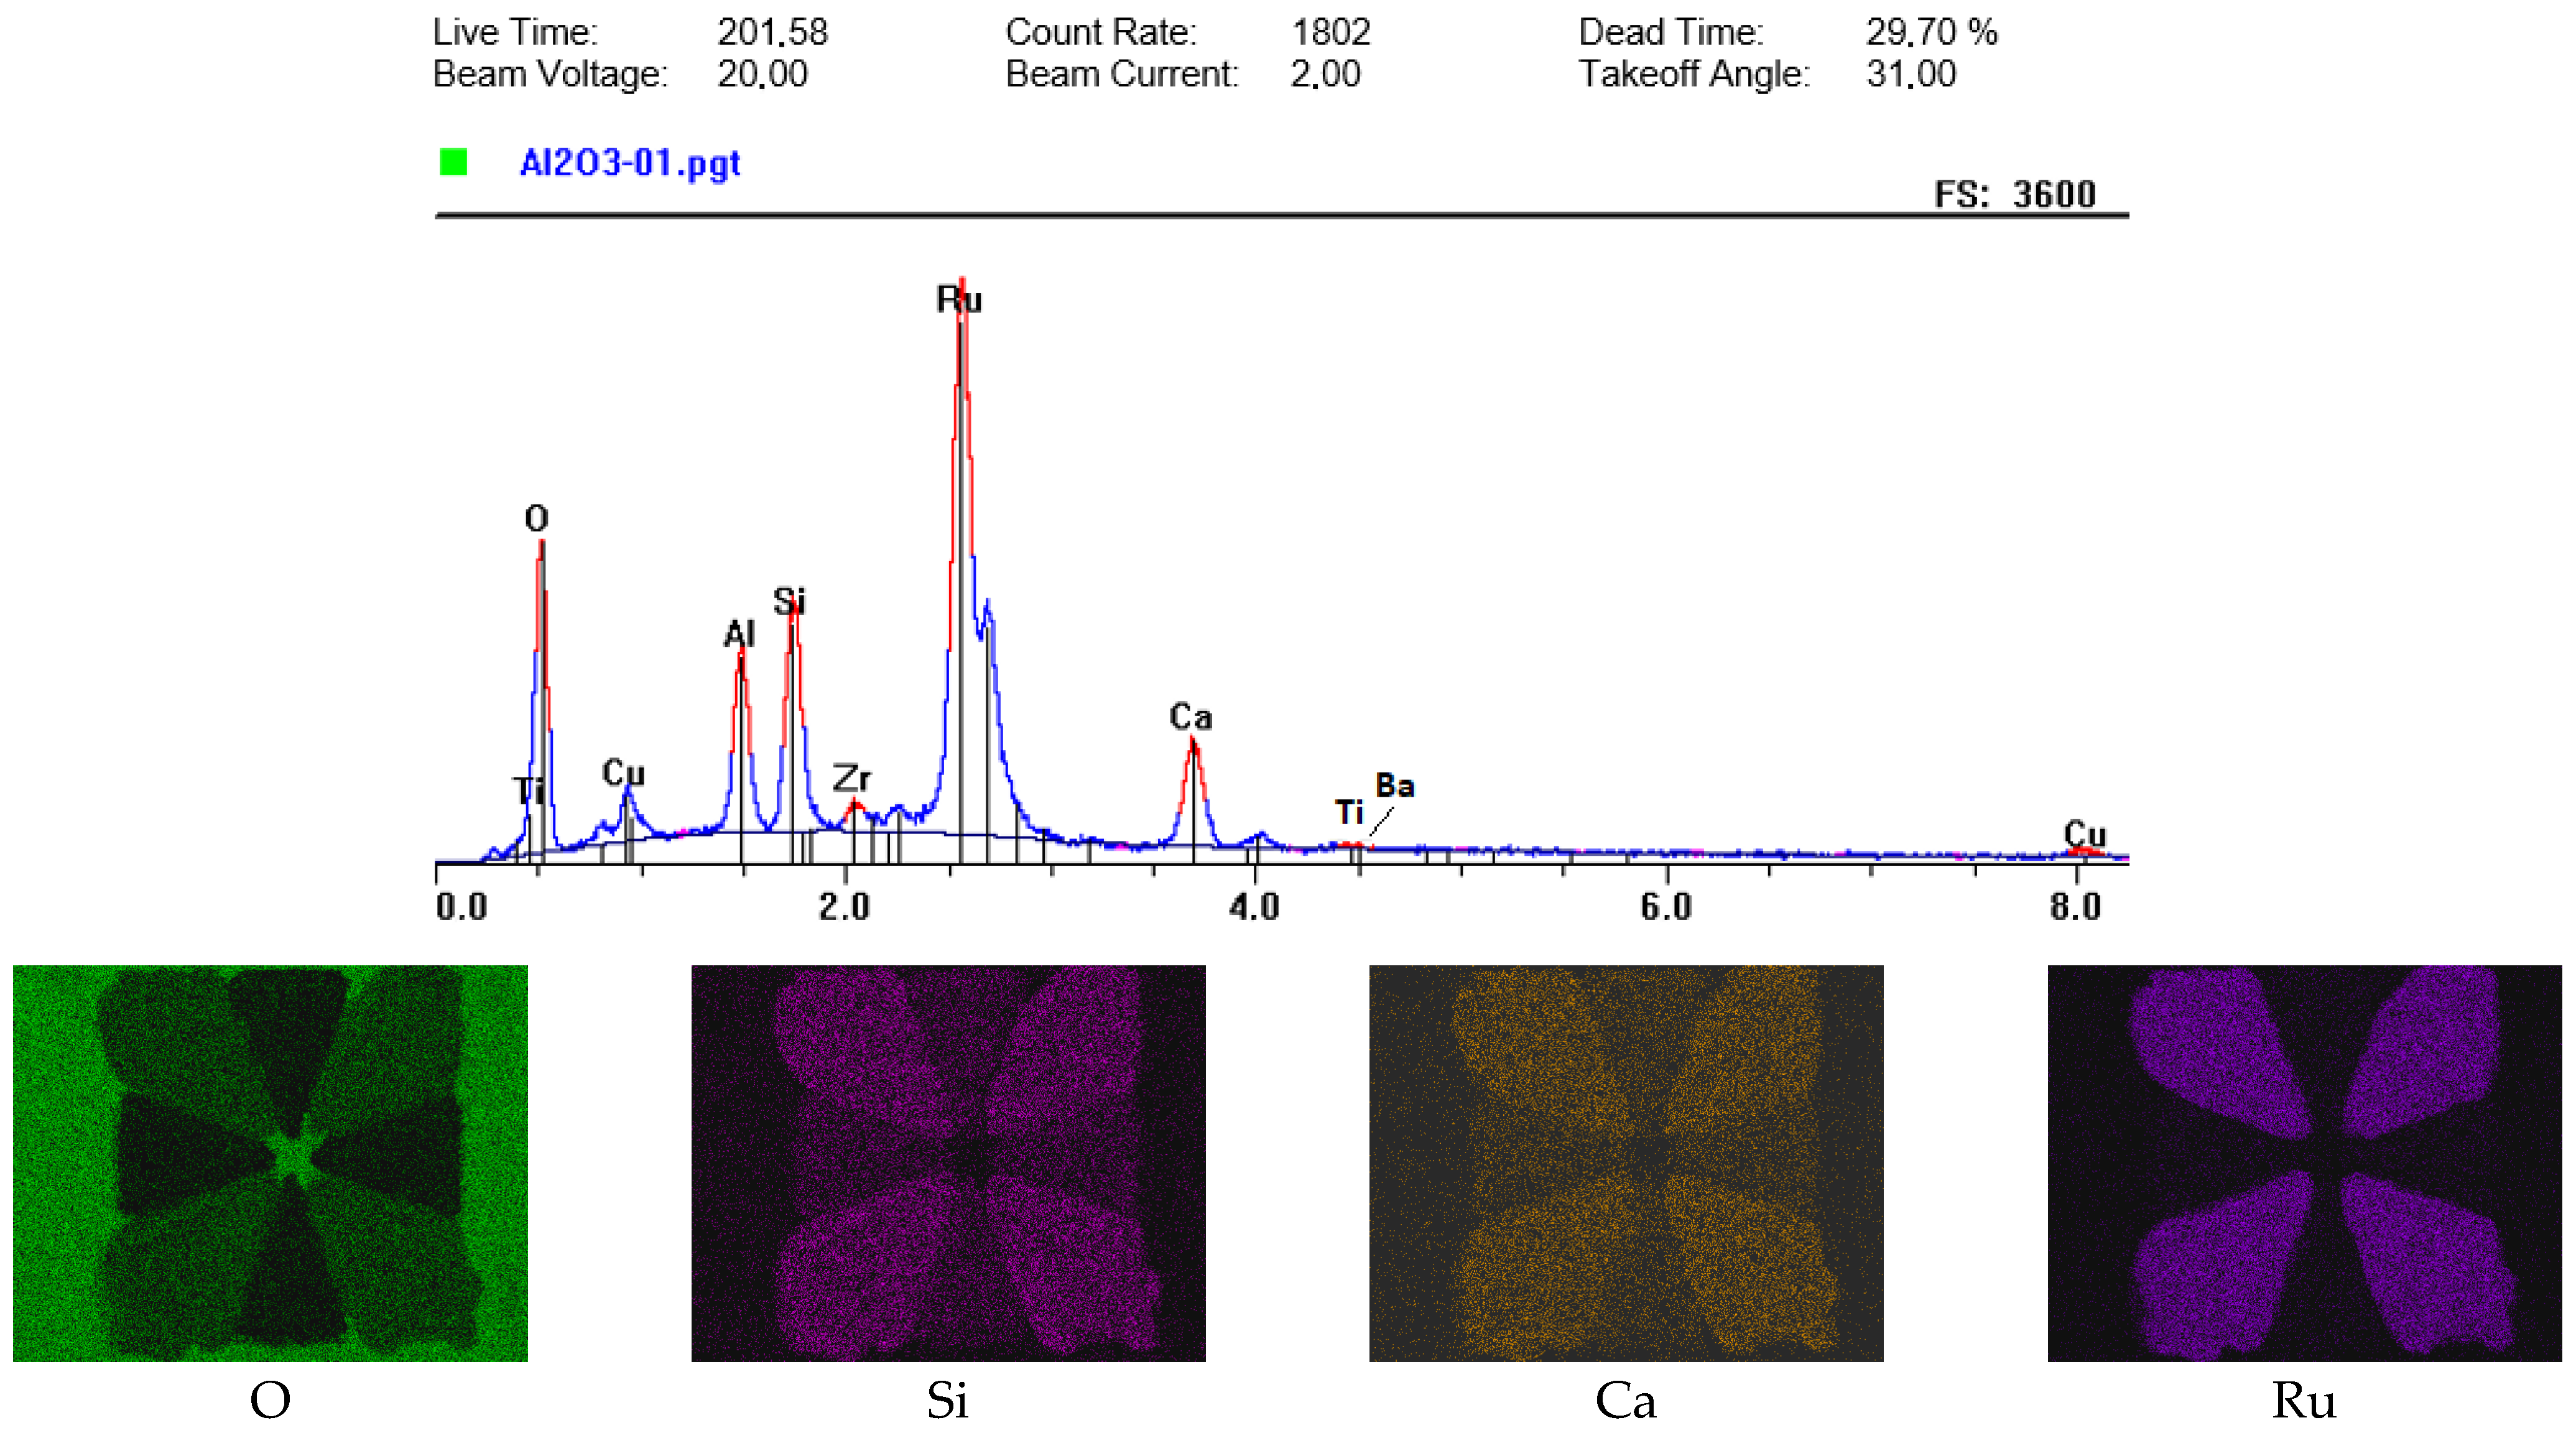
EDX analysis was performed on the three samples after annealing to examine the constituents of the thermistor material. The selected position for analysis was the alignment marks in the top left corner of each prototype, cf. Figure 3. The chemical analysis focused on an area that included only the thermistor material, while the constituent mapping was performed over a larger area that encompassed the ceramic material, thermistor material and terminal material, which is AuPtPd, as presented in Figure 13. The EDX mapping images, Figure 14, Figure 15 and Figure 16, were enhanced for contrast to improve the visibility of the mapped materials.
The weight and atomic percentage of the thermistor placed on Alumina are presented in Table 5. We only include this table and not the equivalents for L8 or A6M-E, as it most accurately reflects the thermistor material, given that it was screen printed onto an already fired alumina substrate.
From the element list in Table 5, it is evident that the ruthenium (Ru) is the most significant component in the thermistor material, followed by oxygen (O), silicon (Si) and aluminum (Al). Additionally, we identified the presence of copper (Cu), calcium (Ca), zirconium (Zr), sodium (Na), barium (Ba) and titanium (Ti).
TiO2, CaTiO3 and BaTiO3 are known to exhibit some PTC behavior, as reported by [8]. Additionally, RuO2 has also been documented to have a positive temperature coefficient [3], which aligns with our findings and supports the existing scientific literature. SiO2, is utilized in LTCC tapes and pastes to lower the firing temperature below 1000 °C.
From the EDX mappings in Figure 14, Figure 15 and Figure 16 we can see that the main constituents of the thermistor material are oxygen (O), silicon (Si), calcium (Ca) and ruthenium (Ru). The response is quite similar between the L8 and Al2O3 sample, while the A6M-E sample provides a weaker ruthenium and a stronger response for silicon. The other constituents (copper, sodium, aluminum, barium and titanium) are, from mapping results, found to be evenly distributed across the thermistor and ceramic areas. The zirconium is primarily found on the metallized pads and is not present in the thermistor region, indicating that the AuPtPd also contains zirconium.

4. Conclusions

Thermistors have been successfully implemented both internally and externally on two LTCC materials from Vibrantz. While both externally and internally placed thermistors function effectively, the internally placed thermistors exhibit a TCR value that is approximately 30% lower than that of their external counterparts. Various thermistor designs, including square, two-squares-in-parallel and two-squares-in-series, have been tested, showing a slight advantage for the square and two-squares-in-series configurations. The resistive values span over a wide range, from 21.6 Ω/□ to 101 Ω/□ at room temperature for the externally placed squared version across the three test substrates, with a standard variation as high as 67%. However, this variation does not adversely affect functionality, provided that the initial value is known. After normalizing to the initial value, the variation in the resistive values over a temperature ranging from 25 °C to 300 °C remains essentially consistent, with a slight dependency on design topology, placement (internally or externally), and on the ceramic base material. The annealing process conducted for 136 h at 150 °C, had a slight impact on the TCR. The L8 and alumina samples are more similar in TCR values and in surface structure compared to A6M-E; however, the resistive values appear to be higher for the alumina implementations. No delamination was observed in these samples, representing an improvement over earlier scientific work. Material analysis via EDX indicates that the composition of the PTC thermistor involves oxides such as TiO2, CaTiO3 and BaTiO3 and RuO2, with the RuO2 being the principal constituent.

Supplementary Materials

The following supporting information can be downloaded at https://www.mdpi.com/article/10.3390/ceramics8030103/s1. Manufacturing file: ceramics-08-00103_LTCC_CK_15_scale1_1_1625_gerber.zip, this file includes all print layers and openings of the circuit for production. Resistance data and graphs: ceramics-08-00103_thermistor graph.xlsx, this file includes resistances values measured for each temperature and for each prototype, before and after annealing, including graphs as found in this publication. EDX data: ceramics-08-00103_EDX.zip, this file includes the EDX material analysis and mapping as found in this paper with additional mappings chosen not to be shown in this paper. ceramics-08-00103-rougness-measurement, this file includes profilometer measurement data as presented in this paper together with some additional measurements and graphs.

Author Contributions

Conceptualization, C.K.; methodology, C.K. and M.S.; validation, C.K.; formal analysis, C.K.; investigation, C.K. and M.S.; resources, C.K.; data curation, C.K.; writing—original draft preparation, C.K.; writing—review and editing, C.K. and M.S.; visualization, C.K.; supervision, C.K.; funding acquisition, C.K. All authors have read and agreed to the published version of the manuscript.

Funding

This research is supported by the European Union through the European Regional Development Fund (ERDF), and by the Ministry of Higher Education and Research, Brittany and Rennes Metropole, through the CPER Project SOPHIE/STIC and the Ondes and CPER Space Tech Drone Tech.

Institutional Review Board Statement

Not applicable.

Informed Consent Statement

Not applicable.

Data Availability Statement

The original contributions presented in this study are included in the article/Supplementary Materials. Further inquiries can be directed to the corresponding author(s).

Acknowledgments

The authors would like to thank Philippe Elies at the Université Occidental de Bretagne, UBO, for conducting the EDX analysis.

Conflicts of Interest

The authors declare no conflicts of interest.

References

  1. Birol, H.; Maeder, T.; Jacq, C.; Ryser, P. Effects of Firing Conditions on Thick-Film PTC Thermistor Characteristics in LTCC Technology. In Proceedings of the Ceramic Interconnect Technology Conference, Denver, CO, USA, 27–28 April 2004. [Google Scholar]
  2. Hrovat, M.; Belavič, D.; Kita, J.; Holc, J.; Cilenšek, J.; Drnovšek, S. Thick-Film NTC Thermistors and LTCC Materials: The Dependence of the Electrical and Microstructural Characteristics on the Firing Temperature. J. Eur. Ceram. Soc. 2009, 29, 3265–3271. [Google Scholar] [CrossRef]
  3. Hrovat, M.; Belavič, D.; Kita, J.; Holc, J.; Cilenšek, J.; Golonka, L.; Dziedzic, A. Thick-Film PTC Thermistors and LTCC Structures: The Dependence of the Electrical and Microstructural Characteristics on the Firing Temperature. J. Eur. Ceram. Soc. 2007, 27, 2237–2243. [Google Scholar] [CrossRef]
  4. Martínez-Cisneros, C.S.; Ibáñez-García, N.; Valdés, F.; Alonso, J. LTCC Microflow Analyzers with Monolithic Integration of Thermal Control. Sens. Actuators A: Phys. 2007, 138, 63–70. [Google Scholar] [CrossRef]
  5. Reimann, T.; Barth, S.; Capraro, B.; Bartsch, H.; Töpfer, J. Cofiring of LTCC Multilayer Assemblies with Integrated NTC Thermistor Temperature Sensor Layers. Ceram. Int. 2021, 47, 27849–27853. [Google Scholar] [CrossRef]
  6. Available online: https://vibrantz.com/wp-content/uploads/2023/02/Vibrantz_PC_Electronic-Materials-5G_Brochure_012023.pdf (accessed on 14 October 2024).
  7. ESL CERMET RESISTOR SYSTEM PTC 2611-I Special. Available online: http://www.czpartner.com/upfile/7-12610QQ_103250212_29GBJuHI9779835.pdf (accessed on 5 July 2025).
  8. Ma, J.; Zhu, X.; Zhang, F.; Xu, Q.; Jiang, W.; Zhou, X. Positive Temperature Coefficient of Resistivity Effects of Semiconducting (Bi½ Na½) TiO3-CaTiO3-BaTiO3 Ceramics Sintered in Air Atmosphere. J. Shanghai Univ. (Engl. Ed.) 2010, 14, 452–455. [Google Scholar] [CrossRef]
Figure 1. (a) Layout, (b) 3D model, (c) cross section of the thermistor prototype. Buried thermistors are indicated by magenta color, external top layer thermistors by yellow color, internal terminals are indicated by dark blue (accessed through cavities) and external terminals are indicated by light blue surfaces.
Ceramics 08 00103 g001
Figure 2. Internal layer (a) and top layer (b) of thermistor prototype after screen printing. Cavity openings in the top layer enables contact of the terminals of the buried thermistors. Each layer measures 50.8 mm × 50.8 mm × 254 µm. All in all, four 254 µm thick green layers were used.
Ceramics 08 00103 g002
Figure 3. The finalized L8 (top left) and A6M-E (top right) and Alumina (bottom) thermistor prototypes after firing. The outer dimensions before firing were the same; after firing, the shrinkage of the LTCC prototypes is 12.5% for the L8 and 17.5% for the A6M-E sample, while the Alumina sample remains unchanged, as expected.
Ceramics 08 00103 g003
Figure 4. Dimensional check of thermistors, (ac) comes from the L8 prototype, (df) from the A6M-E prototype and (gi) from the alumina reference. Dimensions are given in µm and the ratio width/height is calculated. The blue squares show where the measures were taken.
Ceramics 08 00103 g004
Figure 5. (ac) Surface structure seen at 50× magnification of a surface of 290 µm × 182 µm, (df) interferometric profile measured on the top layer thermistor surfaces, as fired. The grayscale indicates the topology and the red line indicates the tested profile trajectory. The values indicate the trajectory length/minimum height/maximum height in µm.
Ceramics 08 00103 g005
Figure 6. Resistance evolution as a function of temperature for the L8 thermistors. The values are normalized with the resistive value at 25 °C.
Ceramics 08 00103 g006
Figure 7. Resistance evolution as a function of temperature for the A6M-E thermistors. The values are normalized with the resistive value at 25 °C.
Ceramics 08 00103 g007
Figure 8. Resistance evolution as a function of temperature for the Alumina thermistors. The values are normalized with the resistive value at 25 °C.
Ceramics 08 00103 g008
Figure 9. L8 normalized resistive values after annealing for 136 h at 150 °C.
Ceramics 08 00103 g009
Figure 10. A6M-E normalized resistive values after annealing for 136 h at 150 °C.
Ceramics 08 00103 g010
Figure 11. Al2O3 normalized resistive values after annealing for 136 h at 150 °C.
Ceramics 08 00103 g011
Figure 12. Cross sections of L8, A6M-E and alumina prototype. The L8 and A6M-E cuts show the internally placed thermistor, while the alumina cut shows the externally placed thermistor. The L8 and A6M-E prototypes are 720 µm thick after firing, the Al2O3 prototype is 635 µm thick.
Ceramics 08 00103 g012
Figure 13. Typical mapping area of EDX material analysis, (a) pad material, (b) overall size. The PTC material is found in the yellow structures of figure (b).
Ceramics 08 00103 g013
Figure 14. EDX material analysis performed on the L8 prototype with main constituents mapped on the thermistor area. The triangular pads placed north, south, west and east are AuPtPd.
Ceramics 08 00103 g014
Figure 15. EDX material analysis performed on the A6M-E prototype with main constituents mapped on thermistor area. The triangular pads placed north, south, west and east are AuPtPd.
Ceramics 08 00103 g015
Figure 16. EDX material analysis performed on the alumina sample with main constituents mapped on thermistor area. The triangular pads placed north, south, west and east are AuPtPd.
Ceramics 08 00103 g016
Table 1. Resistance mean value [Ω] and standard deviation [%] at room temperature. Int. means internal (or buried) thermistor, Ext. means external thermistor, □ for square shape, □//□ for two parallel squares and □-□ for two squares in series configuration. NA means not applicable.
MaterialInt. □Ext. □Int. □//□Ext. □//□Int. □-□Ext. □-□
L838.4 ± 20.921.6 ± 10.026.3 ± 11.412.4 ± 3.186.9 ± 10.348.4 ± 0.6
A6M-E115.4 ± 8.946.7 ± 4.2104.8 ± 10.625.6 ± 0.2346.4 ± 1.5102.7 ± 6.8
Al2O3NA101.2 ± 66.7NA73.6 ± 71.1NA115.0 ± 13.2
Table 2. Temperature Coefficient of Resistance (TCR) value for thermistors calculated from Equation (1) [ppm/°C]. Int. means internal (or buried) thermistor, Ext. means external thermistor, □ for square shape, □//□ for two parallel squares and □-□ for two squares in series configuration. NA means not applicable.
MaterialInt. □Ext. □Int. □//□Ext. □//□Int. □-□Ext. □-□
L8202727391843256618782597
A6M-E157920621355216614322132
Al2O3NA2808NA2800NA3009
Table 3. Resistance mean value [Ω] and standard deviation [%] at room temperature after annealing, 136h, 150 °C. Int. means internal (or buried) thermistor, Ext. means external thermistor, □ for square shape, □//□ for two parallel squares and □-□ for two squares in series configuration. Italic lines indicate the mean value change due to annealing, in percentage. NA means not applicable.
MaterialInt. □Ext. □Int. □//□Ext. □//□Int. □-□Ext. □-□
L839.1 ± 54.422.4 ± 46.027.0 ± 42.513.0 ± 23.887.8 ± 12.049.2 ± 1.2
% change in mean value+1.8+3.7+2.7+4.8+1.0+1.7
A6M-E116.4 ± 7.646.9 ± 10.0105.7 ± 10.026.2 ± 0.8348 ± 1.41103.7 ± 6.7
% change in mean value+0.9+0.4+0.9+2.3+0.5+1.0
Al2O3NA98.3 ± 61.1NA73.6 ± 91.0NA117.2 ± 11.4
% change in mean valueNA−3NA0NA+1.9
Table 4. TCR value for thermistors after annealing calculated from Equation (1) [ppm/°C]. Int. means internal (or buried) thermistor, Ext. means external thermistor, □ for square shape, □//□ for two parallel squares and □-□ for two squares in series configuration. NA means not applicable.
MaterialInt. □Ext. □Int. □//□Ext. □//□Int. □-□Ext. □-□
L8193024551692229117632453
A6M-E145019621240192613321983
Al2O3NA2414NA2404NA2606
Table 5. EDX element analysis for thermistor material on Al2O3 substrate.
ElementLinekeVWt%At%At PropNet (cps)
OKA10.52340.4873.500.0101.7
CKA10.2770.461.110.01.6
AlKA11.4874.054.360.086.0
RuLA12.55843.4912.500.0309.5
SiKA11.7404.194.340.0104.4
CuKA18.0460.710.330.05.7
CaKA13.6913.322.410.060.0
ZrLA12.0422.260.720.017.3
NaKA11.0410.460.590.05.3
BaLA14.4650.510.110.02.2
TiKA14.5100.050.030.00.8
Total 100.00100.000.0
Disclaimer/Publisher’s Note: The statements, opinions and data contained in all publications are solely those of the individual author(s) and contributor(s) and not of MDPI and/or the editor(s). MDPI and/or the editor(s) disclaim responsibility for any injury to people or property resulting from any ideas, methods, instructions or products referred to in the content.