Article

Heat Treatment-Driven Structural and Morphological Transformation Under Non-Parametric Tests on Metal–Ceramic-Sputtered Coatings

by
Federico Gamboa-Soto
1,
Roberto Bautista-García
2,
Diana I. Llanes-Gil López
3,
Juan E. Bermea
1,
René Tinoco Mendiola
1,
Sion F. Olive-Méndez
4 and
Andrés González-Hernández
2,5,*
1
GI Research Group, Engineering Faculty, Autonomous University of Tamaulipas, Tampico 87000, Mexico
2
IMA Research Group, Engineering Faculty, Autonomous University of Tamaulipas, Tampico 87000, Mexico
3
Tecnológico Nacional de México, Instituto Tecnológico de Altamira, Altamira 89602, Mexico
4
Centro de Investigación en Materiales Avanzados, S.C. (CIMAV), Miguel de Cervantes 120, Chihuahua 31136, Mexico
5
División de Estudios de Posgrado e Investigación, Engineering Faculty, Autonomous University of Tamaulipas, Tampico 87000, Mexico
*
Author to whom correspondence should be addressed.
Ceramics 2025, 8(1), 25; https://doi.org/10.3390/ceramics8010025
Submission received: 19 December 2024 / Revised: 25 February 2025 / Accepted: 27 February 2025 / Published: 6 March 2025

Abstract

:
The present study analyzes experimental data using qualitative and quantitative methods to identify significant statistical changes. These methods were employed to evaluate the results from the structural characterization of annealed TiWN and TiWC coatings elaborated by magnetron sputtering. The as-grown coatings were thermally treated at 500 °C in a furnace under an Ar atmosphere. Structural characterization was performed by X-ray diffraction and optical and electronic microscopy. The chemical composition was determined by energy dispersive X-ray spectroscopy. The data were analyzed using the Kruskal–Wallis (K-W) and Spearman correlation tests as non-parametric methods, employing free statistical software. The response variable—the crystallite size calculated through the Scherrer formula—is statistically tested. The data of the crystallite size of each sample were forecasted using the simple moving average (SMA) method to increase the number of data points of each sample to 12. The crystallite size of each sample remained unchanged before and after thermal treatment. However, microscopy analyses revealed strong surface cracking. The average crystallite size before and after the thermal treatment was analyzed by the K-W correlation, revealing significant changes considering a reliability level of 95% and a significance error of 5%. The analysis revealed a strong correlation between experimental data and statistical treatment results.

1. Introduction

1.1. TiWN and TiWC Transition Metal–Ceramic Coatings

Titanium (Ti) is a light metal with a high melting point and excellent corrosion resistance; however, the compromise between flexibility and malleability needs to be considered upon improvement of structural properties by alloying with other elements [1,2]. Tungsten (W) is considered a high-melting temperature transition metal with solid atomic bonds in crystalline lattices, providing high strength and heat resistance [3]. Furthermore, tungsten nitride (WN) has strong mechanical properties, as high hardness with thermal stability is of great technological interest for cutting tools and other industrial applications [4]. Finally, tungsten carbides (WCs) have many advantageous characteristics, such as low thermal expansion, high thermal conductivity, and dimensional stability, that have a widespread use as a hard-ceramic reinforcement in modern functional applications [5]. In most cases, post-growth thermal treatments (TTs) can improve the coating properties by the reduction of cracks, pores, and residual stress [6], i.e., improving the surface microstructure by increasing the crystallite size. Rong et al. [7] reported that carbide coatings annealed at 500 °C exhibited an increase in compact and ordered grains in comparison with their microstructure before thermal treatment; the carbides undergo a solid phase transformation through atomic diffusion at high temperatures. These results demonstrate that the coating is in a non-equilibrium state before thermal treatment, which promotes recrystallization processes within grain refinement [8]. However, despite the TT promoting positive effects, it can also promote the formation of cracks attributed to the exerted strain on the layer [9]. It is well known that carbides with high W concentration are subjected to stress at the interface, promoting crack initiation and reducing the mechanical properties on materials [10]. However, this stress concentration can be reduced by enrichment with Ti atoms incorporated in the WC lattice [11]. For example, coatings exposed to high-temperature TT can promote strong atomic diffusion by increasing the crystallite size [12,13]. Consequently, the peaks of the X-ray diffraction (XRD) patterns became more intense [14].

1.2. Relevance of Statistical Treatment on Materials Science

A thorough review of the literature revealed the use of statistical analysis in various studies on materials science. For example, Taghipour et al. [15] investigated the effect of different TTs on aluminum coatings deposited by gas phase aluminizing process. The study used experimental methods to evaluate mechanical and chemical properties and statistical analyses to determine the significance of the results. In another study [16], it was reported the effect of TT on Ti coatings grown by D.C. sputtering. They used analysis of variance (ANOVA) to statistically compare properties such as hardness and corrosion resistance. Martínez et al. [17] analyzed the influence of different TTs on copper coatings elaborated by D.C. sputtering. The authors conducted a comparative analysis using both experimental and statistical approaches, highlighting the importance of the temperature of the TT and its effect on the modification of the microstructure and mechanical properties of the coating. In [18], they conducted a comparative study between experimental methods and statistical analyses on niobium (Nb) coatings, also grown by D.C. sputtering. The study highlighted the effectiveness of both approaches in evaluating wear resistance and adhesion of the coatings. A recent study [19] reported the impact of heat treatment on the adhesion of ceramic coatings. An experimental approach was employed to measure adhesion of the coating and statistical analysis to assess the significance of the results. It was also found that the friction coefficient in each film was reduced by TT, being the reason why wear resistance was improved. It is important to note that before conducting experiments, the experimental design will reduce interpretation errors. Randomized controlled trials (RCTs) are the gold standard in this context due to their ability to reduce bias and provide robust evidence of causality. Bickman and Rog [20] determined that statistical significance is crucial in quantitative research to ensure that the results are not due to chance. According to conventional criteria, a result is significant if the p-value is less than 0.05, which indicates that there is less than 5% probability that the observed differences are due to random variation. In materials science, discerning the significant differences between the results becomes a complex task, which is why this work suggests the use of statistical methods to facilitate research. Understanding the differences between experimental and statistical approaches, researchers can make better decisions about the design and analysis of future studies. Integrating both methodologies, one can enhance the robustness and reliability of the results [21].

1.3. Statistical Techniques

Statistical tools like ANOVA, linear regression, and t-tests are commonly used for evaluating significant differences of experimental results [22]. This type of analytical tool is widely used in natural and exact sciences for parametric statistics in addition to the realization of mean comparisons between groups of interest [23]. This evaluation is crucial to validate the effectiveness of the TT realized in this work [24]. Knowing the parameters of hypothesis tests, one can determine if a difference is statistically significant or not, depending on the parameters of the experiment. Previous studies have shown that a combination of experimental and statistical approaches provides a more comprehensive understanding of the phenomena being investigated. A simple moving average (SMA) statistical forecasting method finds practical applications in various disciplines, including medicine, psychology, engineering, and materials science. This versatility underscores its relevance and applicability in research. The SMA model is beneficial for calculating forecasts for the upcoming period, whether based on previous quarterly data or a specific period [25]. An SMA of order k, SMA (k), is the value of k consecutive observations [26]. Normality is crucial in many parametric and nonparametric statistical methods. The nonparametric tests are attractive because they do not require an assumption of the normal distribution; even though the data come from normal distributions, these nonparametric tests do not sacrifice reliability in comparison to tests based on the normality assessment [27]. As the statistician Kolmogorov [28] mentioned, there are four statistical tests that are commonly used for evaluating normality from the sampled data: the Kolmogorov–Smirnov [29,30], Anderson–Darling [31], Cramer-von Mises [32], and Shapiro–Wilk tests [33]. It is well established that the null hypothesis of the normality test state appears when the data are sampled from a normal distribution. Therefore, if the p-value is greater than the predetermined critical value (α = 0.05), then the null hypothesis is accepted, and thus, it concludes that the data are normally distributed. The important factor to consider is the sample size because it influences the outcome of the statistical tests. The Shapiro–Wilk (S-W) test requires the sample size to be between 3 and 50 [33,34]. The Kruskal–Wallis (K-W) test, proposed in 1952, is a rank-based non-parametric test that can be used to determine if there are statistically significant differences between two or more groups of an independent variable on a continuous or ordinal dependent variable. The K-W test is a more generalized form of the Mann–Whitney U-test and the non-parametric of the one-way ANOVA test [33]. As described by Nwobi and Akanno [35], the K-W test is an alternative to the ANOVA F-Student test, as it has been demonstrated to have a greater potential than the F-Student test when the population distribution is not normal [36,37]. According to [38], the K-W test with ranked data can be employed particularly when the following are true:
a.
The data are ordinal and do not meet the precision of interval data;
b.
There are serious concerns about extreme deviation from normal distribution;
c.
There is a considerable difference in the number of subjects for each comparative group.
The K-W test’s hypotheses are as follows: The null hypothesis (H0): the population median is equal between groups. The alternative hypothesis (H1): the population median is not equal [39]. To calculate the K-W value test, the procedure follows the next steps [40].
1.
Determine the ranks (use average rank in the case of ties).
2.
Determine the overall average rank.
3.
Determine the number of cases in each category, determine the average rank per category, and square the difference with the overall average rank, then multiply by the number of cases in the category.
4.
Sum up the last column.
5.
For each rank, subtract the overall rank average and square the result.
6.
Sum up the results of step 5.
7.
Determine the H-value statistics. The exact distribution of H is complicated. It depends on the sample size, n1, n2, …, nk, and so it is not practical to tabulate its values beyond a small number of samples. When k or n is large, the exact distribution of H under H0 can be approximated by the χ 2 distribution with (k − 1) degrees of freedom. For this purpose, we state the K-W theorem without proof.
8.
Determine the degrees of freedom.
9.
Use a χ 2 bilateral distribution to determine the critical value.
To determine if H0 is accepted or rejected, one evaluates the critical value if it is greater than the calculated H; thus, H0 is kept, and there is no difference; in other words, reject H0 if the H value > critical value.
Now, the Spearman rank correlation coefficient (also called Spearman’s ρ) is a non-parametric measure. It is used when the data are generally not distributed between two variables. The Spearman correlation (rs) is used for the correlation of ranks; it assumes that the variable A has rank (RA) and that the variable B has the rank (RB), and assuming that (d) represents the difference between the two ranks (d = RARB), from the smallest to the largest ones [41]. The differences between the positive and negative ranks RA, RB, and rs are calculated from the Pearson correlation coefficient (R). rs takes a value from +1 to −1. If rs = +1, then it indicates a perfect positive correlation. If rs = −1, it indicates a perfect negative correlation [42,43].
When the study produces little data (<30 elements), the non-parametric method is used. However, when the sample is extremely small, <12 elements, the statistical treatment can produce misleading bias [44]. In materials science research, statistical methods are employed for mathematical modeling data projecting for the generation of simulated data forecasts. The statistical method SMA for simulating data forecasts is very common and is one of the widely known technical indicators used to predict future data in a time series analysis. During its development, researchers have made many variations and implementations [45].
Thus, the present work has the aim of studying if the TT induces phase changes in the TiWN and TiWC sputtered layers considering structural, elemental composition, and morphological properties. The coating properties and experimental growth methods were previously published in [46].

2. Materials and Methods

2.1. Coating Growth

The base pressure of the sputtering system was 4 × 10⁻⁴ Pa; the target–substrate distance was 100 mm and the substrate temperature was 300 °C. For improvement of the mechanical adhesion, a pure Ti layer was deposited with a power of 450 W, applying a voltage bias of −10 V also at 300 °C. The Ar plasma was created with a mass flow of 50 sccm, and for the nitride and carbide compounds, the mass flow for N2 and CH4 was 12 and 16 sccm, respectively. The rf power of 420 and 350 W was applied on Ti and W targets, respectively. The thickness measurement was realized by profilometry; the thicknesses were 3.54 ± 0.04 μm and 2.95 ± 0.08 μm for the TiWN and TiWC coatings, respectively.

2.2. Preparation of Sample and Thermal Treatment

The coatings on AISI 1065 substrates (~2.5 × 2.5 cm2) commercial steel carbon (Alambiques 2981, Alamo Industrial, Tlaquepaque, Jalisco, México), were prepared as follows. The samples were cut using a precision diamond saw (VC 50, LECO, St. Joseph, MI, USA), using a cutting speed of 8 m/min in dimensions to obtain sections of 1.25 × 1.25 cm2. Later, the samples were cleaned with isopropanol prior the TT. The samples were set into a quartz tube furnace (70 mm in diameter and 1000 mm in length) with a 450 mm heating zone (OTF-1200X, MTI Corporation, Richmond, CA, USA). The samples were subjected to TT under an Ar flow of 3 sccm and at a temperature of 500 °C under a base pressure of 6.7 Pa for 120 min and left cooling freely. The coatings will be labeled hereinafter as TiWN-AS, TiWN-TT, TiWC-AS, and TiWC-TT, where AS and TT represent the as-sputtered and thermally treated samples, respectively.

2.3. Characterization

The micrographs were acquired from portable, Dino-Lite Digital Microscope, JNYZ59419 model (Chongxin Road, Sanchong Dist., New Taipei City 241513, Taiwan, China); focus ranges from 15 to 40 mm using the minimum magnification of 50×. The images of the surfaces after TT were acquired with a field emission-scanning electron microscope (FE-SEM) (JSM-7401F, JEOL, Akishima, Tokyo, Japan) incorporating a cold cathode field emission gun, using a 30 kV acceleration voltage. Secondary and retractable backscatter electron detectors (Akishima, Tokio 196-8558, Japan) were also used. Energy dispersive X-ray spectroscopy (EDS), (EDAX, a semiquantitative technique, was employed to evaluate the evolution of the elemental composition (weight percent, wt.%) before and after TT. The X-ray diffraction (XRD) patterns (PANalytical, X´Pert PRO, Eindhoven, The Netherlands) were recorded in Bragg-Brentano geometry using a diffractometer Philips Panalytical Xpert equipment (PANalytical, Eindhoven, The Netherlands) with Cu-kα (λ = 1.5405 Å) at room temperature (RT) collecting patterns in the 2θ range (20° < 2θ < 80°) with a scanning step size of 0.05° and a time count of 1.5 s for each point.

2.4. Statistical Analysis

To determine the significance level of the TT on the structural properties, the entering variable of crystallite size (response variable) in TiWN-AS and TiWC-AS coatings was determined by the Scherrer formula; the statistical treatment was carried out using the t-test and Spearman correlation coefficient method. The statistical analysis was carried out using © 2019 Minitab-19 (Chicago, IL, USA) software free version. Statistical analysis selected the sample-dependent T-Student mode and Mann–Whitney tests with a small sample size considering the experimental data by XRD high deflection (preferential orientation plane). The performance of treatment statistics was carried out using a reliability of 95% and a significance of 5%. For a crystallite grain size study, we used the SMA forecast method.

3. Results and Discussion

3.1. Data Experimental Analyses
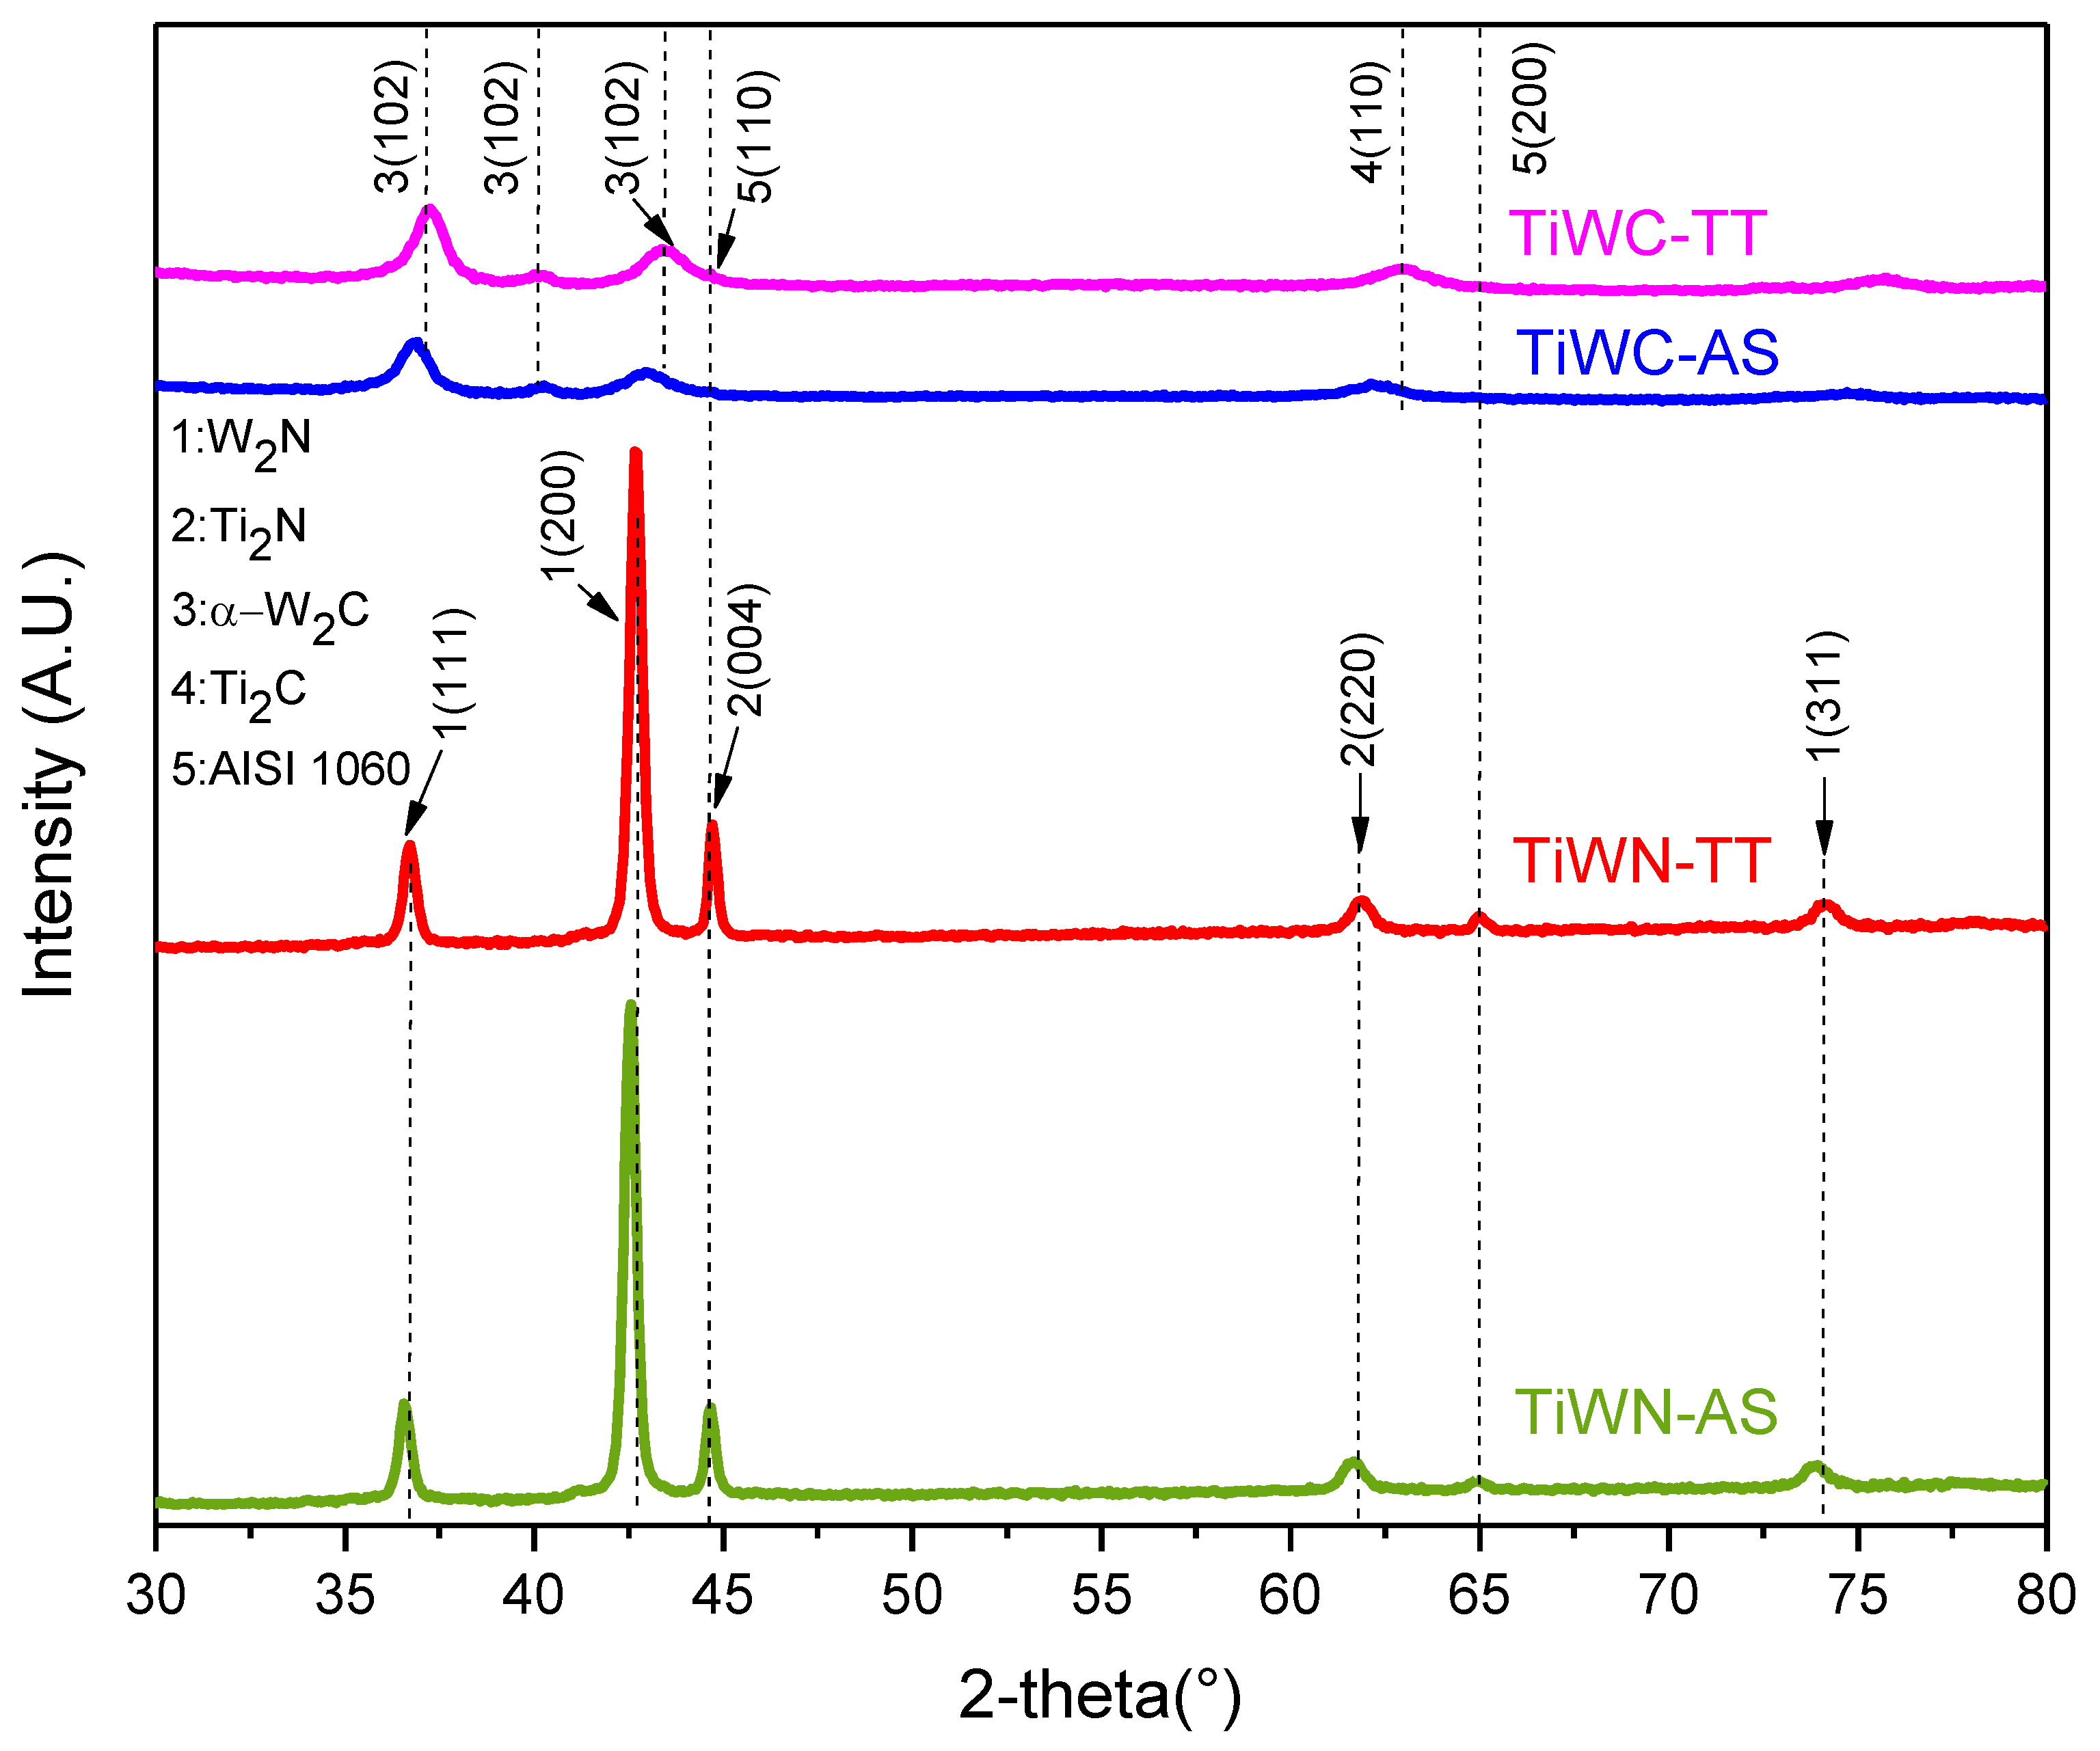
3.1.1. XRD Patterns

Figure 1 shows the XRD pattern of the sputtered coatings realized at room temperature and annealed at 500 °C. In both coatings, there is a slight increase in the peak intensity after TT. The sharp peaks in the XRD pattern indicate the excellent crystallinity of the annealed coating. This behavior can be attributed to the process of grain refinement promoted by TT. According to previous research work published by [46], the XRD pattern of the TiWN-AS layer before deposition shows two secondary phases corresponding to T2N and W2N identified as tetragonal cell (PDF 01-080-3438), and simple cubic (ICDD PDF 00-025-1257), respectively. After TT, the positions of the diffraction peaks are similar. However, all the peaks of the XRD pattern show a right shift. This is attributed to residual stress and strain [47]. Considering the intensity of peaks in each TT, it is possible to infer that a not-significant difference exists using statistical methods, such as the non-parametric one. One can observe that the peaks of the substrate are located at 2θ = ~45° (110) and 2θ = 65° (200) indexed within the ICDD Data Card 04-014-0360 [48].

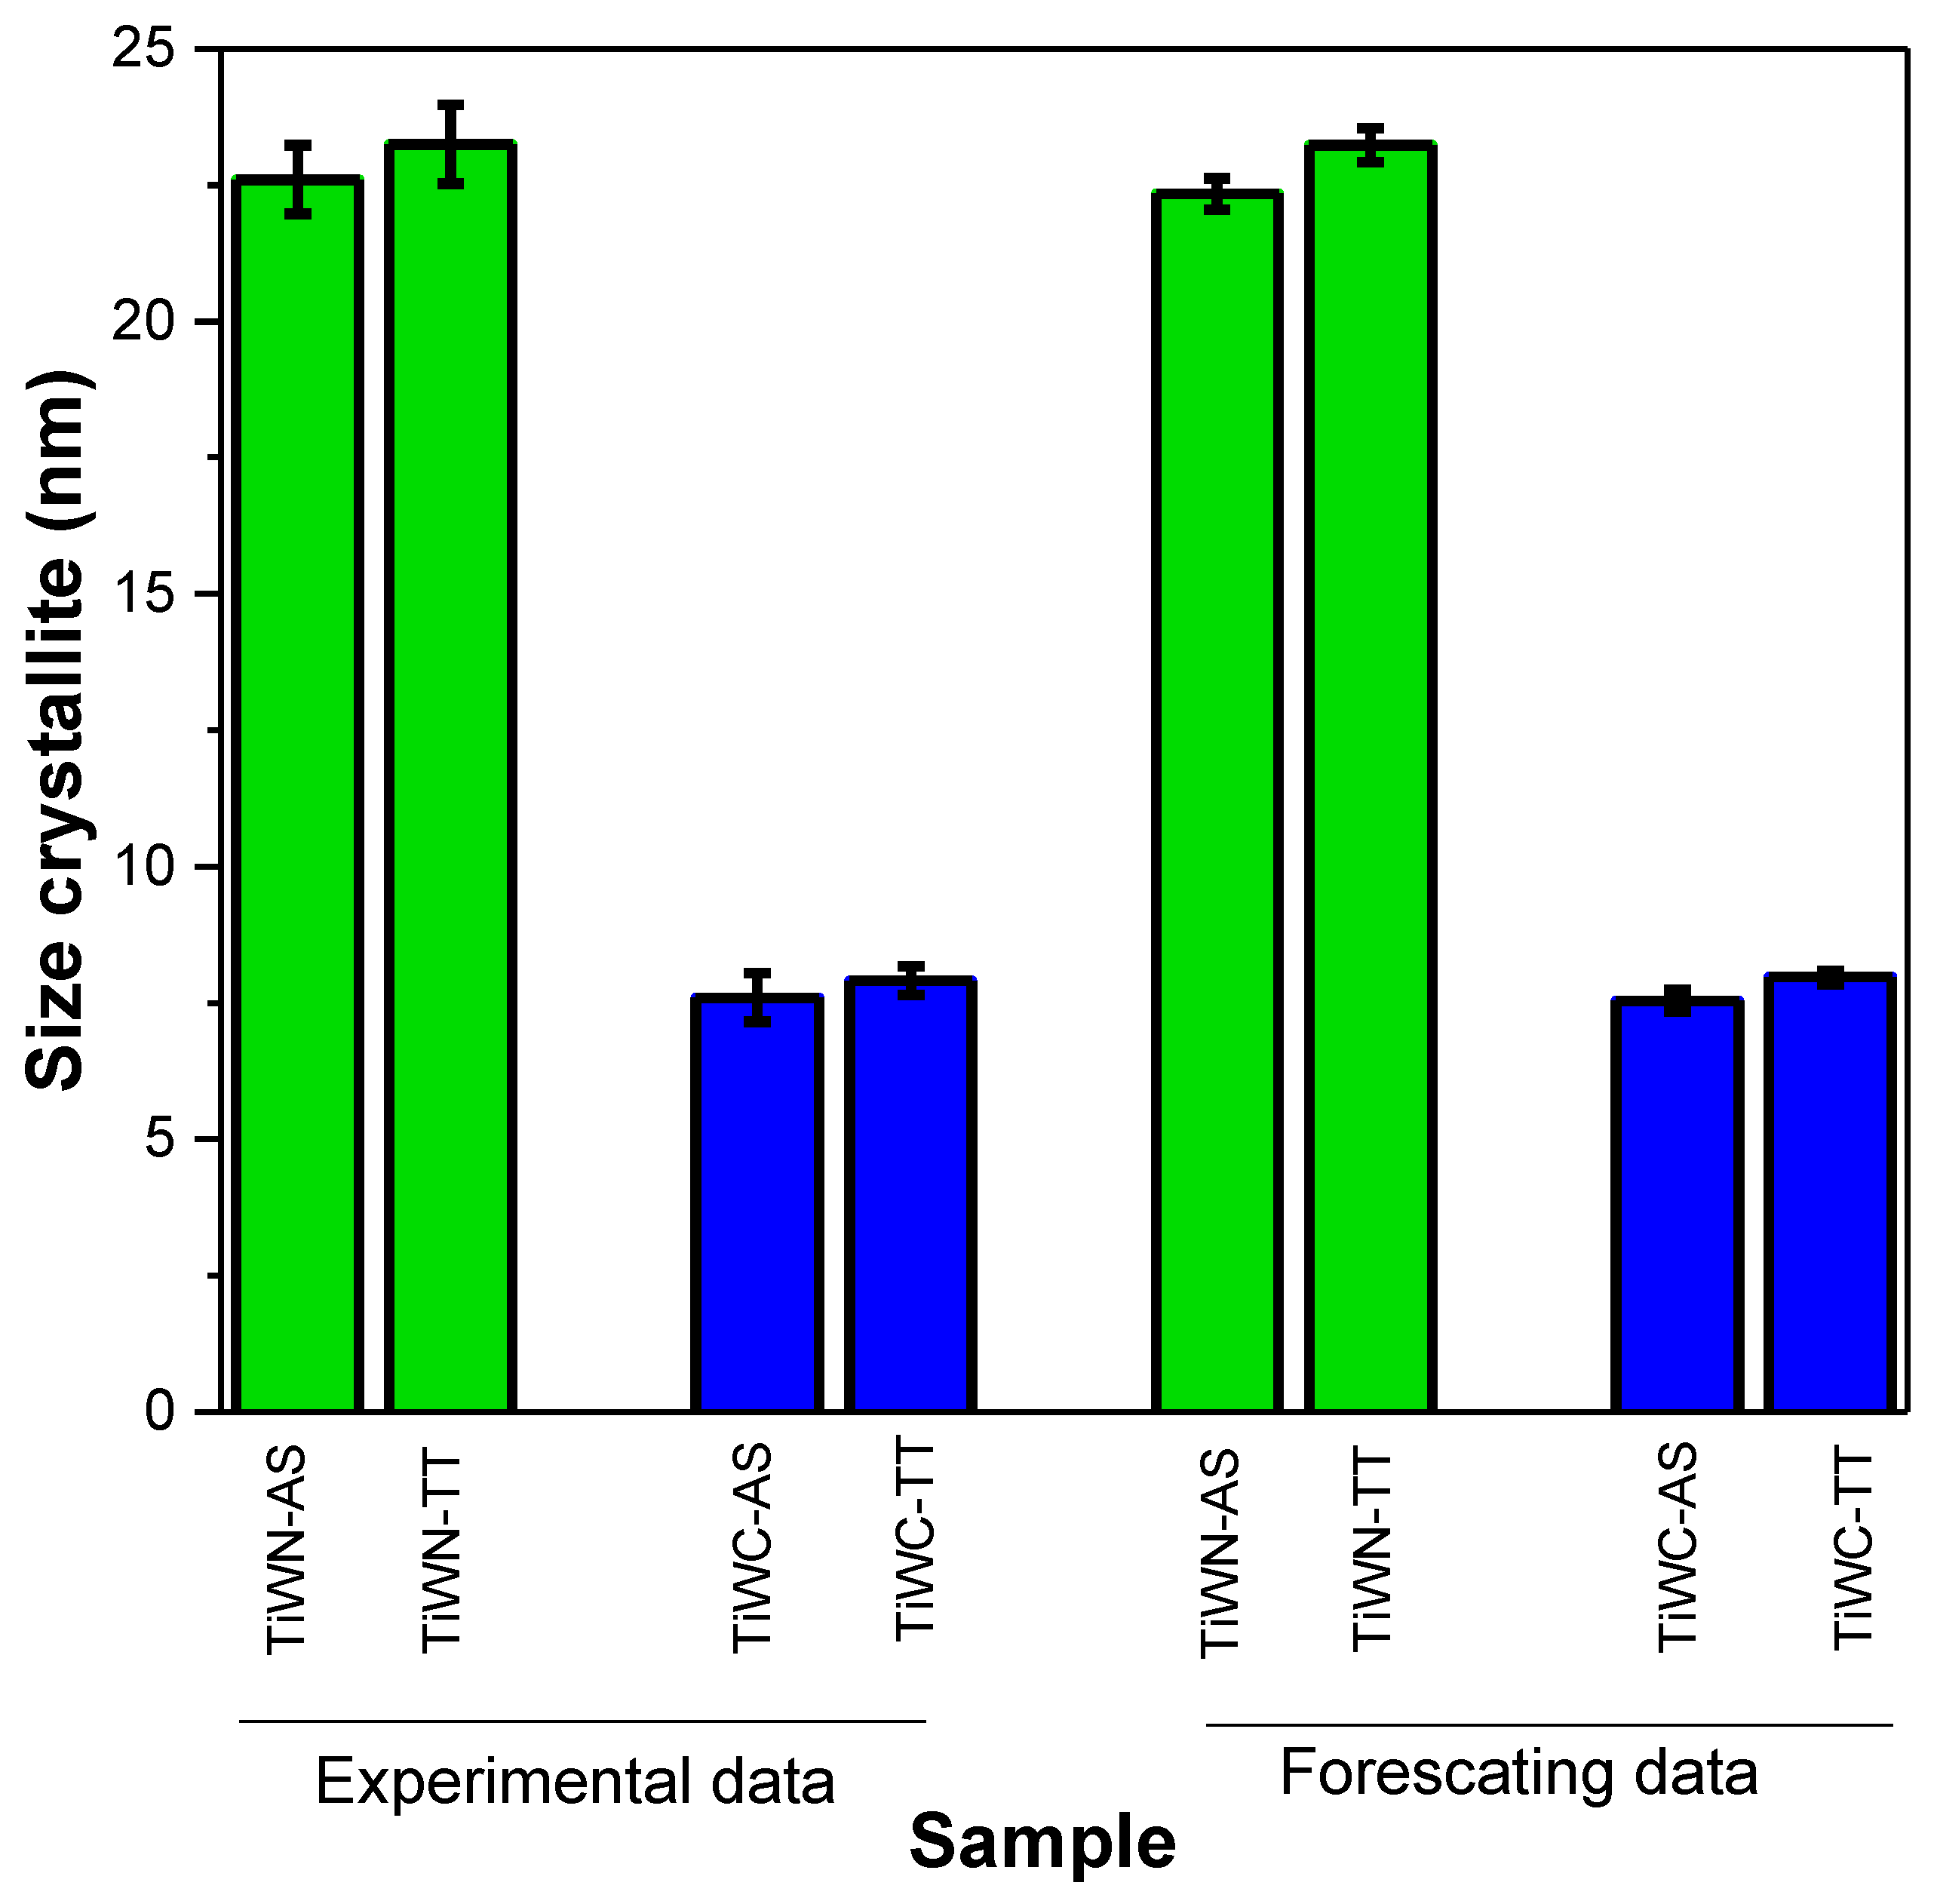
3.1.2. Determination of Crystallite Size by Scherrer Formula

The crystallite size is estimated using the full width at half maximum (FWHM) of the diffraction peaks. The crystallite sizes of the AS and TT samples are calculated using the Scherrer formula [49], written as follows:
D = 0.9 λ β h k l c o s θ B
where β h k l is the FWHM of the peak in radians, θ B is the Bragg angle, and λ is the wavelength of incident X-ray (λ = 1.54 Å).
The micro-strain is the root mean square of variants in the lattice parameters across the sample, expressed by the following Equation (2):
ε = β 4   t a n   θ
where ε is the micro-strain in radians, β is the line broadening at FWHM in radians, and θ is the Bragg angle in degrees. The dislocation density ( δ ) is a measure of the number of dislocations in a unit volume of a crystalline material, i.e., the length of dislocation lines per unit volume (m/m3), written as follows in Equation (3):
δ = 1 D 2
where D is the average crystallite size in nm.
In Table 1, one can observe the crystallite size obtained by the Scherrer formula. The crystallite size increases slightly on sample TiWN from 22.2 to 23.2 nm upon annealing at 500 °C. Also, similar behavior was shown in the sample TiWC, where a slight increase was found from 7.6 to 7.9 nm. Also, a shift to the right of the peaks of both materials that were TT is observed. These results show that differences in crystallite size are like those found by [50]. They described that the grain sizes of Ni-W alloys increased to 6.3 to 9.9 nm after annealing at 500 °C.
This phenomenon is due to crystallinity improvement [51], i.e., the grains were refined through atomic diffusion due to an increase in temperature [52]. The increase in crystallite size is due to the kinetic energy and reconfiguration of the atoms caused by the grain boundary migration and sub-grain growth during annealing [53]. The micro-strain ε also has evolved with a reduction from 4.49 × 10⁻³ to 4.29 × 10⁻³ in sample TiWN after TT.
The TiWC-AS sample showed similar behavior upon annealing at 500 °C. This trend is also found in [54], where ε depends on the crystallite size indicated by the stoichiometry of the coating, which in turn causes volumetric expansion. At low δ, the grain boundary blocks the dislocation displacement. TiWN-AS δ exceeds a critical value; thus, dislocations are absorbed at grain boundaries, causing an increase in the surface dislocation density and the misorientation between adjacent grains [55]. As described by Lakhotkin and Kukushkin [56], δ shows the relationship between the increase in grain size and the reduction of dislocation density.

Crystalline Size Forescated Data by SMA

An SMA of order k, MA (k), is the value of k consecutive observations. According to [29], the calculation of forecasting is expressed as follows (see Equation (4)):
F t + 1 = y t + y t 1 + y t 2 + + y t k + 1 k
where k is the number of terms in the moving average. In an SMA the value of Ft+1 depends on k. An SMA is a particular case of a weighted moving average in which the exact weight is assigned to all the average data.
The crystallite size available in Table 1 can forecast an increase in sample size of n = 12 using the SMA; the results are shown in Table 2. It can be observed that the average crystallite size forecast decreases from 0.14 to 0.07 nm in the TiWN-AS and TiWC-TT samples. In contrast, the TiWC-AS sample has a smaller decrease of 0.02 and 0.06 nm, respectively. This phenomenon can be attributed to the increase in sample size, where the variance was reduced.
Figure 2 shows a column/bar + error plot from experimental and forecasting data using the SMA method. An analysis of experimental data in sample TiWN shows that when the coating is thermally treated, it promotes an increase in the average crystallite size, and their variance is reduced. Sample TiWC shows a similar trend. Now, when the experimental data are forecasted at n = 2, the meaning of each one is similar, exhibiting a closer variance, sample TiWN AS vs. TT data. Sample TiWC also shows similar performance when considering the average means, but it observes that the variance is kept between response variables. The size of the sample has influenced the standard deviation. This characteristic is because the population means of the distribution of sample means are the same as the population means of the distribution being sampled. Therefore, the means of the distribution of the means never change. The standard deviation of the sample means, however, is the population standard deviation from the original distribution divided by the square root of the sample size. Thus, as the sample size increases, the standard deviation of the means decreases, and as the sample size decreases, the standard deviation of the sample means increases. Consequently, larger sample sizes increase power and decrease estimation error [57].

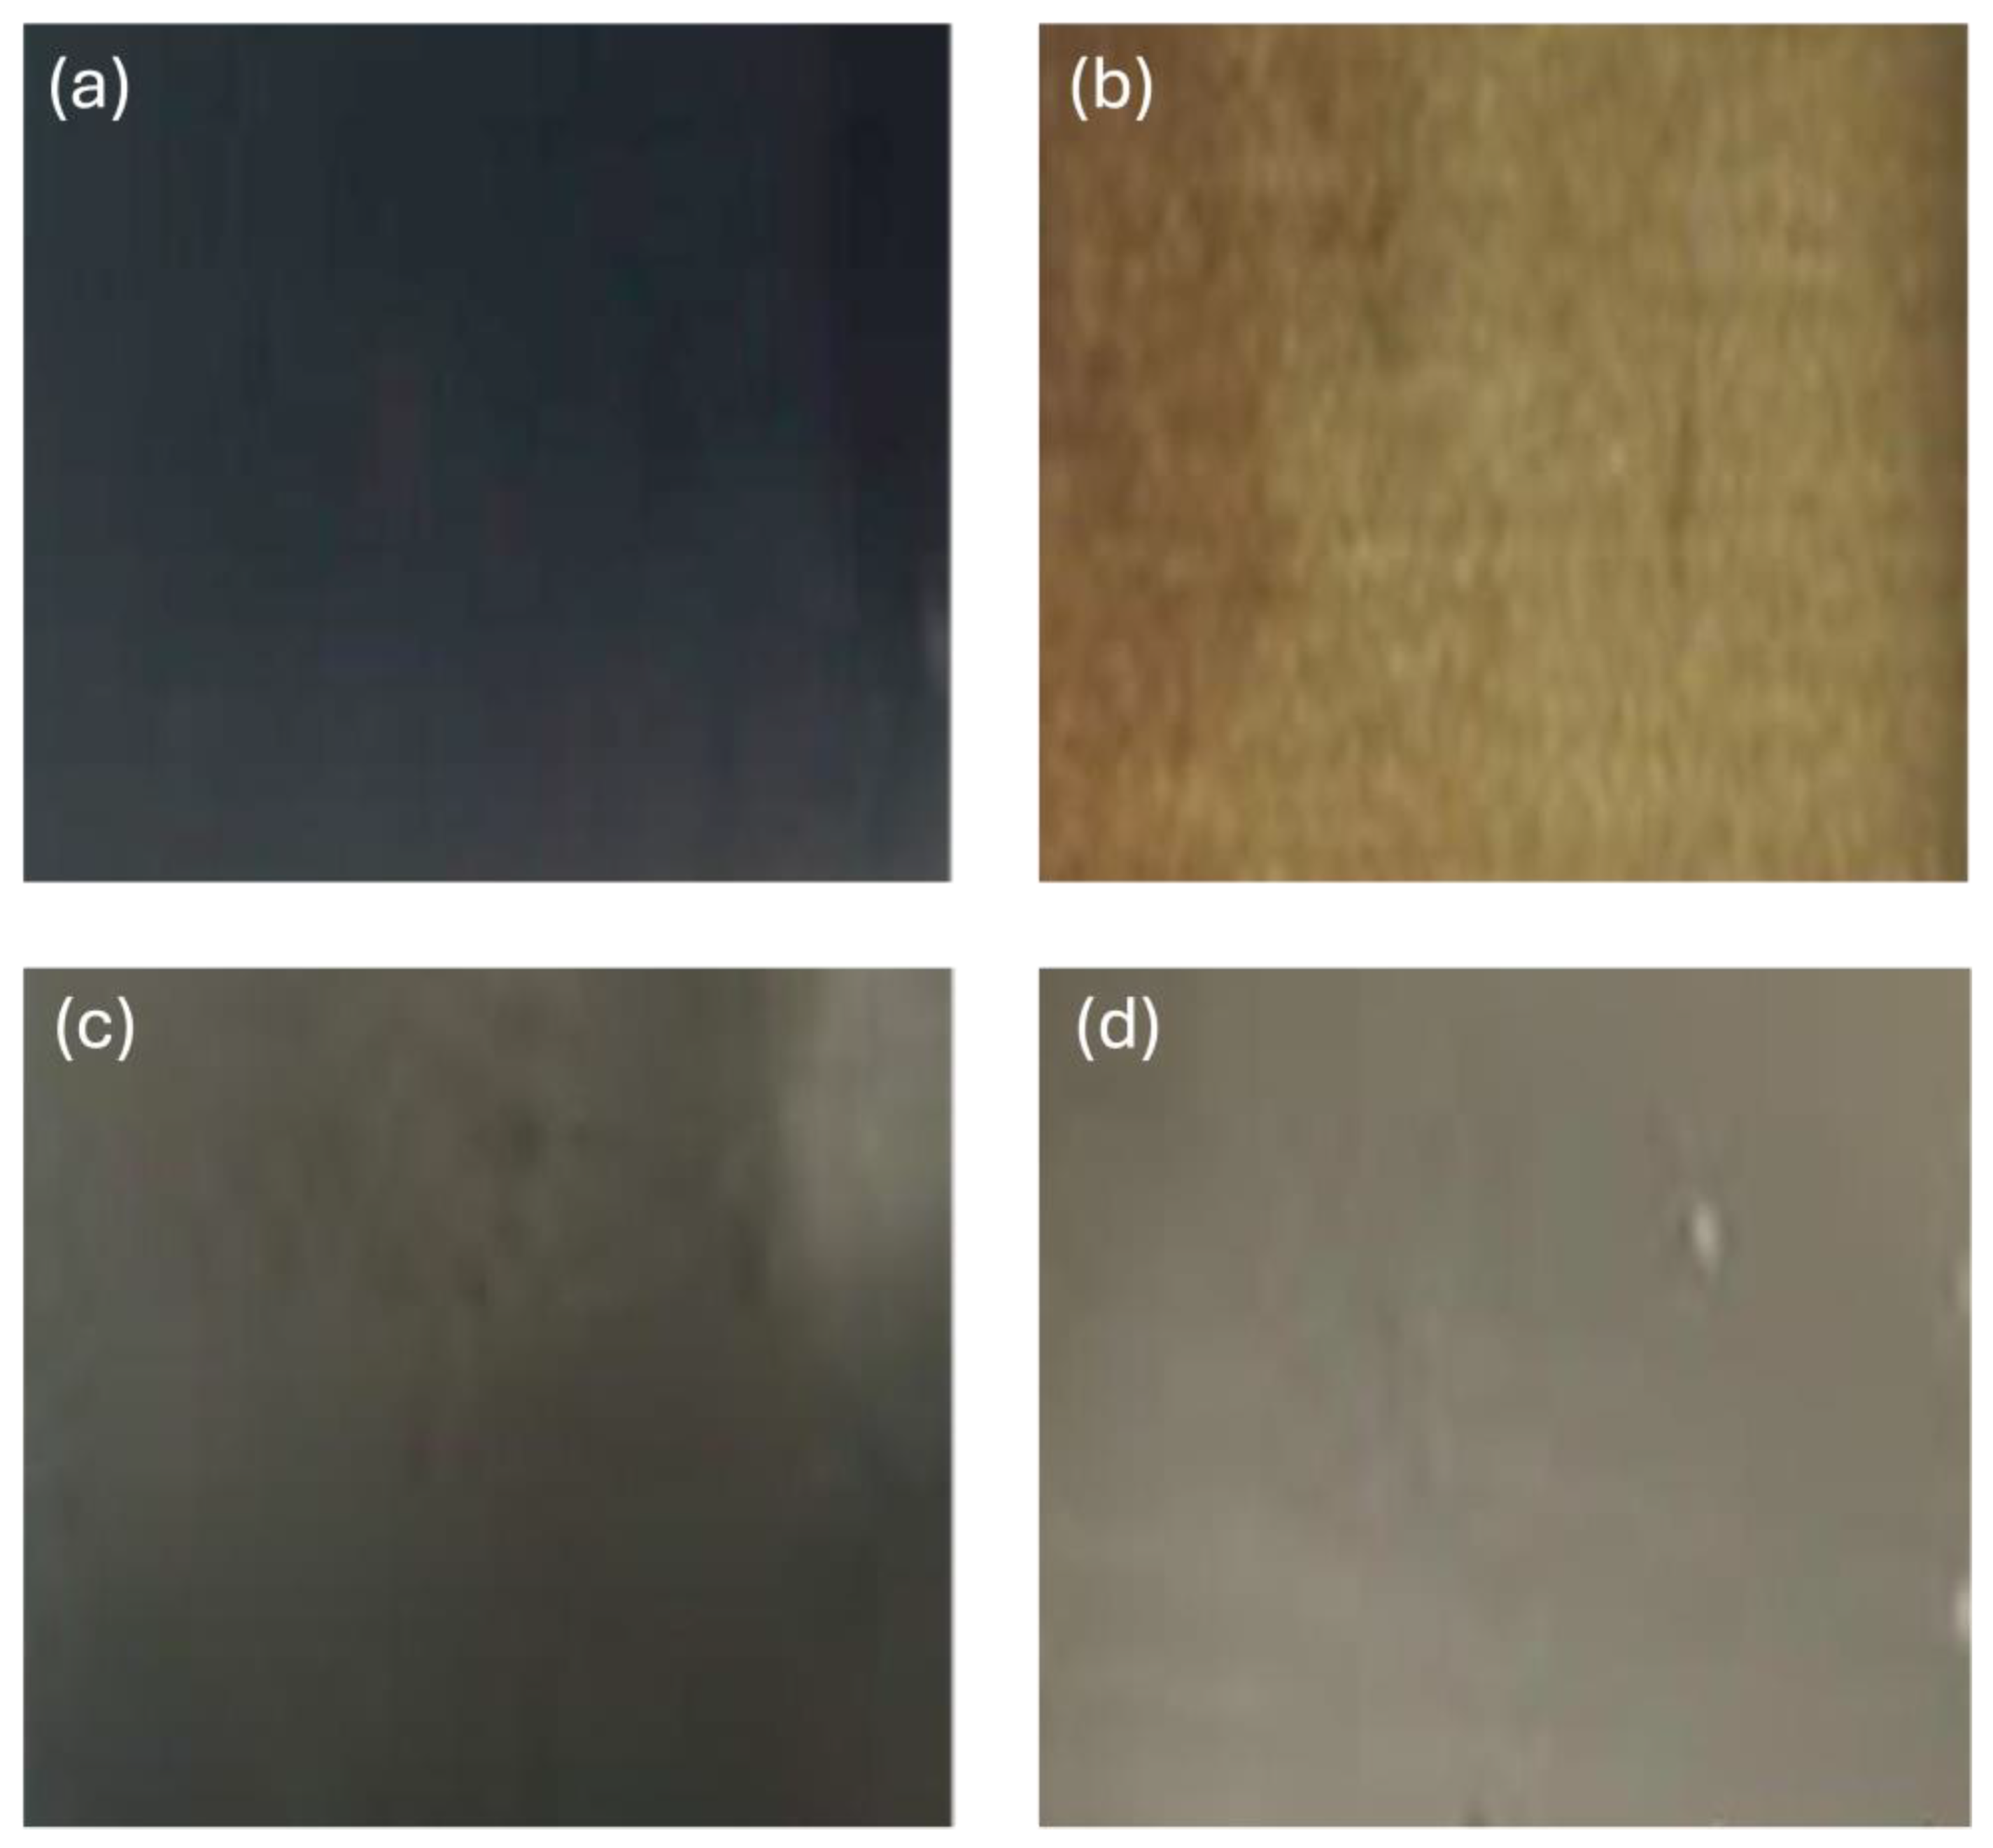
3.1.3. Top View by Optical Microscopy

Figure 3 shows the top view of TiWN and TiWC surfaces observed by optical microscopy before and after TT. The surface color of the TiWN-AS sample is light gray. However, when the sample is thermally treated at 500 °C, the surface color turns goldish. The change in the surface color is due to the enrichment of Ti atoms, indicating the formation of TiN [57]. The goldish color is validated with the EDS analysis corresponding to 4.81 wt.% of Ti before annealing at 500 °C and 10.59 wt.% after. Sample TiWC exhibits a color change from gray to black, indicating an increase in carbon concentration in the regions corresponding to the W enrichment from 61 to 74 wt.% after thermal annealing [58] (see Table 3).

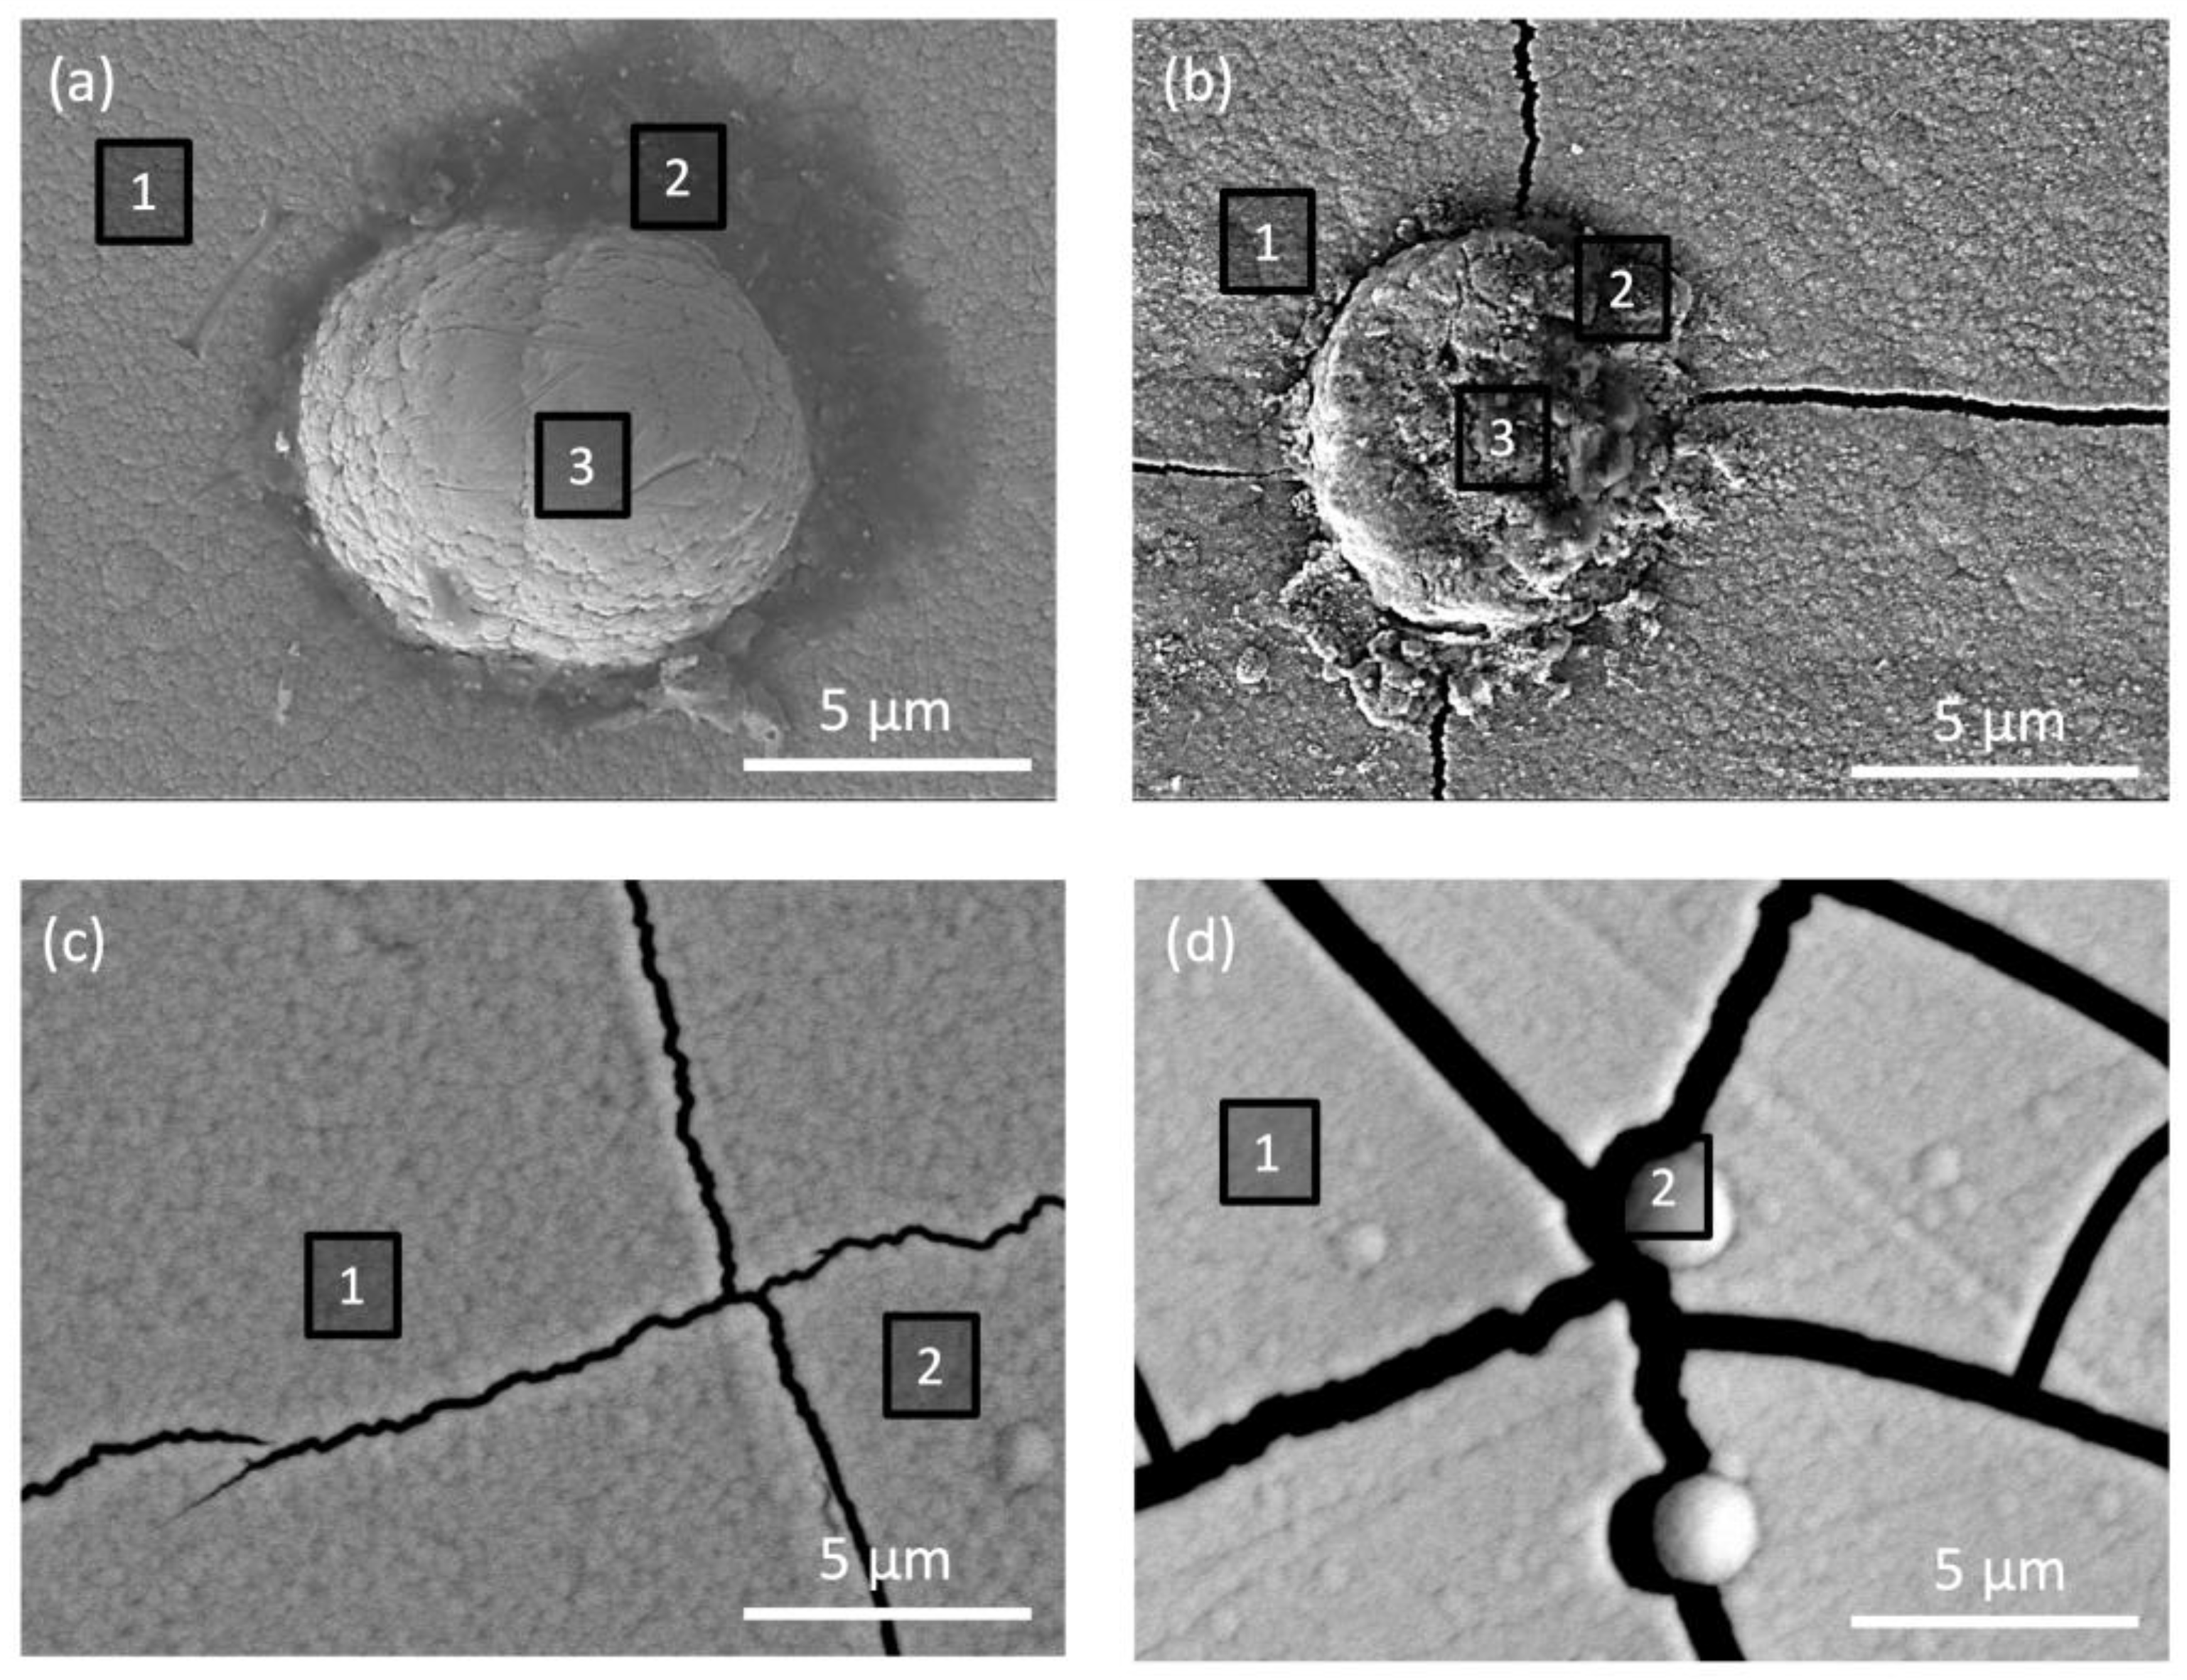
3.1.4. Scanning Electron Microscopy

Figure 4 is the top view of the surface of as-deposited coating (TiWN-AS, TiWC-AS, and those of coatings annealed at 500 °C (TiWN-TT, TiWC-TT samples). Figure 4a shows the TiWN-AS sample as a dense coating with a smooth texture with few surface defects (nodules). However, the thermal treatment in the TiWN-TT sample promotes an irregular surface (cracks and flower-like nodules). The TiWC-AS coating shows defects such as cracks and small nodules (Figure 4c). However, when the coating is subjected to thermal treatment (Figure 4d), it reveals a higher crack density and crack width. It has been reported that cracking along grain boundaries can be attributed to improper heat treatment and material contamination, i.e., carbide precipitation along grain boundaries [59]. The increased crack growth can be associated with a higher release rate of tensile stress with increasing annealing time [60].
The elemental composition revealed 18.9 wt.% of C and 15.3 wt.% of W from 58.56 to 63.53 wt.% on the surface. However, sample TiWC-TT exhibits larger cracks and the apparition of circular nodules while the elemental composition corresponds to a mixture of 4.07 wt.% C, 12.45 wt.% O, 72.60 wt.% W, and 10.88 wt.% Ti. According to [61], smoothness is probably due to an increase in the tungsten concentration. The creation of nodules is generally associated with phase transformations due to TT, grain growth, and grain coarsening [61]. The cracks on samples of TiWN induced by the TT are a consequence of high stress localized at the crack edges. Higher temperatures are still necessary to generate a thermal gradient and stress to reduce the material ductility [62]. In general, considering the optical and electronic microscopy of each sample, one can infer that there exists a significant difference before and after TT.

3.1.5. Chemical Composition by EDS

Table 3 shows the elemental composition expressed as wt.%. In TiWN there is a significant evolution of N, O, and Ti between the AS and the TT samples. Its elemental composition is 3.75 wt.% of C, 10.82 wt.% N, 9.2 wt.% of O, and 75.54 wt.% of W, corresponding to point 1 in Figure 4a and Table 3. Also, it is observed that small nodules–top content wt.% similar (point 2). After thermal treatment, the N content disappears due to diffusion into the substrate [63], and the O and Ti concentrations were drastically modified as well. The selected points show an increase of O from 9.35 to 54.91 wt.%.
Conversely, the TiWC-AS coating has an average composition consisting of 19.06 wt% of C, 15.3 wt.% of N, and from 58.72 to 74.41 wt.% of W. However, in the TiWC-TT sample, the Ti concentration is increased, probably due to the diffusion process after annealing. It is important to mention that the compositions of Ti, W, and N (TiWN-AS) and Ti, W, and C (TiWC-AS) are not stoichiometric; the mismatch can be attributed to atomic diffusion towards the interface with the substrate or towards the coating surface. In general, the surface has an elemental composition corresponding to the mixture composition compound from N (from 6.15 to 15.30 wt.%), O (from 9.20 to 54.91 wt.%), C (from 3.54 to 33.0 wt.%), W (from 29.15 to 78.46 wt.%), and Ti (from 2.07 to 16.24 wt.%) according to elemental composition by EDS (Table 3). Therefore, there exists a significant composition difference between AS and TT samples.

3.2. Statistical Results

3.2.1. Normality Test

Considering the crystallite sizes in Table 2, the data are probably normally distributed because of our meticulous testing process. The data are rigorously tested using the Shapiro–Wilk method, ensuring the accuracy of our findings. The proposed hypotheses (Hi) are as follows:
H0. 
TiWN-AS = TiWN-TT (the crystallite sizes have a normal distribution).
H1. 
TiWN-TT ≠ TiWN-AS; TiWN-AS ≠ TiWN-TT (the crystallite sizes do not have a normal distribution).

3.2.2. Dependent Relationship Paired Sample Test

As shown in Table 2, the crystallite size expressed in nm is executed by a hypothesis test to elucidate if the results have a significant influence using statistical methods. According to Uchiyama et al. [13], the crystallite size has a direct relationship with the TT temperature; the crystallite size increases as temperature increases. For this reason, the hypotheses are expressed as follows (where µ indicates the average crystallite size):
H0. 
µTiWN-TT > µTiWN-AS (The crystallite size is larger).
H1. 
µTiWN-TT ≤ µTiWN-AS (The crystallite size is smaller).
H0. 
µTiWC-TT > µTiWC-AS (The crystallite size is larger).
H1. 
µTiWC-TT ≤ µTiWC-AS (The crystallite size is smaller).

3.2.3. K-W Hypothesis

The theory indicates that thermal treatments induce crystal grain growth. In contrast, it can be inferred the opposite behavior (no changes in shift and intensity of the peaks of the XRD patterns). Thus, the hypotheses should be described as follows:
H0. 
µTiWN-TT = µTiWN-AS (The crystallite size is equal).
H1. 
µTiWN-TT ≠ µTiWN-AS (The crystallite size is different).
H0. 
µTiWC-TT = µTiWC-AS (The crystallite size is equal).
H1. 
µTiWC-TT ≠ µTiWC-AS (The crystallite size is different).

3.2.4. K-W Procedure Step-by-Step

The procedure of the calculation of H and C is shown from Tables S1–S4. The experimental data of the crystallite size are reorganized using new nomenclature: A = TiWN-AS; B = TiWN-TT; C = TiWC-AS, and D = TiWC-TT samples (see Table S1). Later, the statistical treatment was carried out considering the groups A and B (Table S3). Groups C and D follow on Table S4. In all three cases, the critical value (C-value) and H value were calculated; meanwhile, the K-W test parameters are summarized in Table 4.
Table 4 shows a normal distribution relationship with K-W tests, considering the crystal size from all samples. In reference to the normality test, all series have an abnormal distribution (0.034, <0.010, <0.010, and <0.010, for the groups A, B, C, and D, respectively); we suggest that the data are not normally distributed [64]. Now, the relationship between TiWN-AS and TiWN-TT samples exhibits a weak Spearman correlation coefficient of 0.252. However, when the TiWC-AS and TiWC-TT samples are related, the rs has a weak negative coefficient (−0.343), indicating that there is a poor dependence between the variables from negative to positive. This behavior describes the inverse relationship between both responses [65]. Furthermore, the K-W test gives the criteria to determine if H0 is accepted; the condition H < C must be satisfied. Here, H = 42.30 (when N = 48) vs. C = 7.81. Thus, H0 is rejected. A similar behavior exhibited statistical treatment considering two groups, i.e., groups A and B show H = 15.19 and C = 3.84 when N = 12, and groups C and D show H = 12.40 vs. C = 3.84. Then, with a confidence of 95% and a significant error of 5%, it is statistically inferred that all samples contrasted with the K-W test; the crystallite sizes are different between them in the same group as well as individual samples.

4. Conclusions

Thermal treatments (TTs) on TiWN and TiWC coatings were performed at 500 °C under an Ar atmosphere. The phases identified by XRD analysis do not evidence any significant change upon TT. The metal–ceramic systems are quite stable, even secondary phases: W2N, T2N, Ti3C2, and W2C remain stable. It is verified that an increase in temperature promotes the increase in crystallite size. Optical microscopy revealed color change after TT in both coatings. The surface observed by scanning electron microscopy evidenced experimentally the significant change in the crack width after TT. However, the statistical analysis using non-parametric methods on the series data, specifically the crystalline grain size, showed a normal distribution. The Spearman analysis indicated a weak positive rs = 0.252 and negative correlation rs = −0.343, in the relationship analysis between TiWN-AS vs. TiWN-TT and TiWC-AS vs. TiWC-TT, respectively. The T-Student test further confirmed a proportional relationship, suggesting that if the TT temperature increases, so does the crystallite size on the TiWC-TT sample. The K-W test showed that with a confidence level of 95% and a significant error of 5%, it is statistically inferred that all samples contrasted with the K-W test; the values of crystallite sizes are different between them despite the group or individual sample. The statistical methodology proposed in this work is a reference to determine whether in a set of quantitative data, from different groups (treatments), they are equal or different on the response variable when the sample size is small (n < 30).

Supplementary Materials

The following supporting information can be downloaded at: https://www.mdpi.com/article/10.3390/ceramics8010025/s1, Table S1: Sample groups considering the four response variables from A–D; Table S2: Rank for each response variables from A–D; Table S3: Groups considering the A and B response variables; Table S4: Groups considering the two response variables considering C–D.

Author Contributions

Conceptualization, F.G.-S. and A.G.-H.; methodology, A.G.-H.; software, A.G.-H.; validation, F.G.-S., D.I.L.-G.L. and A.G.-H.; formal analysis, D.I.L.-G.L. and R.T.M.; investigation, F.G.-S.; resources, review and editing S.F.O.-M.; data curation, F.G.-S.; writing—original draft preparation, F.G.-S. and A.G.-H.; writing—review and editing, F.G.-S. and A.G.-H.; visualization, D.I.L.-G.L.; supervision, R.B.-G.; project administration, A.G.-H. and R.B.-G.; Funding acquisition, J.E.B. All authors have read and agreed to the published version of the manuscript.

Funding

This research received no external funding.

Institutional Review Board Statement

Not applicable.

Informed Consent Statement

Not applicable.

Data Availability Statement

The data that support the findings of this study are available from the first author.

Acknowledgments

The authors acknowledge to José T. Holguín-Momaca of Centro de Investigación en Materiales Avanzados, S.C. (CIMAV), Chihuahua, Chih., Mexico for support in the heat treatment and characterizations on coatings.

Conflicts of Interest

The authors declare that the research was conducted without any commercial or financial relationships that could potentially create a conflict of interest.

Correction Statement

Due to an error in article production, incorrect references were previously listed in the main text. This information has been updated and this change does not affect the scientific content of the article.

References

  1. Habashi, F. Titanium, physical and chemical properties. In Encyclopedia of metalloproteins; Kretsinger, R.H., Uversky, V.N., Permyakov, E.A., Eds.; Springer: New York, NY, USA, 2021. [Google Scholar] [CrossRef]
  2. Barzan, M. Chapter 3: Titanium. In Smart Materials for Biomedical Applications; Springer Nature: New York, NY, USA, 2022; Available online: https://www.researchgate.net/publication/359355707_chapter_3_Titanium (accessed on 1 January 2024).
  3. Raj, P.P.; Sridhar, R.; Pugazhenthi, R.; Anbuchezhiyan, G.; Ganesh, M. Investigating the mechanical properties of tungsten carbide metal matrix composites with Al 6061. Mater. Today Proc. 2023, in press. [Google Scholar] [CrossRef]
  4. Greger, M.; Čížek, L.; Widomska, M. Structure and mechanical properties of formed tungsten-based materials. J. Mater. Process. Technol. 2004, 157–158, 683–687. [Google Scholar] [CrossRef]
  5. Gren, M.; Fransson, E.; Ångqvist, M.; Erhart, P.; Wahnström, G. Modeling of vibrational and configurational degrees of freedom in hexagonal and cubic tungsten carbide at high temperatures. Phys. Rev. Mater. 2021, 5, 033804. [Google Scholar] [CrossRef]
  6. Ndumia, J.N.; Kang, M.; Lin, J.; Liu, J.; Li, H. Influence of Heat Treatment on the Microstructure and Wear Properties of Arc-Sprayed FeCrAl/Al Coating. Coatings 2022, 12, 374. [Google Scholar] [CrossRef]
  7. Hu, R.; Zhang, J.; Wang, R.; Zhang, C.; Xie, Z.; Zhang, Y.; Li, G.; Lu, X. Effect of heat treatment on microstructure and properties of WC reinforced co-based composite coating on copper. Mater. Lett. 2022, 319, 132262. [Google Scholar] [CrossRef]
  8. Reddy GV, A.; Naveen Kumar, K.; Sattar, S.A.; Shetty, H.D.; Guru Prakash, N.; Imran Jafri, R.; Devaraja, C.; BC, M.; CS, K.; Premkumar, R.; et al. Effect of post annealing on DC magnetron sputtered tungsten oxide (WO3) thin films for smart window applications. Phys. B Condens. Matter 2023, 664, 414996. [Google Scholar] [CrossRef]
  9. Zaid, M.H.M.; Matori, K.A.; Aziz, S.H.A.; Kamari, H.M.; Fen, Y.W.; Yaakob, Y.; Sa’at, N.K.; Gürol, A.; Şakar, E. Effect of heat treatment temperature to the crystal growth and optical performance of Mn3O4 doped α-Zn2SiO4 based glass-ceramics. Results Phys. 2019, 15, 102569. [Google Scholar] [CrossRef]
  10. Dong, W.; Yang, X.; Zhang, Z.; Wang, K.; Liu, B. Microstructural evolution and performance analysis of WC-11Co reinforced iron matrix composites. Mater. Des. 2024, 239, 112753. [Google Scholar] [CrossRef]
  11. Sinojiya, R.J.; Paulachan, P.; Chamasemani, F.F.; Bodlos, R.; Hammer, R.; Zálešák, J.; Reisinger, M.; Scheiber, D.; Keckes, J.; Romaner, L.; et al. Probing the composition dependence of residual stress distribution in tungsten-titanium nanocrystalline thin films. Commun. Mater. 2023, 4, 11. [Google Scholar] [CrossRef]
  12. Zhang, S.; Sun, Y.; Cheng, W.; Chen, Y.; Gu, J. High temperature oxidation behavior of CoCrFeNiMo0.2 high-entropy alloy coatings produced by laser cladding. Mater. Today Commun. 2024, 39, 108639. [Google Scholar] [CrossRef]
  13. Uchiyama, H.; Okada, M.; Ogawa, D.; Kozuka, H. Crystallization and densification of alkoxide-derived titania films: Effect of the amount of H2O in the precursor solutions. J. Asian Ceram. Soc. 2013, 1, 248–256. [Google Scholar] [CrossRef]
  14. He, K.; Chen, N.; Wang, C.; Wei, L.; Chen, J. Method for determining crystal grain size by X-Ray Diffraction. Cryst. Res. Technol. 2018, 53, 1700157. [Google Scholar] [CrossRef]
  15. Taghipour, M.; Eslami, A.; Salehi, M.; Bahrami, A. An investigation on anti-coking behavior of gas phase aluminide coatings applied on a high performance micro alloyed (HP-MA) steel. Surf. Coat. Technol. 2020, 388, 125607. [Google Scholar] [CrossRef]
  16. Lee, J.H.; Kim, S.Y.; Park, J.S. Influence of Heat Treatment on the Microstructure and Properties of Copper Coatings Deposited by D.C. Sputtering. J. Alloys Compd. 2021, 867, 158778. [Google Scholar] [CrossRef]
  17. Martínez, R.A.; García, L.F. Comparative Analysis of Experimental and Statistical Methods in Evaluating Niobium Coatings Applied by D.C. Sputtering. Thin Solid Film. 2018, 654, 85–92. [Google Scholar] [CrossRef]
  18. Zhang, Y.; Li, C.; Wang, H. Impact of Heat Treatment on the Adhesion of Ceramic Coatings Deposited by D.C. Sputtering. Ceram. Int. 2022, 48, 3521–3530. [Google Scholar] [CrossRef]
  19. Field, A. Discovering Statistics Using IBM SPSS Statistics, 5th ed.; Sage Publications: Washington, DC, USA, 2018. [Google Scholar]
  20. Bickman, L.; Rog, D.J. The SAGE Handbook of Applied Social Research Methods, 2nd ed.; Sage Publications: Washington, DC, USA, 2008; ISBN 9781412950312. [Google Scholar] [CrossRef]
  21. Rosenthal, R.; Rosnow, R.L. Essentials of Behavioral Research: Methods and Data Analysis, 3rd ed.; McGraw-Hill: New York, NY, USA, 2008. [Google Scholar] [CrossRef]
  22. Hedges, L.V.; Olkin, I. Statistical Methods for Meta-Analysis; Academic Press: Cambridge, MA, USA, 1985; ISBN 978-0-08-057065-5. [Google Scholar] [CrossRef]
  23. Lai, K.; Kelley, K. Accuracy in parameter estimation for ANCOVA and ANOVA contrasts: Sample size planning via narrow confidence intervals. Br. J. Math. Stat. Psychol. 2011, 65, 350–370. [Google Scholar] [CrossRef]
  24. Grigoriev, S.N.; Nikitin, N.; Yanushevich, O.; Kriheli, N.; Kramar, O.; Khmyrov, R.; Idarmachev, I.; Peretyagin, P. Experimental and Statistical Analysis of the Effect of Heat Treatment on Surface Roughness and Mechanical Properties of Thin-Walled Samples Obtained by Selective Laser Melting from the Material AlSi10Mg. Materials 2023, 16, 7326. [Google Scholar] [CrossRef]
  25. Forthofer, R.N.; Lee, E.S.; Hernández, M. 9-Nonparametric Tests. In Biostatistics, 2nd ed.; Forthofer, R.N., Lee, E.S., Hernández, M., Eds.; Academic Press: Cambridge, MA, USA, 2007; pp. 249–268. ISBN 9780123694928. [Google Scholar] [CrossRef]
  26. Sharma, S.K.; Sharma, V. Comparative Analysis of Machine Learning Techniques in Sale Forecasting. Int. J. Comput. Appl. 2012, 53, 51–54. [Google Scholar] [CrossRef]
  27. Ahad, N.A.; Yin, T.S.; Abdul, R.O.; Che, R.Y. Sensitivity of normality tests to non-normal data. Sain Malays. 2011, 40, 637–641. [Google Scholar]
  28. Kolmogorov, A. Foundations of the Theory of Probability, 2nd ed.; Chelsea: New York, NY, USA, 1956. [Google Scholar]
  29. Smirnov, S. Beschreibung einer neuen Acartia-Art aus dem Japanischen Meer nebst einiger Bemerkungen uber die Untergattung Euacartia Steuer. Zool. Anz. 1936, 114, 87–92. [Google Scholar]
  30. Anderson, T.W.; Darling, D.A. Asymptotic theory of certain “goodness-of-fit” criteria based on stochastic processes. Ann. Math. Stat. 1952, 23, 193–212. [Google Scholar] [CrossRef]
  31. Anderson, T.W. On the distribution of the two-sample Cramer-von Mises criterion. Ann. Math. Stat. 1962, 33, 1148–1169. [Google Scholar] [CrossRef]
  32. Shapiro, S.S.; Wilk, M.B. An analysis of variance test for normality. Biometrika 1965, 52, 591–611. [Google Scholar] [CrossRef]
  33. Razali, N.M.; Yap, B. Power Comparisons of Shapiro-Wilk, Kolmogorov-Smirnov, Lilliefors and Anderson-Darling Tests. J. Stat. Model. Anal. 2011, 2, 21–33. [Google Scholar]
  34. Walpole, E.R.; Raymond, H.M.; Sharon, L.M.; Kevin, Y. Probability and statistics for engineers and scientists. In Nonparametric Statistics; Prentice Hall: Hoboken, NJ, USA, 2007; Chapter 16; p. 684. [Google Scholar]
  35. Nwobi, F.; Akanno, F.C. Power comparison of ANOVA and Kruskal–Wallis tests when error assumptions are violated. Adv. Methodol. Stat. Metod. Zv. 2021, 18, 53–71. [Google Scholar] [CrossRef]
  36. Lachenbruch, P.A.; Clements, P.J. ANOVA, Kruskal-Wallis normal scores and unequal variance. Commun. Stat.-Theory Methods 1991, 20, 107–126. [Google Scholar] [CrossRef]
  37. Fan, C.; Zhang, D.; Cun-Hui, Z. On sample size of the Kruskal-Wallis test with application to a Mouse Peritoneal Cavity Study. Biometrics 2011, 67, 213–224. [Google Scholar] [CrossRef]
  38. MacFarland, T.W.; Yates, J.M. Kruskal-Wallis H test of One-way analysis of Variance (ANOVA) by Ranks. In Introduction to Nonparametric Statistics for Biological Sciences Using R; Springer: Cham, Switzerland, 2016. [Google Scholar] [CrossRef]
  39. Ostertagová, E.; Ostertag, O.; Kováč, J. 2014 Methodology and application of the Kruskal-Wallis test. Appl. Mech. Mater. 2014, 611, 115–120. [Google Scholar] [CrossRef]
  40. Ramachandran, K.M.; Tsolcos, C.P. Chapter 12—Nonparametric test. In Mathematical Statistics with Applications in R, 2nd ed.; Academic Press: Cambridge, MA, USA, 2015; pp. 589–637. ISBN 9780124171138. [Google Scholar] [CrossRef]
  41. Puth, M.T.; Neuhäuser, M.; Ruxton, G.D. Effective use of Spearman’s and Kendall’s correlation coefficients for association between two measured traits. Anim. Behav. 2015, 102, 77–84. [Google Scholar] [CrossRef]
  42. Kumar, A.J.; Abirami, S. Aspect-based opinion ranking framework for product reviews using a Spearman’s rank correlation coefficient method. Inf. Sci. 2018, 460–461, 23–41. [Google Scholar] [CrossRef]
  43. Al-Hameed, A.A.K. Spearman’s correlation coefficient in statistical analysis. Int. J. Nonlinear Anal. Appl. 2022, 13, 3249–3255. [Google Scholar] [CrossRef]
  44. Motulsky, H.J. Nonparametric Tests with Small and Large Samples. GraphPad Statistics Guide. 2016. Available online: https://www.graphpad.com/guides/prism/latest/statistics/choosing_parametric_vs__nonpar.htm (accessed on 24 April 2024).
  45. Hansun, S.A. New approach of moving average method in time series analysis. In Proceedings of the Conference on New Media Studies (CoNMedia), Tangerang, Indonesia, 27–28 November 2013; pp. 1–4. [Google Scholar] [CrossRef]
  46. González-Hernández, A.; Morales-Cepeda, A.B.; Flores, M.M.; Caicedo, J.C.; Aperador, W.; César, A. Electrochemical Properties of TiWN/TiWC Multilayer Coatings Deposited by RF-Magnetron Sputtering on AISI 1060. Coatings 2021, 11, 797. [Google Scholar] [CrossRef]
  47. Tong, H.; Kou, Z.; Zhao, M.; Zhuang, D.; Wang, C.; Li, Y.; Wang, H.; Jia, M. Optimization of the photoelectric performances of Mg and Al co-doped ZnO films. Appl. Surf. Sci. 2023, 638, 158007. [Google Scholar] [CrossRef]
  48. Aryanto, D.; Sudiro, T.; Wismogroho, A.S. Correlations between Structural and Hardness of Fe-50%Al Coating Prepared by Mechanical Alloying. Piston J. Tech. Eng. 2018, 1, 289674. [Google Scholar] [CrossRef]
  49. Erdoğan, N.N.; Başyiğit, A.B. An approach on determining micro-strain and crystallite size values of thermal spray barrier coated Inconel 601 super alloy. Int. J. Mater. Eng. Technol. 2023, 6, 21–25. [Google Scholar]
  50. Kung-Hsu, H.; Yun-Feng, C.; Sha-Ming, C.; Chia-Hua, C. The heat treatment effect on the structure and mechanical properties of electrodeposited nano grain size Ni–W alloy coatings. Thin Solid Film. 2010, 518, 7535–7540. [Google Scholar] [CrossRef]
  51. Acosta-Humánez, F.; Almanza, O.; Vargas-Hernández, C. Effect of sintering temperature on the structure and mean crystallite size of Zn1−xCoxO (x = 0.01–0.05) samples. Superf. Y Vacío 2014, 27, 43–48. [Google Scholar]
  52. Guo, D.W.Y.; Fernandez, R.; Zhao, L.; Jodoin, B. Cold spray for production of in-situ nanocrystallite MCrAlY coatings—Part I: Process analysis and microstructure characterization. Surf. Coat. Technol. 2021, 409, 126854. [Google Scholar] [CrossRef]
  53. Alaneme, K.; Okotete, E.A. Recrystallization mechanisms and microstructure development in emerging metallic materials: A review. J. Sci. Adv. Mater. Devices 2019, 4, 19–33. [Google Scholar] [CrossRef]
  54. Dhanasekaran, V.; Mahalingan, T.; Chamdramoha, R. Post heat treatment effect on electrochemically synthesized CuO thin films. ECS Trans. 2013, 45, 73–78. [Google Scholar] [CrossRef]
  55. Piao, Y.; Le, K.C. Thermodynamic theory of dislocation/grain boundary interaction. Contin. Mech. Thermodyn. 2022, 34, 763–780. [Google Scholar] [CrossRef]
  56. Lakhotkin, Y.; Kukushkin, R. Growth mechanism and structure peculiarities of tungsten-rhenium coatings. J. De Phys. IV Proc. 1991, 2, C2-729–C2-733. [Google Scholar] [CrossRef]
  57. VanVoorhis, C.R.W.; Morgan, B.L. Understanding Power and Rules of Thumb for Determining Sample Sizes. Tutor. Quant. Methods Psychol. 2007, 3, 43–50. [Google Scholar] [CrossRef]
  58. Pitthan, E.; Tran, T.T.; Moldarev, D.; Rubel, M.; Rimetzhofer, D.P. Influence of thermal annealing and of the substrate on sputter-deposited thin films from EUROFER97 on tungsten. Nucl. Mater. Energy 2023, 35, 101449. [Google Scholar] [CrossRef]
  59. Zong, N.; Jing, T.; Liu, Y. Influence of internal cracking on carbide precipitation in continuous casting bloom induced by soft reduction technology and the resulting segregated band in hot-rolled wire rods. Arch. Metall. Mater. 2022, 67, 73–82. [Google Scholar] [CrossRef]
  60. Kusmono, B.C.; Salim, U.A. Effects of cold rolling and annealing time of fatigue Resistencia of AA5052 Aluminum alloy. IJE Trans. C Asp. 2021, 34, 2189–2197. [Google Scholar] [CrossRef]
  61. Mukhopadhyay, A.; Barman, T.K.; Prasanta, S. Co-deposition of W and Mo in electroless Ni–B coating and its effect on the surface morphology, structure, and tribological behavior. J. Mater. Des. Appl. 2021, 235, 149–161. [Google Scholar] [CrossRef]
  62. Qian, D.; Xue, J.; Zhang, A.; Li, Y.; Tamura, N.; Song, Z.; Chen, K. Statistical study of ductility-dip cracking induced plastic deformation in polycrystalline laser 3D printed Ni-based superalloy. Sci. Rep. 2017, 7, 2859. [Google Scholar] [CrossRef]
  63. Hubicki, R.; Richert, M.; Wiewióra, M. An Experimental Study of Temperature Effect on Properties of Nitride Layers on X37CrMoV51 Tool Steel Used in Extrusion Aluminum Industry. Materials 2020, 13, 2311. [Google Scholar] [CrossRef]
  64. Kim, T.K.; Park, J.H. More about the basic assumptions of t-test: Normality and sample size. Statistical Round. Korean J. Anesthesiol. 2019, 72, 331–335. [Google Scholar] [CrossRef] [PubMed]
  65. Chung, H.J.; Liu, Q.; Lee, L.; Wei, D. Relationship between the structure, physicochemical properties and in vitro digestibility of rice starches with different amylose contents. Food Hydrocoll. 2011, 25, 968–975. [Google Scholar] [CrossRef]
Figure 1. XRD pattern of as-deposited (TiWN-AS, TiWC-AS), and thermally treated samples (TiWN-TT, TiWC-TT).
Ceramics 08 00025 g001
Figure 2. Graphical comparison of experimental vs. forecasted data in crystallite size by SMA.
Ceramics 08 00025 g002
Figure 3. Top-view of the color surface of samples TiWN and TiWC: (a,c) as sputtered; (b,d) after thermal treatment.
Ceramics 08 00025 g003
Figure 4. SEM micrograph of the surface (a,c) coating TiWN-AS, TiWC-AS coating; (b,d) TiWN-TT and TiWC-TT, respectively. The numbers in each micrograph indicate the zone where EDS analyses were realized, as shown in Table 3.
Ceramics 08 00025 g004
Table 1. Crystallite size, micro-strain, and dislocation density.
MaterialPeak Intensity 2θ (°)FMHW β
(°)
Crystallite Size
(nm)
Microstrain
(ε)
Dislocation Density (δ)
TiWN-AS42.560.4009222.20 ± 0.634.49 × 10−32.03 × 10⁻³
TiWN-TT42.540.3828723.25 ± 0.724.29 × 10−31.85 × 10⁻³
TiWC-AS36.881.150497.60 ± 0.451.51 × 10−21.73 × 10⁻³
TiWC-TT37.221.105977.91 ± 0.261.43 × 10−21.60 × 10⁻³
Table 2. Crystallite size forecasted by SMA.
Sample/DataExperimental DataForecasting DataStatistic Parameter
123456789101112Av.S.D.S.E.
TiWN-AS21.692222.9122.222.3722.4922.3622.4122.4222.3922.4122.4122.340.290.08
TiWN-TT23.7222.4123.6123.2523.0923.3223.2223.2123.2523.2323.2323.2423.230.310.09
TiWC-AS7.638.027.137.597.597.447.547.527.57.527.527.517.540.200.06
TiWC-TT7.628.038.17.918.018.017.98887.9987.997.970.120.03
Table 3. Elemental composition (wt.% by EDS).
Figure/
Sample
Point SelectedCNOWTi
(a) TiWN-AS13.7510.829.2075.540.69
23.5411.9511.0970.013.41
3--18.3567.7513.9
(b) TiWN-TT 133.0-29.3531.396.26
2--54.9129.1515.94
3--9.3574.4116.24
(c) TiWC-AS1-15.312.7463.538.43
219.06-20.1558.722.07
(d) TiWC-TT 14.07-12.4572.610.88
2-6.1512.4078.462.99
Table 4. Statistical parameters of normality distribution, relationship dependence, and K-W tests.
SampleNormality TestDependent (rs)K-W
Shapiro–Wilk (p-Value)Spearman Rank (p-Value)H-Value (Bilateral)C-Value
N = 48N = 12N = 48N = 12
TiWN-AS0.0340.25242.3015.197.813.84
TiWN-TT0.010
TiWC-AS0.010−0.34312.40
TiWC-TT0.010
Significance, α = 5%.
Disclaimer/Publisher’s Note: The statements, opinions and data contained in all publications are solely those of the individual author(s) and contributor(s) and not of MDPI and/or the editor(s). MDPI and/or the editor(s) disclaim responsibility for any injury to people or property resulting from any ideas, methods, instructions or products referred to in the content.

