Article

Features of Dielectric Properties of 0.20BiScO3·0.45PbTiO3·0.35PbMg1/3Nb2/3O3 Samples Obtained by the Melt-Hardening Method

Department of Radio Engineering, Electronics, and Telecommunications, S. Seifullin Kazakh Agrotechnical Research University, Zhenis Ave., 62, Astana 010011, Kazakhstan
*
Authors to whom correspondence should be addressed.
Ceramics 2024, 7(4), 1401-1412; https://doi.org/10.3390/ceramics7040091
Submission received: 18 September 2024 / Revised: 25 September 2024 / Accepted: 30 September 2024 / Published: 4 October 2024

Abstract

:
This paper studies the structural parameters and electrophysical properties (dielectric and piezo electric, as well as currents of thermostimulated depolarization) of samples of composition 0.20BiScO3·0.45PbTiO3·0.35PbMg1/3Nb2/3O3 (or in short 0.20BS·0.45PT·0.35PMN) obtained by ceramic and melt-hardening methods of synthesis. In the ceramic method, the samples were obtained from the starting oxides by two-stage firing. In the melt method, amorphous precursors were first obtained from heat-treated and non-heat-treated starting oxide mixtures by melting and subsequent quenching under sharply gradient temperature conditions. Samples were obtained after grinding, pressing, and thermal annealing of the synthesized precursors, and four types of samples differing in size and shape of the intermediate precursor particles (crystallites) were obtained. The X-ray phase analysis showed that the predominant phase in the studied samples is the perovskite phase; in both types of samples, up to 5 wt.% of impurity phase with pyrochlore structure was also present. The samples of 0.20BS·0.45PT·0.35PMN exhibit dielectric properties characteristic of relaxor ferroelectrics, and the polarized samples exhibit a pronounced piezo effect with a piezo modulus value of d33~200 pC/N. A comparative analysis of the properties of the samples obtained by different methods has been carried out. The essential advantage of the melt method is that its use allows obtaining varieties of four kinds of ferroelectric relaxors and reduces the time of synthesis of samples by 2–3 times.

1. Introduction

Many ferroelectrics are promising materials for creating energy converters [1,2]. Lead zirconate titanate (PZT) ferroelectric with perovskite structure (and its modifications) is usually used as a piezoceramic in piezoelectric generators (PEGs) due to the structural stability of this material, which can provide good piezoelectric properties [3,4,5,6,7,8].
However, for wider practical applications of piezoceramics, new ferroelectric materials with relaxor properties are needed [9]. Relaxor ferroelectrics can have giant electromechanical properties due to the unusual behavior of polar nanorods (PNRs) [10,11,12]. Relaxor ferroelectrics are becoming important materials for the development of dielectric capacitors with high energy storage and power density [13,14,15].
As a rule, high characteristics of the electrophysical properties of such solid solutions appear for compositions lying near the morphotropic phase region (MPR), where there is a change in the symmetry of solid solutions when their composition is changed. Thus, for the compositions of PT-PMN (the composition PbTiO3·PbMg1/3Nb2/3O3 is abbreviated as PT-PMN) and PT-PZT (the composition PbTiO3∙Pb(Zr, Ti)O3 is abbreviated as PT-PZT) systems lying near the MPR, the piezo modulus d33 reaches record high values (up to 3500 nKl/N) [16,17]).
Such promising solid solutions with the MPR include relatively new solid solutions of the ternary system (1−2x)BiScO3∙(2−y)xPbTiO3∙xyPbMg1/3Nb2/3O3 or in short ((1−2x)BS∙(2−y)xPT∙xyPMN) [18,19,20,21,22,23,24]. For the section of this system with y = 1.0, the MPR lies around x = 0.42. Near this composition, the samples are characterized by a high piezo modulus of d33 ≈ 500 pC/N, and a uniquely low goodness of Q~15 [19,20]. Reducing the mechanical goodness of thickness vibrations of piezoceramic materials used in ultrasonic (US) flaw detection, thickness measurement, medical US diagnostic equipment, hydroacoustics, etc., increases the sensitivity of the equipment and its resolving power. In [25], the synthesis and study of the electrophysical properties of samples of section (1−x)[0.8PbMg1/3Nb2/3O3·0.2BiScO3]·x[0.8PbTiO3·0.2BiScO3] of the BS-PT-PMN ternary system are reported.
These compositions were synthesized by the traditional ceramic method. However, the possibilities of improving the properties of segmental and piezoelectric ceramics through complications and optimal choice of sintering conditions of samples are practically exhausted. Therefore, it is relevant to use other synthesis methods than solid-phase synthesis.
Among the various methods of synthesis of materials, technologies for obtaining polycrystals by the melt method are already known, which allow for carrying out synthesis in less time and improving their properties by modifying their structure [26]. For example, it was possible to reduce the synthesis time by a factor of two, and significantly increase the material density and current density in superconducting Bi-containing ceramics by using the melt-hardening method [27,28]. In view of the above, it is of interest to investigate the structural and electrophysical properties of piezoceramics of composition (1−x)(0.8PbMg1/3Nb2/3O3·0.2BiScO3)·x(0.8PbTiO3·0.2BiScO3 with x = 0.5625 of the BS-PT-PMN ternary system.
The dielectric properties of samples of (1−x)[0.8PbMg1/3Nb2/3O3·0.2BiScO3]·x [0.8PbTiO3·0.2BiScO3] with x = 0.5625 (composition 0.20BiScO3·0.45PbTiO3·0.35PbMg1/3Nb2/3O3) synthesized using the melt-hardening method including melting and quenching of the melt were investigated, with an evaluation of the efficiency of this method for obtaining piezoceramics. The investigated composition x = 0.5625 was chosen because of its proximity to the MPR (boundary), and the possibility of its conversion by applying a constant electric field from the ferroelectric-relaxor state to the ferroelectric state with a high value of piezo modulus d33 [24,25].

2. Methods of Obtaining and Investigating the Samples

Obtaining of Samples

Samples of composition 0.20BiScO3·0.45PbTiO3·0.35PbMg1/3Nb2/3O3 (denoted as 0.20BS·0.45PT·0.35PMN) were synthesized by ceramic technology (type 1) and the melt-hardening method (type 2). Oxides (Bi2O3, Sc2O3, Pb3O4, TiO2, MgO, Nb2O5) of OSF grade containing at least 99% of the basic substance were used as starting reagents. To prepare the charge, the starting reactants were taken in stoichiometric ratios and ground in a planetary mill until homogeneous. Then, the mixture was pressed into tablets and fired in a muffle furnace at T = 1133 K for t = 4 h. In the ceramic synthesis method, the tablet obtained after firing was re-milled (with the addition of ~1 wt.% aqueous polyvinyl alcohol solution) and pressed at a pressure of 15 MPa. Then, the tablets were sintered in a furnace at T = 1473 K for t = 2 h. In the melt method, amorphous precursors were first obtained from heat-treated (at T = 1133 K for t = 2 h) and nonthermally treated mixtures of the initial oxides by melting and quenching of the melt. Heat-treated and non-heat-treated oxide mixtures in the form of tablets were loaded into a furnace heated to 1623 K on a platinum base. The melting of the samples took place within 30 s, and the formed melt droplets fell through the gentle opening of the furnace to the quenching (cooling) device, where it was cooled sharply (quenching the melt). As a result, brightly colored (greyish yellow) precursors were formed in the quenching device, which had the following types of shapes: (a) large shiny flakes; (b) large pieces, and (c) small pieces, solidified particles, and flakes; (d) pale-looking large flakes, which were obtained by the melt-hardening method from a non-heat-treated mixture of starting oxides (in Figure 1).
Note that the precursors of species (a), (b), and (c) had a luster characteristic of glasses, and amorphous structures, and there were no peaks in their diffractograms. To obtain type 2 samples: 2-1, 2-2, and 2-4, precursors (a), (b), and (d) were used, respectively. To obtain samples of type 2-3 (“joint”), a mixture of precursors of different forms was used, shown in Figure 1a–c.
To obtain four varieties of type 2 samples, separate types of precursors were used: (a) type (2-1) flakes; (b) type (2-2) large pieces; (d) type (2-4) large flakes obtained without firing (see Figure 1). They were individually subjected to milling, pressing into tablets and isothermal firing in a muffle furnace for 2 h.
Type 2 (2-3 “joint”) samples were also obtained from a mixture of precursors (a) + (b) + (c) by grinding, pressing, and firing. The synthesis modes of polycrystalline samples are given in Table 1.
Table 1 shows that the samples of type 1 are obtained by ceramic technology in two stages by isothermal firings at 1133 K and T = 1473 K, respectively. At reception of samples of the second type (2-1, 2-2, 2-3) by the melt-hardening method, the initial oxides were subjected to primary firing in two times less holding time than at reception of samples of the first type. For preparation of precursors for samples of the second type (2-4), the initial oxides were subjected to melting and quenching (sharply gradient temperature regime in a short period of time) (see Table 1), and the second firing was carried out in an isothermal regime. A distinctive feature of samples 2-4 is that precursors obtained by melting and quenching of initial oxides without primary thermal annealing were used in their synthesis. The measured density of the obtained samples of type 1 was 90% and 95% for type 2.
Thus, the advantage of preparing these piezoceramics by the melt method is a significant reduction in synthesis time.
Structural studies of the samples were performed using a Bruker D8 ADVANCE diffractometer (CuKα-radiation) (Bruker, Karlsruhe, Germany), using Ge crystal powder as an internal standard, and an electron microscopic (SEM) apparatus Thermo Scientific Phenom ProX (Thermo Fisher Scientific, Bleiswijk, Netherlands).
The dielectric properties of the synthesized samples were measured using the E7-30 admittance (in the temperature range T = 296–700 K, and frequency range f = 25 Hz–1 MHz at the measuring voltage amplitude of 0.2–1 V). The imaginary part of the complex dielectric permittivity ε2 was determined by the formula ε2 = ε1tgδ. The thermostimulated depolarization currents (TSDCs) of polarized samples were measured by short-circuiting with a B7-30 instrument (when the samples were heated at a rate of 0.2–0.4 K/s in 300–700 K). The samples were polarized under a constant electric field (Ep ≈ 2 kV/cm) from a UPU-1M constant voltage source at room temperature, and kept under this field for 0.4 h. The piezoelectric modulus d33 values of the samples were measured at a frequency of 1 kHz using the oscillating mechanical load method. The piezo modulus d33 of the samples was measured at least one day after polarization.

3. Results of the Samples and Their Discussion

3.1. X-ray Phase Analysis

The prepared 0.20BS·0.45PT·0.35PMN polycrystals of both types were grey in color, and had the shape of tablets (diameter 15 mm, and thickness 1.5 mm). The obtained diffractograms show that the predominant phases in the synthesized samples are solid solutions with the structure of perovskite; also, up to 5 wt.% of impurity phase with the structure of pyrochlore is present in the samples (Figure 2).
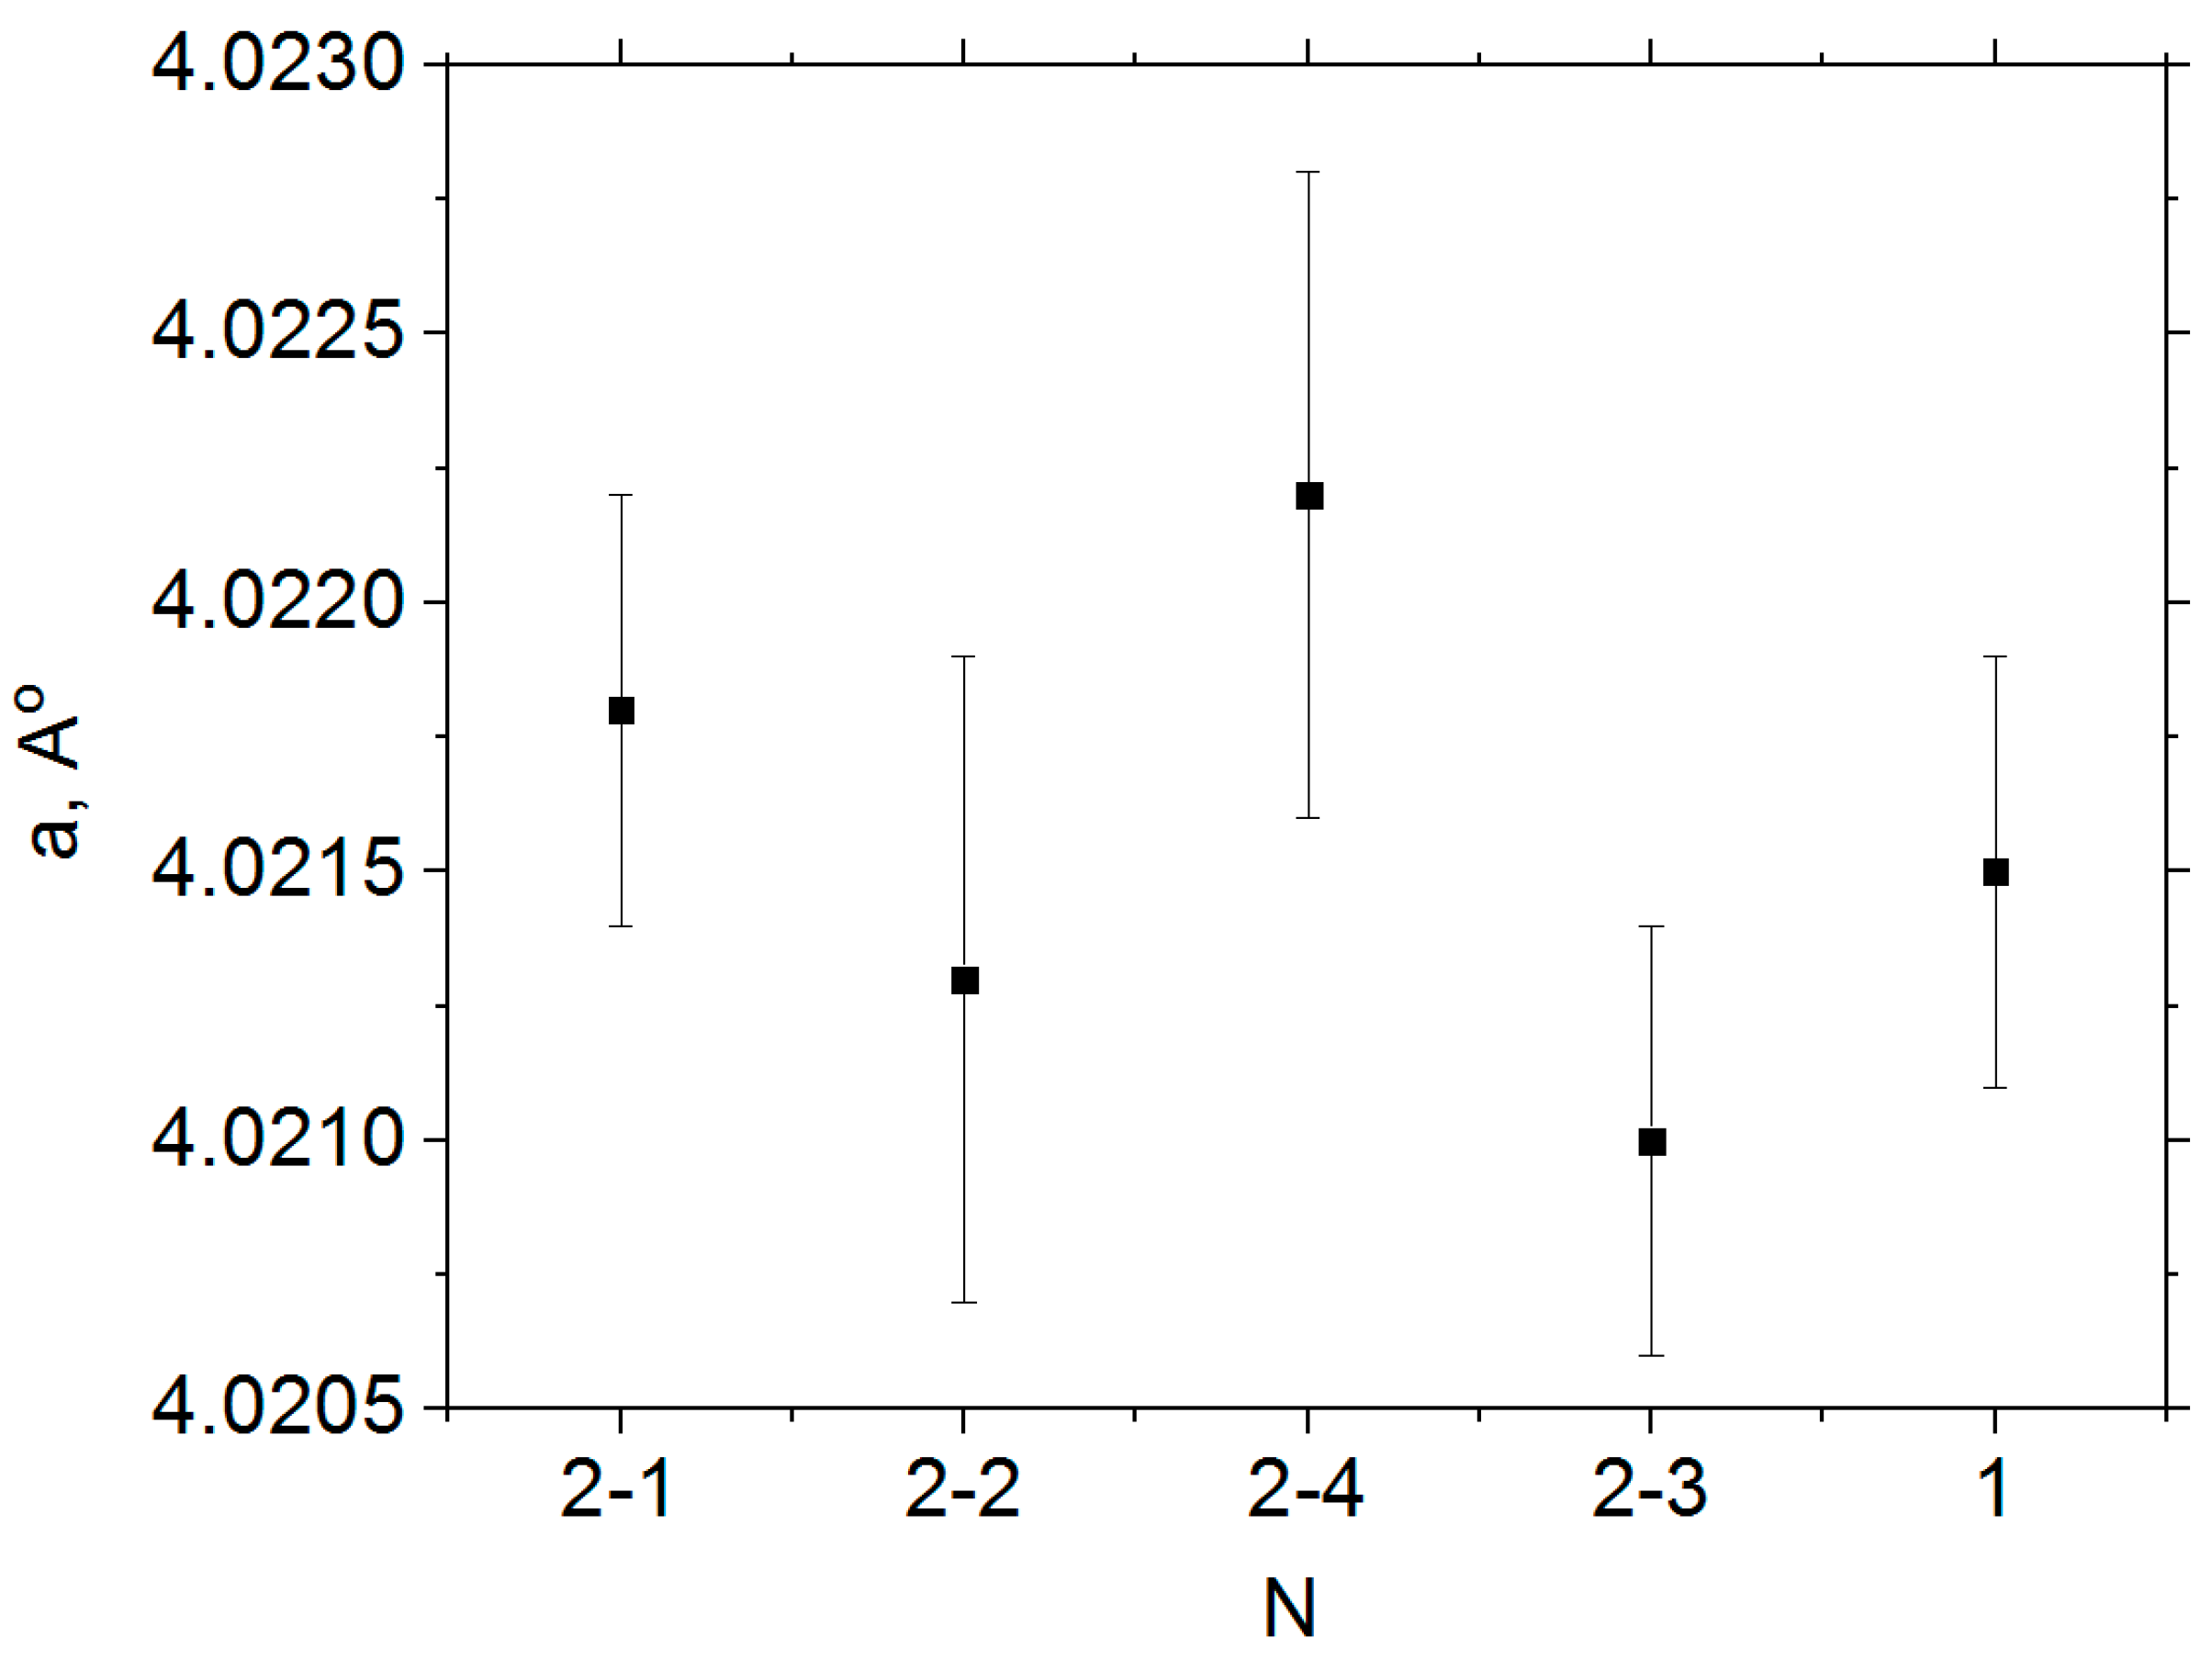
It was found that polycrystals of both types have cubic symmetry. Using the CELREF program v2.0, the structural parameters of the 0.20BS·0.45PT·0.35PMN samples were determined, which correspond to the literature data [20,21], and are shown in Figure 3.
Using the melt method for preparation of piezoceramics of the second type (2-1, 2-2, 2-3) the synthesis time is reduced almost two times, and for obtaining samples of the (2-4) type three times, in comparison with the solid-phase method of synthesis. Probably, the melt method activates the crystallization processes of crystallites in the samples due to the sharply gradient synthesis conditions. Considering these data, and the literature data [18,19,20,21,22,23,24,25], the studied solid solutions belong to relaxor ferroelectrics.

3.2. Microstructure of the Samples

The microstructures of type 1 samples (Figure 4a) and type 2 samples (2-3, Figure 4b; 2-4, Figure 4c) show chaotically arranged crystallites of different sizes.
Despite different technologies (temperature regime, and time of firing of samples) of preparation of both types of investigated samples their microstructures represent well-formed polycrystals, including differently oriented crystallites, and intercrystalline boundaries. Among the three microstructures shown in Figure 4, the sample of type 2 (2-3) in Figure 4b has denser packing of crystallites. The proof of good crystallization of the samples is clear peaks on their diffractograms (Figure 2). Note that solid-phase crystallization in type 1 samples lasts for 6 h, and is divided into preliminary and final thermal annealing at 1133 K and 1473 K, respectively. Type 2 polycrystals with shorter pre-thermal annealing time (2-3) and without pre-annealing (2-4) have the same microstructure as type 1 samples. Probably, during the short time of the melting and quenching process in the precursors of type 2 samples, activation processes such as phase formation, nucleation of crystallite grains, and appearance of broken bonds occur in their structures due to abruptly temperature-gradient conditions. Obviously, the main crystallization process of type 2 samples occurs more rapidly in activation precursors during the final isothermal firing than in type 1 samples.

3.3. Dielectric Measurements

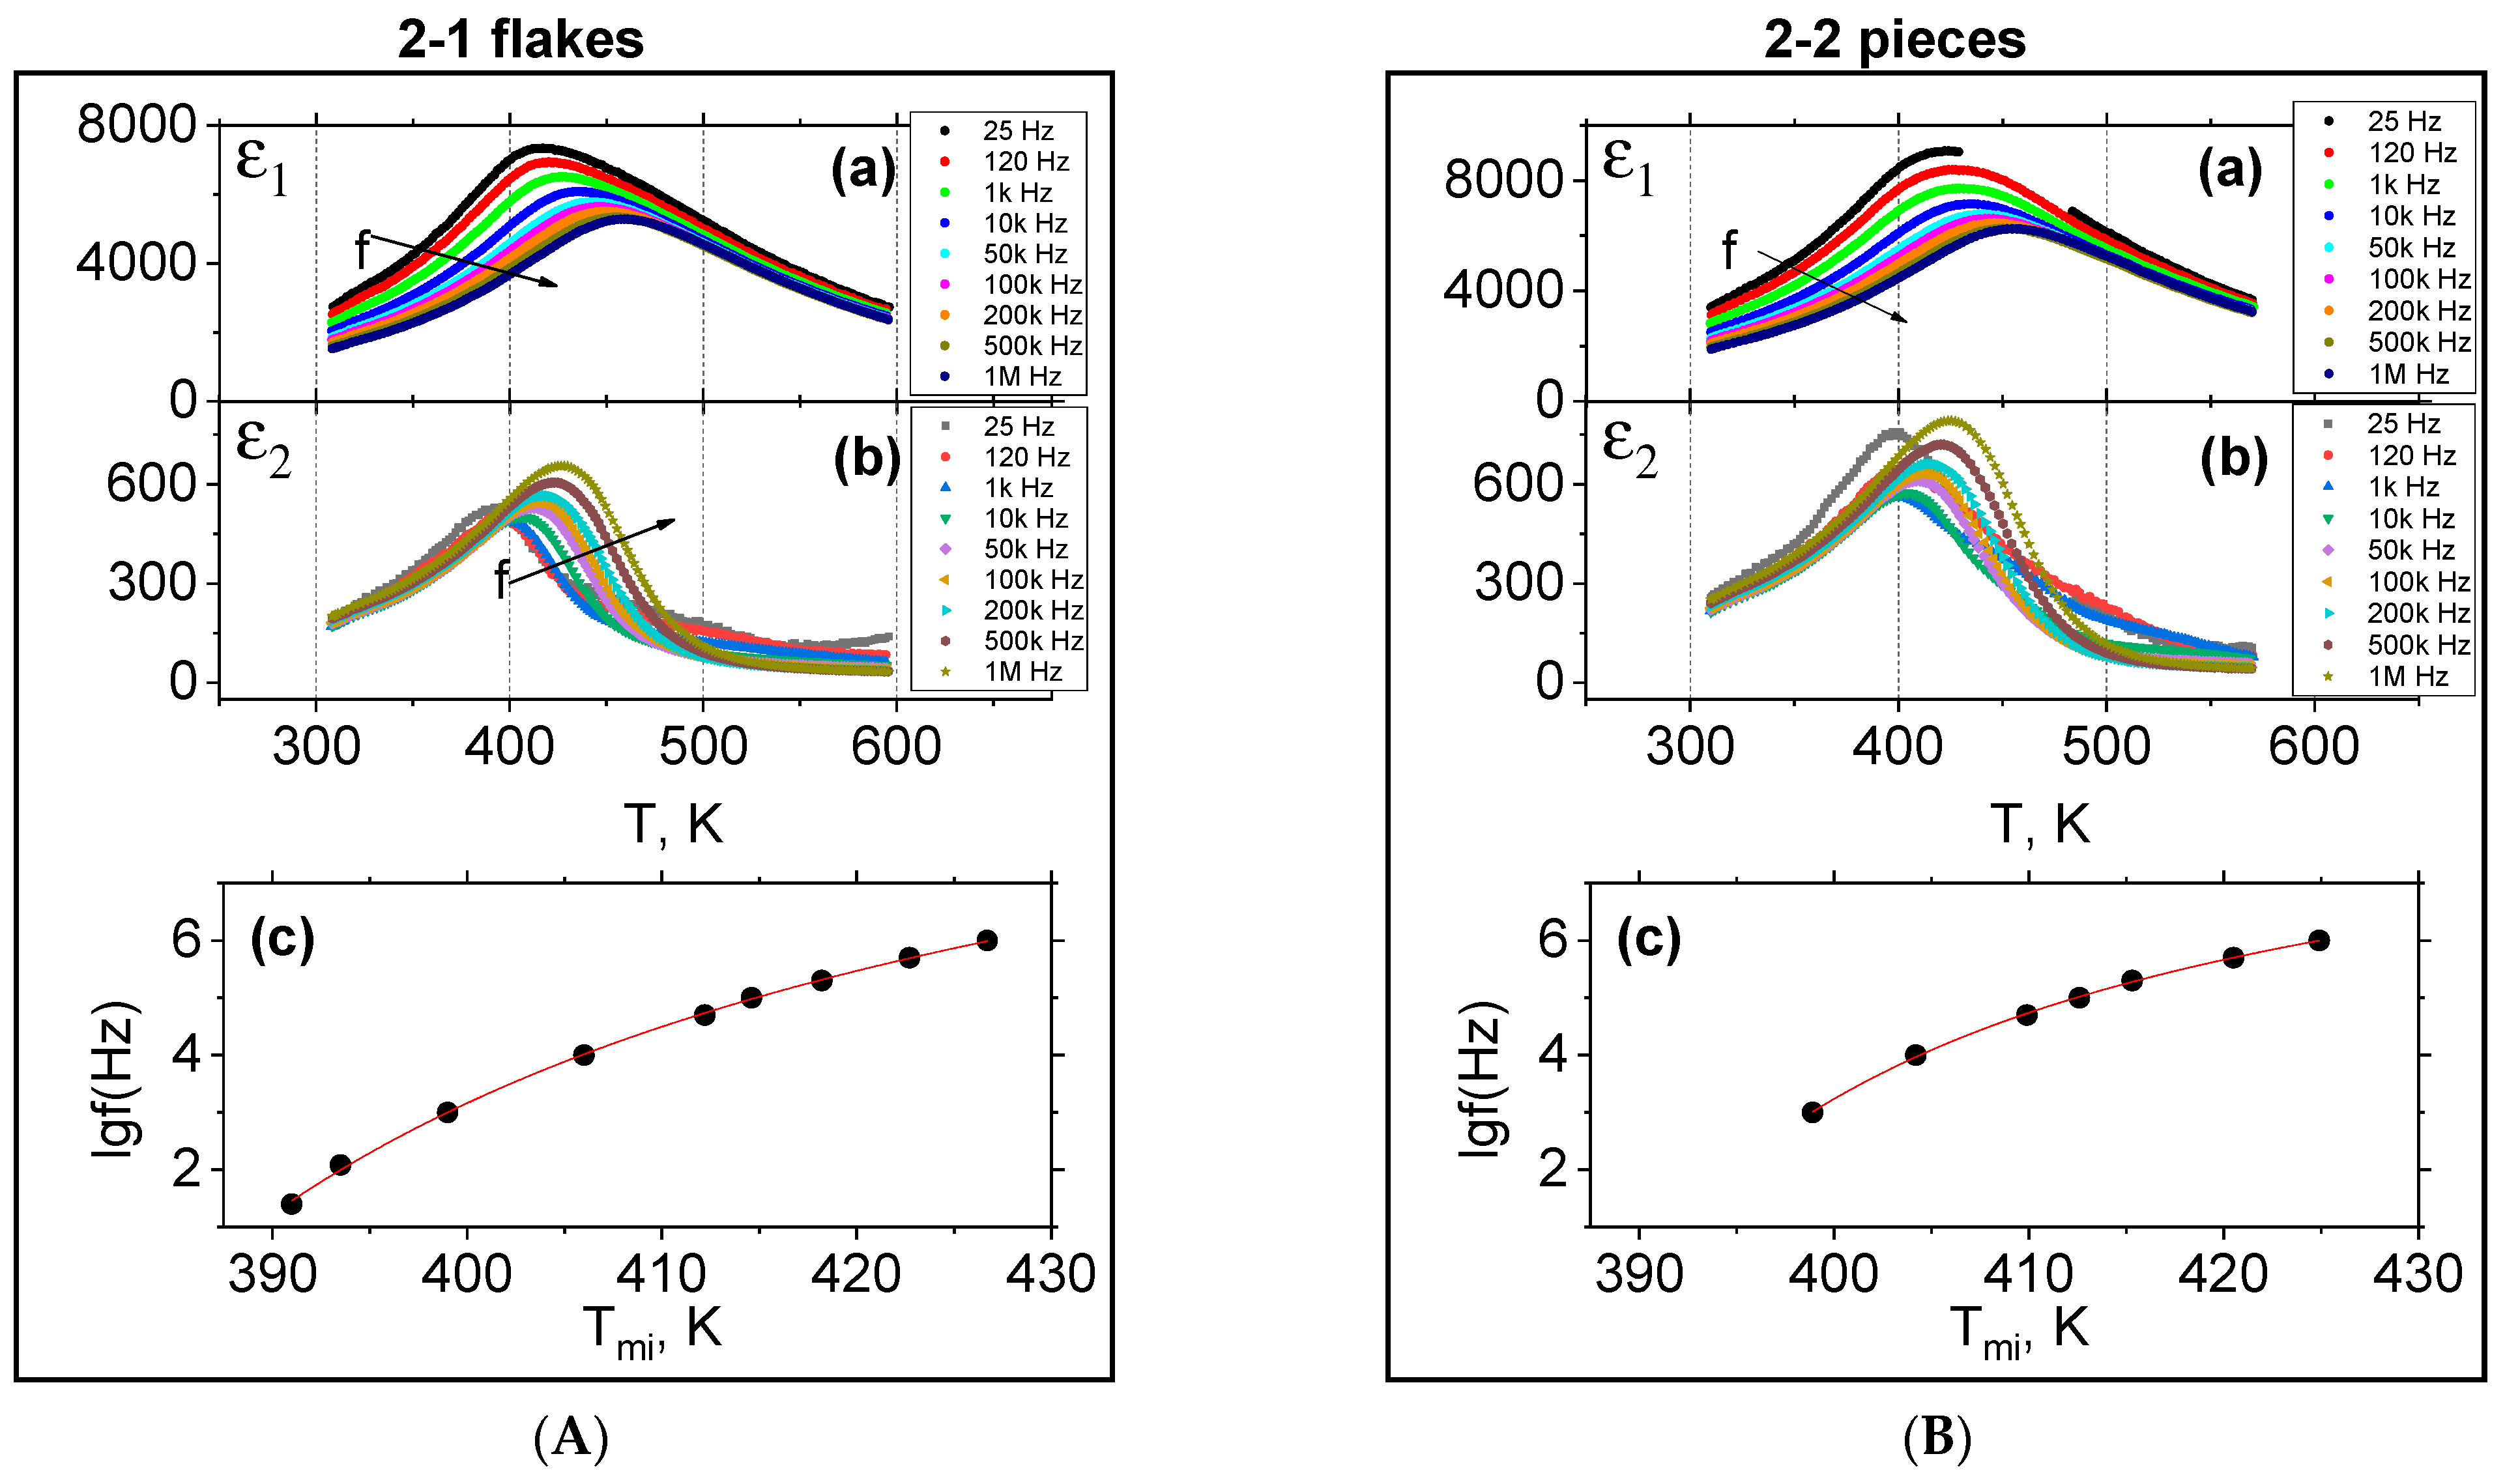
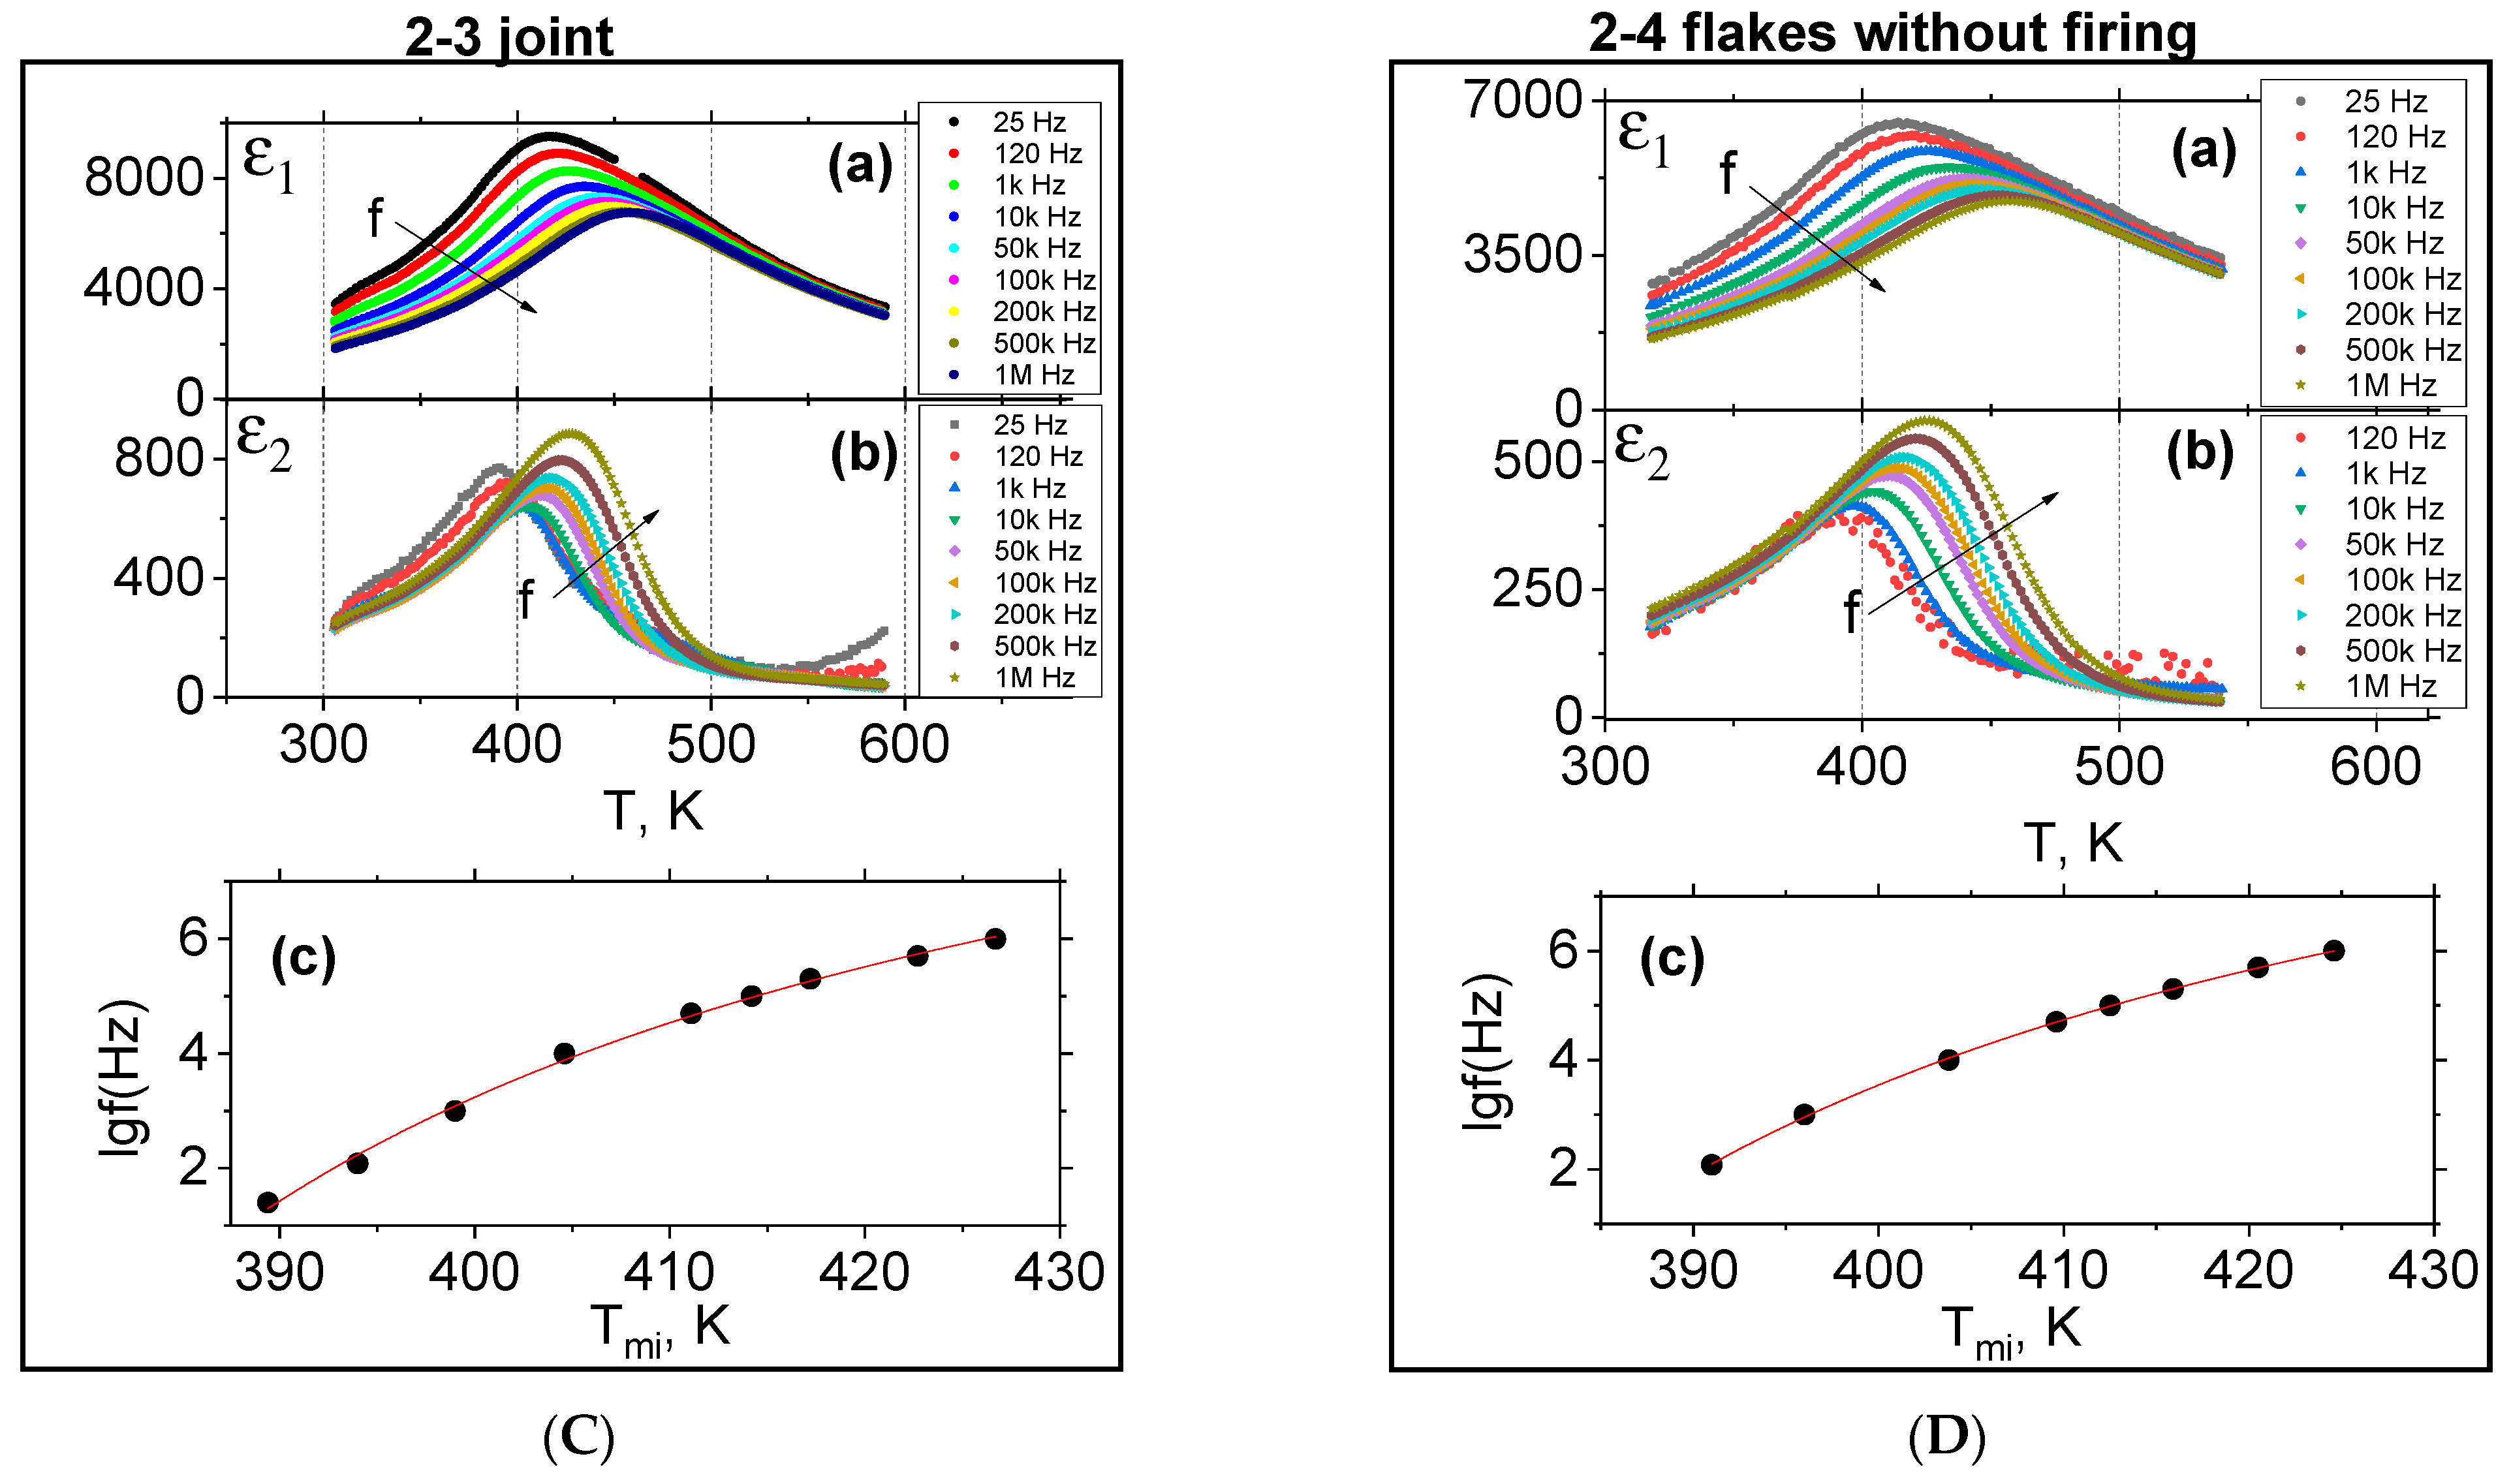
It should be noted that the solid solution of the composition 0.20BS·0.45PT·0.35PMN obtained by ceramic technology was previously classified as a ferroelectric relaxor [25]. Figure 5, Figure 6 and Figure 7 show temperature dependences (a) ε1(T), (b) ε2(T), measured at different frequencies. The dependences show pronounced maxima, the position of Tm1 (for ε1(T)) and Tm2 (for ε2(T)) of which shifts with increasing frequency towards high temperatures, indicating their relaxation character. The dependence of Tm(f) obeys the Vogel–Fulcher law:
f(Tm) = foexp[Ea/kB(Tm − TVF)]
where kB is the Boltzmann constant, fo, Ea, TVF are fitting parameters associated for the canonical PMN relaxor ferroelectric with the frequency of attempts of overcoming the potential barrier, the activation energy, and the Vogel–Fulcher temperature, below which the dynamics of electric dipoles and the transition of the ferroelectric relaxor from the ergodic to the nonergodic state occurs [29].
Electric dipoles freeze, and the transition of the relaxor ferroelectric from the ergodic to the nonergodic state occurs [29].
The parameters fo, Ea, TVF (see Table 2) determined in the description of Tm2(f) dependences by the Vogel–Fulcher formula have values characteristic of relaxor ferroelectrics [29]. Considering these data, as well as the literature data [18,19,20,21,22,23,24,25], we can conclude that the studied solid solutions belong to relaxor ferroelectrics.
The values of maxima ε1(Tm1), ε2(Tm2) (Figure 5A–D and Figure 6a,b) on the temperature-frequency dependences (a) ε1(T,f), (b) ε2(T,f) of samples 2-2 (Figure 5B(a,b)) and 2-3 (Figure 5C(a,b)) are slightly higher than for samples 2-1 (Figure 5A(a,b)) and 2-4 (Figure 5D(a,b)) and 1-1 (Figure 6a,b). The values of dielectric permittivity (ε1 at room temperature) of samples (2-2) and (2-3) are ε1 = 2540–2465 at f = 1 kHz and ε1 = 1720–1645 at f = 1 MHz, which is 20–25% higher than that of ceramic samples (2-1), (2-4), and (1-1). Probably, in piezoelectrics (2-2) and (2-3) (obtained by the melt-hardening method), the polarization of electric dipoles increases, because of their greater mobility, compared to samples of type 1 and other samples of type 2. The noted features of dielectric properties of samples (2-2) and (2-3) can be associated with slower thermal modes of quenching of pieces (precursors) than obtaining flakes and small particles. All investigated samples have low values of tgδ.
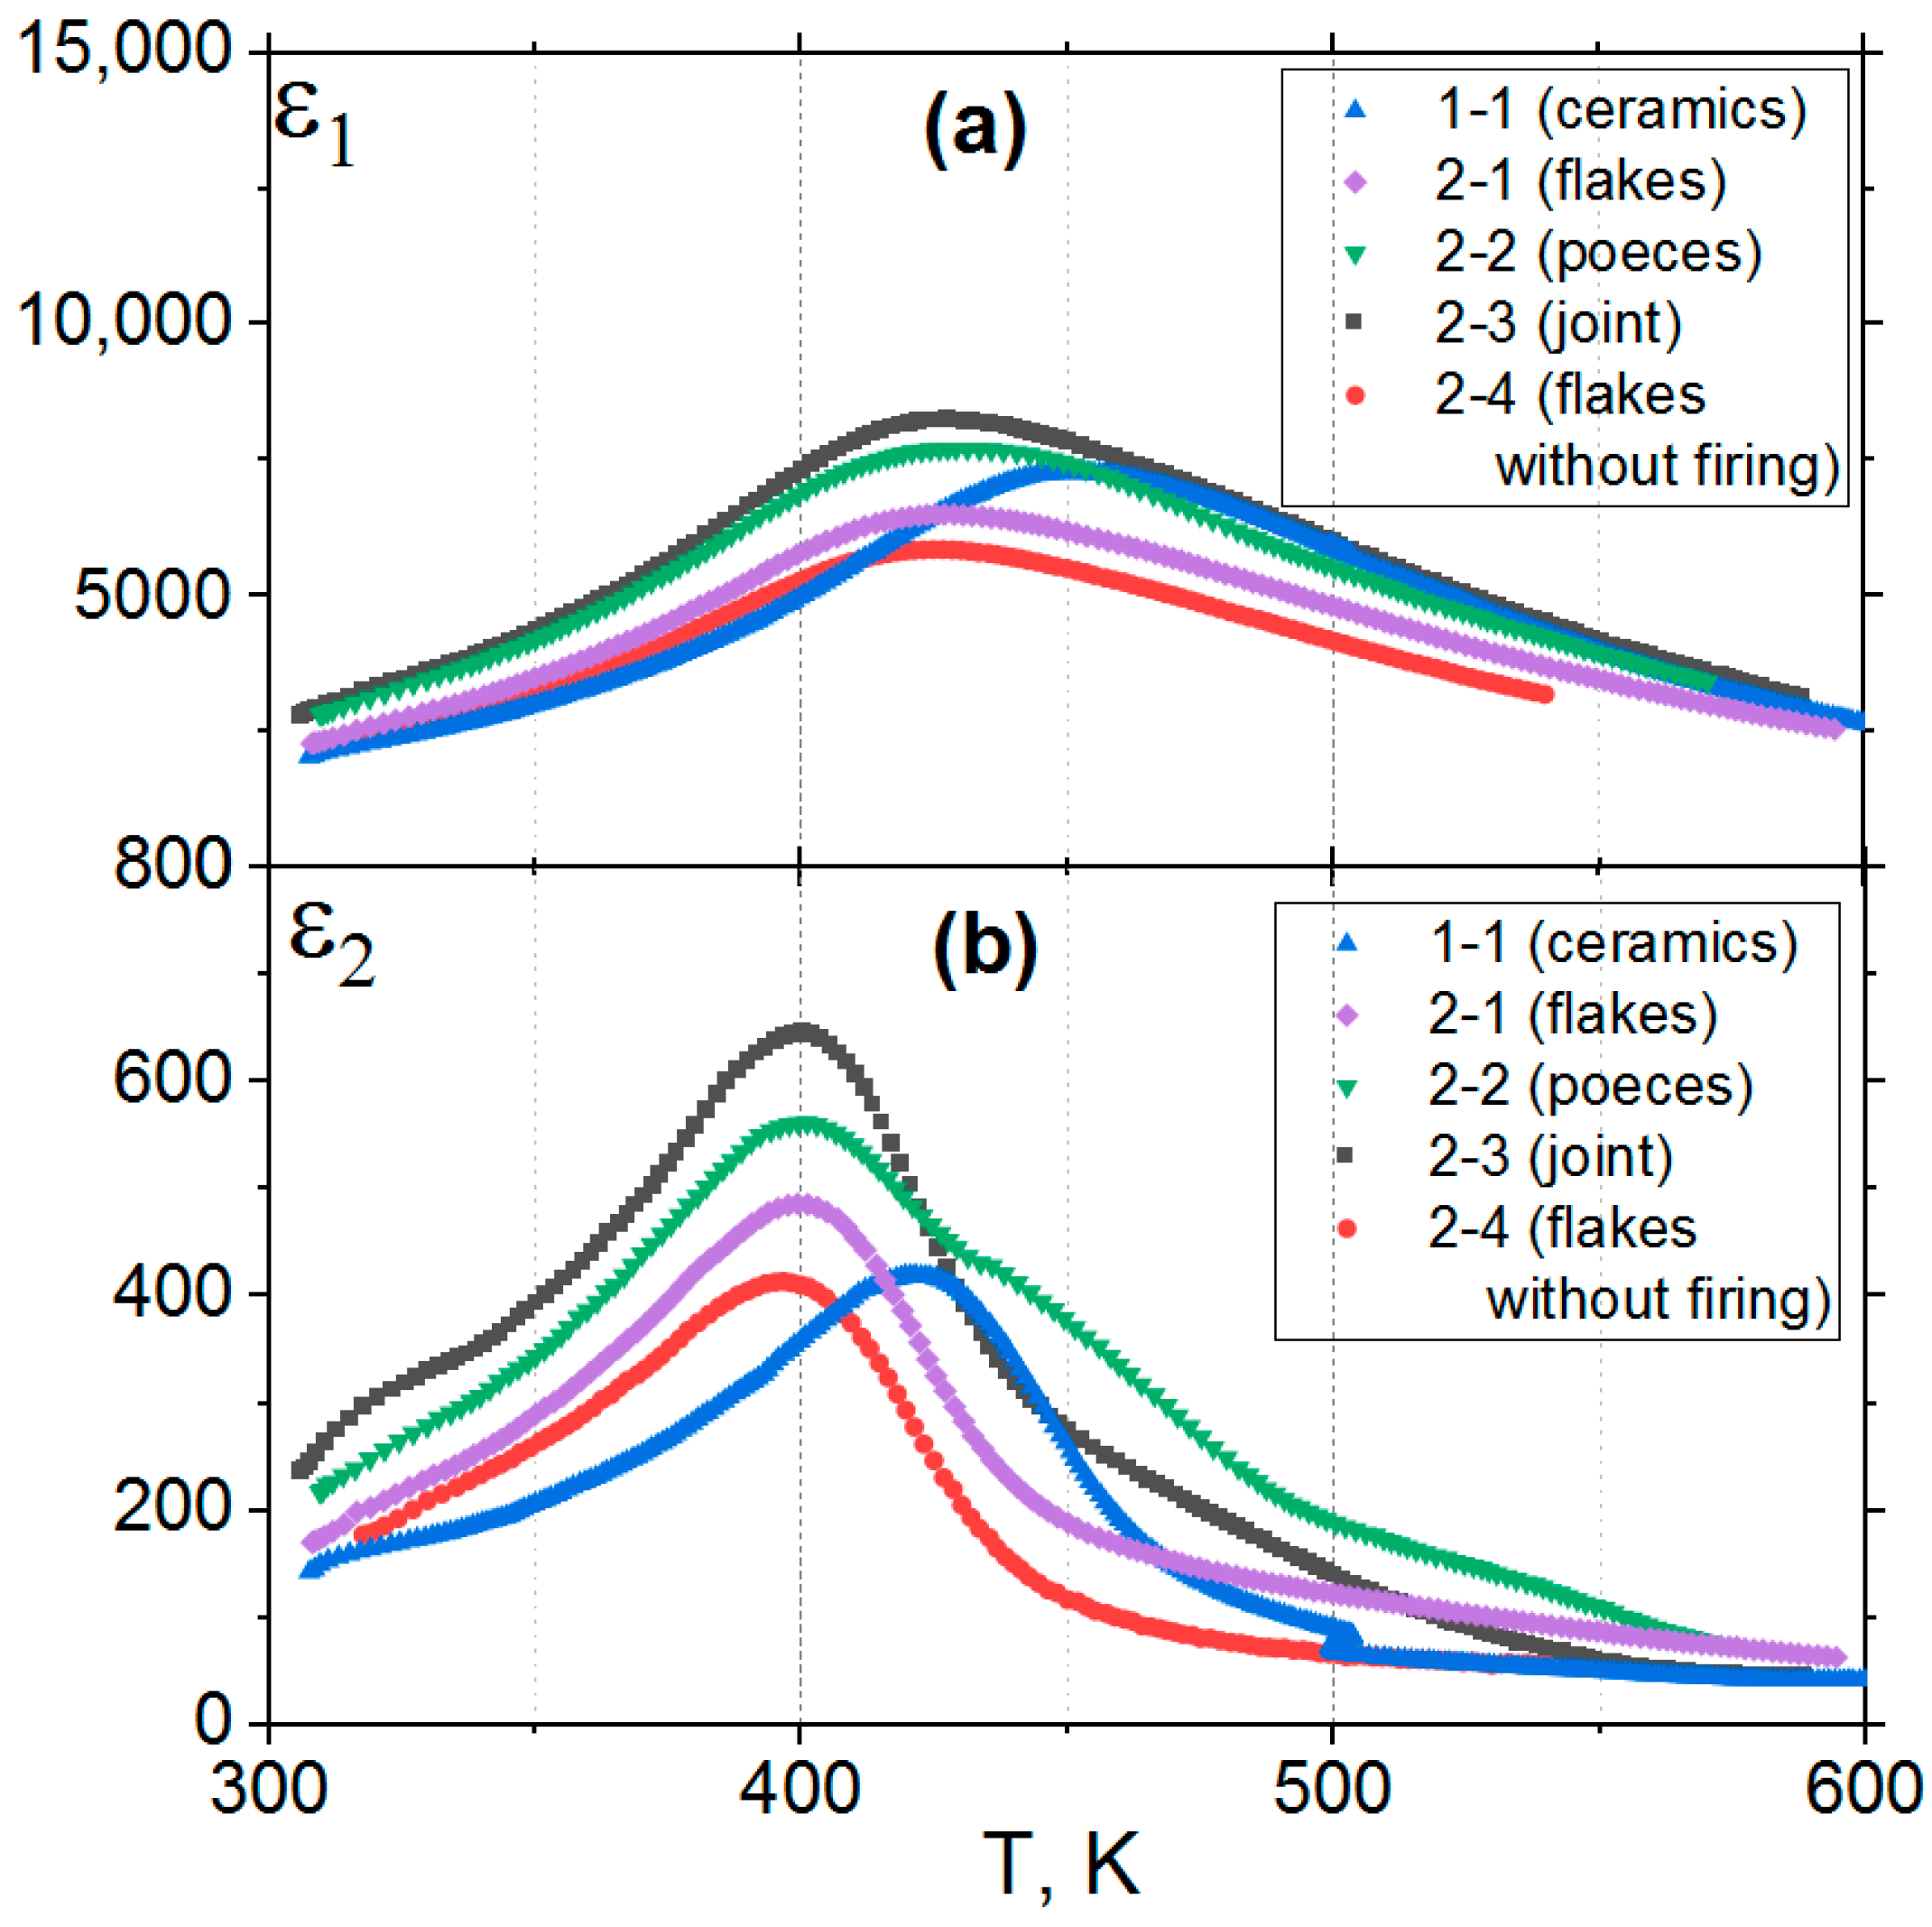
The temperature-frequency dependences (a) ε1(T,f), (b) ε2(T,f) of samples of type 1 and type 2 (Figure 7a,b) show that all polarized electric dipoles of type 2 samples participate in slow relaxation processes under the action of an external applied electric field with frequency f = 1 kHz. Moreover, the dependences ε1(T,f), ε2(T,f) (Figure 7a,b) clearly show that the temperatures of the maxima of all type 2 samples coincide and are noticeably lower than in type 1 samples.
These data indicate that the frequency of oscillations of electric dipoles in all samples of type 2 is the same and equal at fm = 1 kHz to the point Tm = 420 K on the dependence ε1(T,f) (Figure 7a). On the dependence ε2(T,f), the oscillation frequency of electric dipoles reaches fm = 1 kHz at the temperature Tm = 400 K (Figure 7b). In the samples of type 1, similar temperatures are larger (on the dependence ε1(T,f) Tm = 460, and for ε2(T,f) Tm = 430) than in the samples of type 2 (Figure 7b).

3.4. Study of Thermostimulated Depolarisation Currents (TSDC)

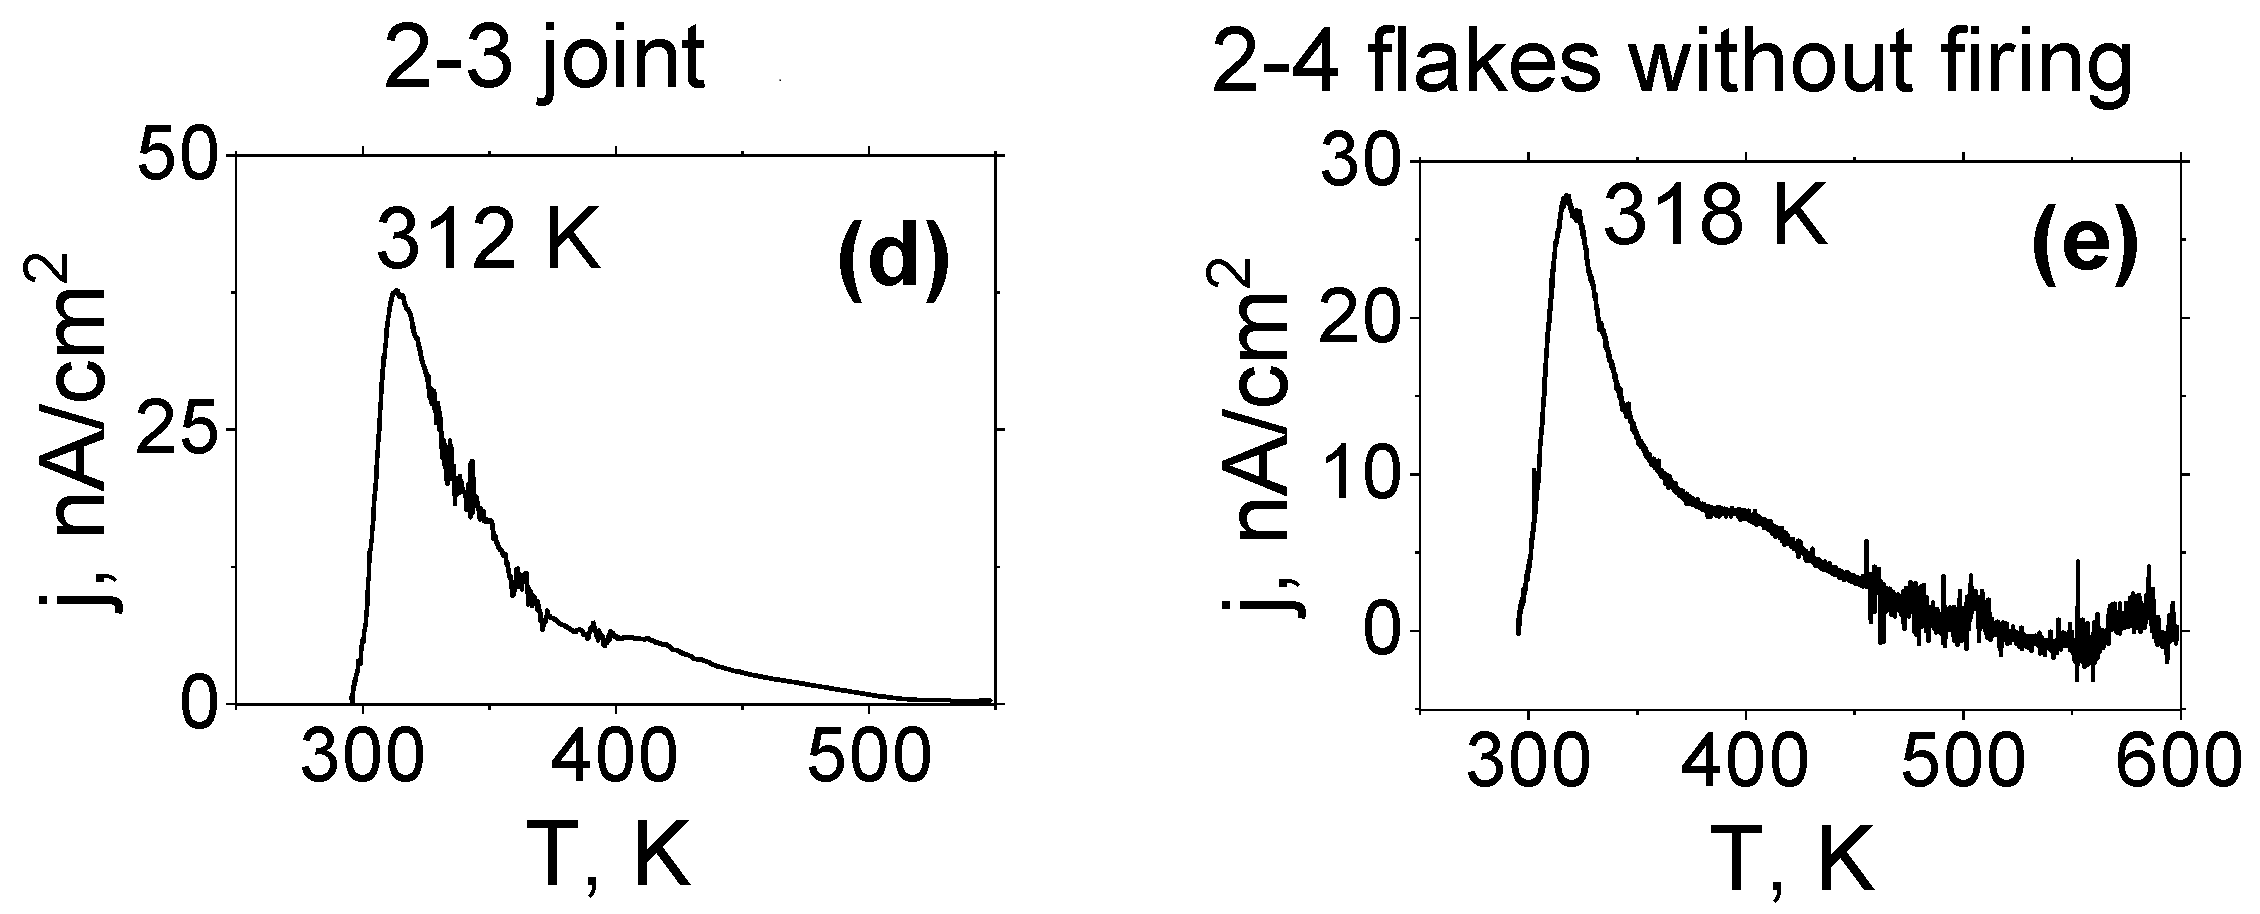
The TSDC(T) dependences show a pronounced peak in the region of 315–350 K for the sample (Figure 8). Apparently, this maximum is caused by depolarization of the polar state of the sample arising due to the ordering under the action of the polarizing electric field of the PNRs’ electric dipole orientations when the sample is cooled to temperatures below the Vogel–Fulcher temperature (the temperature of transition to the nonergodic state), i.e., T < TVF. Similar maxima on the TSDC(T) dependences were observed for other known relaxor ferroelectrics, for example, for BaTi0.65Zr0.35O3 [30] and (1−x)PMN·xPbSc1/2Nb1/2O3, x = 0.05, 0.10 [31].
The results of the investigation of TSDC(T) dependences of the samples (Figure 8) allow us to establish that practically all samples of type 2 have higher TSDC currents (except for samples 2-2) than in samples of type 1. High TSDC currents are especially found in samples 2-1 and 2-3 (see Figure 8b,d). The temperatures of the TSDC maxima (Tmp) of type 2 samples are lower than the similar maxima of type 1 samples. These data indicate that the electric dipoles of PNRs of type 2 samples are more susceptible to the polarizing effect of the external electric field during heating, and a more smoothly depolarizing effect during cooling. Such TSDC(T) maxima are characteristic of relaxor ferroelectrics.
The piezo modulus d33 of the samples was measured at least one day after polarization. The measured piezo modulus d33 of the samples are summarized in Table 2.
Table 2 shows the values of piezoelectric coefficients d33 of samples of type 1 (370 pC/N) and type 2 (195 pC/N). Despite the higher density of type 2 samples, the values of their d33 coefficients are lower than those of type 1 samples. Probably, structural changes of type 2 samples caused by the sharp-gradient conditions of their synthesis reduce their piezoelectric properties.
The results of measurements of structural and electrophysical parameters of the samples are presented in Table 2.

3.5. Discussion of Results

The summarized characteristics of all the type 1 and type 2 samples obtained and studied are summarized in Table 2 for comparative analysis. It can be observed that the cubic unit cell size of 0.20BS·0.45PT·0.35PMN samples (with perovskite structure) present in different samples are consistent with each other within the accuracy of their determination.
The temperatures of dielectric constant maxima (Tm1) of type 2 samples lie about 20 K lower than type 1 samples. The temperatures of the TSDC maxima (Tmp) of type 2 samples lie about 50 K above the similar maxima of type 1 samples. Type 2 samples also have lower values of the Vogel–Fulcher TVF temperature (by 10–45 K). The values of dielectric permittivity (ε1) (at room temperature) of type 2 samples 2070–2540 at f = 1 kHz and 1400–1720 at f = 1 MHz are 13% higher than those of type 1 samples (1970 at f = 1 kHz, and 1360 at f = 1 MHz). At the same time, they have comparable values of tgδ and piezo modulus d33.
Ceramic samples of type 1 are noticeably superior to type 2 samples in terms of piezo modulus d33 (220 pC/N vs. ~190 pC/N).
The noted differences in properties between type 1 and type 2 samples may be related to differences in the technologies of their preparation. In particular, the primary firing modes are isostatic firing for type 1 samples and sharp-gradient temperature melting and quenching for type 2 samples. Probably, the differences in dielectric properties between type 2 samples can be related to different effects of micro stresses and deformations in their structures, which can appear in precursors of different types during melt-quenching depending on the cooling mode (rate). Larger precursors (large particles, and thick flakes) will cool more slowly than smaller precursors (small particles, and thin flakes) (different gradient-temperature conditions between them). Four kinds of samples were obtained by the melt-hardening method, differing among themselves, and with type 1 samples having different dielectric properties for different practical applications.
Thus, it can be stated that the use of the melt-sliding method allows expanding the obtaining of almost single-phase samples of 0.20BS·0.45PT·0.35PMN. In addition, the melt-and-slide method has a significant advantage, since its use allows to reduce the time of synthesis of samples by 2–3 times. This method needs further improvement.

4. Conclusions

  • Samples of solid solutions of composition 0.20BS·0.45PT·0.35PMN (with perovskite structure) can be obtained by ceramic and melt-quenching technology. Four kinds of samples (by melting and quenching of thermally treated and non-thermally treated initial oxide mixtures) were obtained using the melt-hardening method. The cubic unit cell sizes of 0.20BS·0.45PT·0.35PMN samples present in different samples are almost the same as each other. To obtain a higher density of the samples, they should be obtained by the melt-quenching method, but with a small, short pre-firing process.
  • The synthesized 0.20BS·0.45PT·0.35PMN samples exhibit dielectric properties characteristic of relaxor ferroelectrics, and the polarized samples exhibit a pronounced piezo effect with a piezo modulus value of d33~200 pC/N. The ε1 value of type 2 samples is 13% higher than the ε1 value of type 1 samples. The mentioned differences between dielectric properties of samples of types 1 and 2 can relate to the difference in the technologies by which they were obtained. The differences between the samples of the second type (2-1, 2-2, 2-3, 2-4) can be related to the appearance of microstresses and deformations in the microstructures of the samples of type 2, manifested in different degrees in their structures depending on the forms of amorphous precursors, due to the difference in gradient-temperature conditions during their quenching.
  • Application of the melt-quenching method has an advantage over the solid-phase method, as it allows to obtain practical single-phase samples of 0.20BS·0.45PT·0.35PMN solid solutions (four varieties), but the synthesis time is significantly reduced by 2–3 times. It is desirable to test this method for synthesis of other compositions of piezoelectric materials due to its efficiency.

Author Contributions

Conceptualization, A.S.N.; Methodology, A.A.N. and D.E.U.; Validation, D.E.U.; Formal analysis, D.E.U.; Investigation, A.A.N. and E.A.N.; Writing—original draft, A.A.N.; Writing—review and editing, A.S.N. All authors have read and agreed to the published version of the manuscript.

Funding

This research was funded by of the Ministry of Science and Higher Education of the Republic of Kazakhstan grant number AP14972981.

Institutional Review Board Statement

Not applicable.

Informed Consent Statement

Not applicable.

Data Availability Statement

The original contributions presented in the study are included in the article; further inquiries can be directed to the corresponding authors.

Conflicts of Interest

The authors declare no conflict of interest.

References

  1. Ye, Z.-G. (Ed.) Handbook of Dielectric, Piezoelectric, and Ferroelectric materials: Synthesis, Properties, and Applications; Woodhead Publishing: Cambridge, UK, 2008; 1096p. [Google Scholar] [CrossRef]
  2. Uchino, K. (Ed.) Advanced Piezoelectric Materials. Science, and Technology, 2nd ed.; Woodhead Publishing: Cambridge, UK, 2017; 848p. [Google Scholar]
  3. Reilly, E.K.; Burghardt, F.; Fain, R.; Wright, P. Powering a wireless sensor node with a vibration-driven piezoelectric energy harvester. Smart Mater. Struct. 2011, 20, 125006. [Google Scholar] [CrossRef]
  4. Murray, R.; Rastegar, J. Novel two-stage piezoelectric-based ocean wave energy harvesters for moored or unmoored buoys. In Active and Passive Smart Structures and Integrated Systems; SPIE: San Diego, CA, USA, 2009; Volume 7288, p. 72880E. [Google Scholar]
  5. Huang, C.; Lajnef, N.; Chakrabartty, S. Infrasonic energy harvesting for embedded structural health monitoring microsensors. In SPIE Smart Structures, and Materials Nondestructive Evaluation, and Health Monitoring; International Society for Optics, and Photonics: Bellingham, WA, USA, 2010; p. 764746. [Google Scholar]
  6. Cook-Chennault, K.A.; Thambi, N.; Sastry, A.M. Powering MEMS portable devices—A review of nonregenerative, and regenerative power supply systems with special emphasis on piezoelectric energy harvesting systems. Smart Mater. Struct. 2008, 17, 043001. [Google Scholar] [CrossRef]
  7. Fang, H.B.; Liu, J.Q.; Xu, Z.Y.; Dong, L.; Wang, L.; Chen, D.; Cai, B.-C.; Liu, Y. Fabrication, and performance of MEMS-based piezoelectric power generatorfor vibration energy harvesting. J. Microelectron. 2006, 37, 1280–1284. [Google Scholar] [CrossRef]
  8. Park, K.I.; Hassan, E.; Kouritem, S.A.; Amer, F.Z.; Mubarak, R.I. Acoustic energy harvesting using an array of piezoelectric cantilever plates for railways, and highways environmental noise. Ain Shams Eng. J. 2024, 15, 102461. [Google Scholar]
  9. Pradhan, L.K.; Kar, M. Relaxor Ferroelectric Oxides: Concept to Applications. In Multifunctional Ferroelectric Materials; Intech Open: London, UK, 2021; pp. 167–169. [Google Scholar] [CrossRef]
  10. Cross, L.E. Relaxor ferroelectrics. Ferroelectrics 1987, 76, 241–267. [Google Scholar] [CrossRef]
  11. Lalitha, K.V.; Hinterstein, M.; Lee, K.Y.; Yang, T.; Chen, L.Q.; Groszewicz, P.B.; Koruza, J.; Rödel, J. Spontaneous ferroelectric order in lead-free relaxor Na1/2Bi1/2TiO3-based composites. Phys. Rev. B 2020, 101, 174108. [Google Scholar]
  12. Hong, Z.; Tian, B.; Ke, X.; Yang, S.; Wang, Y. Origin of reentrant relaxor formation in ferroelectric solid solutions. Phys. Rev. B 2023, 107, 224105. [Google Scholar] [CrossRef]
  13. Jayakrishnan, A.R.; Silva, J.P.B.; Kamakshi, K.; Dastan, D.; Annapureddy, V.; Pereira, M.; Sekhar, K.C. Are lead-free relaxor ferroelectric materials the most promising candidates for energy storage capacitors? Prog. Mater. Sci. 2023, 132, 101046. [Google Scholar] [CrossRef]
  14. Al-Aaraji, M.N.; Hasan, W.N.; Al-Marzok, I.K. Progress in Lead Free- Relaxor Ferroelectrics for Energy Storage Applications. Conference, College of Material Engineering, University of Babylon, Iraq. J. Phys. Conf. Ser. 2021, 1973, 012117. [Google Scholar] [CrossRef]
  15. Veerapandiyan, V.; Benes, F.; Gindel, T.; Deluca, M. Strategies to Improve the Energy Storage Properties of Perovskite Lead-Free Relaxor Ferroelectrics. Materials 2020, 13, 5742. [Google Scholar] [CrossRef]
  16. Park, S.E.; Shrout, T.R. Ultrahigh strain, and piezoelectric behavior in relaxor based ferroelectric single crystals. J. Appl. Phys. 1997, 82, 1804. [Google Scholar] [CrossRef]
  17. Sahul, R. Effect of Manganese Doping on PIN-PMN-PT Single Crystals for High Power Applications. Ph.D. Thesis, Pennsylvania State University, State College, PA, USA, 2014. [Google Scholar]
  18. Stringer, C.J.; Donnelly, N.J.; Shrout, T.R.; Randall, C.A.; Alberta, E.F.; Hackenberger, W.S. Dielectric Characteristics of Perovskite-Structured High-Temperature Relaxor Ferroelectrics: The BiScO3–Pb(Mg1/3Nb2/3)O3–PbTiO3 Ternary System. J. Am. Ceram. Soc. 2008, 91, 1781–1787. [Google Scholar] [CrossRef]
  19. Bush, A.A.; Kamentsev, K.E.; Lavrentiev, A.M.; Segalla, A.G.; Fetisov, Y.K. Dielectric, and piezoelectric properties of ceramic samples of solid solutions (1-2x)BiScO3·xPbTiO3·xPbMg1/3Nb2/3O3 (0.30≤x≤0.46). Inorg. Mater. 2011, 47, 865–871. [Google Scholar] [CrossRef]
  20. Bush, A.A.; Kamentsev, K.E.; Bekhtin, M.A.; Segalla, A.G. Segnetoelectric-relaxor properties of samples of the system. (1-2x)BiScO3·xPbTiO3·xPbMg1/3Nb2/3O3 (0.30≤x≤0.46). FTT 2017, 59, 36–44. [Google Scholar]
  21. Xie, G. Structure, and electrical properties of PMN-BS-PT piezoelectric ceramics. In Proceedings of the Symposium on Piezoelectricity, Acoustic Waves, and Device Applications, Chengdu, China, 27–30 October 2017; pp. 537–540. [Google Scholar]
  22. Talanov, M.V.; Bush, A.A.; Kamentsev, K.E.; Sirotinkin, V.P.; Segalla, A.G. Structure-property relationships in BiScO3–PbTiO3–PbMg1/3Nb2/3O3 ceramics near the morphotropic phase boundary. J. Am. Ceram. Soc. 2018, 101, 683–693. [Google Scholar] [CrossRef]
  23. Spitsin, A.I.; Bush, A.A.; Kamentsev, K.E.; Sirotinkin, V.P.; Talanov, M.V. Preparation, structural, and electrophysical studies of segmented ceramic samples of the system (1–2x)BiScO3·xPbTiO3·xPbMg1/3Nb2/3O3, 0 ≤ x ≤ 0.50. Fine Chem. Eng. 2019, 14, 78–89. [Google Scholar]
  24. Sysoev, M.A.; Bush, A.A.; Kamentsev, K.E.; Sirotinkin, V.P.; Nogai, A.A.; Nogai, A.S. Preparation, Structure, and Electrophysical Properties of Ceramic Samples of (1–2x)BiScO3∙(2–y)xPbTiO3yxPbMg1/3Nb2/3O3 Perovskite Solid Solutions. Inorg. Mater. 2023, 59, 1345–1355. [Google Scholar] [CrossRef]
  25. Nogai, A.A.; Sysoev, M.A.; Bush, A.A.; Nogai, A. Synthesis and study of structural and electrophysical characteristics of piezoceramic section (1–x)(0.8PbMg1/3Nb2/3O3·0.2BiScO3x(0.8PbTiO3·0.2BiScO3) of the ternary system BiScO3–PbTiO3–PbMg1/3Nb2/3O3. J. Adv. Dielectr. 2024, 2450011. [Google Scholar] [CrossRef]
  26. Nogai, A.S.; Nogai, A.A.; Uskenbaev, D.E.; Utegulov, A.B.; Nogai, E.A.; Toleugulov, D.D. Features of Structures, and Ionic Conductivity of Na3Fe2(PO4)3 Polycrystals Obtained by Solid Phase, and Mellte Methods. Ceramics 2023, 6, 2295–2306. [Google Scholar] [CrossRef]
  27. Uskenbaev, D.; Zhetpisbayev, K.; Nogai, A.S.; Beissenov, R.; Zhetpisbayeva, A.; Baigisova, K.; Salmenov, Y.; Nogai, A.; Tursyntay, S. Synthesis of high temperature superconducting ceramics in the Bi(Pb)-Sr-Ca-Cu-O system based on amorphous precursors. East.-Eur. J. Enterp. Technol. 2022, 118, 29–37. [Google Scholar] [CrossRef]
  28. Uskenbaev, D.; Nogai, A.; Uskenbayev, A.; Zhetpisbayev, K.; Nogai, E.; Dunayev, P.; Zhetpisbayeva, A.; Nogai, A. Synthesis, and Research of Critical Parameters of Bi-HTSC Ceramics Based on Glass Phase Obtained by IR Heating. Chem. Eng. 2023, 7, 95. [Google Scholar] [CrossRef]
  29. Bokov, A.; Ye, Z.-G. Recent progress in relaxor ferroelectrics with perovskite structure. J. Mater. Sci. 2006, 41, 31–52. [Google Scholar] [CrossRef]
  30. Maiti, T.; Guo, R.; Bhalla, A.S. Structure-property phase diagram of BaZrxTi1-xO3 System. J. Am. Ceram. Soc. 2008, 91, 1769–1780. [Google Scholar] [CrossRef]
  31. Zhao, X.; Qu, W.; He, H.; Vittayakorn, N.; Tan, X. Influence of Cation Order on the Electric Field-Induced Phase Transition in Pb(Mg1/3Nb2/3)O3-Based Relaxor Ferroelectrics. J. Am. Ceram. Soc. 2006, 89, 202–209. [Google Scholar] [CrossRef]
Figure 1. General appearance of amorphous precursors obtained after the primary firing of starting oxides, melting, and quenching: (a) brightly colored flakes; (b) large pieces; (c) small pieces; (d) pale, large flakes obtained without primary firing, by melting and quenching.
Ceramics 07 00091 g001
Figure 2. Diffractograms of samples 0.20BS·0.45PT·0.35PMN of type 1 (1-1), and type 2 (2-1, 2-3, 2-4) (the arrow shows the position of the peak corresponding to the impurity pyrochlore phase).
Ceramics 07 00091 g002
Figure 3. Structural parameters of the unit cell of samples (N) of type 1 (1-1), and type 2 (2-1, 2-2, 2-3, 2-4) of composition 0.20BS·0.45PT·0.35PMN.
Ceramics 07 00091 g003
Figure 4. Microstructures of polycrystal 0.20BS·0.45PT·0.35PMNs: (a) type 1; (b) type 2 (2-3), (c) type 2 (2-4).
Ceramics 07 00091 g004
Figure 5. Temperature dependences: (a) ε1(T,f), (b) ε2(T,f), and (c) lgTm(f) for samples of type 2: (A) sample 2-1; (B) 2-2; (C) 2-3; and (D) 2-4 of composition 0.20BS3·0.45PT·0.35PMN.
Ceramics 07 00091 g005aCeramics 07 00091 g005b
Figure 6. Temperature dependences of (a) ε1(T), (b) ε2(T), and (c) Tm(f) for samples of type 1 (1-1) of composition 0.20BS3·0.45PT·0.35PMN.
Ceramics 07 00091 g006
Figure 7. Temperature dependences of (a) ε1(T) and (b) ε2(T) for samples of type 1 (1-1) and type 2 (2-1; 2-2; 2-3; 2-4) of composition 0.20BS·0.45PT·0.35PMN measured at f = 1 kHz.
Ceramics 07 00091 g007
Figure 8. TSDC(T) dependences for samples of (a) type 1 (1-1) and type 2: (b) (2-1); (c) (2-2); (d) (2-3); (e) (2-4) of composition 0.20BS·0.45PT·0.35PMN samples.
Ceramics 07 00091 g008aCeramics 07 00091 g008b
Table 1. Technological modes of synthesis of samples 0.20BS·0.45PT·0.35PMN of the first and second types.
First TypeSecond Type
2-1, 2-2, 2-32-4
PleSolid Solution Composition: 0.20BS3·0.45PT·0.35PMNFirst AnnealingSecond AnnealingFirst AnnealingMelting and HardeningSecond AnnealingMelting and HardeningFiring
Firing temperatures T, K1133147311331623162316231473
Firing time t, h4220.008320.0832
Cooling time t, h0.50.50.50.00410.50.00410.5
Cooling rate V, K/h226620462266395,8533246395,8532046
Table 2. Characteristics of 0.20BS·0.45PT·0.35PMN samples.
CharacteristicsType of Sample
1-12-12-22-32-4
a, Å4.0215(4)4.0218(4)4.0213(6)4.0210(4)4.0222(6)
Tm1(1 kHz), K450428428423424
Tm1(1 MHz), K477460455456455
Tmp, K 348314320314319
TVF, K383(9)346(4)368(3)340(9)336(4)
ε1m (1 kHz)73206505768582755870
ε1 (296 K, 1 kHz)19702030254024652070
ε1m (1 MHz)62245300624567454720
ε1 (296 K, 1 MHz)13601400172016451420
tgδ (296 K, 1 kHz)0.0760.0770.0760.0870.073
tgδ (296 K, 1 MHz)0.1230.1110.1120.1300.106
jm, nA/cm210352.63828
d33, pC/N220195193178190
fo, Hz1.7 × 10105.5 × 10113.5 × 1092.5 × 10122.7 × 1012
Ea, eV0.056(21)0.093(12)0.040(5)0.11(2)0.12(2)
Disclaimer/Publisher’s Note: The statements, opinions and data contained in all publications are solely those of the individual author(s) and contributor(s) and not of MDPI and/or the editor(s). MDPI and/or the editor(s) disclaim responsibility for any injury to people or property resulting from any ideas, methods, instructions or products referred to in the content.