Abstract
The formation of defects, due to drying, in robocasted ceramic objects is an important issue arising from non-uniform shrinkage of the material during this step in the process. Common methods for shrinkage measurement are not well suited to the small size of robocasted cords or the complexity of robocasted objects. Innovative methods for shrinkage measurement were developed using non-destructive optical vision techniques with computer-controlled data acquisition, allowing measurement on millimetric cords and on specific zones of a product. The study of a single porcelain cord revealed an anisometric shrinkage related to the orientation of grains during extrusion. A differential shrinkage at the macroscopic scale was also measured on a robocasted object, indicating a moisture content gradient in the material. The methods presented in this paper are of particular relevance to real-time control of the drying process for robocasted objects.
1. Introduction
Additive manufacturing of ceramics covers a large number of techniques which have been well described in the literature [1,2,3]. The choice of a processing technique depends on parameters such as the size of the object, the dimensional resolution and the cost as well as the ability to produce ceramic parts with the required microstructure and properties in relation to the intended application. The variety of additive manufacturing techniques also corresponds to very different feedstock forms such as powders, slurries, pastes or filaments of ceramic polymer composites. The preparation of raw materials to meet the process requirements is another factor to be considered in the choice of a 3D fabrication technique.
Among these techniques, robocasting, which is a Direct Ink Writing (DIW) technique, was developed in the period 1995–2000 to print complex ceramic parts [4]. The raw material is a paste which is extruded through a small diameter nozzle of typically a few hundred micrometres. The position of the nozzle is controlled by a computer based on a GCODE file generated from a CAD file to produce the ceramic object layer by layer. Robocasting has several advantages, mainly its versatility, ease of use, speed of manufacturing and low equipment and operating costs. Today, a wide variety of ceramic materials can be printed by robocasting for different applications in electronics, energy and medicine [2,5]. In recent years, there has been strong interest in the fabrication of complex ceramic parts with high-performance materials for specialised applications: HAP for bio-medical applications (bone scaffolds) [6,7], SiC for highly thermal-resistant parts [8], Al2O3 for its mechanical strength [9,10] and AlN for heat dissipation in electronic devices [11]. Although a lot of studies focus on technical ceramics due to their remarkable properties, robocasting is also of interest for silicate ceramic materials. Recent work has investigated the formulation of porcelain pastes for 3D printing applications in the tableware industry [12,13]. Robocasting has now become one of the major ceramic printing technologies on the market. Formerly used for rapid prototyping, recent technical breakthroughs, both in terms of paste formulation and process optimisation, have allowed the development of robocasting for the industrial-scale fabrication of finished products.
Even though robocasting offers many advantages, some challenges remain when printing ceramic parts. The major one is the formulation of a ceramic paste to ensure that the rheological properties required for printing remain constant during the entire fabrication process. Another important challenge pointed out by some authors including Cesarano is the drying step [14,15,16]. Robocasting requires ceramic pastes with sufficient plasticity to be extruded through the printer nozzle. The initial amount of water in the pastes must then be sufficiently high to separate grains by a thin film of water so that they can slide in relation to each other. Once the shaping is achieved, complete drying is necessary to ensure that water is removed before firing. During drying, grains approach each other until they are in contact, yielding a shrinkage at the macroscopic scale. This is known to be the most delicate stage of drying because if the shrinkage is not uniform, it can be responsible for drying defects such as warping or cracks. After the shrinkage stage is completed or when it becomes negligible, drying still operates to remove water in the porous network [17,18,19]. Furthermore, an important difference between robocasting and conventional shaping methods is that drying starts during the casting process, meaning that the bottom part of the object starts to dry before the top of the object is extruded. For this reason, Cesarano et al. recommend optimising the drying rate, which needs to be sufficiently high to favour consolidation of the extruded cord and avoid the collapse of the object during printing, but sufficiently low to avoid macroscopic defects due to non-uniform shrinkage [14]. Different strategies have been proposed for a better control of the drying operation in robocasting. With this objective, the simplest way is to adjust and ensure reproducible drying conditions by controlling the air characteristics, i.e., the temperature and the amount of water vapour. Another strategy which has been proposed consists of printing in a liquid oil to prevent evaporation during the layer deposition and to use infrared radiation to dry the deposited layer before extruding a new one. This is called the Ceramic On-Demand Extrusion process [20]. Baltazar et al. compared these two different strategies to control the drying rate. They printed alumina parts in a liquid paraffin bath (followed by infrared drying of each layer) and in air with a relative humidity of 85%. Both methods gave alumina parts with high relative density and good mechanical properties [21].
In addition to the drying conditions, the behaviour of the ceramic paste is of strong importance and should be well characterised to achieve robust and reproducible processing. This requires methods for measuring drying shrinkage. A common practice for measuring shrinkage is to use a position sensor to track the evolution of the height and/or length of the product in 1D. However, recent work by Oummadi et al. presented a method based on tracking marks with an optical camera that allowed shrinkage to be measured precisely in different directions at the same time [22]. The shrinkage evaluated using this image analysis method was compared with values measured using a Linear Variable Differential Transformer (LVDT) sensor for alumina and kaolin pastes. Closely similar curves were obtained when plotting the shrinkage as a function of the water content with the two methods. Nevertheless, existing methods using sensors are not well suited for measurements on cords printed by robocasting due to their small size, low mechanical strength and convex surface. The tracking of marks method would also be difficult to reproduce as it requires placing sub-millimetric marks without altering the surface of the cord. Using marks for measuring shrinkage on robocasted products could cause irreversible damage and yields spatially limited shrinkage measurements.
In view of the challenge of a controlled drying operation in the robocasting process and the importance of the shrinkage that occurs during water removal, in this work we have developed methods for monitoring dimensional variations at different scales, based on image analysis without using marks. At the scale of an extruded cord, the approach provides basic information on the behaviour of the paste during drying which is useful for process parameter adjustment and for the formulation of ceramic pastes. At the scale of an extruded object, differential shrinkage rates are demonstrated. Such information could be used to optimise drying conditions. The article presents the methods and illustrates them with some results of particular interest.
2. Materials and Methods
2.1. Materials and Devices
Two cameras were used for image acquisition during drying. The first one is an IDS UI-1490SE (Obersulm, Germany) with a resolution of 3840 × 2748 pixels mounted with a Kowa LM50JC10M lens (Nagoya, Japan) and the second is an IDS UI-1480SE with a resolution of 2560 × 1920 pixels mounted with an OPTEM Fusion 12.5:1 lens. The scripts used for controlling the cameras and analysing the images were developed using Python and the OpenCV library [23].
The experiments presented in the following sections were made using a commercial porcelain paste formulated for robocasting (Imerys EZPrint3D-E, Paris, France). Thermogravimetric analysis, conducted on dried powder from the paste using a TG-DSC Labsys Evo Setaram system, reveals a 7% mass loss between 450 °C and 700 °C. This can be attributed to the dehydroxylation of kaolinite. Compared with pure kaolinite, where the mass loss due to dehydroxylation is 14%, the weight loss indicates that the powder is made of 50 wt% of kaolinite. Samples (powder and extruded cords) were observed in a Scanning Electron Microscope (SEM) FEI Quanta 450 FEG (Hillsboro, OR, USA). The micrograph of the powder in Figure 1 shows the strongly anisometric kaolinite platelets.
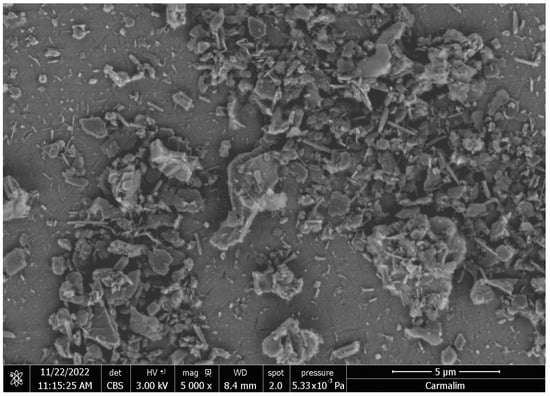
Figure 1.
SEM micrograph of the powder taken from dried porcelain paste EZPrint3D-E.
The products studied in this paper were printed using a ceramic 3D printer WASP 2040 Clay (Massa Lombarda, Italy), mounted with a LDM Wasp Extruder 3.0 and a nozzle with an internal diameter of 1 mm.
2.2. Measuring the Drying Shrinkage of an Individual Robocasted Ceramic Cord
A method was first developed for measuring the drying shrinkage of single ceramic cords obtained through robocasting. Due to their small radius, ranging from 0.4 mm to 2 mm, conventional shrinkage measuring methods were not optimal for obtaining satisfying results on these cords. The new method is non-destructive and relies on taking digital images and analysing them using automated image analysis scripts to obtain shrinkage-over-time plots for both the longitudinal and radial directions.
The experimental apparatus used for measuring the drying shrinkage of the cord is illustrated in Figure 2. The two cameras take pictures of the cord at regular time intervals for the duration of the experiment. Examples of the images taken by camera 1 (IDS UI-1490SE) and camera 2 (IDS UI-1480SE) are shown, respectively, in Figure 3a and Figure 3b. The cord was deposited on a PVC plate coated with a thin layer of graphite by spraying. The graphite coating has two main advantages in this experiment: its mat black finish yields strong contrast between the cord and the plate, which helps when performing image analysis; graphite is also a solid lubricant which reduces the interaction between the cord and the plate [24], thus allowing the cord to shrink without sticking to the plate. A light source is used to illuminate the cord and obtain a better contrast with the plate.

Figure 2.
Experimental apparatus used for measuring the drying shrinkage of an individual robocasted ceramic cord: (a) schematic representation and (b) photograph of the experimental setup.
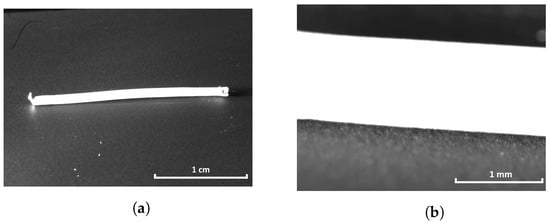
Figure 3.
Examples of images obtained using (a) camera 1 and (b) camera 2.
For this experiment, the cord is extruded freely and separated from the nozzle using a spatula. It is then deposited on a graphite coated plate with particular attention not to add any strain. This method ensures that little to no extra deformation is incurred by the cord that could potentially reduce the quality of the results. The cord is extruded at a rate of 1 cm/s for the preliminary results, and at 1.5 cm/s and 2 cm/s to investigate the effect of the extrusion rate on drying shrinkage.
After drying is complete, two sets of images are obtained: one for each camera. A Python script is then used to measure the dimensions of the cord on each image. The algorithms used to analyse each set of images are different, but they both start by processing the images in the same manner. Each image is first truncated, converted to grayscale and then blurred. A threshold is then applied before performing a contour analysis using the algorithm proposed by Suzuki et al. [25]. These steps are illustrated in Figure 4. The length of the cord is obtained by placing the minimum bounding rectangle on the contour (red), as shown in Figure 5, and then measuring its length.

Figure 4.
Examples of images obtained after (a) thresholding and (b) after contour analysis (the contour of the cord is highlighted in red).

Figure 5.
Example of a minimum bounding rectangle (in red) placed over the image of a robocasted cord, used to evaluate the length.
To obtain an accurate value for the diameter of the cord, five measurements are made, distributed over the visible part of the cord. To achieve this, the script places five equally spaced virtual markers on the top part of the contour, searches for the closest point on the bottom part of the contour for each of them, and computes the distance between the top and bottom points as is illustrated in Figure 6. The value for the diameter is obtained using the mean of the five measurements. This spatially averaged value significantly reduces the measurement noise.
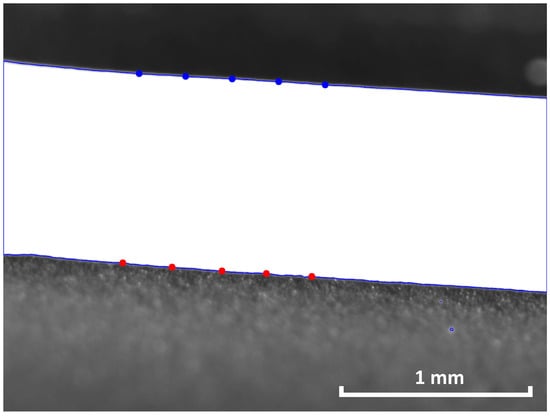
Figure 6.
Example of virtual markers placed over the image of a robocasted cord to evaluate the diameter.
Once the values for both length and diameter are obtained for the whole duration of drying, the longitudinal and radial shrinkages are calculated using the following relation:
where L is the dimension at time t and is the initial dimension.
2.3. Measuring the Drying Shrinkage of a Robocasted Ceramic Product
The method presented in this section was developed to measure the drying shrinkage of complete robocasted ceramic products throughout the drying process in a non-destructive manner. Similarly to the previously described method, this one also relies on image analysis using a camera and Python scripts. The measurement of shrinkage relies on an automatic detection of cords by taking advantage of the unique surface topology of robocasted products, allowing the size of the cords to be tracked over time.
The experimental apparatus used to measure the shrinkage of the products is illustrated in Figure 7. The camera (IDS UI-1490SE) captures images of the product at regular time intervals throughout its drying period and a light source is used to illuminate the product and highlight the interfaces between the individual cords. An example of an image taken during drying is shown in Figure 8. Each image is analysed using an algorithm written in Python to compute the size of each cord.

Figure 7.
Experimental apparatus used to capture images of the drying product.
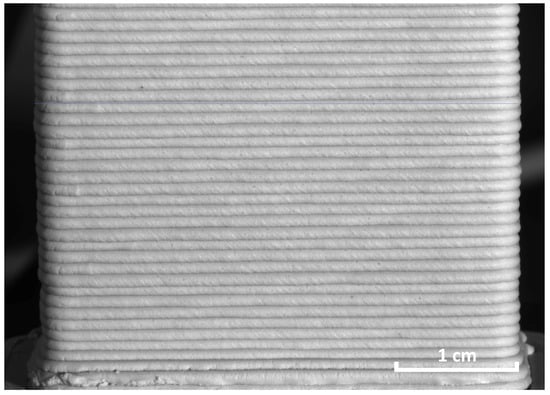
Figure 8.
Example of an image of the drying product captured using the apparatus described in Figure 7.
Before analysis, each image is processed to highlight the interfaces between cords. The image is first rotated so that the cords are horizontal. The zone of interest for the study is then selected by the user and will be applied to all subsequent images. The image is then converted to grayscale and blurred in order to reduce the noise and facilitate detection of the interfaces. The interfaces are identified using the canny edge detection technique [26]. This algorithm detects brutal variations in the pixel intensity gradient to extract the edges in an image. The canny edge detection technique is used in a wide variety of computer vision systems and provides a reliable tool for investigating, e.g., micro-cracks or particle size distribution [27,28]. An example of an image after processing is shown in Figure 9.
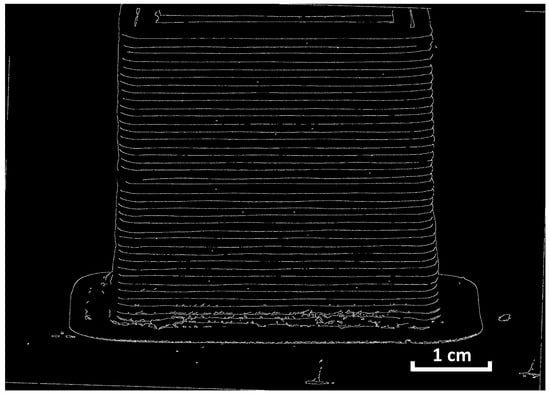
Figure 9.
Example of an image of the drying product after processing.
The interfaces are then detected using an algorithm that computes a histogram of the white pixel density over the height of the image. Each peak in the histogram corresponds to an interface in the image and the height of each cord corresponds to the distance between the successive interfaces. The analysis of each image taken during the drying of a product is used for tracking the drying shrinkage of either the product as a whole or only for a zone of interest on its surface.
For this experiment, the products are printed with a 1 mm nozzle and a layer height of 0.8 mm. The extrusion rate is set at 1 cm/s.
3. Results and Discussion
The methods presented in the previous section were used to study the drying shrinkage of several robocasted green-body porcelain parts.
3.1. Drying Shrinkage of a Robocasted Ceramic Cord
The cord was dried at room temperature and ambient relative humidity. Its dimensions were measured throughout drying using the previously described method. The drying shrinkages in both the longitudinal and radial directions are shown in Figure 10. A difference in final shrinkage can be observed in both directions with 3.8% in longitudinal shrinkage and 5.7% in radial shrinkage. These results are consistent with analysis by hand of the starting and finishing images of the drying surface using an image editor to evaluate the total amount of shrinkage. A hypothesis to explain this difference in behaviour depending on the measuring direction could be the orientation of the kaolinite platelets during extrusion due to the shear stress created by the nozzle. The platelets are preferentially oriented to lie parallel to the longitudinal direction [29]. Consequently, the number of liquid/solid interfaces per unit length is higher in the radial direction. Thus, as water evaporates from the material and the platelets approach each other, the shrinkage is higher in the radial direction. Additional experiments were conducted to test the effect of adhesion with the support. A very similar behaviour was observed for a cord deposited on a support coated with oil instead of graphite. However, when the cord is extruded directly on the support without coating, the longitudinal shrinkage is strongly inhibited (less than 1%) while the radial shrinkage remains identical to approx. 6%. This leads to the conclusion that the adhesion interaction between the cord and the support has a strong influence on the longitudinal shrinkage but a negligible effect in the radial direction.
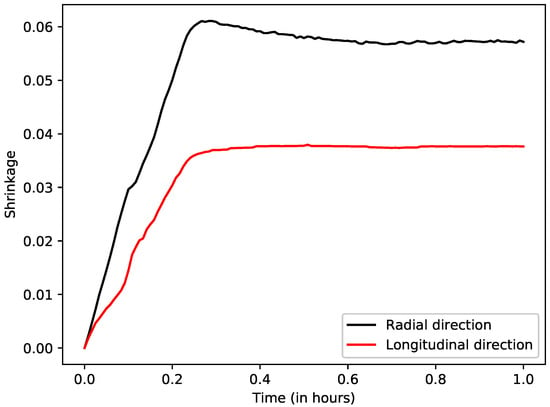
Figure 10.
Drying shrinkage of a porcelain cord in both the longitudinal and radial direction as a function of time.
SEM images of a slice across the cord and of the external surface of the cord are shown in Figure 11. The slice corresponds to a fracture of a cord, made by hand, where the observation surface is perpendicular to the direction of extrusion while the external surface of the cord is parallel to the extrusion direction. The slice, displayed in Figure 11a, reveals a general orientation of the platelets in the extrusion direction as mostly edges are visible. This orientation is confirmed by the micrograph of the surface of the cord in Figure 11b, where only the basal surfaces of the platelets can be observed. Similar results on platelet orientation have been reported by Feilden et al. for cords with 70 wt% of alumina platelets, with the advantage of improving the mechanical behaviour of ceramic products [30]. The effect of kaolinite grain orientation on drying shrinkage anisotropy was also reported by Oummadi et al. when comparing the shrinkage in three orthogonal directions measured on pressed kaolin paste samples prepared from a powder containing 78 wt% of kaolinite [22]. The total amount of shrinkage in the pressing direction (11% related to the dry length) is reported to be 1.8 times greater than in directions perpendicular to the pressing axis (6%). Compared to this ratio of 1.8, the value presented in Figure 10 leads to an anisotropy ratio of 1.5. This lower value could be explained by the lower amount of kaolinite (50wt % in the present study) and differences in the aspect ratio of the individual kaolinite platelets.
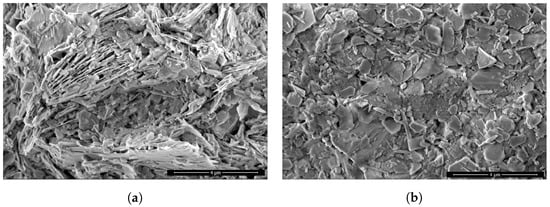
Figure 11.
SEM micrographs of a dried porcelain cord. (a) A cut perpendicular to the extrusion axis and (b) along its surface.
It can also be noted in Figure 10 that a swelling occurs at the end of the drying shrinkage, after 0.3 h, in the radial direction. One hypothesis is that this behaviour is due to the orientation of the platelets in the direction of extrusion. As water evaporates, liquid bridges appear in between the platelets, as illustrated in Figure 12. The pressure difference at the meniscus interfaces and the forces due to the water surface tension (at the solid/liquid/air line) produce the capillary forces that pull the grains together [31]. During the shrinkage stage, these forces are continuously balanced by repulsive forces that originate from surface charges on the solid grains [32]. After the major shrinkage is achieved, water in the bridges evaporates and the capillary forces decrease, causing a local reorganisation of the grains, due to repulsive contribution, leading to the swelling observed in the experiment [33]. Figure 12 illustrates this hypothesis. This phenomenon was also observed by other authors and reported by Onoda et al. when analysing the volume–weight relations in ceramic particulate systems encountered in processing [34,35].
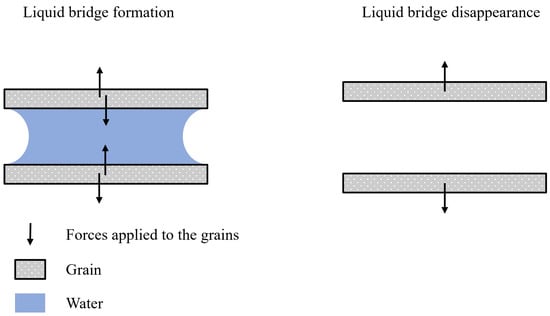
Figure 12.
Schematic representation of a liquid bridge and the resulting forces.
Further experiments were conducted by varying the extrusion rate. Due to the extrusion technology used by the machine (a screw extruder fed by an external tank under 6 bar of pressure) a stable extrusion rate is difficult to obtain outside of a working range of 1.0 to 2.0 cm/s. Three extrusion rates were investigated and each measurement was repeated three times to account for the difficulty in obtaining stable extrusion rates. The radial shrinkage as a function of the extrusion rate is reported in Figure 13. Longitudinal shrinkage is not shown here as there was too much variation due to interactions with the support.
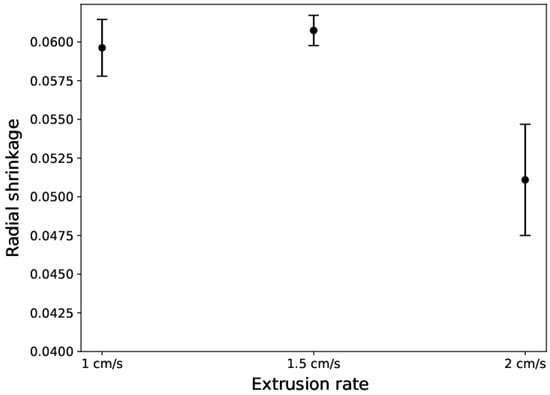
Figure 13.
Radial shrinkage of an extruded cord as a function of the extrusion rate.
Radial shrinkage seems to be constant up to an extrusion rate of 1.5 cm/s and then diminishes at 2.0 cm/s. Taking into account that all the cords were dried on the same support at similar ambient drying conditions, variations in drying shrinkage can be attributed to the effect of the extrusion rate. Assuming that volumic shrinkage is identical for all samples, these results indicate a decrease in drying shrinkage anisotropy in the cords extruded at a rate greater than 1.5 cm/s. In their work, Feilden et al. explain that the orientation of anisometric grains during extrusion is dependent on the duration of exposure to the velocity gradient in the extrusion die [30]. As extrusion rate increases, the duration for which any given grain is inside of the extrusion die decreases, thus reducing the probability of it being oriented in the extrusion direction. The decrease in shrinkage anisotropy may also be caused by a disappearance of the velocity gradient. When the extrusion rate exceeds a threshold value, the laminar flow with a velocity gradient can transform into a plug flow where the velocity is almost uniform.
3.2. Drying of a Complete Robocasted Product
A tower-shaped product of 40 × 20 × 40 mm3 with 5 mm thick walls was printed and then dried in the experimental apparatus shown in Figure 7. The product was subjected to ambient drying conditions with an air temperature of 18 °C and a relative humidity of 55%. Its mass was tracked using a precision balance and images were taken every minute until the mass was stabilised. The images were then analysed using the methodology described in Section 2.3. Drying shrinkage was measured in two zones of interest: the first one close to the bottom of the product and the second one close to the top, displayed in Figure 14a. One hypothesis is that the shape of the product, displaying a cavity, would yield a difference in drying rate along its height.
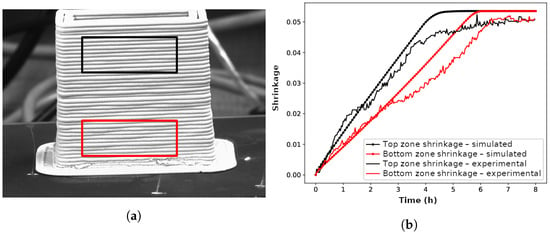
Figure 14.
(a) Image of the studied ceramic product with highlighted zones of interest (in red for the bottom and in black for the top of the object) and (b) drying shrinkage over time for both zones of interest.
Drying shrinkage over time is shown in Figure 14b for both zones of interest. The total drying shrinkage of the product is around 5%, and was achieved after 6 h 30 min of drying time. However, a clear difference in drying rate can be observed between the top and bottom zones. As drying shrinkage is intimately linked to the moisture content of the material, this disparity could reflect the existence of a moisture content gradient in the vertical direction. It can be noted that for the first 15 min both zones of interest display similar drying rates before diverging. This differential shrinkage between the bottom and the top of the object might be explained by the difference in the drying conditions over the height of the internal surface. It can be assumed that the relative humidity inside the cavity increases from the top to the bottom due to evaporation and poor air circulation.
In a previous work, a computer model of the drying behaviour of ceramic green bodies combining heat and mass transfers, boundary conditions for water evaporation and moisture-dependent properties was developed [36]. This model was expanded to include drying shrinkage using the Lagrangian method, which allows the geometry of the drying body to change according to its water content [37]. The experiment presented in this section was reproduced using this computer model. For these calculations, the external surfaces were subjected to convective drying conditions with the experimental ambient air characteristics while the internal surfaces were subjected to increasing relative humidity starting from 55% at the top to 90% at the bottom of the cavity in an effort to simulate the stagnant air inside the cavity. The drying shrinkage was tracked over time in the same two zones as in the experiment and the results of the simulation are displayed in Figure 14b. The predicted shrinkage curves are in good agreement with the experimental data, which is consistent with the assumption that differences in drying conditions can lead to a differential shrinkage along the height of the object.
The measurement noise observed in Figure 14b is explained by the small size of the cords in relation to the resolution of the camera. For a given image, each cord has a height of around 100 pixels meaning that small variations in size on a single cord may not be picked up by the algorithm. However, the general drying shrinkage behaviour as well as the key values are clearly visible in the graph.
It would now be interesting to place the methods developed in a more general context of existing tools for monitoring drying shrinkage. Several methods and devices have been described in the literature to evaluate drying shrinkage. The simplest method consists of measuring the distance between marks before and after drying using a caliper. The marks can be made with a gauge or a knife on a sufficiently long sample (~100 mm) to achieve a good accuracy, as described in the standard test method recommended for measuring drying shrinkage of ceramic whiteware clays [38]. The barelatograph is another device that can be used to follow dimensional variations in one dimension, by means of a small metal bar in contact with the sample. It is used for plotting Bigot curves representing the water content as a function of shrinkage. This method has been used to investigate drying behaviour in traditional but also technical ceramics [34,39]. Other devices which can be implemented for computer monitoring have also been used to track the evolution of the dimension of ceramic green bodies in 1D, for example LVDT or laser sensors [22,40]. In recent years, image analysis techniques have been used to investigate shrinkage during drying. Tracking marks and Digital Image Correlation (DIC) have successfully been implemented to measure drying shrinkage in concrete materials [22,41,42]. The DIC technique yields evaluation of shrinkage fields with a high accuracy, but it requires a speckled pattern to be coated on the sample surface. For green bodies made of several materials with different colours, the natural contrast of the surface can provide the required speckle; otherwise, a powder or a paint has to be sprinkled over the surface of the sample, which makes this technique more complicated because the added material can also interact with the drying process. Therefore, the proposed method seems to be a good compromise to follow shrinkage in different zones of a printed object without any interaction with the product and with a sufficient accuracy to highlight differences in shrinkage rate.
4. Perspectives on Real-Time Measurements of Drying Shrinkage for Robocasted Products
The previous methods were developed to measure drying shrinkage once the drying process is over and all the images have been taken. However, one of the main advantages of this kind of method is its ability to be deployed to measure shrinkage in real time. A precise control of the drying shrinkage could then be achieved by taking preventive actions during drying in order to avoid the occurrence of defects such as cracking or warping. A Python script was developed to measure the shrinkage of a product during drying and provide a real-time feedback to the user in the form of an updating shrinkage-over-time plot. This method is largely based on the experimental apparatus presented in the previous section for image acquisition and analysis with a modified workflow. The operating principle of this method is summarized in Figure 15.
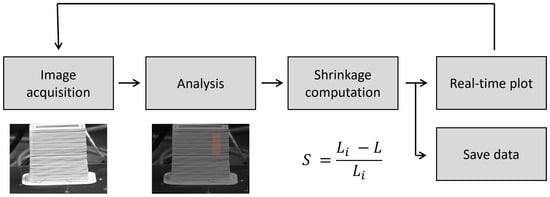
Figure 15.
Operating principle of the method used to measure the drying shrinkage in real-time.
The real-time measurement method was used to track the drying shrinkage of a complete product during drying in a climatic chamber. A tower-shaped product of 40 × 20 × 40 mm3 with 5 mm thick walls was placed in the chamber and the camera was placed in front of the window. The climatic chamber was modified so that mass measurements of the sample, placed inside, could be made.
The product was dried at a temperature of 30 °C and a relative humidity of 40%. The shrinkage-versus-time plot, displayed in Figure 16, was updated in real time. This graph gives valuable information to a user about the drying state of the product as well as the exact time at which drying shrinkage is complete. Once shrinkage is completed, the risk of defects in the product, such as cracking or warping due to uncontrolled drying, is severely reduced.
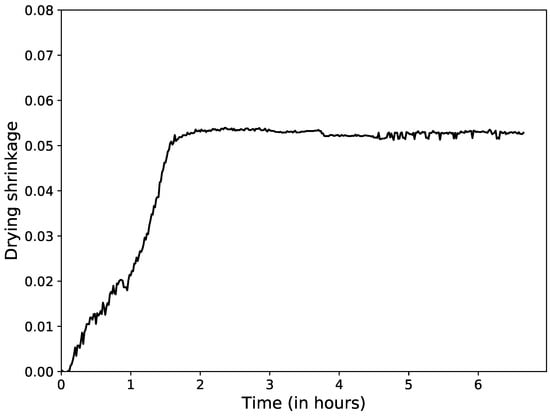
Figure 16.
Drying shrinkage versus time of a tower-shaped product, measured and displayed in real time.
Another method for detecting the end of drying shrinkage in real time was proposed in a recent paper by Nait-Ali et al., making use of a convolutional neural network. The algorithm was trained using images taken from experiments on drying robocasted objects to identify the presence of water on the drying surface. This absence of water on the surface corresponds to the end of the drying shrinkage stage. Such precise information can then be used to modify the drying process [43].
5. Conclusions
New methods relying on digital images for measuring drying shrinkage in robocasted ceramic parts have been developed. Each of the two methods presented allow information to be gathered at different scales, from a single cord to a complete part, in a non-destructive manner. A single robocasted porcelain cord of 1mm radius was studied, revealing a clear anisotropy in drying shrinkage between the radial and longitudinal directions at 5.7% and 3.8%, respectively. This was explained by an orientation of the kaolinite platelets in the paste during its extrusion. A difference in drying shrinkage was also observed for different zones of a complete product exhibiting an open cavity. This was explained by the geometry of the part inhibiting airflow and causing unequal drying conditions along the height of the product. Having observed this phenomenon in a simple product, we conclude that drying shrinkage must be taken into account in the design phase of robocasted parts.
The digital methods for measuring shrinkage have the important advantage that they do not harm the products or disturb the drying process. In situ measurement of shrinkage could offer robust information for real-time fine control of the drying process for robocasted products, reducing the appearance of defects and the cost of fabrication. Specific adjustments to drying conditions, in terms of temperature, relative humidity or air flow, could be made by leveraging the methods presented in this paper to identify differences in shrinkage and correct them in real time.
Author Contributions
Conceptualisation, N.L., A.A., B.N.-A. and D.S.S.; methodology, N.L.; software, N.L. and A.A.; investigation, N.L.; resources, B.N.-A. and D.S.S.; data curation, N.L.; writing—original draft preparation, N.L.; writing—review and editing, B.N.-A., D.S.S. and A.A.; visualisation, N.L.; supervision, D.S.S., B.N.-A. and A.A.; project administration, D.S.S.; funding acquisition, D.S.S., A.A. and B.N.-A. All authors have read and agreed to the published version of the manuscript.
Funding
This research was funded by the Nouvelle-Aquitaine region, grant number 2019-1R10309.
Institutional Review Board Statement
Not applicable.
Informed Consent Statement
Not applicable.
Data Availability Statement
All data will be made available upon request.
Acknowledgments
We would like to thank Imerys Tableware France for the donation of EZPrint3D-E porcelain paste for robocasting.
Conflicts of Interest
The authors declare no conflicts of interest. The funders had no role in the design of the study; in the collection, analyses or interpretation of data; in the writing of the manuscript; or in the decision to publish the results.
References
- Deckers, J.; Vleugels, J.; Kruthl, J. Additive Manufacturing of Ceramics: A Review. J. Ceram. Sci. Technol. 2014, 5, 245–260. [Google Scholar] [CrossRef]
- Chen, Z.; Li, Z.; Li, J.; Liu, C.; Lao, C.; Fu, Y.; Liu, C.; Li, Y.; Wang, P.; He, Y. 3D printing of ceramics: A review. J. Eur. Ceram. Soc. 2019, 39, 661–687. [Google Scholar] [CrossRef]
- Zocca, A.; Franchin, G.; Colombo, P.; Günster, J. Additive Manufacturing. Encycl. Mater. Tech. Ceram. Glas. 2021, 1, 203–221. [Google Scholar] [CrossRef]
- Cesarano, J.; Denham, H.; Stuecker, J.; Baer, T.; Griffith, M. Freeforming of Ceramics and Composites from Colloidal Slurries; U.S. Department of Energy, Office of Scientific and Technical Information: Oak Ridge, TN, USA, 1999. [CrossRef]
- Paterlini, A.; Le Grill, S.; Brouillet, F.; Combes, C.; Grossin, D.; Bertrand, G. Robocasting of self-setting bioceramics: From paste formulation to 3D part characteristics. Open Ceram. 2021, 5, 100070. [Google Scholar] [CrossRef]
- Mirkhalaf, M.; Men, Y.; Wang, R.; No, Y.; Zreiqat, H. Personalized 3D printed bone scaffolds: A review. Acta Biomater. 2022, 156, 110–124. [Google Scholar] [CrossRef]
- Monfared, M.H.; Nemati, A.; Loghman, F.; Ghasemian, M.; Farzin, A.; Beheshtizadeh, N.; Azami, M. A deep insight into the preparation of ceramic bone scaffolds utilizing robocasting technique. Ceram. Int. 2022, 48, 5939–5954. [Google Scholar] [CrossRef]
- Boretti, A.; Castelletto, S. A perspective on 3D printing of silicon carbide. J. Eur. Ceram. Soc. 2024, 44, 1351–1360. [Google Scholar] [CrossRef]
- Gourdonnaud, D.; Pateloup, V.; Junger, A.; Bourret, J.; Chartier, T.; Geffroy, P.M. Correlation between filament deposition path, microstructural and mechanical properties of dense alumina parts printed by robocasting. J. Eur. Ceram. Soc. 2024, 44, 1027–1035. [Google Scholar] [CrossRef]
- Maillard, M.; Chevalier, J.; Gremillard, L.; Baeza, G.P.; Courtial, E.J.; Marion, S.; Garnier, V. Optimization of mechanical properties of robocast alumina parts through control of the paste rheology. J. Eur. Ceram. Soc. 2023, 43, 2805–2817. [Google Scholar] [CrossRef]
- Belmonte, M.; Lopez-Navarrete, G.; Osendi, M.I.; Miranzo, P. Heat dissipation in 3D printed cellular aluminum nitride structures. J. Eur. Ceram. Soc. 2021, 41, 2407–2414. [Google Scholar] [CrossRef]
- Pires, L.; Luís, J.; Fernandes, M.; Oliveira, M. Controlling properties of ceramic formulations for porcelain robocasting. Ceram. Int. 2023, 49, 4764–4774. [Google Scholar] [CrossRef]
- Wu, Y.; Lan, J.; Wu, M.; Zhou, W.; Zhou, S.; Yang, H.; Zhang, M.; Li, Y. Rheology and Printability of a Porcelain Clay Paste for DIW 3D Printing of Ceramics with Complex Geometric Structures. ACS Omega 2024, 9, 26450–26457. [Google Scholar] [CrossRef]
- Cesarano, J.; Baer, T.A.; Calvert, P. Recent developments in freeform fabrication of dense ceramics from slurry deposition. In Proceedings of the 1997 International Solid Freeform Fabrication Symposium, Austin, TX, USA, 11–13 August 1997. [Google Scholar]
- Lamnini, S.; Elsayed, H.; Lakhdar, Y.; Baino, F.; Smeacetto, F.; Bernardo, E. Robocasting of advanced ceramics: Ink optimization and protocol to predict the printing parameters—A review. Heliyon 2022, 8, e10651. [Google Scholar] [CrossRef]
- Feilden, E.; Glymond, D.; Saiz, E.; Vandeperre, L. High temperature strength of an ultra high temperature ceramic produced by additive manufacturing. Ceram. Int. 2019, 45, 18210–18214. [Google Scholar] [CrossRef]
- Scherer, G.W. Theory of Drying. J. Am. Ceram. Soc. 1990, 73, 3–14. [Google Scholar] [CrossRef]
- Brosnan, D.; Robinson, G. Introduction to Drying of Ceramics: With Laboratory Exercises; Wiley: Hoboken, NJ, USA, 2003. [Google Scholar]
- Ford, R.W. Ceramics Drying; Elsevier: Amsterdam, The Netherlands, 1986. [Google Scholar]
- Ghazanfari, A.; Li, W.; Leu, M.; Hilmas, G. A novel extrusion-based additive manufacturing process for ceramic parts. In Proceedings of the 27th Annual International Solid Freeform Fabrication Symposium, Austin, TX, USA, 8–10 August 2016. [Google Scholar]
- Baltazar, J.; Torres, P.; de Oliveira, J.D.; da Cruz, J.P.; Gouveia, S.; Olhero, S. Influence of filament patterning in structural properties of dense alumina ceramics printed by robocasting. J. Manuf. Process. 2021, 68, 569–582. [Google Scholar] [CrossRef]
- Oummadi, S.; Nait-Ali, B.; Alzina, A.; Paya, M.C.; Gaillard, J.M.; Smith, D.S. Optical method for evaluation of shrinkage in two dimensions during drying of ceramic green bodies. Open Ceram. 2020, 2, 100016. [Google Scholar] [CrossRef]
- Itseez. Open Source Computer Vision Library. 2015. Available online: https://github.com/itseez/opencv (accessed on 1 January 2020).
- Shaji, S.; Radhakrishnan, V. An investigation on surface grinding using graphite as lubricant. Int. J. Mach. Tools Manuf. 2002, 42, 733–740. [Google Scholar] [CrossRef]
- Suzuki, S.; be, K. Topological structural analysis of digitized binary images by border following. Comput. Vis. Graph. Image Process. 1985, 30, 32–46. [Google Scholar] [CrossRef]
- Canny, J. A Computational Approach to Edge Detection. In Readings in Computer Vision; Fischler, M.A., Firschein, O., Eds.; Morgan Kaufmann: San Francisco, CA, USA, 1987; pp. 184–203. [Google Scholar]
- Gayathri Monicka, S.; Manimegalai, D.; Karthikeyan, M. Detection of microcracks in silicon solar cells using Otsu-Canny edge detection algorithm. Renew. Energy Focus 2022, 43, 183–190. [Google Scholar] [CrossRef]
- Meng, Y.; Zhang, Z.; Yin, H.; Ma, T. Automatic detection of particle size distribution by image analysis based on local adaptive canny edge detection and modified circular Hough transform. Micron 2018, 106, 34–41. [Google Scholar] [CrossRef]
- Dietemann, B.; Wahl, L.; Travitzky, N.; Kruggel-Emden, H.; Kraft, T.; Bierwisch, C. Reorientation of Suspended Ceramic Particles in Robocasted Green Filaments during Drying. Materials 2022, 15, 2100. [Google Scholar] [CrossRef]
- Feilden, E.; Ferraro, C.; Zhang, Q.; García-Tuñón, E.; D’Elia, E.; Giuliani, F.; Vandeperre, L.; Saiz, E. 3D Printing Bioinspired Ceramic Composites. Sci. Rep. 2017, 7, 13759. [Google Scholar] [CrossRef]
- Rossetti, D.; Pepin, X.; Simons, S.J. Rupture energy and wetting behavior of pendular liquid bridges in relation to the spherical agglomeration process. J. Colloid Interface Sci. 2003, 261, 161–169. [Google Scholar] [CrossRef]
- Norton, F.H. Fundamental Study of Clay: VIII, a New Theory for the Plasticity of Clay-Water Masses. J. Am. Ceram. Soc. 1948, 31, 236–240. [Google Scholar] [CrossRef]
- Mielniczuk, B.; Hueckel, T.; El Youssoufi, M.S. Laplace pressure evolution and four instabilities in evaporating two-grain liquid bridges. Powder Technol. 2015, 283, 137–151. [Google Scholar] [CrossRef]
- Tarì, G.; Ferreira, J.M.F.; Lyckfeldt, O. Influence of the Stabilising Mechanism and Solid Loading on Slip Casting of Alumina. J. Eur. Ceram. Soc. 1998, 18, 479–486. [Google Scholar] [CrossRef]
- Onoda, G.Y., Jr. Specific Volume Diagrams for Ceramic Processing. J. Am. Ceram. Soc. 1983, 66, 297–301. [Google Scholar] [CrossRef]
- Lauro, N.; Oummadi, S.; Alzina, A.; Nait-Ali, B.; Smith, D.S. Computer model of drying behaviour of ceramic green bodies with particular reference to moisture content dependent properties. J. Eur. Ceram. Soc. 2021, 41, 7321–7329. [Google Scholar] [CrossRef]
- Lauro, N. Caractérisation et Modélisation des Retraits de Séchage dans le Procédé de Microextrusion d’une Pâte Céramique. Ph.D. Thesis, IRCER—Institut de Recherche sur les CERamiques, Limoges, France, 2023. [Google Scholar]
- ASTM C326-09; Standard Test Method for Drying and Firing Shrinkages of Ceramic Whiteware Clays ASTM C326-09. ASTM: West Conshohocken, PA, USA, 2014.
- Pardo, F.; Jordan, M.M.; Montero, M.A. Ceramic behaviour of clays in Central Chile. Appl. Clay Sci. 2018, 157, 158–164. [Google Scholar] [CrossRef]
- Kiennemann, J.; Chartier, T.; Pagnoux, C.; Baumard, J.; Huger, M.; Lamérant, J. Drying mechanisms and stress development in aqueous alumina tape casting. J. Eur. Ceram. Soc. 2005, 25, 1551–1564. [Google Scholar] [CrossRef]
- Mauroux, T.; Benboudjema, F.; Turcry, P.; Aït-Mokhtar, A.; Deves, O. Study of cracking due to drying in coating mortars by digital image correlation. Cem. Concr. Res. 2012, 42, 1014–1023. [Google Scholar] [CrossRef]
- Ylmaztürk, F.; Kulur, S.; Pekmezci, B.Y. Measurement of shrinkage in concrete samples by using digital photogrammetric methods. In Proceedings of the International Archives of the Photogrammetry, Remote Sensing and Spatial Information Sciences—ISPRS Archives, Istanbul, Turkey, 12–23 July 2004; Volume 35, pp. 258–261. [Google Scholar]
- Nait-Ali, B.; Alzina, A.; Lauro, N.; Smith, D.S. Perspectives in drying of ceramics. Open Ceram. 2024, 17, 100554. [Google Scholar] [CrossRef]
Disclaimer/Publisher’s Note: The statements, opinions and data contained in all publications are solely those of the individual author(s) and contributor(s) and not of MDPI and/or the editor(s). MDPI and/or the editor(s) disclaim responsibility for any injury to people or property resulting from any ideas, methods, instructions or products referred to in the content. |
© 2024 by the authors. Licensee MDPI, Basel, Switzerland. This article is an open access article distributed under the terms and conditions of the Creative Commons Attribution (CC BY) license (https://creativecommons.org/licenses/by/4.0/).