Abstract
Precipitation of nanopowders with mixed magnetite–maghemite composition was carried out under different conditions and with different separation techniques. The exact character of interactions of different iron oxide phases in the nanopowder was the main object of interest. The obtained nanopowders have spherical particles about 10–20 nm in size. Electron paramagnetic resonance (EPR) study showed that iron ions incorporate fully into magnetite and maghemite structures. The shape of the EPR line points out that single homogenous solid solutions were formed during synthesis. In the studied solid solutions, different ratios of vacancies and Fe2+/Fe3+ ratios were observed but in spite of different synthesis techniques in both cases, there were no additional diamagnetic structural phases presented.
1. Introduction
Iron oxides have been known for a long time but they still attract definite attention [1,2,3]. Magnetic iron oxides (magnetite Fe3O4 and maghemite γ-Fe2O3) possess a wide range of useful properties. Their nanoparticles can be used as magnetic agents in medicine and biology for marking biomaterials, for penetrating cells of living organisms, or for local heating [3,4,5,6,7,8,9]. They also can be photocatalytically active [10], and can be used in agriculture as bioactive fertilizers [11,12,13].
Magnetite (Fe3O4) is ferrimagnetic at room temperature. The paramagnetic/ferrimagnetic transition temperature for bulk samples, TN, equals 858 K [14]. This temperature can go down to ~600 K for 10 nm nanoparticles and to ~450 K for 6-nm-sized nanoparticles [15]. The Verwey transition (structural phase transition) at T~123–125 K is also known [16]. Structural ordering of the positions of Fe3+ and Fe2+ ions occurs at this temperature. Maghemite (γ-Fe2O3) is ferrimagnetic with the phase transition from TN = 545 K for 5 nm nanoparticles and up to TN = 918 K [17] for bulk materials [18]. Koksharov et al. [19] discovered the transition of maghemite to the spin glass state is at T = 40 K. A possible component of the FeO solid solution is a ferrimagnet with the Néel temperature TN = 198 K and TC = 570 K [20].
It is worth noting that magnetite and maghemite both share a spinel structure type and elemental composition; therefore, their nanoparticles have close physical and mechanical properties. Because of that, there is a definite problem of phase distinction. Magnetite nanoparticles can oxidize to maghemite during a wet precipitation synthesis process or after the synthesis during aging [21,22]. Oxidation can also occur partially, which leads to the appearance of core-shell nanoparticles [22,23]. Usual methods for phase identification in such systems are X-ray diffraction, FTIR, and Mossbauer spectroscopy [24,25,26].
But, even if the magnetite/maghemite ratio in the nanopowder is established, it is still difficult to determine the nature of the composition: solid solution, mechanical mixture, a gradient diffusion structure, or a core-shell structure. The electron paramagnetic resonance (EPR) method was used in the present work for this purpose. Magnetite and maghemite are ferrimagnets at room temperature, and all Fe2+ and Fe3+ ions are coupled by exchange interactions in magnetically ordered structures; therefore, the resulting broad line in the EPR spectrum is the line of ferrimagnetic resonance of magnetic nanoparticles. In this case, a cluster of magnetic nanoparticles with individual magnetic moments behaves like a paramagnet; such a substance can be called a superparamagnet. An analysis of the EPR lines in superparamagnets makes it possible to conclude whether the studied magnetic compound is a solid solution or a mixture of different phases (FeO, Fe2O3). In the case of a mixture of different phases, the EPR spectrum should be a superposition of signals from different phases. The aim of this study was the synthesis of ferrimagnetic nanoparticles of maghemite and magnetite using a technologically simple method of chemical precipitation from aqueous solutions and the determination of the exact type of interaction between magnetite/maghemite phases in the nanopowders.
2. Materials and Methods
Iron oxide nanopowders were synthesized using wet coprecipitation according to the previously reported method and the literature data [1,11,27,28,29]. All the reactants used in syntheses were puriss p.a. grade (99%), manufactured by “NevaReactiv”.
Magnetite (sample № 17) was prepared as follows. A total of 0.1 mol (35.45 g) of FeCl3x6H2O and 0.05 (9.95 g) mol of FeCl2x4H2O were mixed in 100 mL of distilled water and then bubbled with Ar for 1 h (0.2 L/min) to remove oxygen from the solution. Then, precipitation with 100 mL of 6.25% NH4OH solution was carried out dropwise under constant Ar bubbling and at 60 °C temperature.
Maghemite (sample № 87) was prepared in similar way. A mix of solutions of iron chlorides was precipitated with 50 mL 12.5% NH4OH solution under ultrasonication (US-bath, 400 W, Vilitek, Russia).
Resulting substances were extracted from the solution by magnetic separation, then washed with distilled water, and dried in air at 100 °C.
Morphology of nanoparticles was studied using high-resolution transmission electron microscopy (HR-TEM) with Zeiss Libra 120 microscope.
X-ray diffraction was used to determine phase composition of the nanopowders. Measurements were made with Bruker D8-Advance diffractometer (CuKα-radiation, 2θ = 20–80°, step 0.0075°, exposition time 7 s). Unit cell parameters were calculated with PDWin 3.0 software. Crystal Scattering Domain (CSD) lengths were calculated with Scherrer equation using 002 reflex.
Electron paramagnetic resonance (EPR) study was also exploited to investigate magnetic properties of these magnetic nanoparticles. The EPR spectrometer Bruker Elexsys E580 (X-BAND) was used to study the nanoparticles of magnetite (sample № 17) and maghemite (sample № 87) at 100 and 295 K. As far as volumetric factors (sample amount and shape) that can affect the EPR signal in magnetically ordered samples, spectra of samples were measured without treatment and compared with spectra after diamagnetic dilution in high-purity diamagnetic quartz, in the ratio 1:10.
3. Results and Discussion
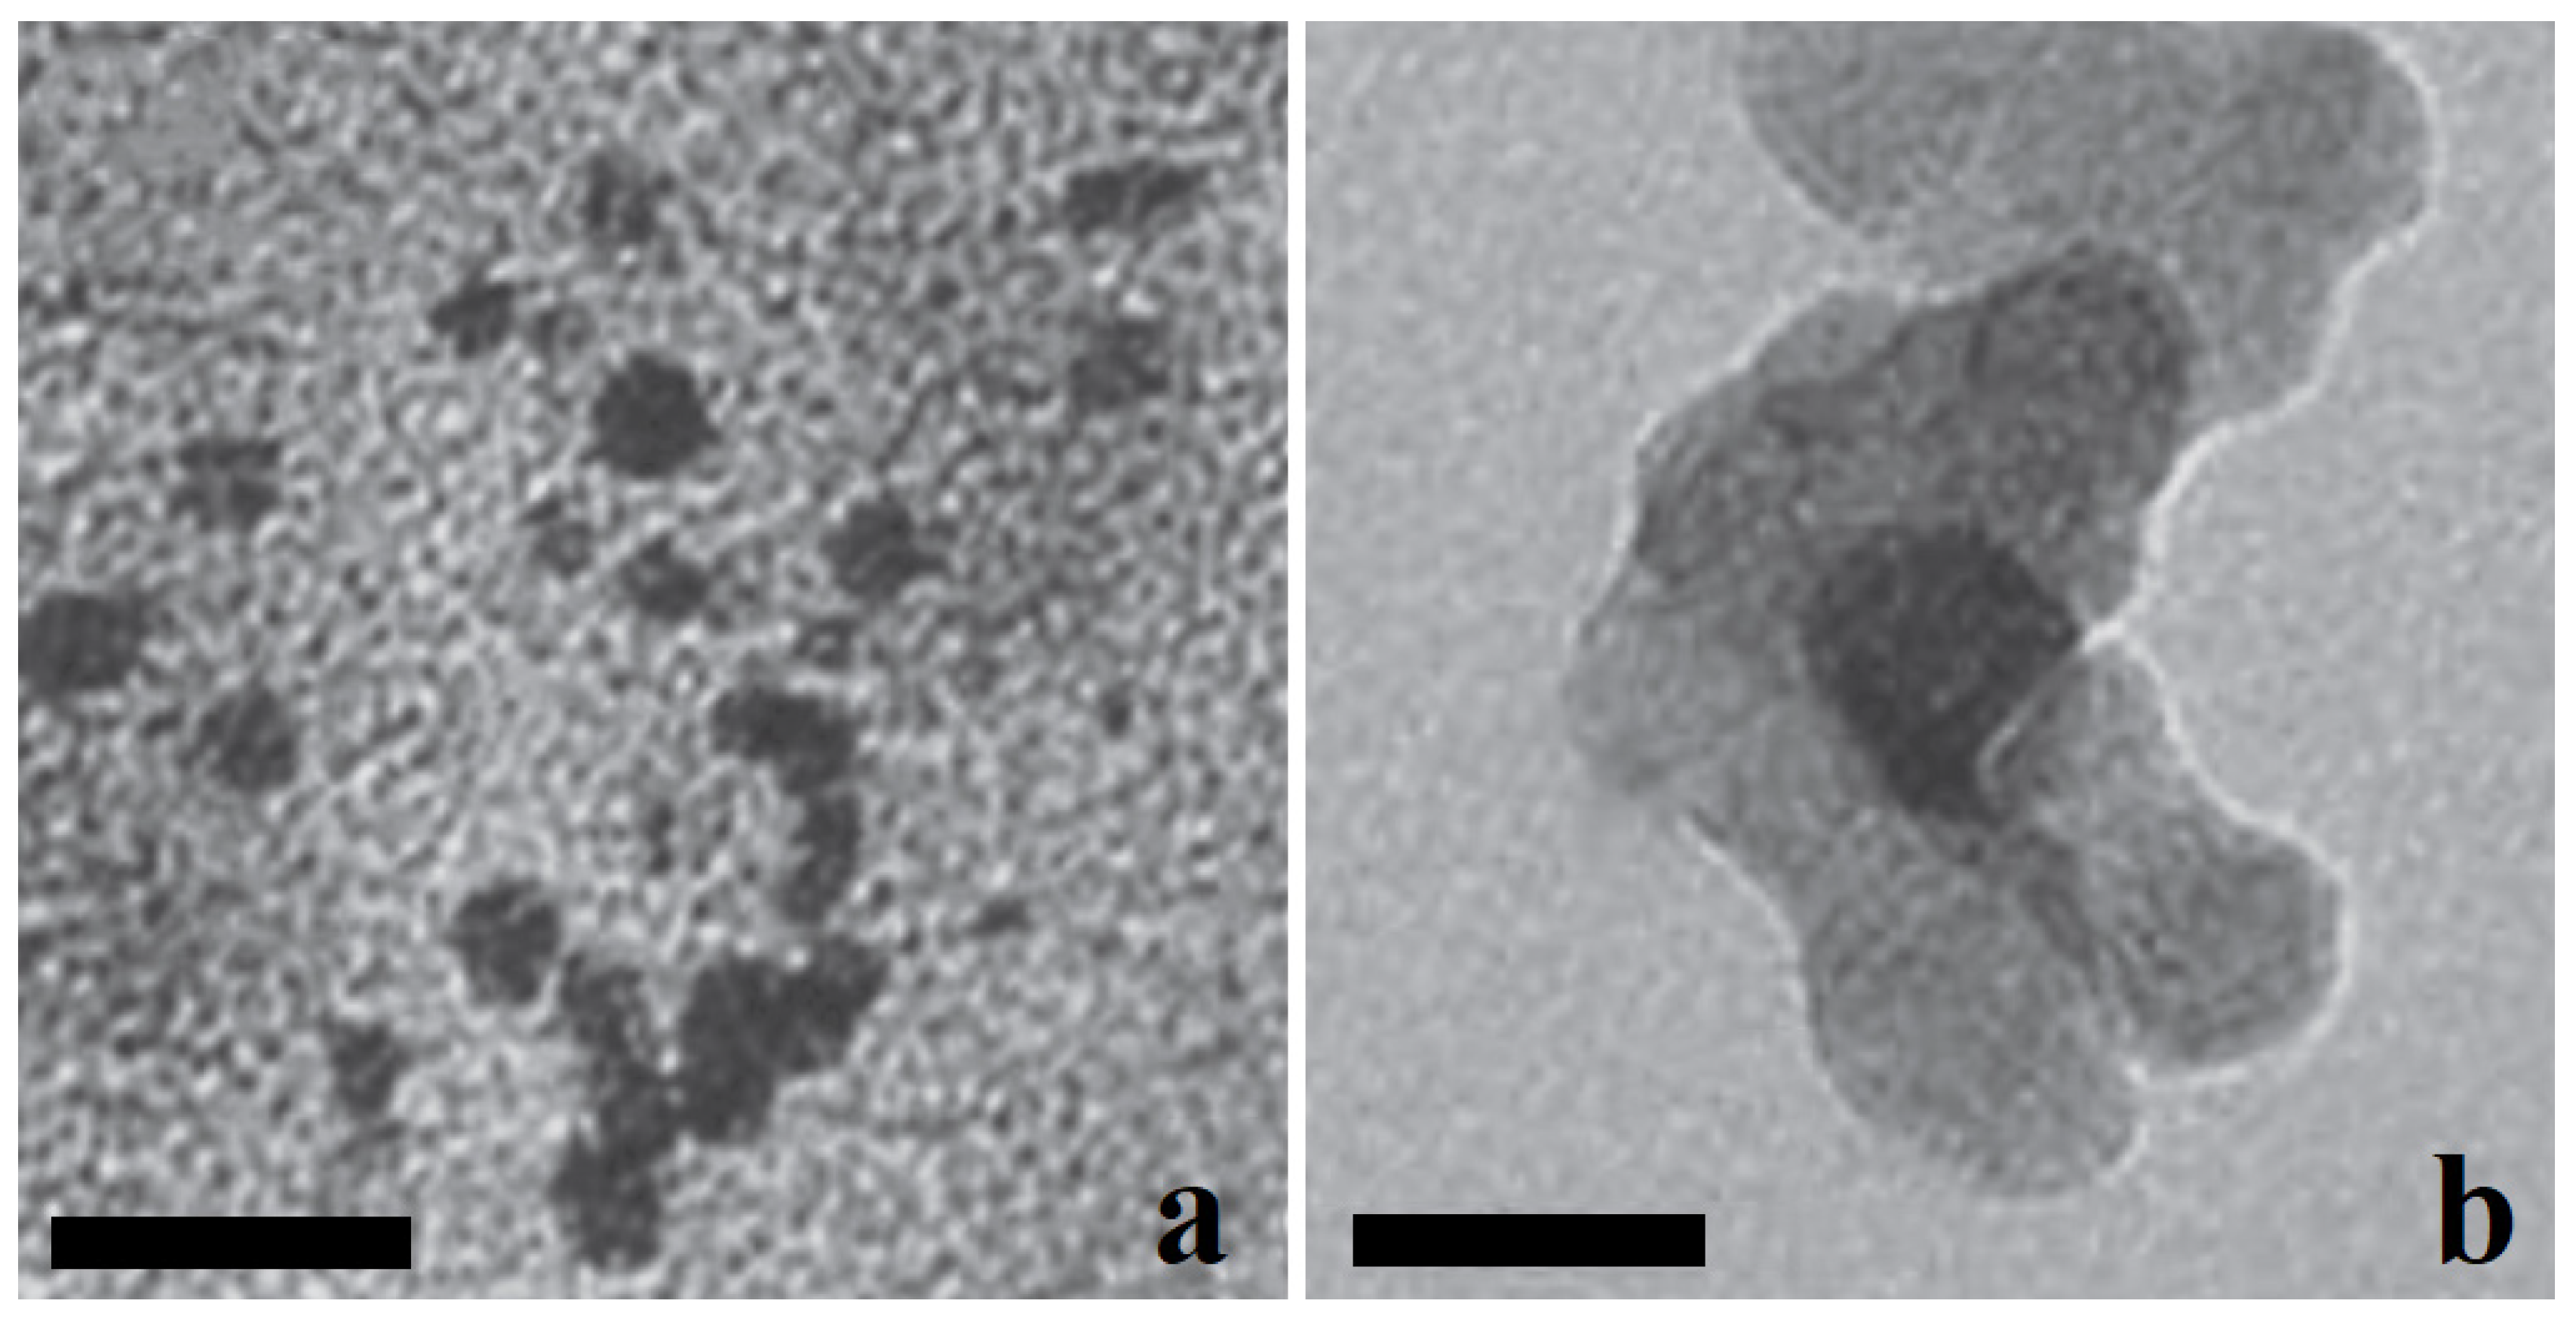
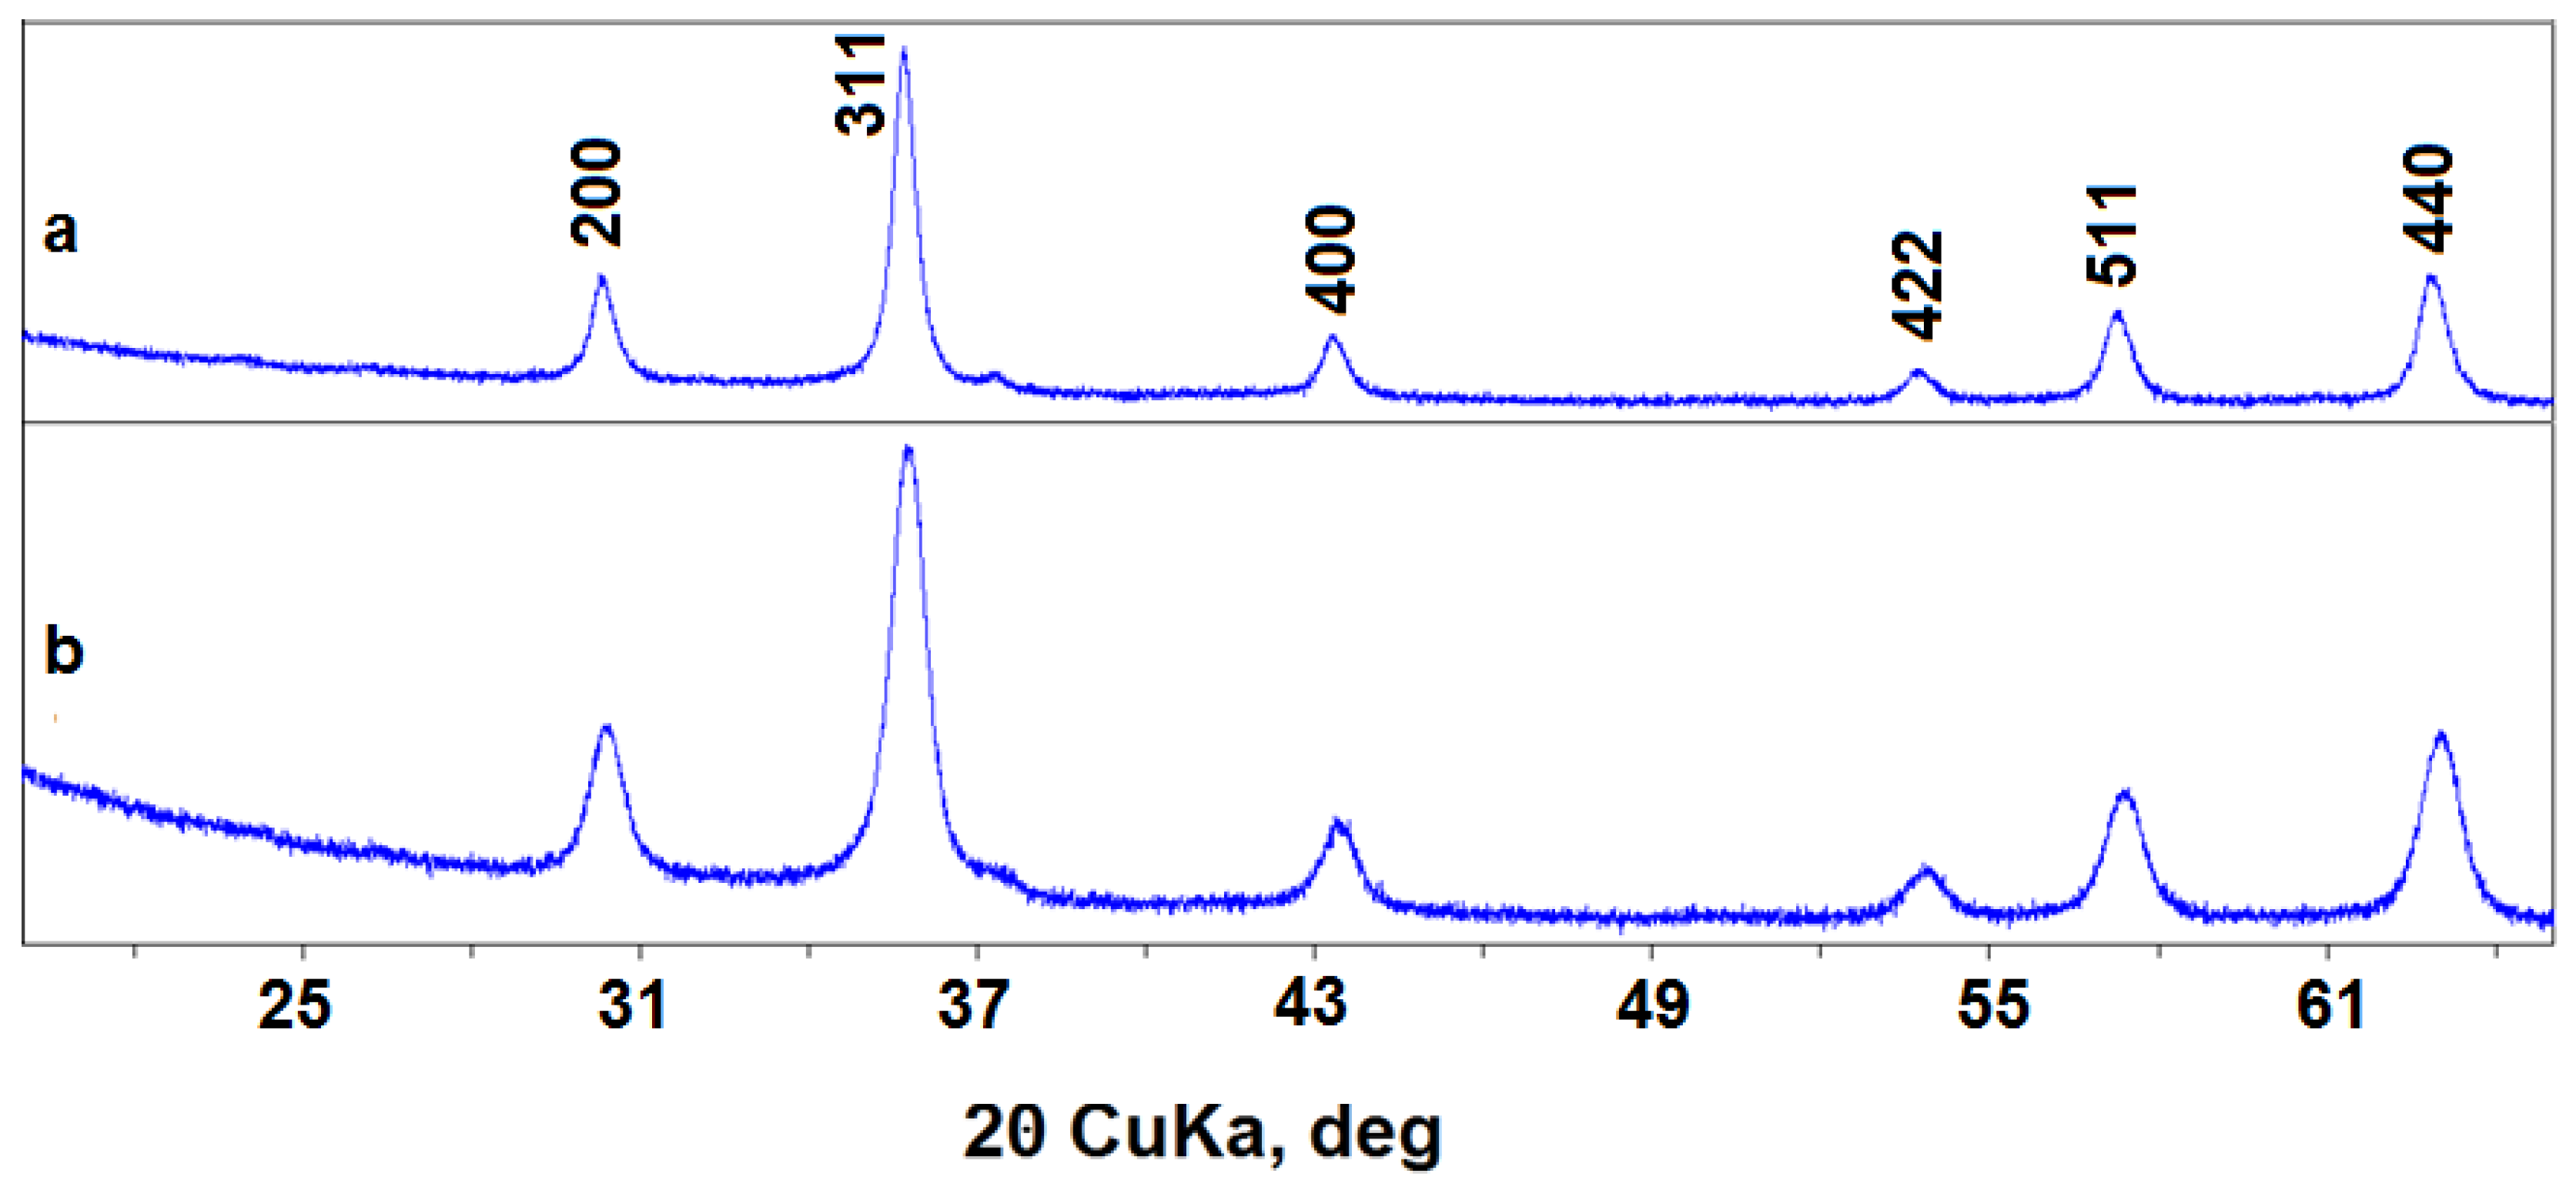
The transmission electron microscopy showed that synthesized nanopowders generally consist of near-spherical particles about 5–25 nm in size (Figure 1). Maghemite nanoparticles (№ 87) can form agglomerates up to 100 nm. X-ray diffraction showed that poorly crystallized nanopowders were obtained in both syntheses, with a CSD length of particles of 15–20 nm (see Table 1, Figure 2). Because of widened peaks, it is impossible to distinguish the magnetite and maghemite phases. The unit cell parameters of these phases are also close (see Table 1), and are between the unit cell parameter values of magnetite and maghemite etalons [27]; therefore, two variants are possible. The first one is a mixture of magnetite and maghemite, either mechanical or in the form of core-shell particles with a magnetite core and maghemite shell [23]. The second variant is the solid solution with a magnetite structure, where Fe2+ atoms are partially oxidized and partially absent.
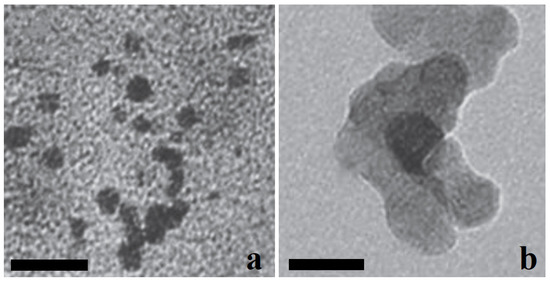
Figure 1.
TEM images: (a) 17—Fe3O4; (b) 87–γ-Fe2O3. Scale bar is 25 nm.

Table 1.
Cell parameters and CSD size evaluation of the obtained samples in comparison with the literature data.
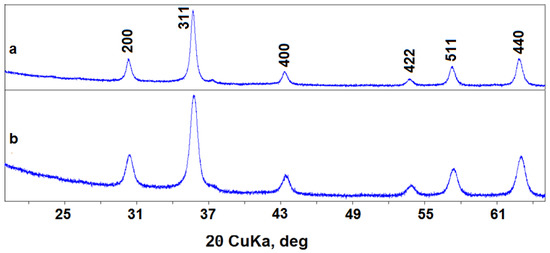
Figure 2.
XRD patterns of nanopowders: (a) 17—Fe3O4; (b) 87—γ-Fe2O3.
3.1. EPR Investigation of Magnetic Nanoparticles
The magnetite nanoparticles with rather small dimensions are still superparamagnetic at room temperature [32]. Particles of powder, which have big enough sizes for the ferromagnetic ordering, exhibit true ferromagnetic resonance with a large linewidth. It was found that for nanoparticles with a size of L ~20 nm or less, the magnetic nature is superparamagnetic, and their EPR linewidth depends on L. Thus, when diluted in paraffin, Fe3O4 nanoparticles with sizes of 20 and 10 nm show EPR spectra with the linewidths ΔHpp = 180 and 80 mT, respectively [32].
Obtained nanopowders consist of ferrimagnetic near-spherical nanoparticles with an average size of ~20 nm, so they can be considered superparamagnets that are characterized by definite blocking temperatures and small values of the coercive field [15,17]. According to the XRD results, sample № 17 can be considered close to magnetite and, therefore, has more Fe2+ ions within its structure than sample № 87, which is closer to maghemite [18]. Indeed, all iron ions in magnetite and maghemite are coupled by strong exchanges and magnetic dipole–dipole bonds. The strength of these bonds is determined by the compound structure as well as by the number of iron ions in different valence states. The resulting EPR spectrum should consist of broad and intensive lines [33], with the width and shape reflecting the character of the exchange interactions. Kliava and Berger [34] analyzed the shape of the EPR line in superparamagnets and concluded that this shape is mainly determined by the distribution of nanoparticle diameters and their nonsphericity; however, other factors (magnetic anisotropy) can also affect the shape of the line.
In our experiment, the width of EPR lines can distinguish paramagnetic centers (PC) localized in magnetically ordered media from the PC with weak magnetic interactions. For the materials with pure diamagnetic properties, narrow lines are typical with an average width () of about several-tens G. The EPR signal, with , is typical for oxide compounds with Fe3+ ions, which was shown in the work of Shahane et al. [35] and Mamani et al. [5] on magnetite.
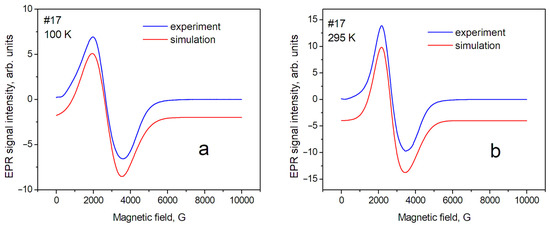
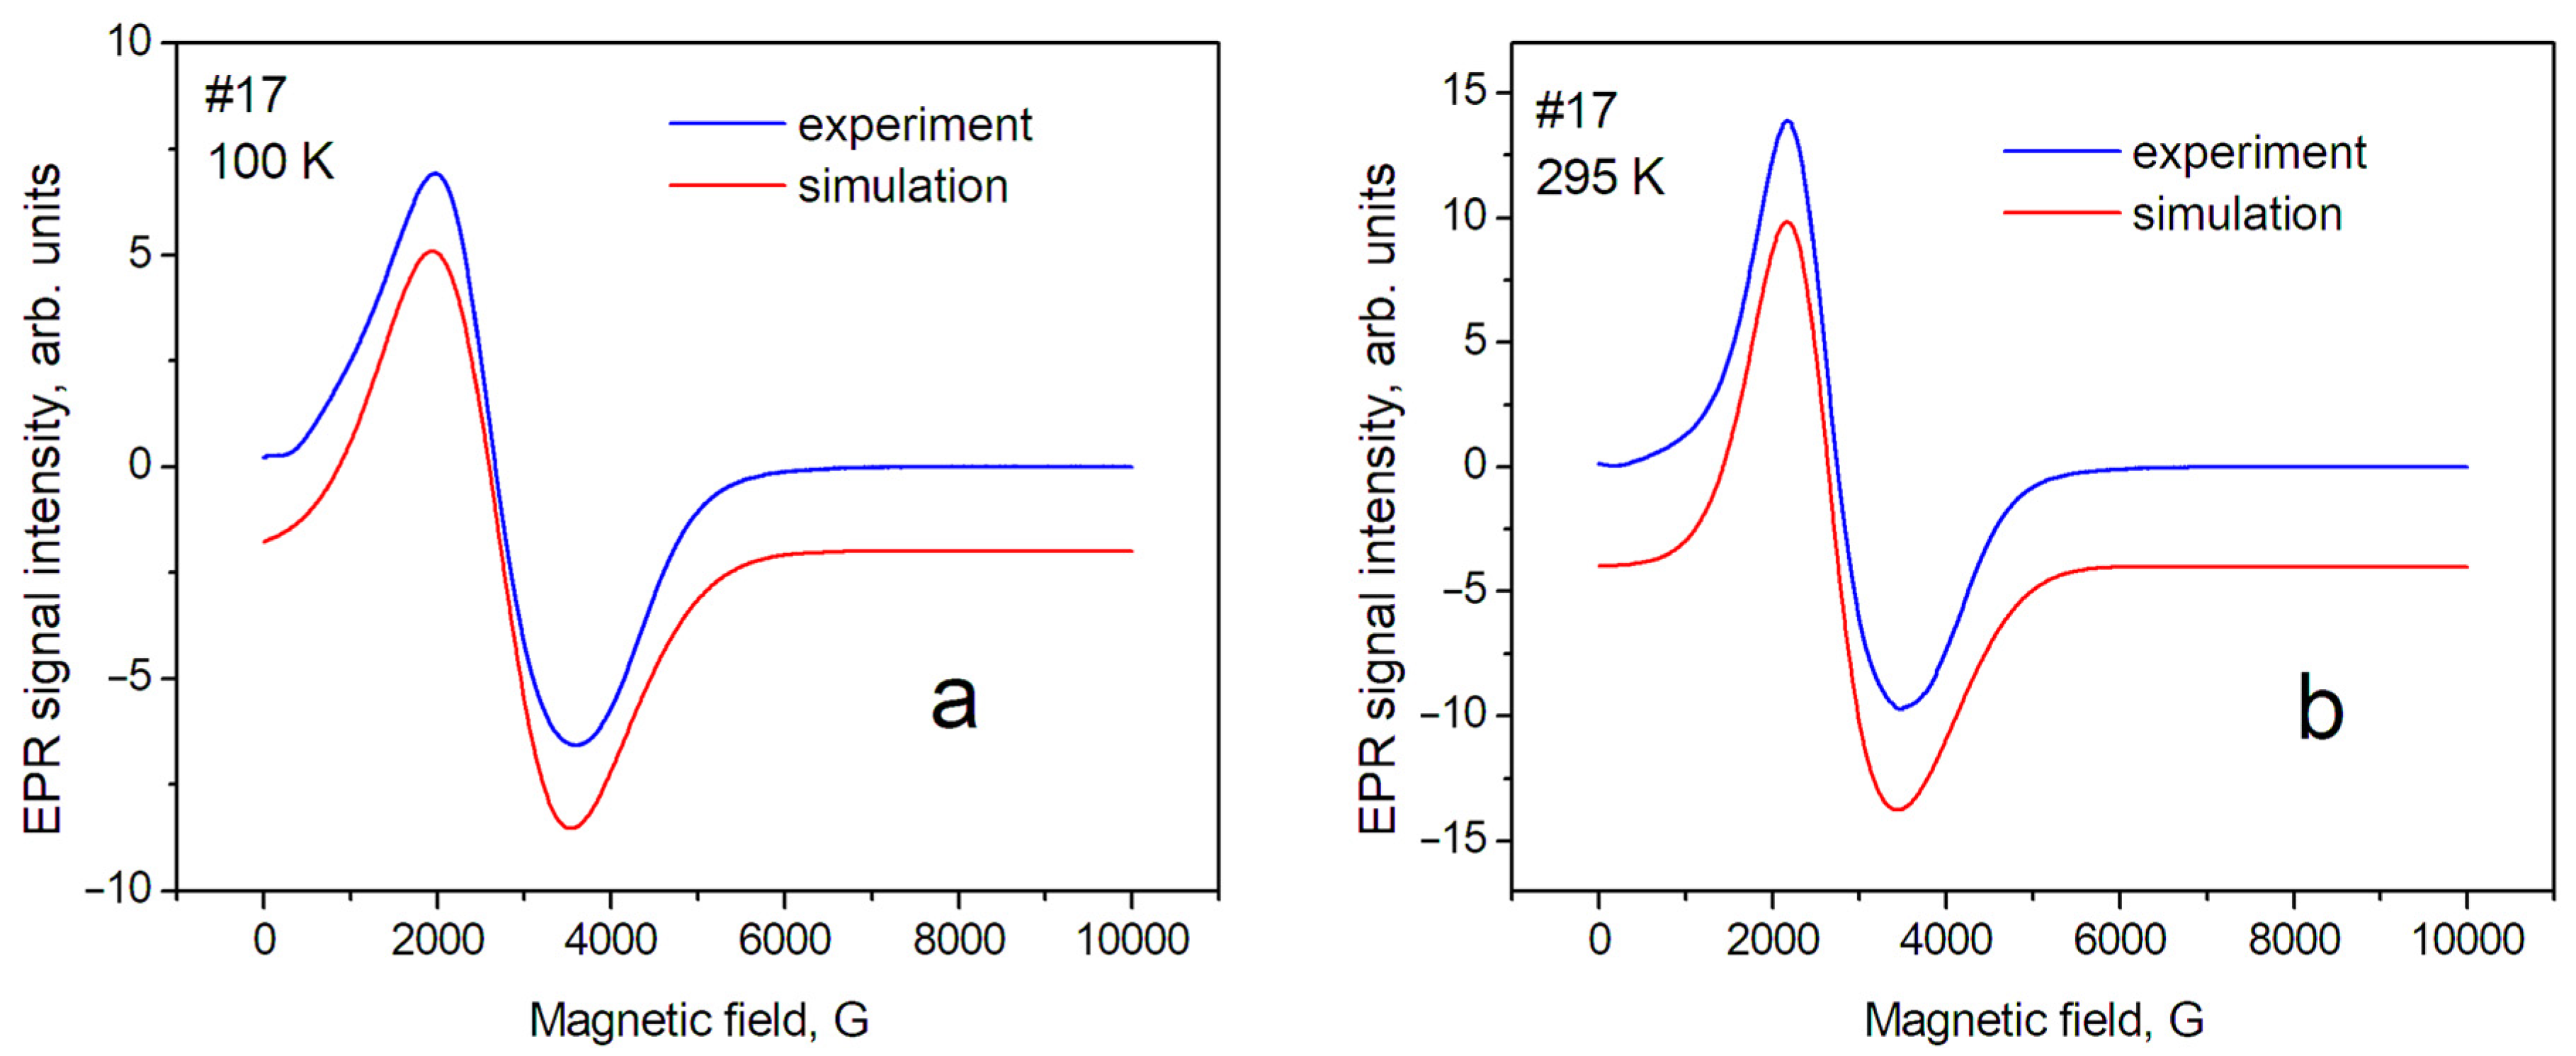
Figure 3.
EPR spectra of sample № 17 (magnetite) at different temperatures: (a) T = 100 K; (b) T = 295 K.
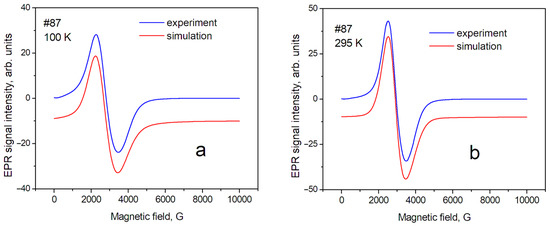
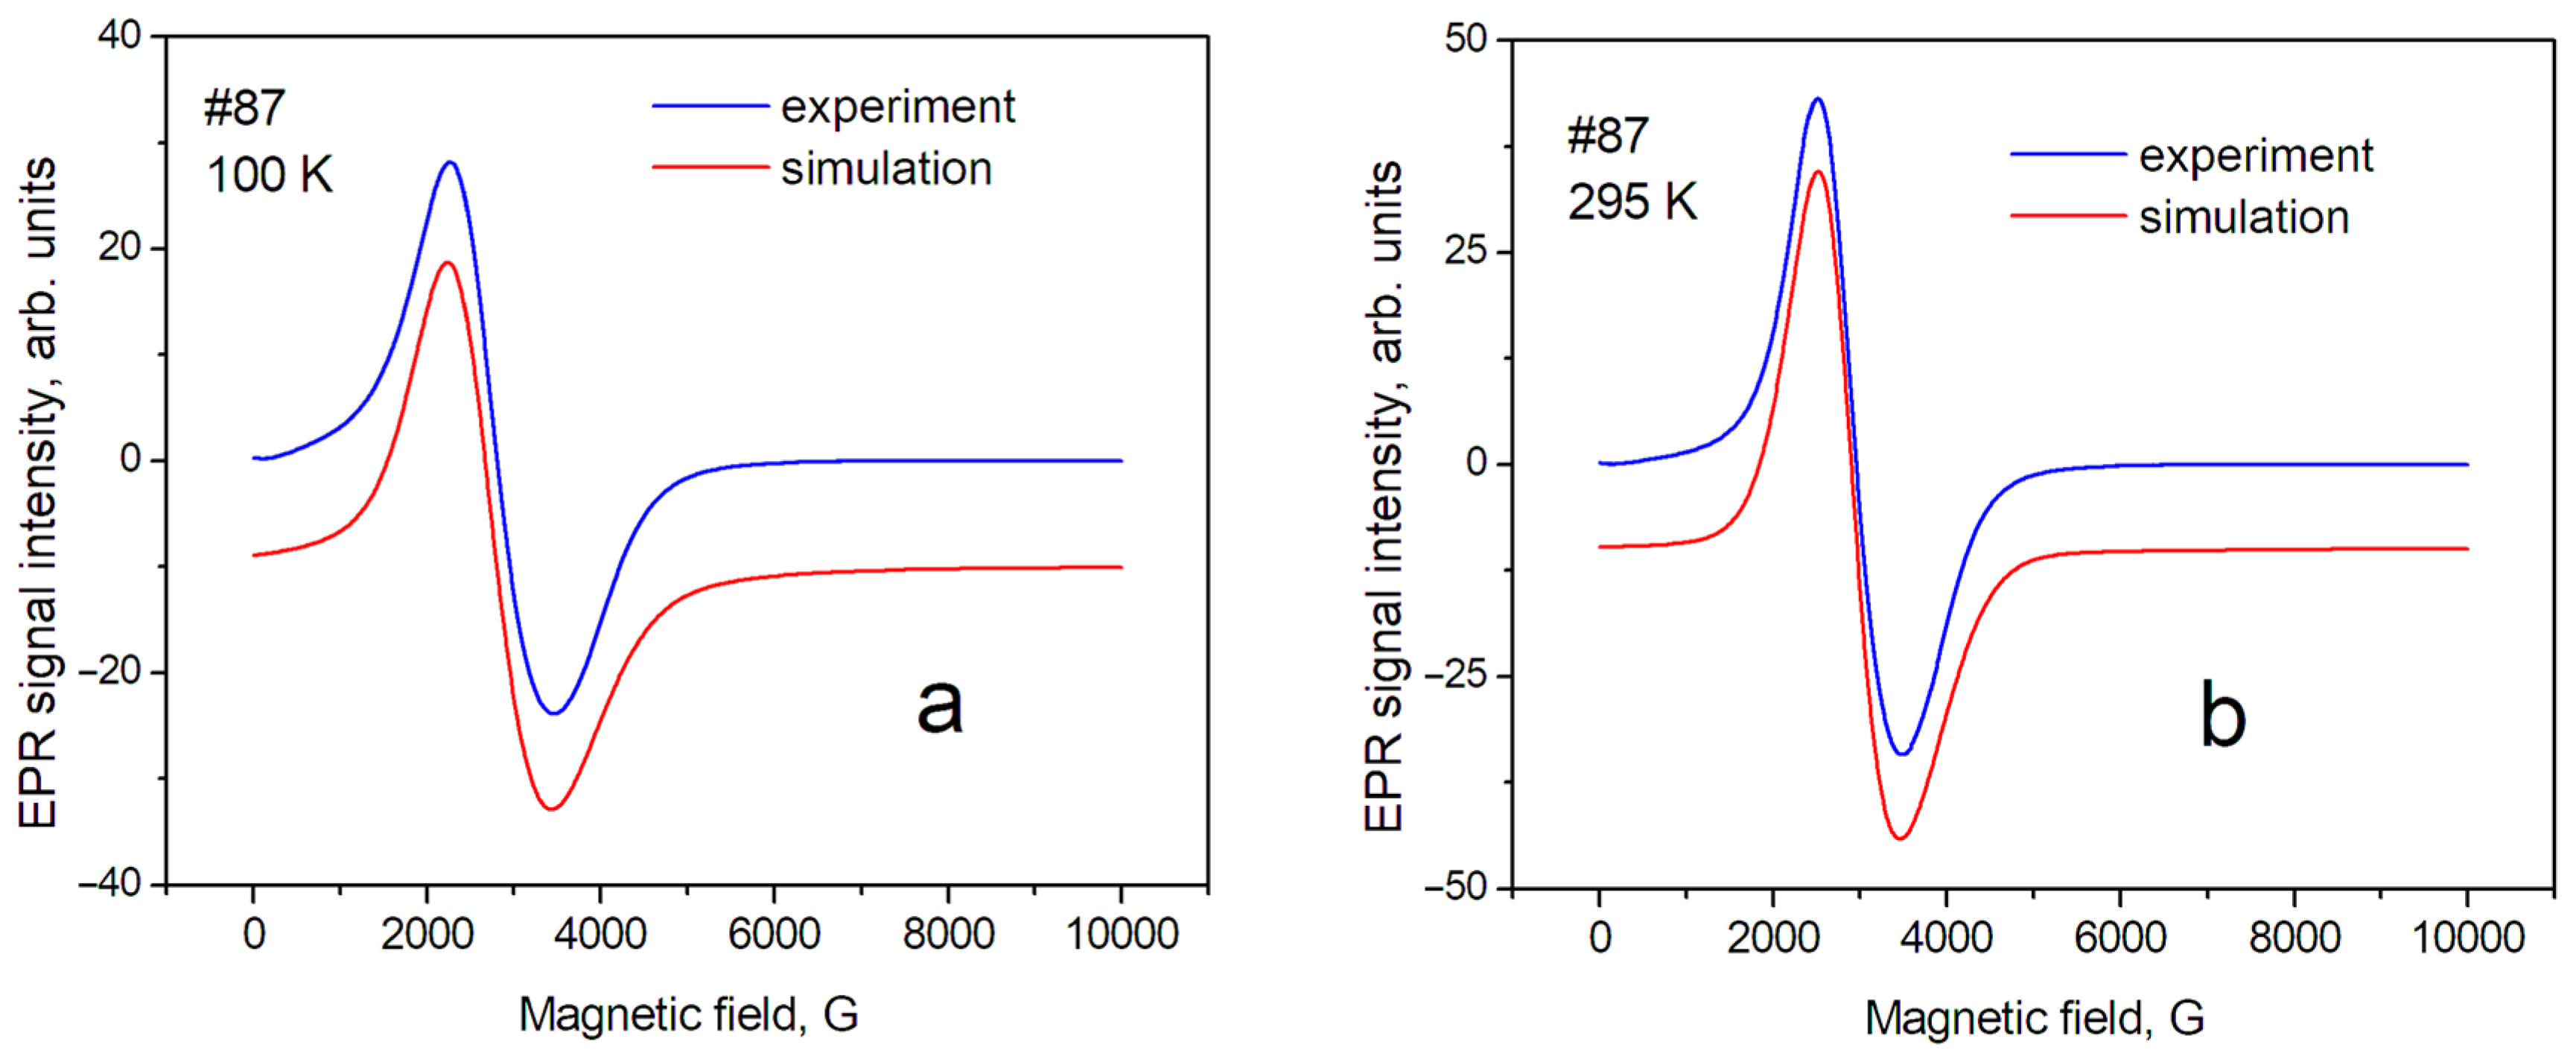
Figure 4.
EPR spectra of sample № 87 (maghemite) at different temperatures: (a) T = 100 K; (b) T = 295 K.
The EPR spectrum can be represented as a broad asymmetric line which is typical for the PC with axial symmetry. According to the previously mentioned assumptions, spin Hamiltonian (SH) with axial symmetry and an effective spin S = ½ was used for the interpretation and modeling, i.e., each magnetic nanoparticle was assigned an effective spin S = 1/2, and then this magnetic nanoparticle was considered as an analog of a paramagnetic ion. The following spin Hamiltonian was used [36]:
where μB—Bohr magneton; i = x,y,z; gi—principal matrix values g; Si—electron spin components S (S = 1/2); Bi—components of the external magnetic field vector B; gx = gy < gz.
HS = gxμBBxSx + gyμBBySy + gzμBBzSz,
The parameters of the SH describing our anisotropic EPR spectra are presented in Table 2.

Table 2.
SH parameters for the samples № 17 and 87 at T = 100 K and T = 295 K.
Here, (ΔBpp)i—corresponding components of the EPR linewidth (peak-to-peak), used for the simulation of the EPR lineshape.
In this approximation, a relatively satisfactory phenomenological description of the position and shape of the resonance line has been obtained. This means that the studied powders are homogeneous (monophase), and several sets of SH parameters are not required to describe them. The shape of the EPR line of sample № 17 (magnetite) can be described mainly as a Gaussian shape; however, the contribution of the Lorentzian shape for maghemite (№ 87) was estimated as ~40% at T = 295 K. The contribution of the Gaussian shape can be explained by the influence of the distribution of nanoparticle sizes around the average value inside the sample. In our case, the demagnetization factors—which can be significant for nonspherical samples—can be excluded in the first approximation. Therefore, the anisotropy of the position of lines in the spectrum (gx = gy < gz) can be associated with the magnetic anisotropy of superparamagnetic nanoparticles, spherical in shape, with an average diameter of 20 nm. The complex shape of the EPR spectra in magnetite, discovered by Shahane et al. [35], is due to the inhomogeneity of the magnetite samples.
3.2. Asymmetry of EPR Signal in Superparamagnets [32]
The anisotropy of the EPR signal of Fe3O4 nanoparticles can be assigned to several factors, as was described above; however, recently Shanina et al. [32] proposed a theoretical model where the asymmetry of the EPR line in Fe3O4 nanoparticles was explained by the distribution of nanoparticle sizes.
The EPR absorption in samples with Fe3O4 nanoparticles presents superparamagnetic absorption, and the resonance field of the signal is determined by the magnetization of the Fe3O4 particles; therefore, the shift of Hres depends on the size of the particles, L, Hres = Hres,0 + 4 × π × M, where Hres,0 is the resonance field for one paramagnetic spin, and M = g × β × N × S × (S + 1) is the magnetic moment of the superparamagnetic particle containing N spins. It is supposed that the spherical shape of the particles and, therefore, demagnetization factors are negligible.
The simulated anisotropic EPR signals present a theoretically simulated convolution of signals that are derivative of the superparamagnetic absorption with a Gaussian line shape for particles with size L, and the Gaussian function for a random distribution of L around the average value ⟨L⟩. The integration of numerous EPR signals from magnetite nanoparticles with different sizes provides an asymmetric EPR signal.
Temperature dependence of EPR linewidth. Temperature changes in the spectra are significantly less for sample № 87 (maghemite) than for sample № 17 (magnetite). The sample temperature change leads to a change in the values of the perpendicular (gx, gy) component of the spectrum line (Table 2). This can lead to changes in both the effective position of the line in the spectrum and its width, measured as the distance between the maximum and minimum (peak-to-peak) of the EPR line intensity. In addition, it is necessary to take into account the fact that the Verwey phase transition is observed for magnetite at T~123 K. The nature of this transition was discussed earlier [37]. The change in the EPR spectrum during the Verwey transition was studied in detail by Nikiforov et al. [14], and it was shown that it is associated with the structural ordering of Fe3+ and Fe2+ ions in magnetite. Such structural orderings, especially in matrices with a spin exchange, can be accompanied by changes in the EPR linewidth; therefore, such phenomena in the sample matrix can lead to a significant difference in the spectra recorded at 100 K and 295 K. Such changes in the EPR spectra were described in the work of Yurtaeva et al. [9], on the magnetite in biological objects when the temperature of the sample changed from room temperature to a temperature below the Verwey transition.
The EPR linewidth. The EPR linewidth for sample № 17 is noticeably larger than for sample № 87. This can be explained by both the wider distribution of internal magnetic fields and their magnitude in magnetite. This is a result of the presence of magnetic ions with different valences: Fe2+ and Fe3+; further, the lineshape of sample № 17 is closer to the Gaussian shape, so it may indicate averaging the above-mentioned distributions over the sample. In sample № 87, which is close to maghemite, the contribution of the Gaussian component of the lineshape decreases significantly for T = 295 K. It indicates a greater spatial homogeneity of the sample (due, probably, to the absence of Fe2+ ions). The next source of broadening is the size of the nanoparticles [32]. The #87 nanoparticles have an average size of 14 nm and the #17 nanoparticles have a larger size of 19 nm. Therefore, we observed a slightly larger EPR line for sample #17 compared to #87.
If we assume that the nanoparticles consist of a core and a shell with different Fe2O3/FeO ratios, then spatial phase separation is possible within the nanoparticle, which should lead to the splitting of lines in the spectrum. In our case, the lines would have to consist of two components, with their relative intensity proportional to the contribution of each phase; however, such a model of spatial phase separation is not applicable in our case, since no clear signs of line splitting are observed in the EPR spectra.
During the precipitation of nanoparticles from the solution, structural defects, such as oxygen vacancies, can form in their crystal structure. Such a vacancy becomes paramagnetic by electron trapping. A classic example of the formation of such PCs is the EPR spectra of –centers in quartz crystals. They are characterized by narrow EPR lines with , and their observation is possible only at temperatures close to the temperature of boiling nitrogen. PCs of the same physical nature are observed and described for TiO2 crystals [38]. Andronenko and Misra [39] analyzed the mechanisms of the effect of various oxygen-related defects on the magnetic properties of transition metal oxides and showed that their presence can significantly change the magnetic properties of metal oxide nanoparticles (in particular, phase transition temperatures). A similar picture can be expected in magnetite with a change in the ratio of Fe3+ and Fe2+ and oxygen defects. Therefore, it is important to make sure if this signal is present or absent in EPR spectra; however, careful investigation of the observed EPR spectra did not reveal any sign of this kind of signal in the investigated samples.
The stabilization of paramagnetic centers at the site of an oxygen defect in metal-based crystals is associated with their participation in exchange and magnetic dipole–dipole interactions with heterovalent iron ions. In this case, the exchange interactions lead to a strong broadening of individual lines in the EPR spectra and, actually, to a disappearance of the EPR line. Therefore, the EPR lines, which are due to oxygen defects, are not observable in our case.
Further, the EPR signal, related to Fe3+ ions, could be observed only in a diamagnetic environment; however, the samples of magnetite and maghemite may have residual materials within them that may contain paramagnetic Fe3+ ions that are not bound by magnetic interactions. The EPR spectrum of paramagnetic Fe3+ ions in such cases is a narrow line (with a width of several G), and they are usually recorded in magnetic fields of <<1500 G, i.e., at g = 4.3. Such a signal was registered by Shahane et al. [35], and Mamani et al. [5] in magnetite. The presence of this signal means that some part of the Fe3+ ions incorporate not into magnetite but into some residual diamagnetic compound, which is formed as a result of chemical reactions. The absence of this EPR signal in the magnetite and maghemite samples investigated in this research means that all Fe3+ ions incorporate into the magnetite structure and are coupled by exchange interactions. This also means the complete absence of any additional residual phases containing iron ions, i.e., indicating the high quality of magnetite synthesis.
The study of the EPR spectra in a wide range of magnetic fields at various temperatures and values of microwave power did not reveal the presence of narrow EPR lines, even with low intensity. The absence of this signal evidently confirms that under the chosen thermodynamic conditions, the formed mineral phases of magnetite and maghemite do not contain diamagnetic structural phases that contain isolated Fe3+ ions; therefore, the recorded EPR spectra are formed only by ions that incorporate into the magnetite–maghemite structure and reflect the exclusively cooperative interactions of a set of magnetically bound Fe3+ and Fe2+ ions.
4. Conclusions
Magnetic powders with nanoparticles of about 10–20 nm—which are characterized by a shape close to spherical—were obtained with precipitation from aqueous solutions of iron (II, III) chlorides. The electron paramagnetic resonance showed the complete incorporation of iron ions into the structure of magnetite and maghemite. Significantly wider distribution of internal magnetic fields and their values are more typical for the nanopowder that is closer to magnetite because of the presence of magnetic iron ions in different charge states. In addition, nanopowders that are close to maghemite are distinguished by a greater spatial homogeneity of the magnetic structure, which is due to the absence of Fe2+ ions. Generally, solid solutions were obtained, not phase mixtures or “core-shell” particles, with different Fe2+/Fe3+ ratios.
Author Contributions
Conceptualization, S.I.A., S.M.S. and O.A.S.; synthesis, A.M.N. and A.S.K.; investigation, A.M.N., S.M.S. and A.A.S.; writing—original draft preparation, S.I.A.; writing—review and editing, A.M.N.; supervision, A.G.I. and O.A.S.; project administration, O.A.S. All authors have read and agreed to the published version of the manuscript.
Funding
The work was carried out within the framework of the State Assignments for the Institute of Silicate Chemistry of the Russian Academy of Sciences (0081-2022-0006). The research was carried out using equipment of the center of collective use of Voronezh State University and the Research Center of SPbSU “Magnetic resonance research methods”. EPR measurements were carried out in the Resource Center of the Research Park of SPbSU.
Institutional Review Board Statement
Not applicable.
Informed Consent Statement
Not applicable.
Acknowledgments
The authors also are grateful to A. Nikitina for her help in EPR spectra recording.
Conflicts of Interest
The authors declare no conflict of interest.
References
- Peiffer, S. Book Review: The Iron Oxides von Rochelle M. Cornell und Udo Schwertmann. Acta Hydrochim. Hydrobiol. 2003, 31, 527. [Google Scholar] [CrossRef]
- Lyadov, A.S.; Kochubeev, A.A.; Koleva, L.D.; Parenago, O.P.; Khadzhiev, S.N. Synthesis of nanosized iron(III) oxide and study of its formation features. Russ. J. Inorg. Chem. 2016, 61, 1387–1391. [Google Scholar] [CrossRef]
- Laurent, S.; Boutry, S.; Muller, R.N. Chapter 1–Metal Oxide Particles and Their Prospects for Applications. In Iron Oxide Nanoparticles for Biomedical Applications; Mahmoudi, M., Laurent, S., Eds.; Elsevier: Amsterdam, The Netherlands, 2018; pp. 3–42. [Google Scholar] [CrossRef]
- Mamani, J.B.; Pavon, L.F.; Miyaki, L.A.; Sibov, T.T.; Rossan, F.; Silveira, P.H.; Zavala Cárdenas, W.H.; Amaro Junior, E.; Gamarra, L.F. Intracellular labeling and quantification process by magnetic resonance imaging using iron oxide magnetic nanoparticles in rat C6 glioma cell line. Einstein 2012, 10, 216–221. [Google Scholar] [CrossRef]
- Mamani, J.B.; Gamarra, L.F.; Brito, G.E.S. Synthesis and Characterization of Fe3O4 Nanoparticles with Perspectives in Biomedical Applications. Mater. Res. 2014, 17, 542–549. [Google Scholar] [CrossRef]
- Kokorin, A.I.; Kulyabko, L.S.; Degtyarev, E.N.; Kovarskii, A.L.; Patsaeva, S.V.; Dzhardimalieva, G.I.; Yurishcheva, A.A.; Kydralieva, K.A. Structure and Properties of Nanosized Composites Based on Fe3O4 and Humic Acids. Russ. J. Phys. Chem. B 2018, 12, 172–178. [Google Scholar] [CrossRef]
- Smith, C.A.; de la Fuente, J.; Pelaz, B.; Furlani, E.P.; Mullin, M.; Berry, C.C. The effect of static magnetic fields and tat peptides on cellular and nuclear uptake of magnetic nanoparticles. Biomaterials 2010, 31, 4392–4400. [Google Scholar] [CrossRef]
- Landázuri, N.; Tong, S.; Suo, J.; Joseph, G.; Weiss, D.; Sutcliffe, D.J.; Giddens, D.P.; Gang Bao Taylor, W.R. Magnetic Targeting of Human Mesenchymal Stem Cells with Internalized Superparamagnetic Iron Oxide Nanoparticles. Small 2013, 9, 4017–4026. [Google Scholar] [CrossRef] [PubMed]
- Yurtaeva, S.V.; Efimov, V.N.; Salnikov, V.V. EPR-spectroscopy of biogenic crystal iron oxides in biological tissues. In Proceedings of the Conference “Actual Questions of Biological Physics and Chemistry BFFH-17”, Sevastopol Crimea, Russia, 2–6 October 2017; pp. 361–365. (In Russian). [Google Scholar]
- Roushenas, P.; Yusop, Z.; Majidnia, Z.; Nasrollahpour, R. Photocatalytic degradation of spilled oil in sea water using maghemite nanoparticles. Desalination Water Treat. 2016, 57, 5837–5841. [Google Scholar] [CrossRef]
- Shilova, O.A.; Panova, G.; Nikolaev, A.; Kovalenko, A.; Sinelnikov, A.; Kopitsa, G.; Baranchikov, A.; Udalova, O.; Artemyeva, A.; Kornyuchin, D.; et al. Aqueous Chemical Co-Precipitation of Iron Oxide Magnetic Nanoparticles for Use in Agricultural Technologies. Lett. Appl. NanoBioSci. 2021, 10, 2215–2239. [Google Scholar] [CrossRef]
- Rahmatizadeh, R.; Arvin, S.M.J.; Jamei, R.; Mozaffari, H.; Nejhad, F.R. Response of tomato plants to interaction effects of magnetic (Fe3O4) nanoparticles and cadmium stress. J. Plant Interact. 2019, 14, 474–481. [Google Scholar] [CrossRef]
- Palmqvist, N.G.M.; Seisenbaeva, G.A.; Svedlindh, P.; Kessler, V.G. Maghemite Nanoparticles Acts as Nanozymes, Improving Growth and Abiotic Stress Tolerance in Brassica napus. Nanoscale Res. Lett. 2017, 12, 631. [Google Scholar] [CrossRef]
- Nikiforov, V.N.; Koksharov, Y.u.A.; Polyakov, S.N.; Malakho, A.P.; Volkov, A.V.; Moskvina, M.A.; Khomutov, G.B.; Irkhin, V.Y. Magnetism and Verwey transition in magnetite nanoparticles in thin polymer film. J. Alloys Compd. 2013, 569, 58–61. [Google Scholar] [CrossRef]
- Nikiforov, V.N.; Ignatenko, A.N.; Irkhin, V.Y. Size and Surface Effects on the Magnetism of Magnetite and Maghemite Nanoparticles. J. Exp. Theor. Phys. 2017, 124, 304–310. [Google Scholar] [CrossRef]
- Verwey, E.J.W.; Haayman, P.W. Electronic Conductivity and Transition Point of Magnetite («Fe3O4»). Physica 1941, 8, 979–987. [Google Scholar] [CrossRef]
- Nikiforov, V.N.; Goldt, A.E.; Gudilin, E.A.; Sredin, V.G.; Irhin, V.Y. Magnetic properties of maghemite nanoparticles. RAS Bull. Phys. Ser. 2014, 78, 1330–1335. (In Russian) [Google Scholar] [CrossRef]
- Liu, X.M.; Shaw, J.; Jiang, J.Z.; Bloemendal, J.; Hesse, P.; Rolph, T. X-G Analysis on variety and characteristics of maghemite. Sci. China Earth Sci. 2010, 53, 1153–1162. [Google Scholar] [CrossRef]
- Koksharov, Y.u.A.; Gubin, S.P.; Kosobudsky, I.D.; Yurkov GYu Pankratov, D.A.; Ponomarenko, L.A.; Mikheev, M.G.; Beltran, M.; Khodorkovsky, Y.; Tishin, A.M. Electron paramagnetic resonance spectra near the spin-glass transition in iron oxide nanoparticles. Phys. Rev. B 2000, 63, 012407. [Google Scholar] [CrossRef]
- Neelakanta, P.S. Handbook of Electromagnetic Materials: Monolithic and Composite Versions and Their Applications; CRC Press: Boca Raton, FL, USA; London, UK; New York, NY, USA; Washington, DC, USA, 1995. [Google Scholar]
- Sohrabijam, Z.; Zamanian, A.; Saidifar, M.; Nouri, A. Prepartion and Characterization of Superparamagnetic Chitosan Coated Maghemite (γ-Fe2O3) for Gene Delivery. Procedia Mater. Sci. 2015, 11, 282–286. [Google Scholar] [CrossRef]
- Nasrazadani, S.; Raman, A. The application of infrared spectroscopy to the study of rust systems—II. Study of cation deficiency in magnetite (Fe3O4) produced during its transformation to maghemite (γ-Fe2O3) and hematite (α-Fe2O3). Corros. Sci. 1993, 34, 1355–1365. [Google Scholar] [CrossRef]
- Cervellino, A.; Frison, R.; Cernuto, G.; Guagliardi, A.; Masciocchi, N. Lattice parameters and site occupancy factors of magnetite–maghemite core–shell nanoparticles. A critical study. J. Appl. Cryst. 2014, 47, 1755–1761. [Google Scholar] [CrossRef]
- Winsett, J.; Moilanen, A.; Paudel, K.; Kamali, S.; Ding, K.; Cribb, W.; Seifu, D.; Neupane, S. Quantitative determination of magnetite and maghemite in iron oxide nanoparticles using Mössbauer spectroscopy. SN Appl. Sci. 2019, 1, 1636. [Google Scholar] [CrossRef]
- Dehsari, H.S.; Ksenofontov, V.; Möller, A.; Jakob, G.; Asadi, K. Determining Magnetite/Maghemite Composition and Core–Shell Nanostructure from Magnetization Curve for Iron Oxide Nanoparticles. J. Phys. Chem. C 2018, 122, 28292–28301. [Google Scholar] [CrossRef]
- Baabu, P.R.S.; Kumar, H.K.; Gumpu, M.B.; Babu, J.; Kulandaisamy, A.J.; Rayappan, J.B.B. Iron Oxide Nanoparticles: A Review on the Province of Its Compounds, Properties and Biological Applications. Materials 2023, 16, 59. [Google Scholar] [CrossRef] [PubMed]
- Shilova, O.A.; Nikolaev, A.M.; Kovalenko, A.S.; Sinel’nikov, A.A.; Kopitsa, G.P.; Baranchikov, A.E. Synthesis of Magnetic Nanopowders of Iron Oxide: Magnetite and Maghemite. Russ. J. Inorg. Chem. 2020, 65, 426–430. [Google Scholar] [CrossRef]
- Darezereshki, E. Synthesis of maghemite (γ-Fe2O3) nanoparticles by wet chemical method at room temperature. Mater. Lett. 2010, 64, 1471. [Google Scholar] [CrossRef]
- Liu, S.; Wu, G.; Chen, H.; Wang, M. Preparation and characterization of Fe3O4/SiO2 particles for dual-particle electrophoretic display. Synth. Met. 2012, 162, 89. [Google Scholar] [CrossRef]
- Pecharroman, C.; Gonzalez-Carreno, T.; Iglesias, J.E. Phys. The infrared dielectric properties of maghemite, γ-Fe2O3, from reflectance measurement on pressed powders. Chem. Miner. 1995, 22, 21. [Google Scholar] [CrossRef]
- Anthony, J.W.; Bideaux, R.A.; Bladh, K.W. Magnetite. In Handbook of Mineralogy; Mineralogical Society of America: Chantilly, VA, USA, 2018; 333p. [Google Scholar]
- Shanina, B.D.; Konchits, A.A.; Krasnovyd, S.V.; Shevchenko Yu, B.; Petranovs’ka, A.L.; Rieznichenko, L.S. Magnetic nanoparticle ensembles with promising biophysical applications: An EPR study. J. Appl. Phys. 2022, 132, 163905. [Google Scholar] [CrossRef]
- Crouch, G.E. Ferromagnetic resonance in iron oxides. Phys. Rev. 1949, 75, 525. [Google Scholar] [CrossRef]
- Kliava, J.; Berger, R. Size and shape distribution of magnetic nanoparticles in disordered systems: Computer simulations of superparamagnetic resonance spectra. J. Magn. Magn. Mater. 1999, 205, 328–342. [Google Scholar] [CrossRef]
- Shahane, G.S.; Zipare, K.V.; Pant, R.P. Synthesis and characterization of superparamagnetic Fe3O4 nanoparticles for ferrofluid application. Magnetohydrodynamics 2013, 49, 317–321. [Google Scholar] [CrossRef]
- Abragam, A.; Bleaney, B. Electron Paramagnetic Resonance of Transition Ions; Clarendon: Oxford, UK, 1970. [Google Scholar]
- Waltz, F. The Verwey transition—A topical review. J. Phys. Cond. Matter. 2002, 14, R285. [Google Scholar] [CrossRef]
- Misra, S.K.; Andronenko, S.I.; Tipikin, D.; Freed, J.H.; Somani, V. Om Prakash Study of paramagnetic defect centers in as-grown and annealed TiO2 anatase and rutile nanoparticles by a variable-temperature X-band and high-frequency (236 GHz) EPR. JMMM 2016, 401, 495–505. [Google Scholar] [CrossRef] [PubMed]
- Andronenko, S.I.; Misra, S.K. A review of EPR investigations of nanoparticles of dilute magnetic semiconductors doped by transition metal ions. Appl. Magn. Reson. 2015, 46, 693–707. [Google Scholar] [CrossRef]
Disclaimer/Publisher’s Note: The statements, opinions and data contained in all publications are solely those of the individual author(s) and contributor(s) and not of MDPI and/or the editor(s). MDPI and/or the editor(s) disclaim responsibility for any injury to people or property resulting from any ideas, methods, instructions or products referred to in the content. |
© 2023 by the authors. Licensee MDPI, Basel, Switzerland. This article is an open access article distributed under the terms and conditions of the Creative Commons Attribution (CC BY) license (https://creativecommons.org/licenses/by/4.0/).

