Article

Fe Doping in TiO2 via Anodic Dissolution of Iron: Synthesis, Characterization, and Electrophoretic Deposition on a Metal Substrate

by
Sara Chatrnoor
1,†,
Amirhossein Taghaddosi
1,†,
Sayed Ali Ahmad Alem
2,
Fatemeh Taati-Asil
1,
Babak Raissi
1,3,*,
Reza Riahifar
1,3 and
Maziar Sahba Yaghmaee
1,3
1
Department of Nanotechnology and Advanced Materials, Materials & Energy Research Center, Karaj P.O. Box 31787-316, Iran
2
Department of Chemistry, Materials and Chemical Engineering “Giulio Natta” (DCMC), Politecnico di Milano, Piazza Leonardo da Vinci 32, 20133 Milano, Italy
3
R&D Center, Parthian Battery Novin Co., Ltd., Tehran P.O. Box 31787-316, Iran
*
Author to whom correspondence should be addressed.
These authors contributed equally to this work.
Ceramics 2023, 6(2), 1251-1262; https://doi.org/10.3390/ceramics6020076
Submission received: 2 May 2023 / Revised: 2 June 2023 / Accepted: 9 June 2023 / Published: 13 June 2023

Abstract

:
The tailored physical properties of TiO2 are of significant importance in various fields and, as such, numerous methods for modifying these properties have been introduced. In this study, we present a novel method for doping Fe into TiO2 via the anodic dissolution of iron. The optimal conditions were determined to be an application of 200 V to acetylacetone (acac)/EtOH medium for 10 min, followed by the addition of TiO2 to the solution, sonication for 30 min, stirring at 80 °C, and drying. The resulting powder was calcined at 400 °C for 3 h, and characterization was conducted using XRD, FTIR, TEM, and UV-vis. The synthesized powder revealed the successful doping of Fe into the TiO2 structure, resulting in a decrease in the optical band gap from 3.22 to 2.92 eV. The Fe-TiO2 was then deposited on a metal substrate via the electrophoretic (EPD) technique, and the weight of the deposited layer was measured as a function of the applied voltage and exposure time. FESEM images and EDX analysis confirmed that the deposited layer was nanostructured, with Fe evenly distributed throughout the structure.

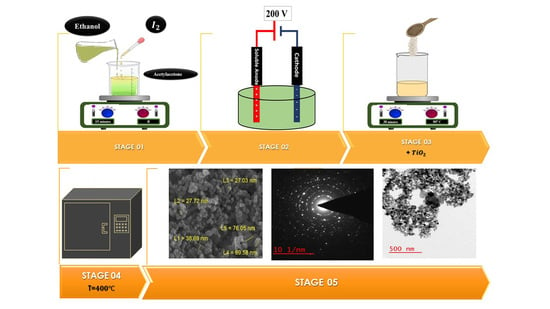
Graphical Abstract

1. Introduction

TiO2 is a highly versatile material with a broad range of applications, including but not limited to solar cells [1], water splitting [2], sensors [3], anti-reflective films [4], water purification [5], and structural composites [6]. Its electrical, optical, and chemical properties have been the subject of extensive research due to its potential for a wide range of technological advancements [7,8]. Despite its advantages, pure and highly crystalline TiO2 has a wide band gap, with values of 3.2 eV and 3.0 eV for the anatase and rutile phases, respectively [9,10], which limits its ability to efficiently absorb sunlight and requires ultraviolet (UV) light to excite and generate electron–hole pairs [11]. Doping has emerged as an effective strategy for modifying the band gap of nanomaterials to suit a wide range of applications [12,13]. To this end, numerous efforts have focused on reducing the band gap of TiO2 (mainly anatase) by doping it with various transition metal ions, e.g., Cr, Fe, V, Mn, Co, and Ni [14,15,16,17,18,19], and rare-earth elements, e.g., Eu, Ce, and Sm [20,21], to enhance its electrochemical and photochemical activities. Among these dopants, Fe3+ has garnered considerable attention due to its ionic radius (0.79 Å), which is similar to that of Ti4+ (0.75 Å) and thereby easily enters the TiO2 structure [22,23,24]. It has been demonstrated that the doping of low concentration of Fe3+ ions (<2 wt.%) in TiO2 lattice decreases its band gap ascribed to the overlap of the conduction band due to the Ti (d orbital) of TiO2 and the metal (d-orbital) orbital of Fe3+ ions [25]. Additionally, Fe3+ ions can act as effective traps for electron–hole pairs, reducing their recombination rate [24].
Several methods have been reported for doping Fe into TiO2 structure (anatase); for instance, wet impregnation technique [11], reactive radio frequency sputtering [22], sol-gel [26], mechanical alloying [27], co-precipitation [28], hydrothermal [29], microwave approach [30], controlled hydrolysis [31], RF plasma-enhanced chemical vapor deposition [32], and reactive magnetron sputtering [33]. In this research, a novel method known as the anodic dissolution process is utilized for synthesizing Fe-doped TiO2. After that, the as-synthesized Fe-TiO2 powder was deposited on a substrate utilizing the EPD technique. EPD is usually used for ceramic film fabrication on a substrate from a colloidal medium with the help of electricity, which accelerates the particles’ depositions [34,35,36,37]. In general, the EPD technique is regarded as an efficient deposition method due to its short time and simple equipment needed for deposition [38], easy control of the thickness of deposited layer [39], ability to coat complex shapes with high compaction [40], the plausibility of utilizing micro to nanopowders, etc. In contrast, it has some disadvantages, such as high sensitivity to the purity of starting materials, environmental pollution, and low repeatability [34,41]. This method is employed for applications that demand high-purity deposited layers, but the application of an electric field during the process results in anodic dissolution, which unavoidably introduces impurities into the deposited layer [34]. This phenomenon is known as pollution and researchers have attempted to mitigate this issue by utilizing neutral electrodes such as gold and platinum [42,43]. Despite the fact that anodic dissolution has been identified as a disadvantage by many researchers, there have been a limited number of studies reporting the successful fabrication of Ni-Al2O3 and metal oxide–diamond nanocomposite coatings using this method [44,45].
Metal dissolution is accompanied by the release of electrons, which is determined by the standard potential of the metal. Therefore, it is crucial to comprehend the underlying mechanism of this phenomenon at the electrode–electrolyte interface. When steel is used as an anode, its oxidation reaction is described by the following equation [46]:
Fe Fe 3 + + 3 e ,
The electrons generated by the metal dissolution process would persist on the electrode surface until they are absorbed by protons (H+) present in the surrounding water media during a reduction reaction, ultimately resulting in the formation of hydrogen gas:
2 H + + 2 e H 2 ,
Here, we aim to report synthesizing Fe-doped TiO2 particles by anodic dissolution and then fabrication of a Fe-TiO2 layer through the EPD method.

2. Materials and Methods

TiO2 nanopowders (DegussaP25) with an average particle size of 21 nm, iodine powder (BDH, analytical grade), absolute ethanol (EtOH) (#983, 99.9%, Merck Co., Darmstadt, Germany), acac (#23, 99.9%, Merck Co., Darmstadt, Germany), as well as graphite and low-carbon steel electrodes, were used in this investigation.
The first step was to investigate the influential parameters that govern the dissolution process to achieve optimum conditions for synthesizing Fe-doped TiO2 particles by anodic dissolution. The process-controlling parameters were the value of the applied voltage and exposure time, while media-related parameters were the solution type and addition of a corrosive agent. In the setup shown in Figure 1a, a voltage range of 100–400 V was applied to the solution for 0 to 10 min. To investigate the influence of media parameters, we used 25 mL of three different solutions: methanol, EtOH, and acac/EtOH. Next, 5 mg of iodine powder was added as a corrosive agent, followed by 5 min of ultrasonication and 15 min of stirring to obtain a homogenous solution. The best outcomes were achieved by applying 200 V for 10 min to acac/EtOH media, which was chosen as the optimized condition for introducing Fe ions to the solution. Elemental analysis was then conducted to characterize the Fe-containing solution after removing the low-carbon steel electrodes. Once the exact amount of Fe ion in the solution was determined, 1.066 g TiO2 was added to obtain 1.5 wt.% Fe-TiO2. The solution was ultrasonicated for 30 min and stirred at 80 °C before the obtained powder was calcined at 400 °C for 3 h to complete the ion diffusion process. A flowchart of the synthesis procedure is provided in Figure 1b. The next step involved the fabrication of an EPD layer of Fe-TiO2. We prepared a 5 g/L suspension of Fe-TiO2 in EtOH and utilized a graphite anode under 200 V for 10 min to deposit the layer. We studied the surface morphology of the deposited layer and measured the weight of the deposited layers as a function of voltage and exposure time to evaluate the influence of these parameters.
To thoroughly characterize the synthesized nanoparticles and deposited layer, various analyses, including X-ray diffraction (XRD) (Siemens D500, Cu Kα radiation), transition electron microscopy (TEM) (FEI Tecnai G2 F20 SuperTwin TEM, accelerating voltage: 200 kV), Fourier transform infrared spectroscopy (FTIR) spectrometer (spectrum RXL, PerkinElmer, Waltham, MA, USA), UV-vis spectrometer (lambda 25, PerkinElmer,), and field-effect scanning electron microscopy (FESEM) (MIRA3 TESCAN-XMU) were used.

3. Results and Discussion

3.1. Dissolution of Fe in Different Conditions

3.1.1. Effect of Media on Anodic Dissolution

In order to study the anodic dissolution in different media, various solvents including methanol, EtOH, and acac/EtOH in the presence of steel electrodes were exposed to a direct current (DC) electric field under the voltage range of 100–400 V. As demonstrated in Table 1, whereas the amount of anodic dissolution in methanol and EtOH is negligible, it is high for acac/EtOH media attributing to the reaction of acac with OH group of EtOH, resulting in the formation of acac anion. This anion tends to react with metal as a ligand to form a metallic acetylacetonate compound, as illustrated in Figure 1c [47].

3.1.2. Effect of Voltage on Anodic Dissolution

A range of voltages was tested on the acac/EtOH media in order to identify an optimal electric field for anodic dissolution. Based on our observations, voltages below 100 V were found to be inadequate due to the low conductivity of the media. Therefore, higher voltages (100–400 V) were chosen to achieve considerable dissolution. According to the report from Negishi et al. [48], the current in the solution is directly proportional to the applied voltage, and a higher voltage can make the system less stable. As shown in Figure 2a, when an applied voltage of 100 V was used, the current remained almost constant. However, increasing the voltage resulted in higher currents due to an increase in solution conductivity. This turbulence indicates an increase in the rate of dissolution, allowing more Fe ions to enter the media. After 300 s, a decrement in current was observed, which could be attributed to the gradual formation of an oxide layer on the electrode surface. The thickness of this oxide layer increases with higher voltage.

3.1.3. Anodic Dissolution in the Presence of Iodine

According to Equation (3) [49], iodine reacts with acac resulting in the generation of H+ ions, thereby acidifying the media and significantly accelerating the anodic dissolution. The results of anodic dissolution in iodine-containing media, as a function of the applied voltage, are shown in Figure 2b. It can be observed that the amount of dissolution increased with increasing voltage. However, at higher voltages, the slope of dissolution slightly declined, which could be attributed to severe corrosion of the anode surface and gradual oxidation.
CH3–CO–CH2–CO–CH3 + I2 = ICH2–CO–CH3–CO–CH2I + 2I + 2H+.

3.1.4. Effect of Time on Anodic Dissolution

To investigate the effect of time on the amount of dissolution in acac/EtOH, the concentration of Fe ions in the solution was measured at various time intervals of 10, 30, 60, 90, 100, 110, 130, 150, and 180 s, while applying a voltage of 200 V (as shown in Figure 2c).
As illustrated in Figure 2c, there was no anodic dissolution in the initial 10 s; however, it gradually increased and reached its maximum amount of 31.6 ppm Fe ions after 180 s of applying a voltage of 200 V. The linear increase in dissolution over time can be attributed to the extraction of more ions from the surface, providing more sites for dissolution [37]. This explains why there was no dissolution in the first few seconds, and it increased gradually. In conclusion, the diagram clearly shows that anodic dissolution is a time-dependent process and requires a certain amount of time to initiate after the application of an electric field.

3.2. XRD Analysis

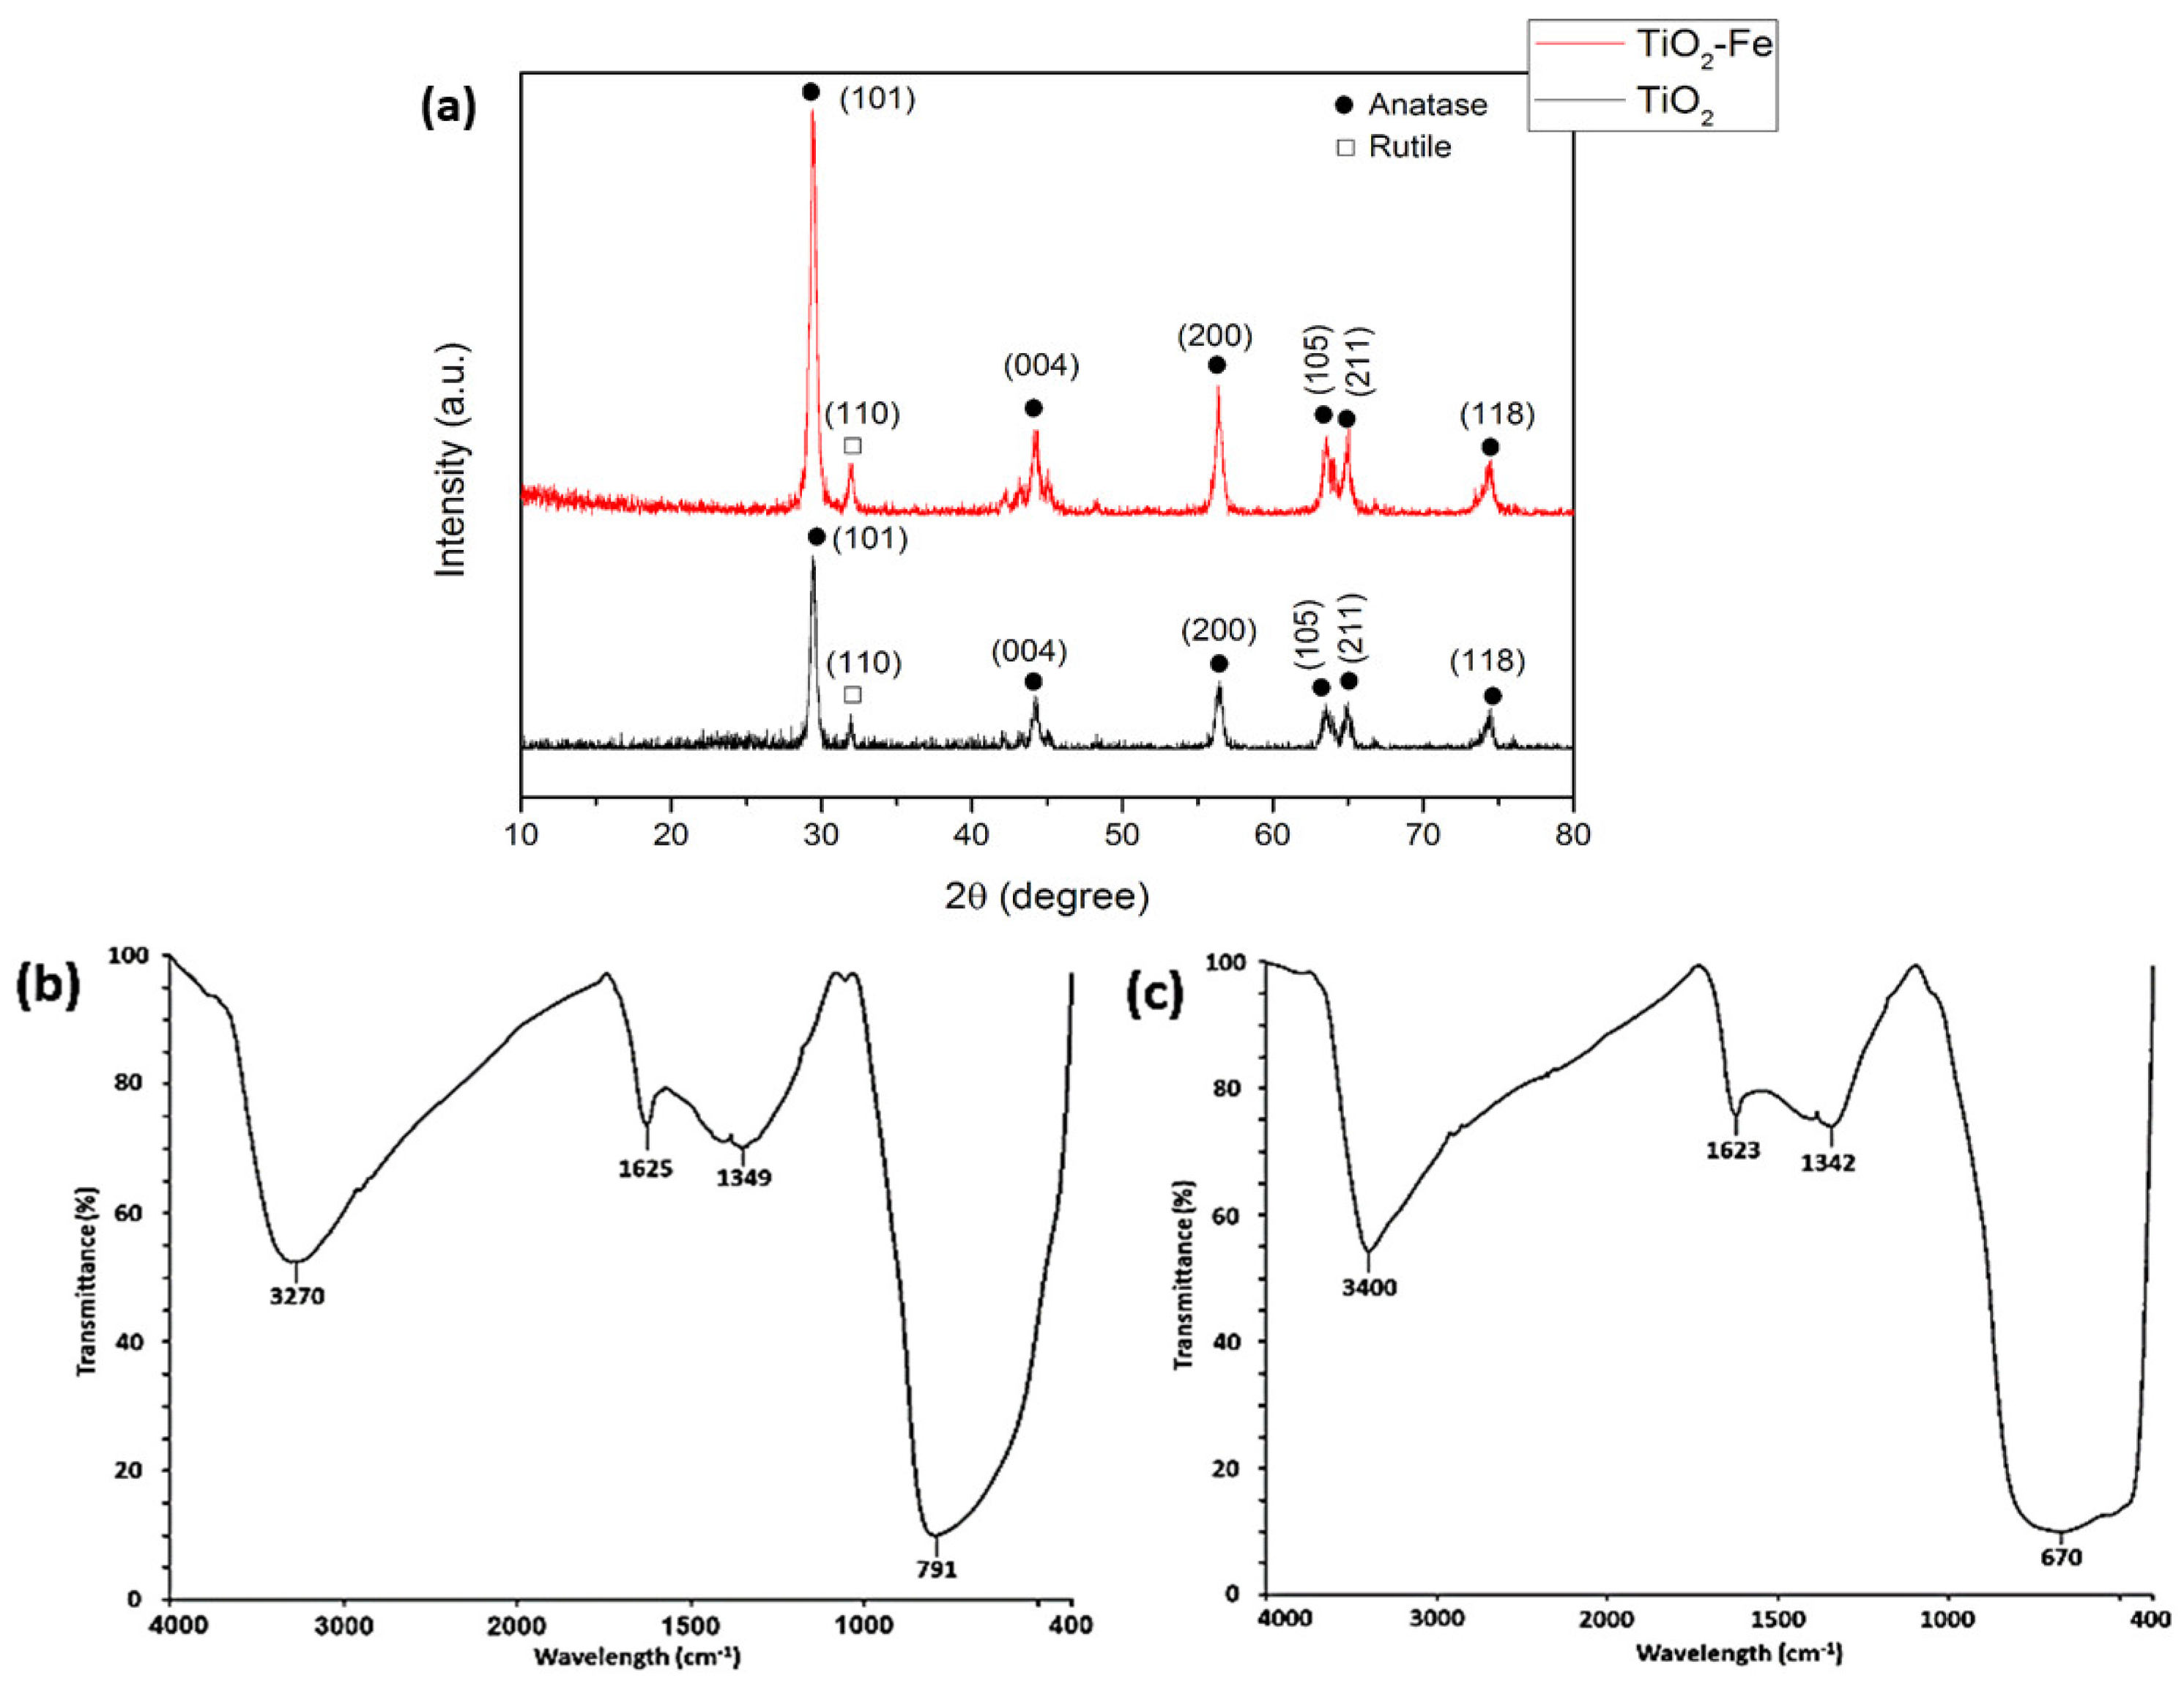
The phase structure of undoped and doped TiO2 nanoparticles was analyzed using the XRD technique. The XRD patterns of the samples (Figure 3a) reveal that anatase is the main phase (JCPDS No: 21-1272) [50]. There is no peak attributed to Fe, suggesting that Fe has not reacted with TiO2 to form a second phase. The shift in XRD peaks towards lower angles observed in the doped samples is an indication of structural expansion caused by the larger ionic radius of Fe3+ compared to that of Ti4+. This observation is consistent with previous reports on the effect of doping on the crystal structure of TiO2. For example, doping shifted the strong peak of (101) from 29.4° to 29.2°. Based on the Bragg formula (nλ = 2dsinθ, where λ is the wavelength of the X-ray, d is the spacing of the crystal layers, θ is the angle between the incident ray and the scatter, and n is an integer), the d is inversely correlated to the diffraction angle. However, it should be noted that excessive doping can deteriorate the crystal structure of TiO2. It has been reported that more than 3% of dopants can remarkably change the crystal structure and cause nucleation and growth of the rutile phase [31].
Moreover, the XRD patterns of the undoped and doped TiO2 nanoparticles were analyzed using the Debye–Scherrer equation [51] (D = Kλ/Bcosθ, where λ is the wavelength of the X-ray, K is the shape factor, B is the full width at half maximum (FWHM), and θ is the angle of peak), which relates the crystallite size of the material to FWHM of the XRD peak. The FWHM is influenced by various factors such as crystal size, lattice strain, and instrumental broadening. Based on this equation, the crystallite size for both samples was measured to be 15.7 nm and 17.8 nm, respectively. The results suggest that the doping of TiO2 nanoparticles with Fe did not significantly affect the crystallite size.

3.3. FTIR Analysis

FTIR spectroscopy is a powerful tool for identifying the chemical bonds present in a material. As shown in Figure 3b, there are four characteristic peaks at 791, 1349, 1625, and 3227 cm−1 in the TiO2 spectrum. The first and second bands are attributed to the stretching and bending of Ti-O, and the two last ones originated from the stretching and bending of Ti-OH, which are in good agreement with other reports [25,52]. Upon doping with Fe, the obtained FTIR spectrum of Fe-doped TiO2 is similar to that of pure TiO2 with a slight shift in the wavenumber of the absorbance peaks. However, the peak at around 480 cm−1 in the pure TiO2 spectrum appears broadened in the Fe-doped TiO2 spectrum, extending up to around 670 cm−1 (Figure 3c) [31,53]. This broadening of the peak is indicative of the vibration of the Fe-O bond, suggesting that Fe ions have been successfully incorporated into the TiO2 lattice. This finding is consistent with the XRD results, which indicated the absence of a second phase of Fe-TiO2 in the doped samples.

3.4. TEM Analysis

TEM analysis was used to investigate the morphology and microstructure of the synthesized material, which revealed polygonal-shaped particles, as shown in Figure 4a,b. This morphology has been observed in other studies as well [54,55]. Further analysis was carried out by measuring the particle size of 100 observable particles in the TEM image and generating a histogram of particle size distribution, which is presented in Figure 4c. The results showed that particles with a diameter of 20–25 nm had the highest population, accounting for 34% of the total particles analyzed. The smallest and largest measured diameters were 14.28 nm and 60.02 nm, respectively. Additionally, the mean particle size and standard deviation were measured as 26.67 nm and 8.80 nm, respectively.
High-resolution transmission electron microscopy (HRTEM) was also utilized to provide further insights into the synthesized nanoparticles. As shown in Figure 4d, the distance between the diffraction planes of (101) and (004) was determined to be 0.42 nm and 0.32 nm, respectively. The slightly higher value obtained for this sample compared to pure anatase can be attributed to the doping of Fe into the TiO2 structure [53]. Using the selected-area electron diffraction (SAED) method, the crystalline structure of the sample was studied, which confirmed the anatase structure (JCPDS No. 21-1272), as shown in Figure 4e. Moreover, the observed pattern confirmed that the sample is a polycrystalline material with a crystallite size equal to or larger than 10 nm, which is in agreement with the XRD results.

3.5. UV-Vis Analysis

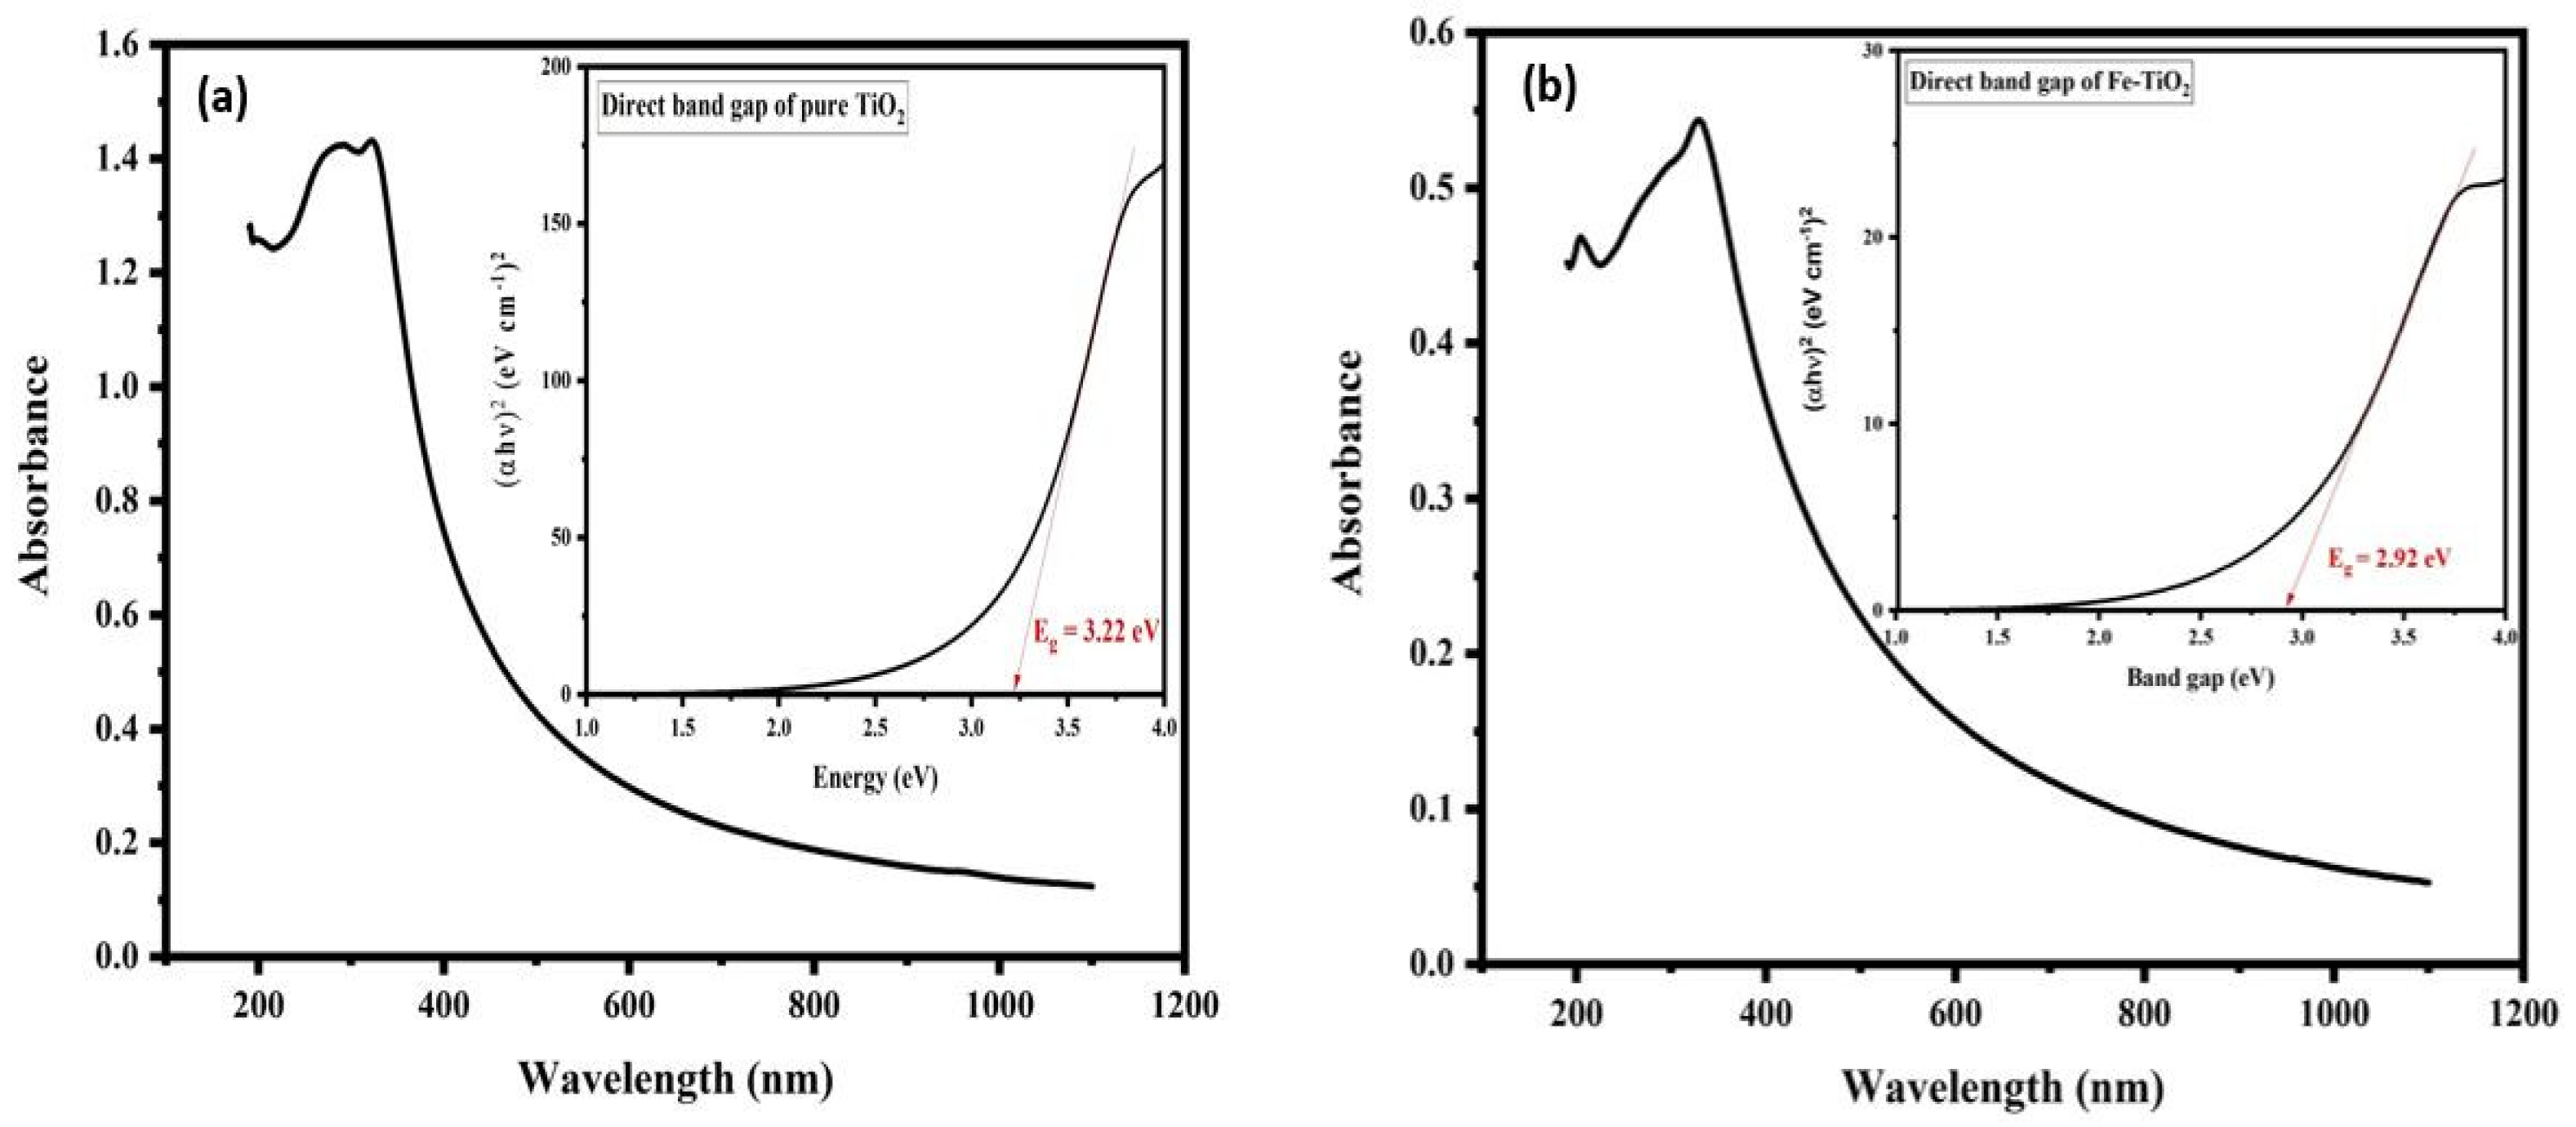
UV-vis spectroscopy is an indispensable tool for investigating the optical characteristics of materials and determining their optical band gap. Figure 5a,b present the UV-vis spectra and Tauc plots of pure TiO2 and Fe-doped TiO2, respectively. The red shift observed in the Fe-doped TiO2 spectrum indicates that visible light is partially absorbed as a result of Fe ion doping. This shift can be attributed to charge transfer transitions between the d electrons of Fe and the conduction or valence band of TiO2, or d-d transitions in the crystal field depending on the energy levels [56,57]. The introduction of Fe into the TiO2 lattice introduces new energy levels, leading to a reduction of the band gap from 3.22 to 2.92 eV for the direct band gap, as shown in Figure 5. This decrease in the band gap as a result of Fe doping has also been reported by numerous other researchers [11,23,58]. Previous studies have also reported a decrease in the optical band gap of Fe-doped TiO2. For example, in a study [11], the band gap decreased from 3.09 eV to 3.02 eV and 2.89 eV by doping with 0.5 wt.% and 0.7 wt.% Fe, respectively. Similarly, Tae-hyun Lee et al. reported a decrease in the band gap value from 3.0 eV to 2.2 eV with 2 wt.% Fe doping [59]. These findings suggest that Fe doping can be a viable approach to modifying the optical properties of TiO2 for applications in photocatalysis and solar energy conversion.

3.6. Electrophoretic Deposition of Synthesized Fe-TiO2 Nanoparticle

3.6.1. FESEM Analysis

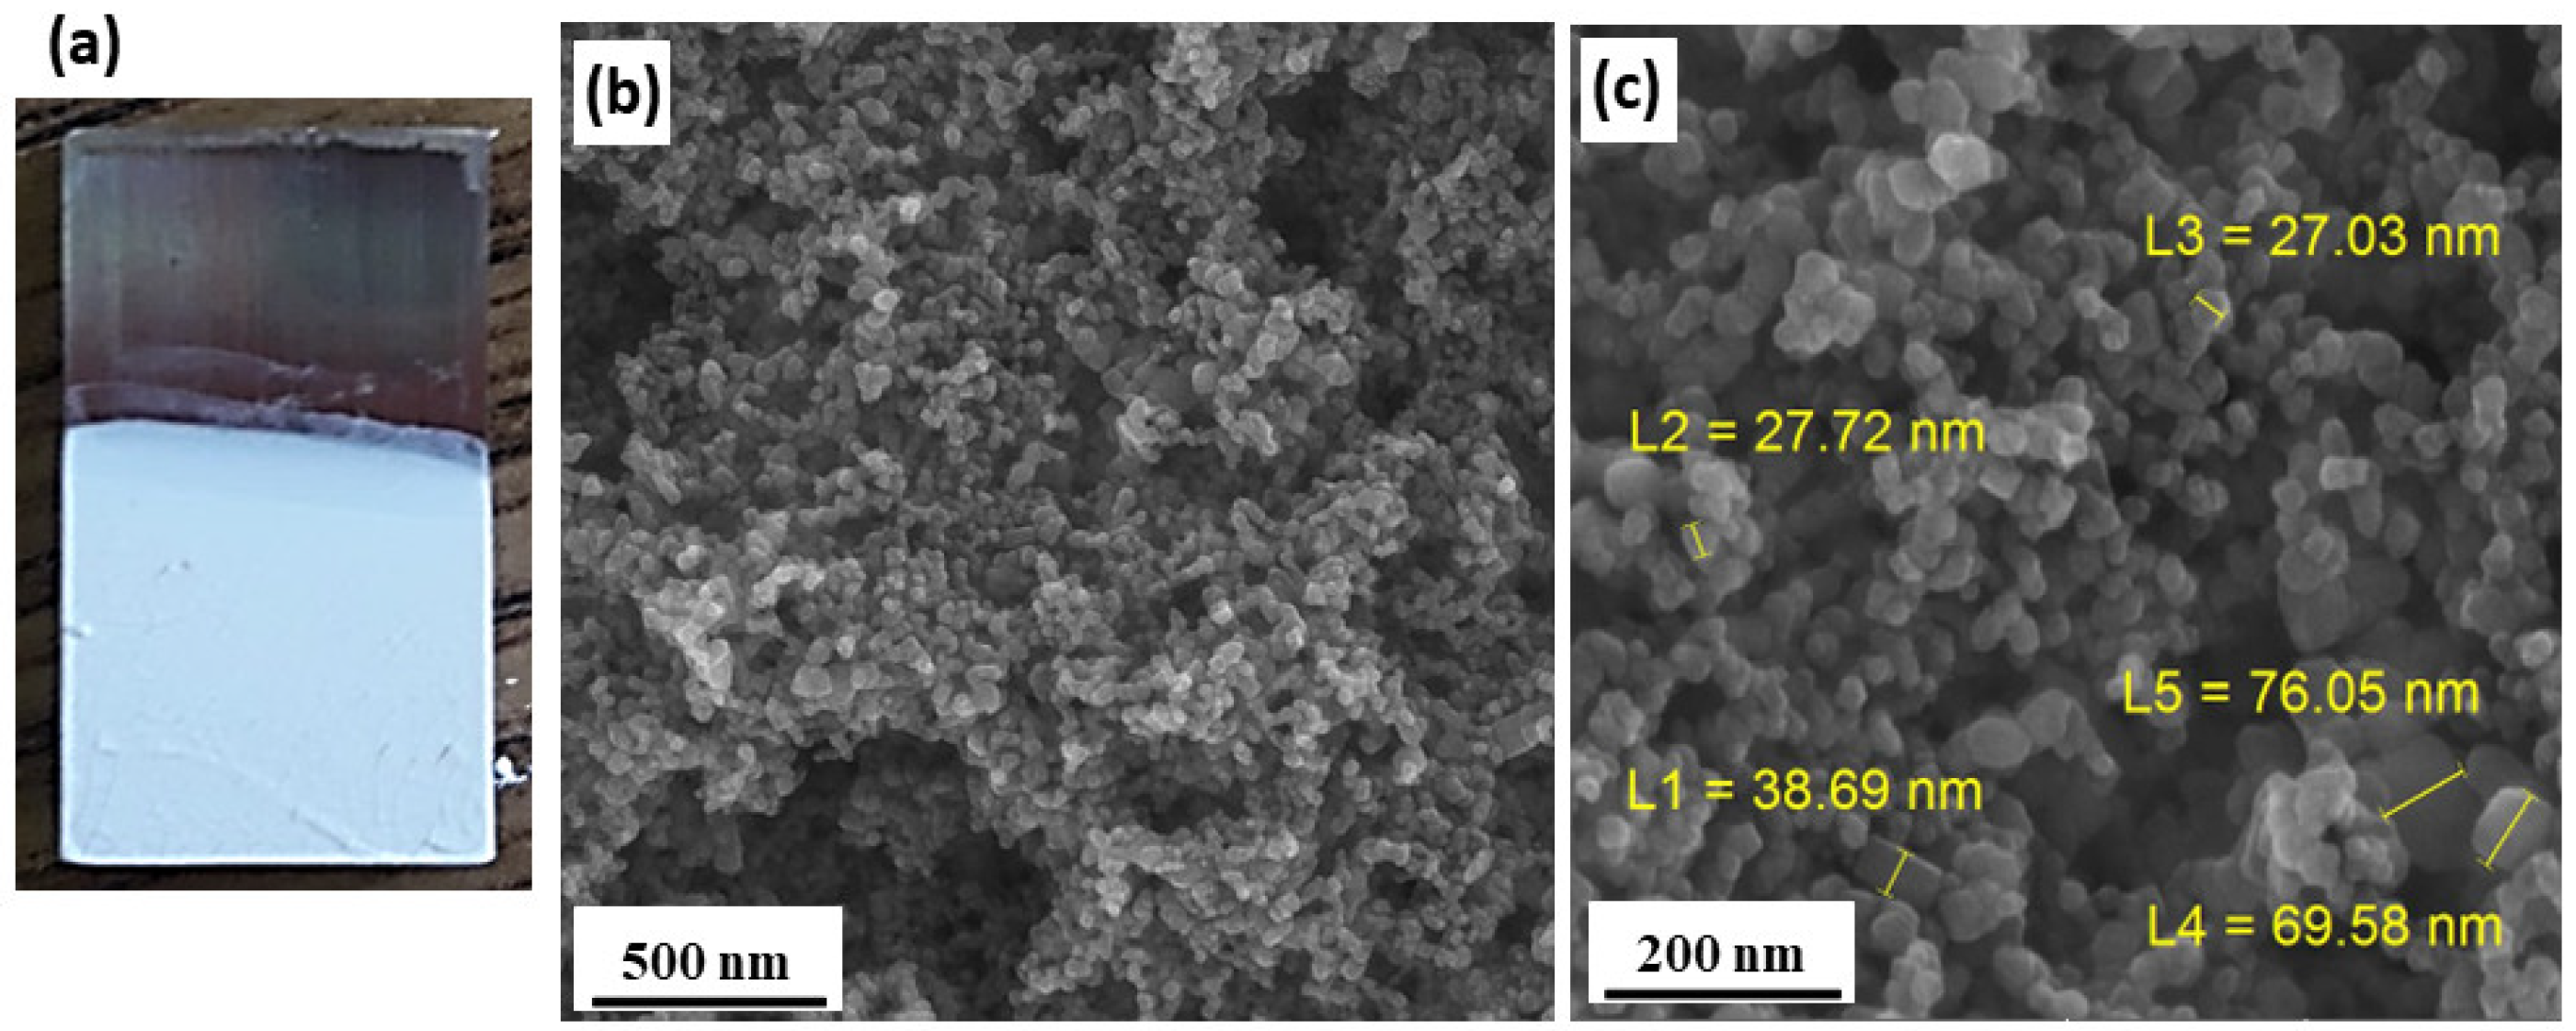
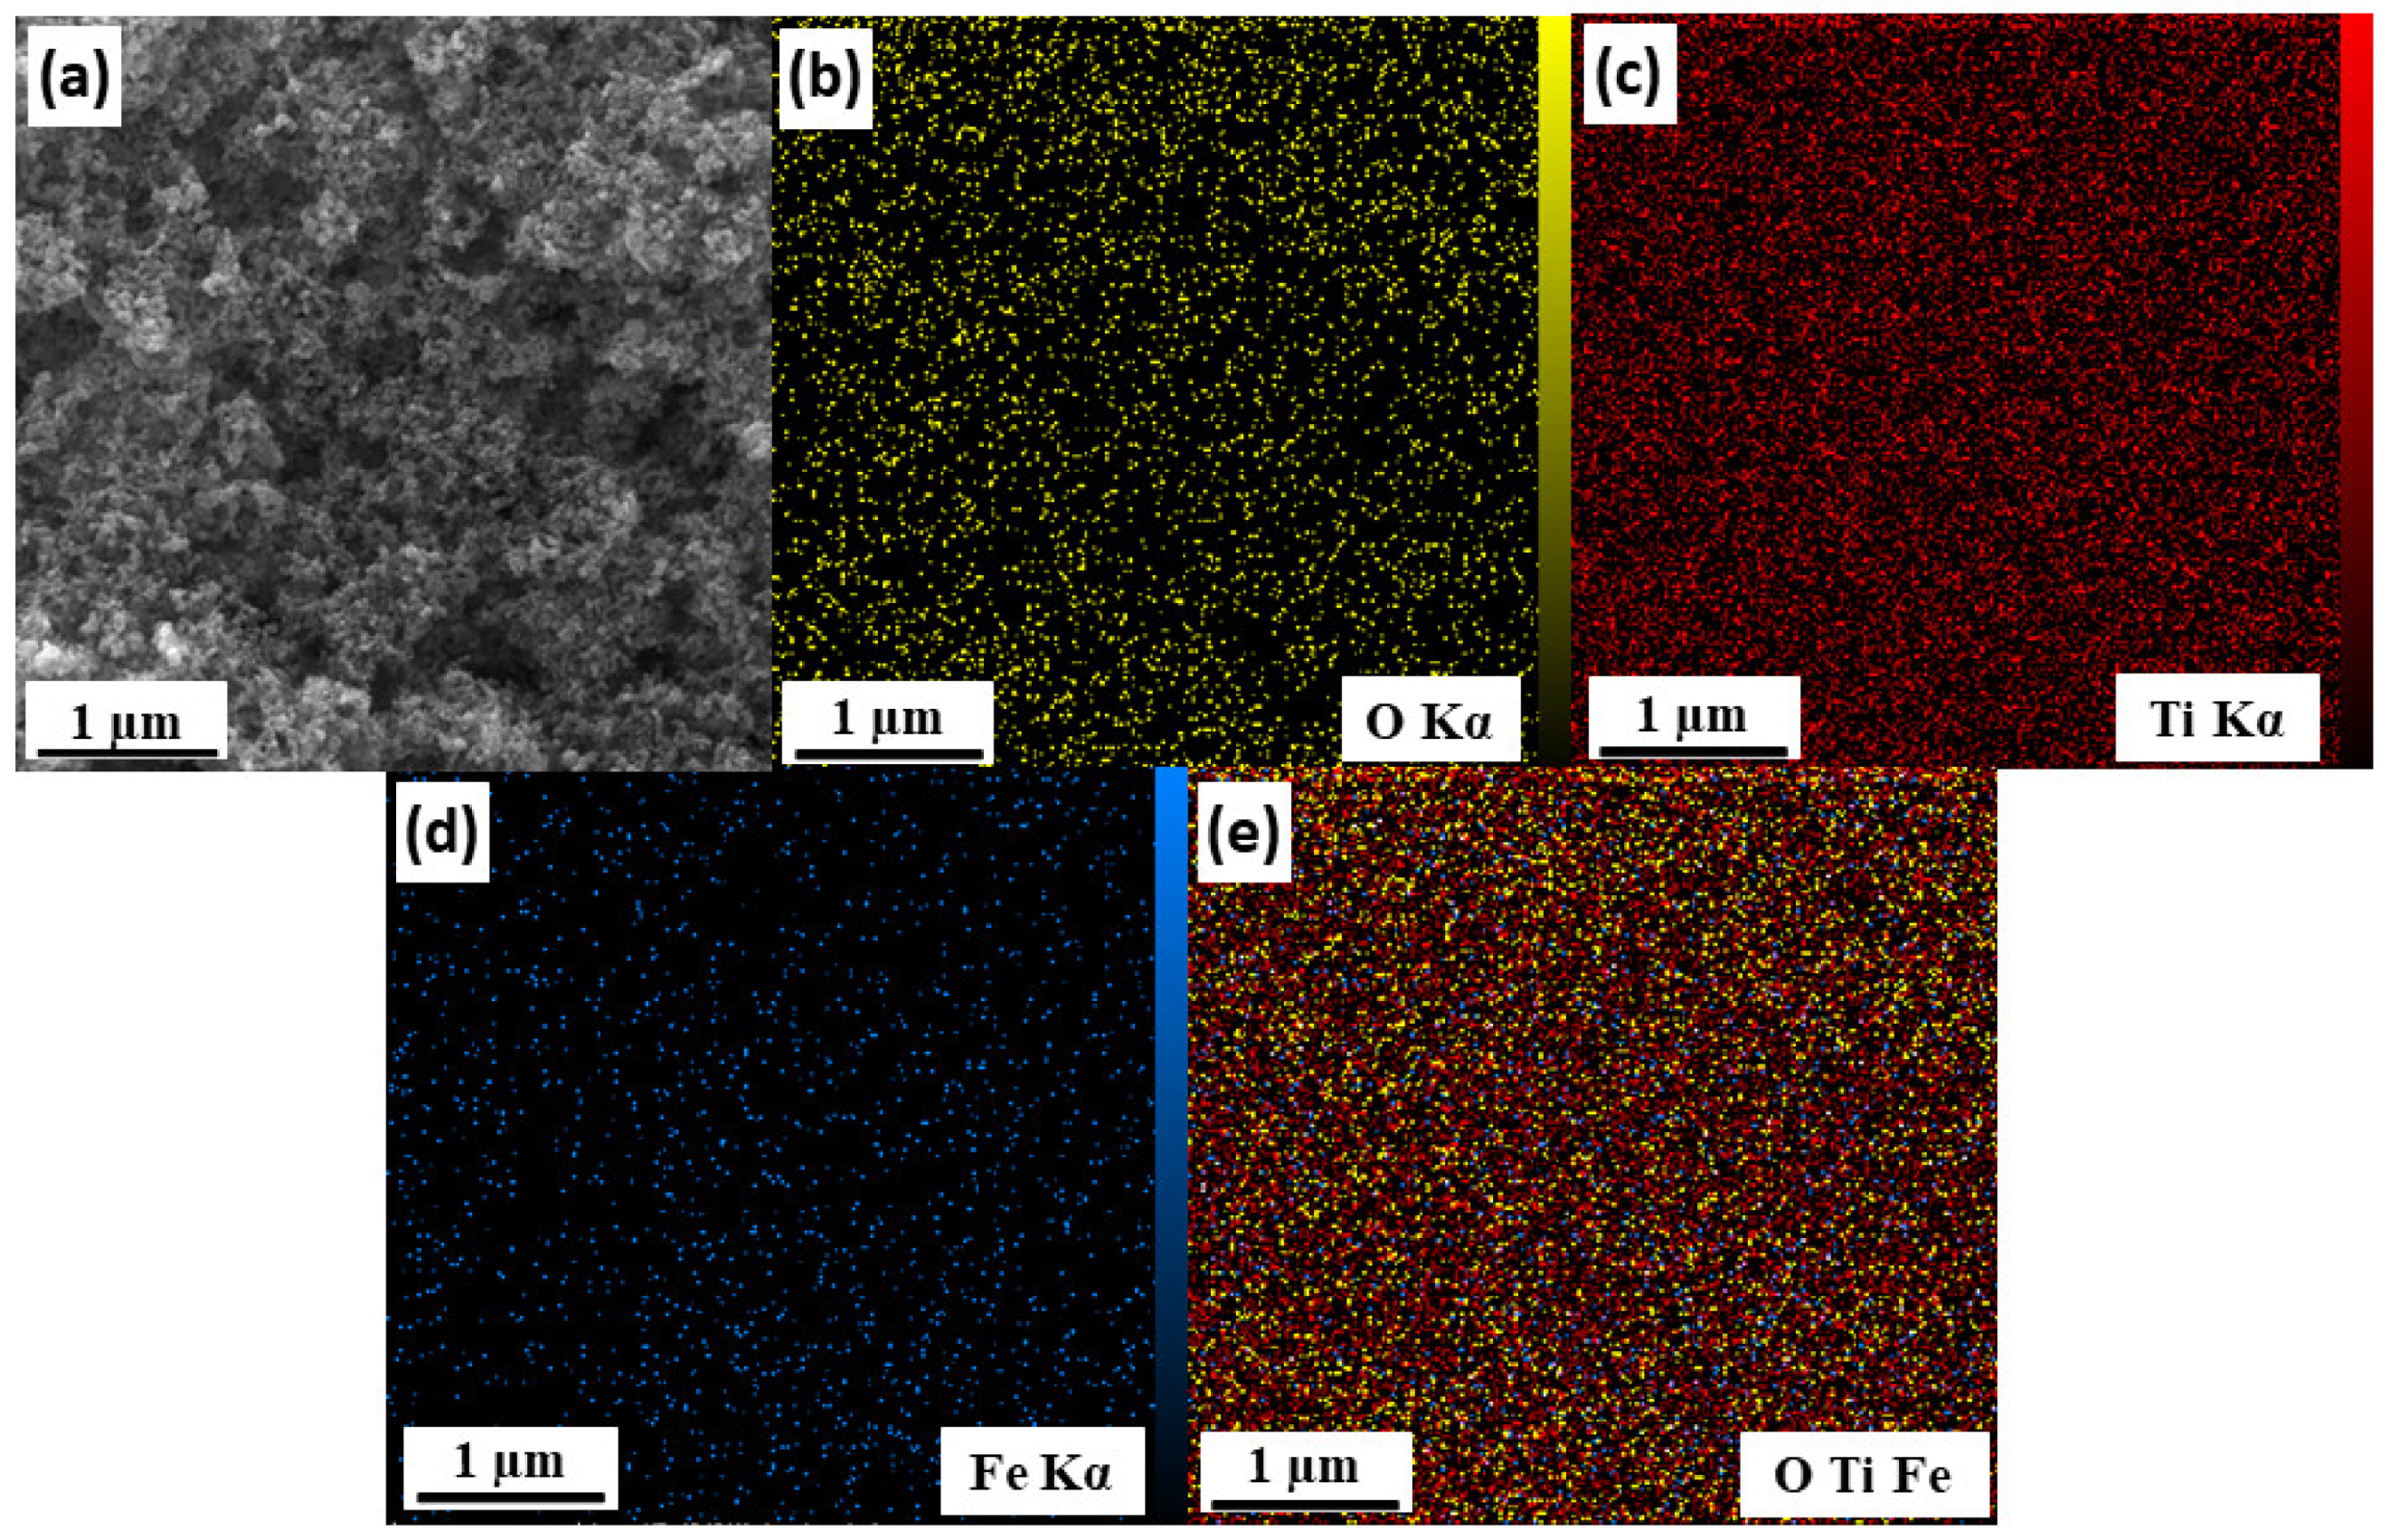
The EPD method was employed to deposit a smooth and crack-free layer of Fe-TiO2 on the cathode, as depicted in Figure 6a. The resulting FESEM images of the Fe-doped TiO2 layer in Figure 6a,b indicate that the particles have a nanosized spherical morphology. Moreover, the energy-dispersive X-ray spectroscopy (EDS) analysis of the deposited layer confirms the fair distribution of Fe within the TiO2 structure, as shown in Figure 7a–e. Previous studies by Zhu et al. [60] and Reaple et al. [11] synthesized Fe-TiO2 using hydrothermal and wet impregnation methods, respectively, utilizing FeCl3 as the precursor. However, the presence of Cl in the final product as an impurity reduces the photocatalytic activity. In contrast, the EPD method coupled with anodic dissolution was successful in doping Fe ions into the TiO2 structure without any further impurities.

3.6.2. Deposition Weight of the Layer

The weight of the deposited Fe-doped TiO2 layer as a function of applied voltage and time is illustrated in Figure 8a,b, respectively. As per the Hamaker formula [61], the weight of the formed layer on the electrode surface increases with an increase in time and voltage. However, the deposition rate tends to decrease with an increase in layer thickness, leading to a reduction of voltage.
Moreover, increasing the deposition time allows more particles to move toward the electrode [62], but the weight of the deposited layer does not entirely comply with the Hamaker equation as it neglects the effect of voltage drop [63]. It is observed that the deposition rate in the initial minutes of the process is high, but it tends to decline in the following minutes until no significant change in the weight of the deposited layer is observed. This phenomenon is attributed to two main factors: (i) the increasing thickness of the layer leading to voltage drop, as the layer is almost an insulator; and (ii) decreasing the concentration of the suspension, which results in voltage drop, according to the Hamaker equation [64].

4. Conclusions

In conclusion, a novel and efficient method for doping Fe into the TiO2 structure has been presented in this study. Through a careful investigation of the solvent and process parameters, acac/EtOH was identified as the optimal medium for the doping process. Anodic dissolution of iron occurred under the application of 200 V voltage for 10 min in the presence of 5 mg iodine as a corrosive agent, followed by the addition of 1.066 g titania and 30 min sonication to achieve 1.5% Fe-TiO2, which was subsequently dried at 80 °C and calcined at 400 °C for 3 h. The resulting powder was analyzed by XRD, FTIR, TEM, and UV-vis techniques, which confirmed the successful doping of Fe into the TiO2 structure. Notably, a minor alteration was observed in the XRD pattern, a new band appeared in the FTIR spectra corresponding to the Fe-O bond, and the optical band gap was significantly reduced from 3.22 to 2.92 eV. Moreover, the Fe-TiO2 layer was obtained by the EPD method, resulting in a high-quality and crack-free layer. Importantly, the amount of dopant can be easily regulated using this method, enabling tailoring of the TiO2 band gap for various applications. Further research is necessary to investigate the critical aspects of the doping process in greater detail. Nonetheless, the findings presented here offer promising insights into the development of novel materials for potential use in a range of advanced technological applications.

Author Contributions

Conceptualization, S.C. and A.T.; methodology, S.C. and A.T.; software, S.C., A.T. and S.A.A.A.; formal analysis, S.C. and A.T.; investigation, S.C., A.T. and S.A.A.A.; resources, B.R., F.T.-A., R.R. and M.S.Y.; writing—original draft preparation, S.C., A.T., B.R. and S.A.A.A.; writing—review and editing, S.C., A.T., S.A.A.A., B.R., F.T.-A., R.R. and M.S.Y.; supervision, B.R., F.T.-A., R.R. and M.S.Y. All authors have read and agreed to the published version of the manuscript.

Funding

This research received no external funding.

Institutional Review Board Statement

Not applicable.

Informed Consent Statement

Not applicable.

Data Availability Statement

Data are contained within the article.

Conflicts of Interest

The authors declare no conflict of interest.

References

  1. Castillo-Robles, J.A.; Rocha-Rangel, E.; Ramírez-de-León, J.A.; Caballero-Rico, F.C.; Armendáriz-Mireles, E.N. Armendáriz-Mireles, Advances on dye-sensitized solar cells (DSSCs) nanostructures and natural colorants: A review. J. Compos. Sci. 2021, 5, 288. [Google Scholar] [CrossRef]
  2. Negishi, N.; Sugasawa, M.; Miyazaki, Y.; Hirami, Y.; Koura, S. Effect of dissolved silica on photocatalytic water purification with a TiO2 ceramic catalyst. Water Res. 2019, 150, 40–46. [Google Scholar] [CrossRef]
  3. Silva, G.M.G.; Leão, V.N.S.; Pereira, M.F.G.; Faia, P.M.; Araújo, E.S. Zn2+-doped TiO2:WO3 films prepared by electrospinning and sintering: Microstructural characterization and electrical signature to moisture sensing. Ceramics 2021, 4, 576–591. [Google Scholar] [CrossRef]
  4. Lee, Y.Y.; Ho, W.J.; Yeh, C.W. Fabrication of silicon solar cell with >18% efficiency using spin-on-film processing for phosphorus diffusion and SiO2/graded index TiO2 anti-reflective coating. Appl. Surf. Sci. 2015, 354, 20–24. [Google Scholar] [CrossRef]
  5. Nasir, A.; Khalid, S.; Yasin, T.; Mazare, A. A Review on the Progress and Future of TiO2/Graphene Photocatalysts. Energies 2022, 15, 6248. [Google Scholar] [CrossRef]
  6. Alem, S.A.A.; Latifi, R.; Angizi, S.; Hassanaghaei, F.; Aghaahmadi, M.; Ghasali, E.; Rajabi, M. Microwave sintering of ceramic reinforced metal matrix composites and their properties: A review. Mater. Manuf. Process. 2020, 35, 303–327. [Google Scholar] [CrossRef]
  7. Verchère, A.; Cottrino, S.; Fantozzi, G.; Mishra, S.; Gaudisson, T.; Blanchard, N.; Pailhès, S.; Daniele, S.; Le Floch, S. Effect of high pressure spark plasma sintering on the densification of a nb-doped TiO2 nanopowder. Ceramics 2020, 3, 507–520. [Google Scholar] [CrossRef]
  8. Kobayashi, M.; Kato, H.; Miyazaki, T.; Kakihana, M. Hydrothermal synthesis of pseudocubic rutile-type titania particles. Ceramics 2019, 2, 56–63. [Google Scholar] [CrossRef] [Green Version]
  9. Tismanar, I.; Obreja, A.C.; Buiu, O.; Duta, A. TiO2–Graphene Oxide and TiO2–Reduced Graphene Oxide Composite Thin Films for Solar Photocatalytic Wastewater Treatment. Energies 2022, 15, 9416. [Google Scholar] [CrossRef]
  10. Scanlon, D.O.; Dunnill, C.W.; Buckeridge, J.; Shevlin, S.A.; Logsdail, A.J.; Woodley, S.M.; Catlow, C.R.A.; Powell, M.J.; Palgrave, R.G.; Parkin, I.P.; et al. Buckeridge, Band alignment of rutile and anatase TiO2. Nat. Mater. 2013, 12, 798–801. [Google Scholar] [CrossRef]
  11. Realpe, Á.; Núñez, D.P.; Herrera, A. Synthesis of Fe-Tio2 nanoparticles for photoelectrochemical generation of hydrogen. Int. J. ChemTech Res. 2016, 9, 453–464. [Google Scholar]
  12. Angizi, S.; Alem, S.A.A.; Azar, M.H.; Shayeganfar, F.; Manning, M.I.; Hatamie, A.; Pakdel, A.; Simchi, A. A comprehensive review on planar boron nitride nanomaterials: From 2D nanosheets towards 0D quantum dots. Prog. Mater. Sci. 2022, 124, 100884. [Google Scholar] [CrossRef]
  13. Angizi, S.; Alem, S.A.A.; Pakdel, A. Towards Integration of Two-Dimensional Hexagonal Boron Nitride (2D h-BN) in Energy Conversion and Storage Devices. Energies 2022, 15, 1162. [Google Scholar] [CrossRef]
  14. Sacco, O.; Sannino, D.; Matarangolo, M.; Vaiano, V. Room Temperature Synthesis of V-Doped TiO2 and Its Photocatalytic Activity in the Removal of Caffeine under UV Irradiation. Materials 2019, 12, 911. [Google Scholar] [CrossRef] [Green Version]
  15. Peng, Y.H.; Huang, G.F.; Huang, W.Q. Visible-light absorption and photocatalytic activity of Cr-doped TiO2 nanocrystal films. Adv. Powder Technol. 2012, 23, 8–12. [Google Scholar] [CrossRef]
  16. MMarami, B.; Farahmandjou, M.; Khoshnevisan, B. Sol–Gel Synthesis of Fe-Doped TiO2 Nanocrystals. J. Electron. Mater. 2018, 47, 3741–3748. [Google Scholar] [CrossRef]
  17. Xu, Z.; Li, C.; Fu, N.; Li, W.; Zhang, G. Facile synthesis of Mn-doped TiO2 nanotubes with enhanced visible light photocatalytic activity. J. Appl. Electrochem. 2018, 48, 1197–1203. [Google Scholar] [CrossRef]
  18. Jeon, M.S.; Yoon, W.S.; Joo, H.; Lee, T.K.; Lee, H. Preparation and characterization of a nano-sized Mo/Ti mixed photocatalyst. Appl. Surf. Sci. 2000, 165, 209–216. [Google Scholar] [CrossRef]
  19. Manzoor, M.; Rafiq, A.; Ikram, M.; Nafees, M.; Ali, S. Structural. optical, and magnetic study of Ni-doped TiO2 nanoparticles synthesized by sol–gel method. Int. Nano Lett. 2018, 8, 1–8. [Google Scholar] [CrossRef] [Green Version]
  20. Serga, V.; Burve, R.; Krumina, A.; Pankratova, V.; Popov, A.I.; Pankratov, V. Study of phase composition. photocatalytic activity, and photoluminescence of TiO2 with Eu additive produced by the extraction-pyrolytic method. J. Mater. Res. Technol. 2021, 13, 2350–2360. [Google Scholar] [CrossRef]
  21. Slimani, Y.; Almessiere, M.A.; Mohamed, M.J.; Hannachi, E.; Caliskan, S.; Akhtar, S.; Baykal, A.; Gondal, M.A. Synthesis of Ce and Sm Co-Doped TiO2 Nanoparticles with Enhanced Photocatalytic Activity for Rhodamine B Dye Degradation. Catalysts 2023, 13, 668. [Google Scholar] [CrossRef]
  22. Nair, P.B.; Justinvictor, V.B.; Daniel, G.P.; Joy, K.; Ramakrishnan, V.; Kumar, D.D.; Thomas, P.V. Structural. optical, photoluminescence and photocatalytic investigations on Fe doped TiO2 thin films. Thin Solid Films 2014, 550, 121–127. [Google Scholar] [CrossRef]
  23. Singh, A.P.; Kumari, S.; Shrivastav, R.; Dass, S.; Satsangi, V.R. Iron doped nanostructured TiO2 for photoelectrochemical generation of hydrogen. Int. J. Hydrog. Energy 2008, 33, 5363–5368. [Google Scholar] [CrossRef]
  24. Zhang, Y.; Shen, Y.; Gu, F.; Wu, M.; Xie, Y.; Zhang, J. Influence of Fe ions in characteristics and optical properties of mesoporous titanium oxide thin films. Appl. Surf. Sci. 2009, 256, 85–89. [Google Scholar] [CrossRef]
  25. Ali, T.; Tripathi, P.; Azam, A.; Raza, W.; Ahmed, A.S.; Ahmed, A.; Muneer, M. Photocatalytic performance of Fe-doped TiO2 nanoparticles under visible-light irradiation. Mater. Res. Express 2017, 4, 015022. [Google Scholar] [CrossRef]
  26. Komaraiah, D.; Radha, E.; Kalarikkal, N.; Sivakumar, J.; Reddy, M.V.R.; Sayanna, R. Structural. optical and photoluminescence studies of sol-gel synthesized pure and iron doped TiO2 photocatalysts. Ceram. Int. 2019, 45, 25060–25068. [Google Scholar] [CrossRef]
  27. Ranjit, K.T.; Viswanathan, B. Synthesis. characterization and photocatalytic properties of iron-doped TiO2 catalysts. J. Photochem. Photobiol. A Chem. 1997, 108, 79–84. [Google Scholar] [CrossRef]
  28. Zhang, Z.; Wang, C.; Zakaria, R.; Ying, J.Y. Role of Particle Size in Nanocrystalline TiO2-Based Photocatalysts. J. Phys. Chem. B 1998, 102, 10871–10878. [Google Scholar] [CrossRef]
  29. Shi, J.; Chen, G.; Zeng, G.; Chen, A.; He, K.; Huang, Z.; Hu, L.; Zeng, J.; Wu, J.; Liu, W. Hydrothermal synthesis of graphene wrapped Fe-doped TiO2 nanospheres with high photocatalysis performance. Ceram. Int. 2018, 44, 7473–7480. [Google Scholar] [CrossRef]
  30. Aba-Guevara, C.G.; Medina-Ramírez, I.E.; Hernández-Ramírez, A.; Jáuregui-Rincón, J.; Lozano-Álvarez, J.A.; Rodríguez-López, J.L. Comparison of two synthesis methods on the preparation of Fe, N-Co-doped TiO2 materials for degradation of pharmaceutical compounds under visible light. Ceram. Int. 2017, 43, 5068–5079. [Google Scholar] [CrossRef]
  31. Dholam, R.; Patel, N.; Adami, M.; Miotello, A. Hydrogen production by photocatalytic water-splitting using Cr- or Fe-doped TiO2 composite thin films photocatalyst. Int. J. Hydrog. Energy 2009, 34, 5337–5346. [Google Scholar] [CrossRef]
  32. Sobczyk-Guzenda, A.; Owczarek, S.; Szymanowski, H.; Volesky, L.; Walkowiak, B.; Miszczak, S.; Gazicki-Lipman, M. Iron doped thin TiO2 films synthesized with the RF PECVD method. Ceram. Int. 2015, 41, 7496–7500. [Google Scholar] [CrossRef]
  33. Bally, A.R.; Korobeinikova, E.N.; Schmid, P.E.; Lévy, F.; Bussy, F. Structural and electrical properties of Fe-doped TiO2 thin films. J. Phys. D Appl. Phys. 1998, 31, 1149–1154. [Google Scholar] [CrossRef]
  34. Saadati, H.; Raissi, B.; Riahifar, R.; Yaghmaee, M.S. How preparation of suspensions affects the electrophoretic deposition phenomenon. J. Eur. Ceram. Soc. 2016, 36, 299–305. [Google Scholar] [CrossRef]
  35. Navidirad, M.; Raissi, B.; Riahifar, R.; Yaghmaee, M.S.; Kazemzadeh, A. Effect of polyethylenimine on electrophoretic deposition of TiO2 nanoparticles in alternating current electric field. J. Mater. Sci. Mater. Electron. 2014, 25, 5041–5050. [Google Scholar] [CrossRef]
  36. Raissi, B.; Riahifar, R.; Yaghmaee, M.S.; Taati-Asil, F.; Aghaei, A.; Chatrnoor, S.; Taghadossi, A.H.; Irankhah, R.; Karimi, M. DC-EPD of nanoceramic particles accelerated via anodic dissolution in organic media. Int. J. Mater. Res. 2018, 109, 356–361. [Google Scholar] [CrossRef]
  37. Ahmadi, S.S.S.; Raissi, B.; Riahifar, R.; Yaghmaee, M.S.; Saadati, H.R.; Ghashghaie, S.; Javaheri, M. Fabrication of counter electrode of electrochemical CO gas sensor by electrophoretic deposition of MWCNT. J. Electrochem. Soc. 2015, 162, D3101–D3108. [Google Scholar] [CrossRef]
  38. Narkevica, I.; Stradina, L.; Stipniece, L.; Jakobsons, E.; Ozolins, J. Electrophoretic deposition of nanocrystalline TiO2 particles on porous TiO2-x ceramic scaffolds for biomedical applications. J. Eur. Ceram. Soc. 2017, 37, 3185–3193. [Google Scholar] [CrossRef]
  39. Ishii, K.; Matsunaga, C.; Kobayashi, K.; Stevenson, A.J.; Tardivat, C.; Uchikoshi, T. Fabrication of BSCF-based mixed ionic-electronic conducting membrane by electrophoretic deposition for oxygen separation application. J. Eur. Ceram. Soc. 2019, 39, 5292–5297. [Google Scholar] [CrossRef]
  40. Mercier, H.; Malič, B.; Uršič, H.; Hreščak, J.; Levassort, F.; Kuscer, D. Electrophoretic deposition and properties of strontium-doped sodium potassium niobate thick films. J. Eur. Ceram. Soc. 2017, 37, 5305–5313. [Google Scholar] [CrossRef]
  41. Ahmadi, S.S.S.; Riahifar, R.; Raissi, B.; Yaghmaee, M.S.; Metselaar, H.S.C.; Javaheri, M. Electrophoretic deposition of MWCNT on a PTFE layer for making working electrode of oxygen sensor. J. Electrochem. Soc. 2017, 164, B506–B512. [Google Scholar] [CrossRef]
  42. Mishyn, V.; Aspermair, P.; Leroux, Y.; Happy, H.; Knoll, W.; Boukherroub, R.; Szunerits, S. “Click” Chemistry on Gold Electrodes Modified with Reduced Graphene Oxide by Electrophoretic Deposition. Surfaces 2019, 2, 193–204. [Google Scholar] [CrossRef] [Green Version]
  43. Van Dao, D.; Adilbish, G.; Le, T.D.; Lee, I.H.; Yu, Y.T. Triple phase boundary and power density enhancement in PEMFCs of a Pt/C electrode with double catalyst layers. RSC Adv. 2019, 9, 15635–15641. [Google Scholar] [CrossRef] [Green Version]
  44. Babadi, P.; Sadreddini, S.; Mohsenifar, F.; Roshani, M. The Influence of Electrophoretic Potential on Ni–Al2O3 Nano-Composite Coating. Prot. Met. Phys. Chem. Surfaces. 2016, 52, 249–253. [Google Scholar] [CrossRef]
  45. Kamada, K.; Maehara, K.; Mukai, M.; Ida, S.; Matsumoto, Y. Fabrication of metal oxide-diamond composite films by electrophoretic deposition and anodic dissolution. J. Mater. Res. 2003, 18, 2826–2831. [Google Scholar] [CrossRef]
  46. Moreno, C.H.A.; Cocke, D.L.; Gromes, J.A.; Morkovsky, P.; Parga, J.R.; Peterson, E.; Garcia, C. Electrochemical reactions for electrocoagulation using iron electrodes. Ind. Eng. Chem. Res. 2009, 48, 2275–2282. [Google Scholar] [CrossRef]
  47. Jackman, L.M.; Lange, B.C. Structure and Reactivity of Alkali Metal Enolates. Tetrahedron 1977, 22, 2737–2769. [Google Scholar] [CrossRef]
  48. Negishi, H.; Endo, A.; Ohraori, T.; Sakaki, K. Fabrication of mesoporous silica coating by electrophoretic deposition. Ind. Eng. Chem. Res. 2008, 47, 7236–7241. [Google Scholar] [CrossRef]
  49. Ishihara, T.; Shimose, K.; Shiomitsu, T.; Takita, Y. Electrophoretic Deposition of Y2O3-Stabilized ZrO2 on the Porous La0.8Sr0.2MnO3 Cathode Substrate for SOFC. ECS Proc. Vol. 1995, 1995, 334–343. [Google Scholar] [CrossRef]
  50. Karthik, T.; Rathinamoorthy, R.; Murugan, R. Enhancement of wrinkle recovery angle of cotton fabric using citric acid cross-linking agent with nano-TiO2 as a co-catalyst. J. Ind. Text. 2012, 42, 99–117. [Google Scholar] [CrossRef]
  51. Hajipour, F.; Asad, S.; Amoozegar, M.A.; Javidparvar, A.A.; Tang, J.; Zhong, H.; Khajeh, K. Developing a fluorescent hybrid nanobiosensor based on quantum dots and azoreductase enzyme formethyl red monitoring. Iran. Biomed. J. 2021, 25, 8–20. [Google Scholar] [CrossRef] [PubMed]
  52. Kumar, P.M.; Badrinarayanan, S.; Sastry, M. Nanocrystalline TiO2 studied by optical. FTIR and X-ray photoelectron spectroscopy: Correlation to presence of surface states. Thin Solid Films. 2000, 358, 122–130. [Google Scholar] [CrossRef]
  53. Yu, J.; Yu, H.; Ao, C.H.; Lee, S.C.; Yu, J.C.; Ho, W. Preparation. characterization and photocatalytic activity of in situ Fe-doped TiO2 thin films. Thin Solid Films. 2006, 496, 273–280. [Google Scholar] [CrossRef]
  54. Bargui, M.; Messaoud, M.; Elleuch, K. Electrophoretic impregnation of porous anodizing layer by synthesized TiO2 nanoparticles. Surf. Eng. Appl. Electrochem. 2017, 53, 467–474. [Google Scholar] [CrossRef]
  55. Liu, M.; Piao, L.; Zhao, L.; Ju, S.; Yan, Z.; He, T.; Zhou, C.; Wang, W. Anatase TiO2 single crystals with exposed {001} and {110} facets: Facile synthesis and enhanced photocatalysis. Chem. Commun. 2010, 46, 1664–1666. [Google Scholar] [CrossRef] [PubMed]
  56. Jiang, H.; Gao, L. Enhancing the UV inducing hydrophilicity of TiO2 thin film by doping Fe ions. Mater. Chem. Phys. 2002, 77, 878–881. [Google Scholar] [CrossRef]
  57. Chin, M.; Jiuan, H.; Syh, T. Characteristics and optical properties of iron ion (Fe3+)-doped titanium oxide thin films prepared by a sol–gel spin coating. J. Alloys Compd. 2009, 473, 394–400. [Google Scholar] [CrossRef]
  58. Naceur, J.B.; Mechiakh, R.; Bousbih, F.; Chtourou, R. Applied Surface Science Influences of the iron ion (Fe3+)-doping on structural and optical properties of nanocrystalline TiO2 thin films prepared by sol–gel spin coating. Appl. Surf. Sci. 2011, 257, 10699–10703. [Google Scholar] [CrossRef]
  59. Lee, T.H.; Ryu, H.; Lee, W.J. Photoelectrochemical properties of iron (III)-doped TiO2 nanorods. Ceram. Int. 2015, 41, 7582–7589. [Google Scholar] [CrossRef]
  60. Zhu, J.; Zheng, W.; He, B.; Zhang, J.; Anpo, M. Characterization of Fe–TiO2 photocatalysts synthesized by hydrothermal method and their photocatalytic reactivity for photodegradation of XRG dye diluted in water. J. Mol. Catal. A Chem. 2004, 216, 35–43. [Google Scholar] [CrossRef]
  61. Hamaker, H.C.; Verwey, E.J. Part II.—(C) Colloid stability. The Role of The Forces Between The Particles in Electrodeposition and Other Phenomena. Trans. Faraday Soc. 1940, 35, 180–185. [Google Scholar] [CrossRef]
  62. Abudalazez, A.M.A.; Kasim, S.R.; Ariffin, A.B.; Ahmad, Z.A. Effect of the solid concentration in the suspension on electrophoretic deposition (EPD) coating parameters. Int. J. Eng. Res. Africa. 2012, 8, 47–54. [Google Scholar] [CrossRef]
  63. Ferrari, B.; Moreno, R. EPD kinetics: A review. J. Eur. Ceram. Soc. 2010, 30, 1069–1078. [Google Scholar] [CrossRef]
  64. Besra, L.; Liu, M. A review on fundamentals and applications of electrophoretic deposition (EPD). Prog. Mater. Sci. 2007, 52, 1–61. [Google Scholar] [CrossRef]
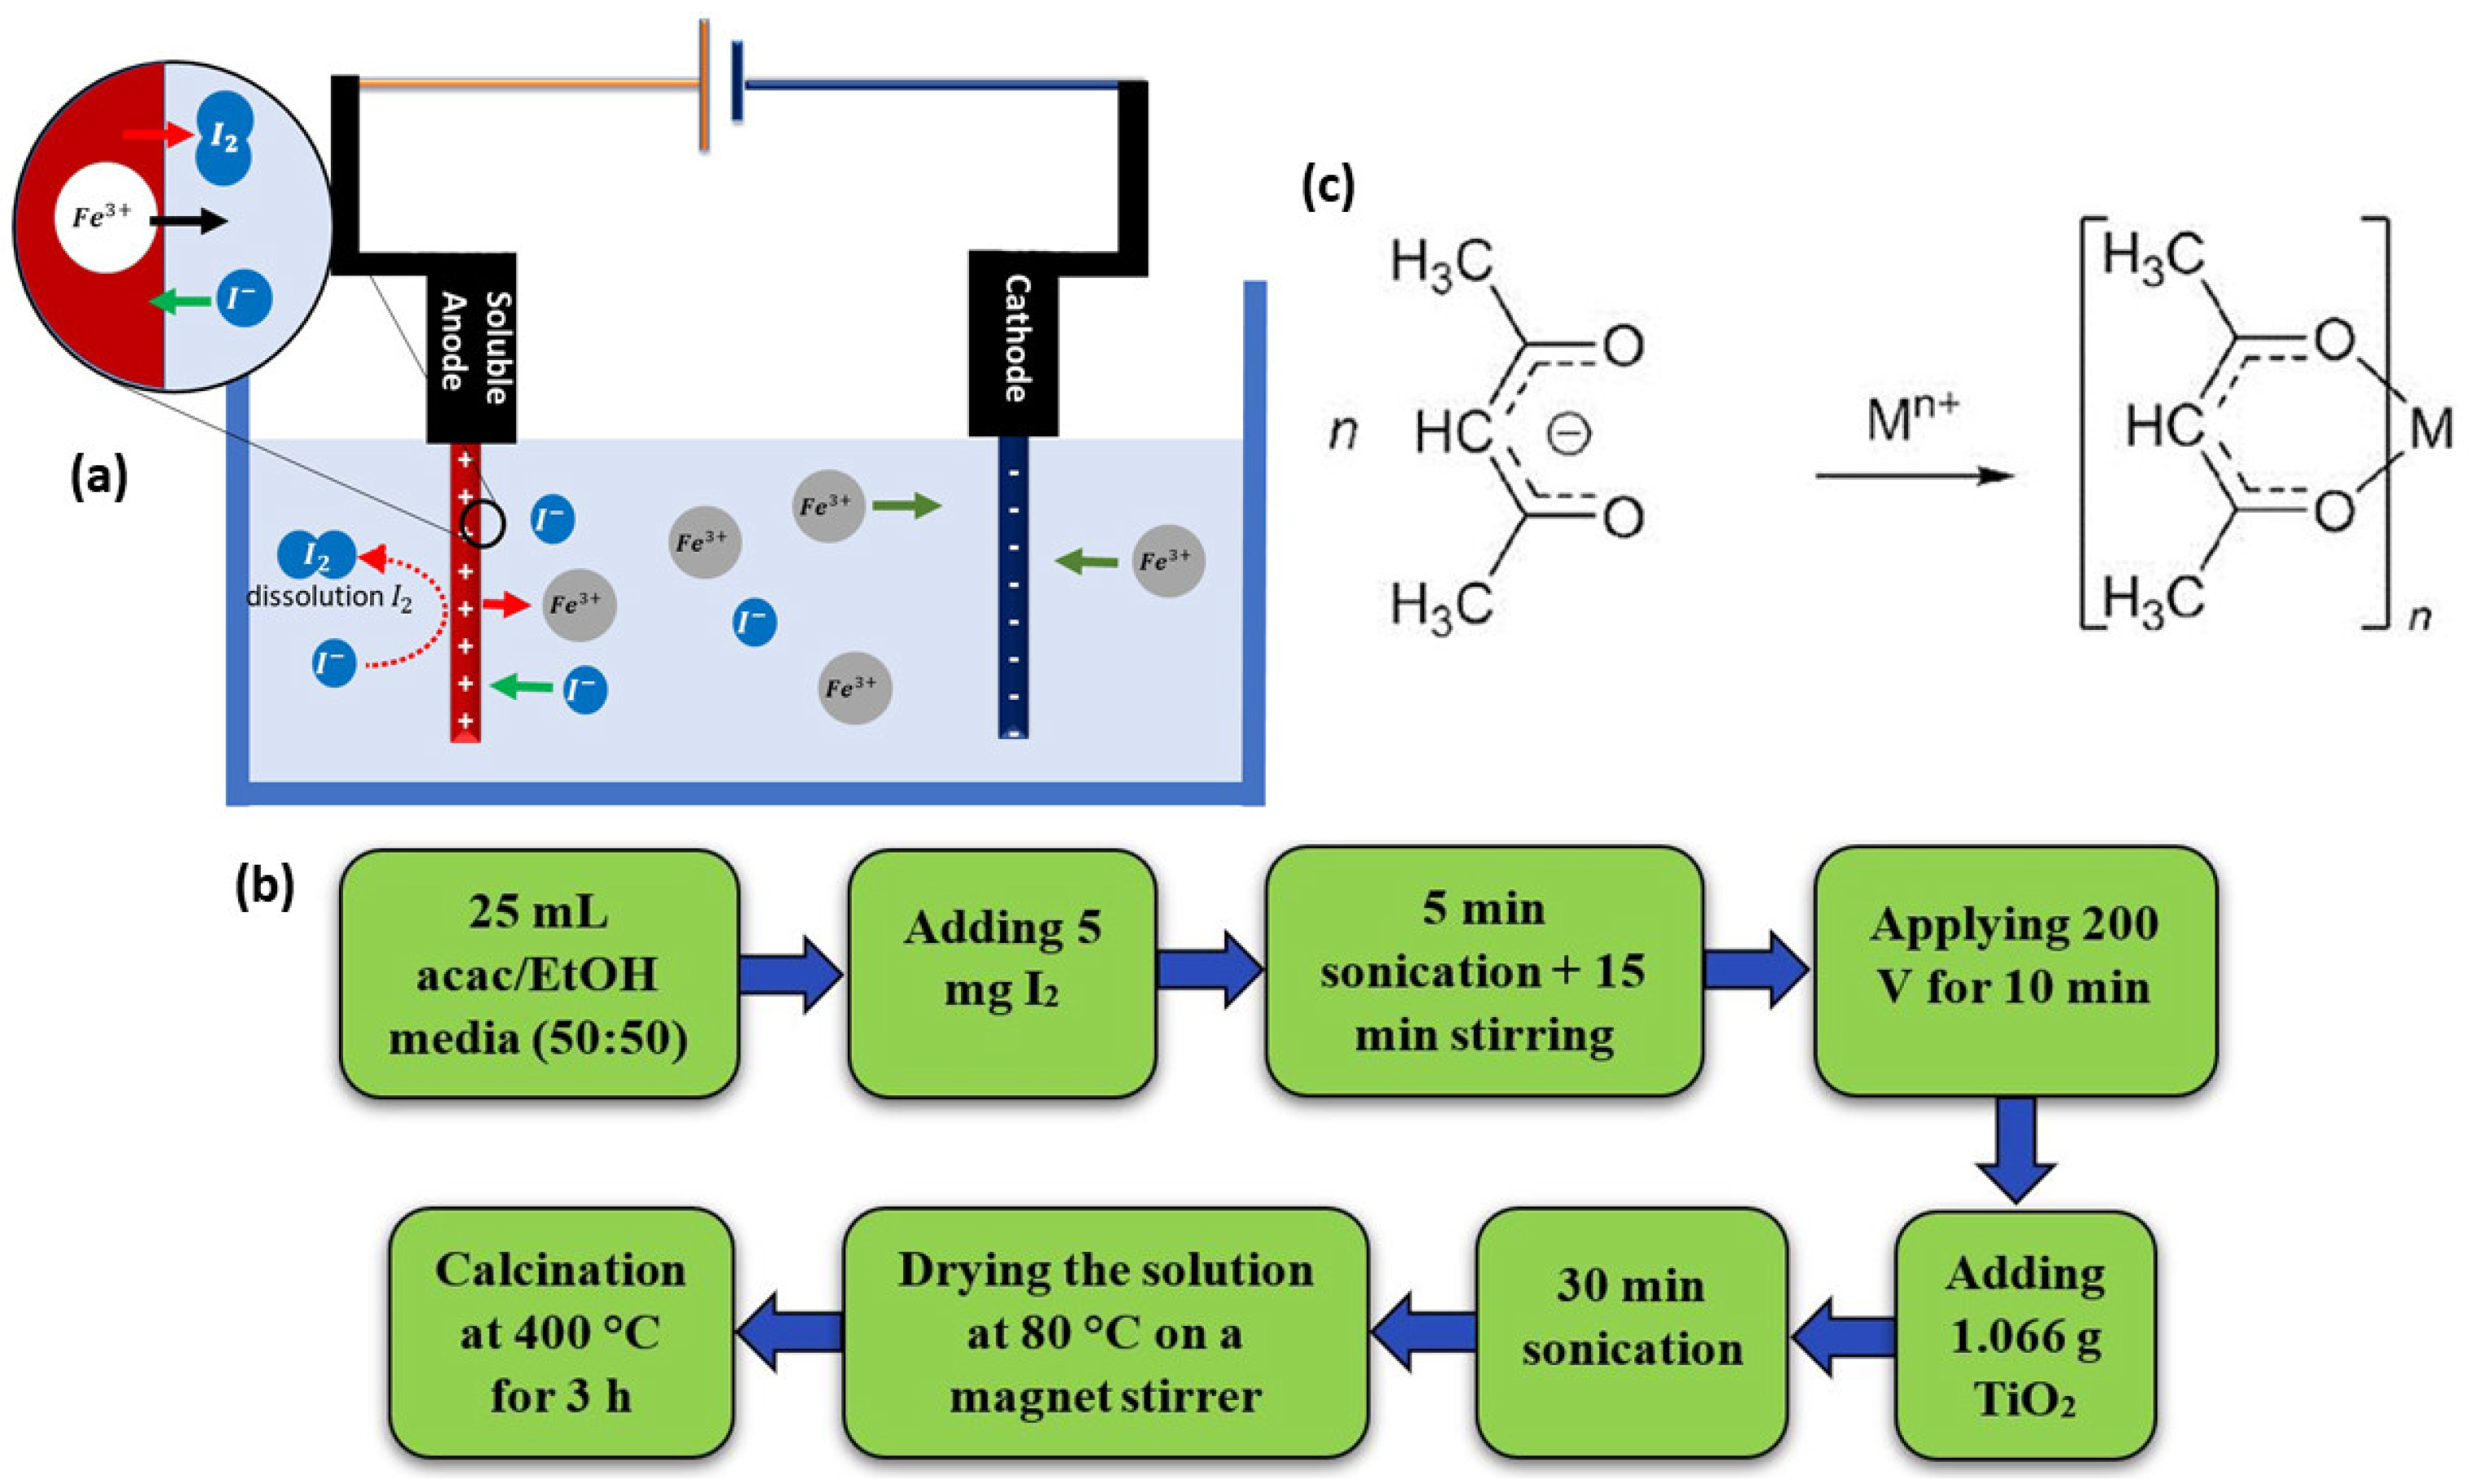
Figure 1. (a) Anodic dissolution setup. (b) Flowchart of the nano Fe-TiO2 synthesis via anodic dissolution method. (c) The general reaction of acetylacetone with metallic ions.
Ceramics 06 00076 g001
Figure 2. (a) Current variation for acac/EtOH as a function of time in voltages of 100, 200, 300, and 400 V. (b) Anodic dissolution of Fe ion in acac/EtOH media as a function of voltage with and without I2 in the solution. (c) Variation of anodic dissolution as a function of time in acac/EtOH by applying a voltage of 200 V.
Ceramics 06 00076 g002
Figure 3. (a) XRD pattern of TiO2 before and after the doping of Fe. FTIR spectra of TiO2 (b) before and (c) after the doping of Fe.
Ceramics 06 00076 g003
Figure 4. TEM images (a,b), particle size distribution (c), HRTEM image (d), and SAED pattern (e) of the synthesized Fe-TiO2.
Ceramics 06 00076 g004
Figure 5. UV-vis spectra of (a) undoped and (b) doped TiO2 nanoparticles (insight: their Tauc plots).
Ceramics 06 00076 g005
Figure 6. (a) Fe-TiO2 deposited layer by the EPD technique (the width of the electrode is 2 cm). FESEM images of Fe-doped TiO2 deposited layer (b) with 500 nm and (c) 200 nm scale bar.
Ceramics 06 00076 g006
Figure 7. (ae) MAP of doped layer indicating the distribution of O, Ti, Fe, and their mixture.
Ceramics 06 00076 g007
Figure 8. Deposition weight as a function of (a) applied voltage and (b) time in acac/EtOH media containing 5 g/L Fe-TiO2 powder (the voltage in (b) was 200 V).
Ceramics 06 00076 g008
Table 1. Anodic dissolution of Fe ions in different media as a function of voltage (measured by atomic absorption spectroscopy).
Applied Voltage (V)Dissolved Fe Ion (ppm) in Different Medias
EtOHMethanolacac/EtOH (without I2)acac/EtOH (with I2)
1000072410
20001107640
3001.31.3121720
4002.53.1153780
Disclaimer/Publisher’s Note: The statements, opinions and data contained in all publications are solely those of the individual author(s) and contributor(s) and not of MDPI and/or the editor(s). MDPI and/or the editor(s) disclaim responsibility for any injury to people or property resulting from any ideas, methods, instructions or products referred to in the content.