Abstract
Here, we report on the opportunity to suppress Yb3+ to Yb2+ dopant-ion reduction in LiYbxY1−xF4 mixed crystals during growth processes, using the Bridgmen–Stocbarger technique in graphite crucibles in vacuum. This was carried out by the additional doping of the LiF-YF3-YbF3 powder mixture with 1% of BiF3 additive. The crystals of LiY0.8Yb0.2F4 and LiY0.8Yb0.2F4 with BiF3 doping in the charge, were grown. The spatial distribution of the spectral-kinetic properties of Yb3+ and Yb2+ ions along the grown crystalline-boules were studied. It was established that the Yb2+ concentration rises during the LiY0.8Yb0.2F4 crystal-growth processes without the BiF3 additive: the absorption coefficient of Yb2+ (π-polarization) at 340 nm rises from 0 (at the beginning of the boule) to 2.5 cm−1 (at the end of the boule). In contrast, the undetectable absorption of Yb2+ along the crystals grown from the BiF3 doped melt was displayed. The luminescence-decay time of Yb3+ decreases from 3.7 to 1.8 ms from the beginning to the end of the LiY0.8Yb0.2F4 boule grown from the BiF3 undoped melt, and stays constant (~3.7 ms) along the samples grown with BiF3. Here we demonstrate a positive effect of BiF3 doping on the optical homogeneity of LiYF4:Yb3+ crystals.
1. Introduction
LiYF4 fluoride crystals doped with Yb3+ ions are well-known continuous-wave laser materials with room temperature tuning-ranges of 997–1065 nm and 998–1076 nm for σ and π polarizations, respectively [1]. Due to the large gain-bandwidth, the LiYF4:Yb3+ crystals can be implemented as an active medium to obtain laser oscillation in a subpicosecond-pulse regime under cryogenic cooling [2]. The unique energy-level structure of Yb3+ ions determines the high efficiency of the optical-refrigeration effect. For example, an active medium based on LiYF4:Yb3+ can reduce the temperature the of GaAs/InGaAs double-heterostructure with 2 μm thickness, down to 165 K [3].
Common problems which reduce efficiency for both laser performance [4,5,6] and laser cooling [7] is the conversion of Yb ions from a trivalent to a divalent state. Ions such as Sm3+ and Eu3+ also demonstrate the same tendency. The optical properties of Yb2+ ions were investigated in oxides [8], various fluorides [9,10], and fibers [5]. Due to the completed 4f electron shell of Yb2+, its absorption spectrum is formed by interconfigurational 4fn→4fn-1 5d transitions, corresponding to the 170–400 nm spectral range [11]. In addition, the intervalence charge transfer can be observed in Yb3+-Yb2+ mixed systems [12], which may affect the luminescent properties of Yb3+.
Part of the Yb3+ ions distributed in the host-matrix can be reduced to divalent state under specific crystal-growth conditions [13]. In the work [14], the authors identify some of these conditions, namely: (a) an absence of oxidizer, (b) the trivalent rare-earth ion must substitute the cation with the different valence, (c) a proximity of ionic radii of the trivalent activator and the divalent host-cation, and (d) an appropriate host-compound conducive to dopant valence-reduction. Generally, the LiYF4 host-matrix does not satisfy any of these conditions and does not have sites for the divalent dopant; therefore, the divalent-ytterbium appearance should be associated with impurities or defects. However, the most urgent problem for the optically perfect fluoride-crystal-growth process is the presence of incontrollable oxides and the OH- group containing impurities in the charge. Indeed, the water traces always exist in the growth-chamber environment [15].
A common way to deal with Yb3+-Yb2+ conversion is the conduction of crystal-growth procedures under a fluorinating atmosphere, for example, in the presence of HF or CF4 gases [16]. As mentioned above, despite the effectiveness of this method, the use of a fluorinating atmosphere is related to notable technical difficulties. It is worth keeping in mind the fact that the additional Bi-doping procedure can improve the optical properties of rare-earth-doped aluminosilicate, borate, phosphate and germanate glasses [17]. This occurs due to the high electron-affinity of Bi3+ ions and the consequent effective reduction into a lower valence-state [18]. In addition, it is known that the Yb3+ and Bi+ ions being doped to the matrix as a pair mutually stabilizes their valence, which was shown in the PbF2 matrix, where the conditions are in favor of Yb2+ ions formation [19]. In this study, we demonstrate the fact that the addition of BiF3 to the LiF-YF3-YbF3 charge reduces the divalent-ytterbium-formation efficiency in LiYF4:Yb3+-solid solutions grown by Bridgeman technique in graphite crucibles in vacuum.
2. Materials and Methods
2.1. Material Synthesis
The crystals of LiY0.8Yb0.2F4 were grown in graphite crucibles from the melt with and without 1% of BiF3 additive, using the Bridgman technique. The fluorides of the Yttrium, Ytterbium and Bismuth powder-mixture was used as the charge. During the growth procedure, the pressure inside the crystal-growth chamber was maintained at 10−4 mbar. The melt was pulled out from the high temperature zone through a region of a thermal gradient (≈100 °C/cm). To obtain the specific optical c-axis-orientation (perpendicular to the cylinder of the boule), a seeding crystal was placed inside the crucible.
Samples were cut into a parallelepipeds with 5 × 5 × 30 mm typical dimensions. The optical axis of the crystals was perpendicular to one of the carefully polished facets.
2.2. Spectral-Kinetic Characterization of the Samples
The absorption spectra of the samples were obtained via the one-beam method, using StellarNet SL5 Deuterium/Halogen Light Source (spectral range 190–2500 nm, StellarNet, Inc. 14390 Carlson Circle Tampa, FL, USA). The experimental set-up is presented in Figure 1.

Figure 1.
The experimental setup for registration of the absorption spectrum of the samples. (1) broadband StellarNet halogen and deuterium light-source; (2) Glan–Taylor prism; (3) the sample; (4) CCD StellarNet spectrometer. The samples were moved along the z-axis that is perpendicular to the probe beam.
A Glan prism was used as the polarizer. Incident light (the probe beam) was focused on the sample surface using a fused-silica lens with a 5 cm focal length. Luminescence and absorption spectra were registered using the StellarNet CCD spectrometer (optical resolution up to 0.5 nm, StellarNet, Inc. 14390 Carlson Circle Tampa, FL, USA). The relative accuracy of the light-intensity measurements was approximately 0.5%. Luminescence excitation was carried out using pulse-periodic radiation of the InAlGaAs laser diode ATC-C1000-100 (FWHM 3 nm, “Semiconductor devices” LLC, Moscow, Russia) operating at 935 nm wavelength. Excitation laser-pulse duration and pulse repetition rate were 5 ms and 10 Hz, respectively. Luminescence-decay curves were detected using the monochromator DMR-4 (OPTICS LLS, Moscow, Russia), the photomultiplier FEU-62 (ZAPADPRIBOR LLC, Moscow, Russia, 400–1200 nm operating spectral range), and the Bordo 211 digital oscillograph (AURIS LLC, Moscow, 10 bit and 200 MHz bandwidth).
3. Results and Discussion
Absorption and Luminescence Spectrum of LiY0.8Yb0.2F4 and LiY0.8Yb0.2F4:BiF3 (1%)
Spin-orbit interaction splits the 2F term of the Yb3+ ion into two 2F5/2 and 2F7/2 manifolds, where 2F7/2 is the ground state. These manifolds split into three and four Stark sub-levels, respectively. The polarized absorption spectra of the crystals are shown in Figure 2.
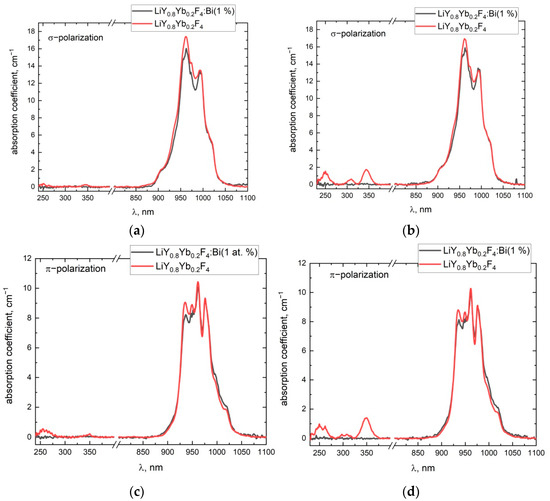
Figure 2.
Polarized absorption spectra of two different parts of the LiY0.8Yb0.2F4 and LiY0.8Yb0.2F4:BiF3 (1%) crystals (a,c)—the beginning of crystallization, (b,d)—the end of crystallization.
Each infra-red spectrum represents six absorption bands, due to the selection rules for each polarization [20]. These results are in agreement with an already published paper [21]. Four absorption peaks in the ultraviolet spectral-range can be distinguished at 248 nm, 262 nm, 307 nm, and 347 nm. These absorption bands are also in good agreement with the M. Kaczmarek et al. paper [22], in which the Yb2+ impurity centers in LiYF4 crystals were induced by X-ray radiation. In our study, Yb2+ centers can appear in LiYF4:Yb3+ crystals during the growth process because the vacuum and the contact of the melt with the graphite crucible are the reducing conditions. In addition, the absorption spectra change significantly in different parts of the crystal boule. It can be seen from Figure 2, that the absorption bands in the UV range are more intense for the part corresponding to the end of the crystallization process, whereas the bands are almost not pronounced at the beginning of crystallization. The nonpolarized normalized-luminescence-spectra of the LiY0.8Yb0.2 and LiY0.8Yb0.2 with BiF3 additives (1 at. % in the charge) samples under 934 nm laser-excitation, are represented in Figure 3.
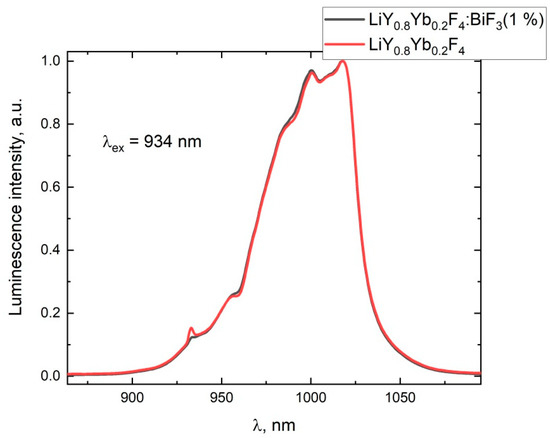
Figure 3.
The normalized luminescence-spectra of the LiY0.8Yb0.2 and LiY0.8Yb0.2:BiF3 (1%) samples under 934 nm laser-excitation.
The BiF3 additive does not change the luminescence spectra of the Yb3+ ions in the samples, but affects the fluorescence-kinetic properties. The drastic shortening of the luminescence-decay time of the Yb3+ ions along the crystalline boule (with growth time) is observed for the samples without the BiF3 additive in the charge (Figure 4). In contrast, the Yb3+ life-time was constant for any part of the sample grown from the BiF3-doped charge.
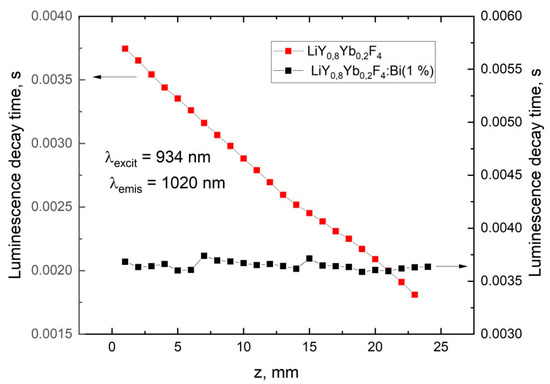
Figure 4.
Luminescence-decay time of Yb3+ (1020 nm) under 934 nm excitation along the crystals (along z-axis).
Due to the simultaneous increase in absorption in the ultraviolet spectral-range and the shortening of the Yb3+ luminescence-decay time, it can be assumed that there are energy-transfer processes between Yb2+ and Yb3+ ions in LiYF4:Yb3+ single crystals. This can be associated with the well-known fact that Yb3+ and Yb2+ ions can form complex charge-transfer states [23]. The origin and the real mechanism of the interaction require further investigation.
It is important to note that the presence of Bi ions in the samples does not manifest itself in the optical spectra. There are two reasons for this: (1) the bismuth in any valence state is absent or the concentration is too low in the samples, due to the volatility of the Bi-components; (2) the Bi has a valence state in the grown crystal which cannot be detected in the visible and near-IR spectral-ranges. That is why we have studied the impact of the BiF3 doping effect on the spectroscopic properties of Yb3+ and Yb2+ ions along the crystalline boule.
The dopant concentration is proportional to the absorption coefficient, and their distribution can be described by the Gulliver–Pfann law [24]:
where keff is the effective dopant-segregation coefficient, g(z) identifies the specific part of the crystal which can be expressed as: g(z) = z/L, where L is the total length of the sample and z is the distance from the beginning of crystallization.
Figure 5 shows the dependencies of the polarized absorption-coefficient at 340 nm of the LiY0.8Yb0.2F4 crystal samples grown from the melt, with and without 1%of BiF3 additive along the direction of growth, where z = 0 corresponds to the beginning of sample crystallization. The sample of crystal grown from the BiF3-doped melt demonstrates no detectable absorption in the ultraviolet spectral-range at any part of the crystal boule.
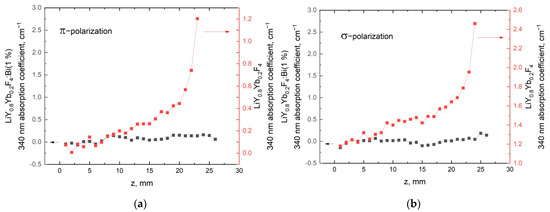
Figure 5.
Absorption coefficient at 340 nm along theLiY0.8Yb0.2F4 crystals grown from the melt, with and without 1% of BiF3 additive for π (a) and σ (b) polarizations.
The distribution coefficient of Yb3+ ions in the LiYF4 crystals should be close to 0.96, due to the isomorphic substitution of Y3+ by the Yb3+ ions [25]. In our LiY0.8Yb0.2F4 sample, we observed the decrease in Yb3+ concentration with a simultaneous increase in ultraviolet absorption (Figure 6) along the boule, from the beginning of crystallization to the end.
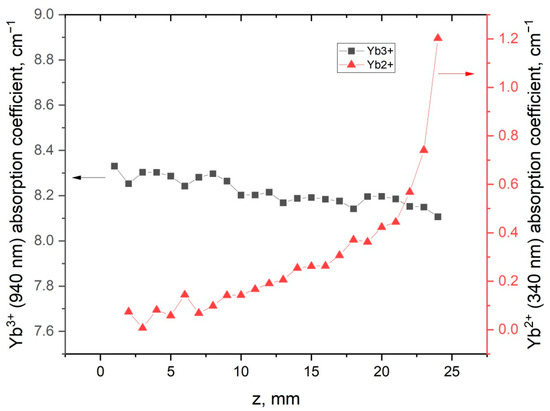
Figure 6.
Yb3+ and Yb2+ absorption-coefficient along the LiY0.8Yb0.2F4 crystal.
This relation between trivalent- and divalent-ytterbium absorption-coefficients is the indirect evidence of reduction processes occurring during crystal growth. Several studies devoted to the investigation of Yb2+ distribution along fluoride crystals found that the segregation coefficient of Yb2+ in YbF3:CaF2 crystals varies from 0.68 to 0.74, depending on Yb concentration [26]. In YbF3:BaF2, the segregation coefficient of divalent ytterbium equals 0.59 [24]. The implementation of formula (1) on the dependencies in Figure 6 gives the effective-distribution-coefficient values 0.98 and −0.7 for Yb3+ and Yb2+, respectively. Because keff must be positive, the Yb2+ ion content distribution along the crystal boule cannot be described by the Gulliver–Pfann equation. It can probably be explained by the high volatility of the bismuth salts and LiBiF4 compound. It means that the chemical composition of the melt and the crystallization conditions are drastically changed with the time of the crystal-growth process, which contradicts the basic assumptions in the derivation of the Galiver–Pfann law.
In addition, it has to be taken into account that, besides the significant rise in ultraviolet absorption, there is a drastic shortening of the luminescence-decay time of the Yb3+ ions along the crystal without Bi doping, which is not evident for the LiY0.8Yb0.2F4:BiF3 (1%) sample (Figure 7).
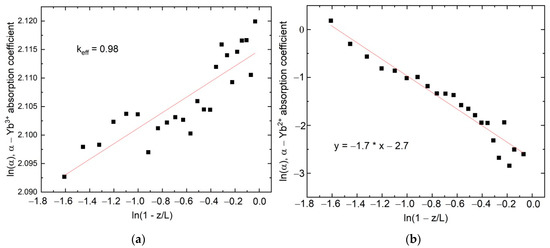
Figure 7.
(a) Yb3+ and (b) Yb2+ absorption along the LiY0.8Yb0.2F4 crystal in ln(α) vs. ln(1−z/L) coordinates, where α is the absorption coefficient, z represents the beginning of the sample crystallization, and L is the full length of the sample.
The origin and the exact mechanism of the interaction require further investigation. It is known that Yb3+ and Yb2+ ions can form complex charge-transfer states [23]. It can be assumed that the BiF3 additive sufficiently improves the optical quality of the LiYF4:Yb3+ materials, which were grown using the Bridgman technique in above-mentioned conditions. Finally, it was observed, that the addition of the BiF3 additive to the charge sufficiently improves the optical quality of the LiYF4:Yb3+ materials, which were grown using the Bridgman technique in above-mentioned conditions.
It is also important to note that Bi doping cannot be the universal solution for the Yb3+-Yb2+ conversion problem, due to the near-infrared absorption of the low-valence Bi ions, therefore disturbing the original spectrum of the samples. In addition, the crystallization temperature must be higher than the volatilization temperature of the BiF3. This fact imposes some limitations on the crystals.
4. Conclusions
For the first time, the distribution of Yb2+ ions in LiYF4:Yb3+ crystals was investigated. It was suggested that the formation of Yb2+ ions in the crystals occurs due to the growth conditions (for example, the presence of a trace quantity of water and/or synthesis in vacuum and graphite crucibles and heaters). The relation between Yb2+ concentration and luminescence-decay time of Yb3+ ions appeared to be clear and consistent. In particular, a significant increase in the Yb2+ absorption coefficient occurs simultaneously with Yb3+ luminescence quenching. The addition of BiF3 to the melt led to the absence of the UV absorption bands corresponding to the Yb2+ ions. In its turn, Yb3+ luminescence-decay time remains stable for different parts of the crystals. The mechanism of energy transfer between Yb2+ and Yb3+ ions in heavily doped LiYF4 crystals needs further investigation, because it can lower the effectiveness of the up-conversion excitation in co-doped LiYF4:Yb:Tm/Ho/Eu laser crystals.
A positive effect of BiF3 doping of the melt on the optical homogeneity of LiYF4:Yb3+ crystals has at least been detected.
We believe that one of the main advantages of the present work is that the work reveals some useful details concerning the BiF3-based LiYF4:Yb3+ crystal growth. Indeed, the use of BiF3 during the crystal-growth process seems to be beneficial compared to the alternative ways, such as the use of aggressive and toxic fluorinated-gases. In particular, in order to reduce the concentration of Yb2+ in the iYF4:Yb3+ crystal, it is enough to add 17 mg of BiF3 to the starting material to obtain 1 kg of LiYF4:Yb3+ crystals. In its turn, BiF3 powder is relatively cheap, compared to fluorinated gases. The addition of BiF3 powder allows the exclusion of several steps in the technology of the crystal-growth process. In particular, it allows for reducing the time of the drying of the starting material from a range of 12 to 20 h, to 2 to 4 h. In addition, the use of BiF3 allows for the performance of the preparatory pumping of the vacuum chamber up to 10−1–10−2 Pa, compared to 10−4–10−5 Pa (without BiF3). It reduces the time of crystal growth or lowers the requirements imposed on the vacuum-pump system.
Author Contributions
Conceptualization, A.K., S.K., O.M., A.N., V.S. and A.K.; formal analysis, M.P., M.G. and A.N.; investigation, A.K., N.A., S.K., O.M., A.N., V.S. and A.K.; resources, M.P., M.G. and A.N.; writing—original draft preparation, A.N., A.K.; writing—review and editing, A.N., V.S., M.P. All authors have read and agreed to the published version of the manuscript.
Funding
The work was funded by the subsidy allocated to Kazan Federal University for the state assignment in the sphere of scientific activities (project number FZSM-2022-0021).
Data Availability Statement
Not applicable.
Conflicts of Interest
The authors declare no conflict of interest.
References
- Alderighi, D.; Pirri, A.; Toci, G.; Vannini, M. Tunability enhancement of Yb:YLF based laser. Opt. Express 2010, 18, 2236–2241. [Google Scholar] [CrossRef] [PubMed]
- Kawanaka, J.; Yamakawa, K. 30-mJ, diode-pumped, chirped-pulse Yb:YLF regenerative amplifier. Opt. Lett. 2003, 28, 2121–2123. [Google Scholar] [CrossRef] [PubMed]
- Seletskiy, D.V.; Melgaard, S.D.; Epstein, R.I.; Di Lieto, A.; Tonelli, M.; Sheik-Bahae, M. Local laser cooling of Yb:YLF to 110 K. Opt. Express 2011, 19, 18229–18236. [Google Scholar] [CrossRef] [PubMed]
- Kirchhof, J.; Unger, S.; Schwuchow, A.; Jetschke, S.; Reichel, V.; Leich, M.; Scheffel, A. The influence of Yb2+ ions on optical properties and power stability of ytterbium-doped laser fibers. Opt. Compon. Mater. VII 2010, 7598, 75980B. [Google Scholar]
- Rydberg, S.; Engholm, M. Experimental evidence for the formation of divalent ytterbium in the photodarkening process of Yb-doped fiber lasers. Opt. Express 2013, 21, 6681–6688. [Google Scholar] [CrossRef]
- Gebavi, H.; Milanese, D.; Taccheo, S.; Mechin, D.; Monteville, A.; Freyria, F.S.; Bonelli, B.; Robin, T. Photodarkening of Infrared Irradiated Yb3+-Doped Alumino-Silicate Glasses: Effect on UV Absorption Bands and Fluorescence Spectra. Fibers 2013, 1, 101–109. [Google Scholar] [CrossRef]
- Knall, J.; Vigneron, P.-B.; Engholm, M.; Dragic, P.D.; Yu, N.; Ballato, J.; Bernier, M.; Digonnet, M.J.F. Laser cooling in a silica optical fiber at atmospheric pressure. Opt. Lett. 2020, 45, 1092–1095. [Google Scholar] [CrossRef]
- Solomonov, V.I.; Osipov, V.V.; Spirina, A.V. Luminescence and absorption of divalent ytterbium ion in yttrium-aluminum garnet ceramics. Opt. Spectrosc. 2014, 117, 441–446. [Google Scholar] [CrossRef]
- Moine, B.; Courtois, B.; Pedrini, C. Luminescence and photoionization processes of Yb2+ in CaF2, SrF2 and BaF2. J. Phys. 1989, 50, 2105–2119. [Google Scholar] [CrossRef]
- Kück, S.; Henke, M.; Rademaker, K. Crystal growth and spectroscopic investigation of Yb2+-doped fluoride crystals. Laser Phys. 2001, 11, 116–119. [Google Scholar]
- Loh, E. 4fn-4fn-15d Spectra of rare-earth ions in crystals. Phys. Rev. 1968, 175, 533–536. [Google Scholar] [CrossRef]
- Barandiarán, Z.; Seijo, L. Intervalence charge transfer luminescence: Interplay between anomalous and 5d–4f emissions in Yb-doped fluorite-type crystals. J. Chem. Phys. 2014, 141, 23. [Google Scholar] [CrossRef] [PubMed]
- Nicoara, I.; Stef, M.; Pruna, A. Growth of YbF3-doped CaF2 crystals and characterization of Yb3+/Yb2+ conversion. J. Cryst. Growth 2008, 310, 1470–1475. [Google Scholar] [CrossRef]
- Pei, Z.; Su, Q.; Zhang, J. The valence change from RE3+ to RE2+ ( RE = Eu, Sm, Yb) in SrB407: RE prepared in air and the spectral properties of RE2+. J. Alloys Compd. 1993, 198, 51–53. [Google Scholar] [CrossRef]
- Baldochi, S.L.; Shimamura, K.; Nakano, K.; Mujilatu, N.; Fukuda, T. Ce-doped LiYF4 growth under CF4 atmosphere. J. Cryst. Growth 1999, 205, 537–542. [Google Scholar] [CrossRef]
- Bensalah, A.; Shimamura, K.; Sudesh, V.; Sato, H.; Ito, K.; Fukuda, T. Growth of Tm, Ho-codoped YLiF4 and LuLiF4 single crystals for eye- safe lasers. J. Cryst. Growth 2001, 223, 539–544. [Google Scholar] [CrossRef]
- Dai, N.; Xu, B.; Jiang, Z.; Peng, J.; Li, H.; Luan, H.; Yang, L.; Li, J. Effect of Yb3+ concentration on the broadband emission intensity and peak wavelength shift in Yb/Bi ions co-doped silica-based glasses. Opt. Express. 2010, 18, 18642–18648. [Google Scholar] [CrossRef]
- Truong, V.G.; Bigot, L.; Lerouge, A.; Douay, M.; Razdobreev, I. Study of thermal stability and luminescence quenching properties of bismuth-doped silicate glasses for fiber laser applications. Appl. Phys. Lett. 2008, 92, 90–93. [Google Scholar] [CrossRef]
- Zhang, P.; Chen, N.; Wang, R.; Huang, X.; Zhu, S.; Li, Z.; Yin, H.; Chen, Z. Charge compensation effects of Yb3+ on the Bi+: Near-infrared emission in PbF2 crystal. Opt. Lett. 2018, 43, 2372–2375. [Google Scholar] [CrossRef]
- Sugiyama, A.; Katsurayama, M.; Anzai, Y.; Tsuboi, T. Spectroscopic properties of Yb doped YLF grown by a vertical Bridgman method. J. Alloys Compd. 2006, 408, 780–783. [Google Scholar] [CrossRef]
- Coluccelli, N.; Galzerano, G.; Bonelli, L.; Toncelli, A.; Di Lieto, A.; Tonelli, M.; Laporta, P. Room-temperature diode-pumped Yb3+-doped LiYF4 and KYF4 lasers. Appl. Phys. B Lasers Opt. 2008, 92, 519–523. [Google Scholar] [CrossRef]
- Kaczmarek, S.M.; Bensalah, A.; Boulon, G. γ-Ray induced color centers in pure and Yb doped LiYF4 and LiLuF4 single crystals. Opt. Mater. 2006, 28, 123–128. [Google Scholar] [CrossRef]
- MacKeen, C.; Bridges, F.; Kozina, M.; Mehta, A.; Reid, M.F.; Wells, J.-P.R.; Barandiarán, Z. Evidence that the anomalous emission from CaF2:Yb2+ is not described by the impurity trapped exciton model. J. Phys. Chem. Lett. 2017, 8, 3313–3316. [Google Scholar] [CrossRef] [PubMed]
- Nicoara, I.; Buse, G.; Bunoiu, M. Segregation coefficient of Yb3+ and Yb2+ ions in YbF3 doped BaF2 crystals. AIP Conf. Proc. 2014, 1634, 111–114. [Google Scholar]
- Bensalah, A.; Guyot, Y.; Ito, M.; Brenier, A.; Sato, H.; Fukuda, T.; Boulon, G. Growth of Yb3+-doped YLiF4 laser crystal by the Czochralski method. Attempt of Yb3+ energy level assignment and estimation of the laser potentiality. Opt. Mater. 2004, 26, 375–383. [Google Scholar] [CrossRef]
- Nicoara, I.; Pecingina-Garjoaba, N.; Bunoiu, O. Concentration distribution of Yb2+ and Yb3+ ions in YbF3:CaF2 crystals. J. Cryst. Growth. 2008, 310, 1476–1481. [Google Scholar] [CrossRef]
Publisher’s Note: MDPI stays neutral with regard to jurisdictional claims in published maps and institutional affiliations. |
© 2022 by the authors. Licensee MDPI, Basel, Switzerland. This article is an open access article distributed under the terms and conditions of the Creative Commons Attribution (CC BY) license (https://creativecommons.org/licenses/by/4.0/).