Article

Structural and Luminescence Properties of (Gd1−xYx)2O3 Powders Doped with Nd3+ Ions for Temperature Measurements

by
Vladimir Aseev
1,*,
Anastasiia Babkina
1,
Sergey Evstropiev
1,
Natalia Kuzmenko
1,
Irina Sevastianova
1,
Denis Prokuratov
2 and
Mikhail Khodasevich
3
1
Faculty of Photonics, ITMO University, 197101 St. Petersburg, Russia
2
Department of Scientific and Technological Authentication of Works of Art, The State Hermitage Museum, 190000 St. Petersburg, Russia
3
Center “Diagnostic System”, B. I. Stepanov Institute of Physics, 220072 Minsk, Belarus
*
Author to whom correspondence should be addressed.
Ceramics 2022, 5(4), 1185-1197; https://doi.org/10.3390/ceramics5040084
Submission received: 21 October 2022 / Revised: 21 November 2022 / Accepted: 29 November 2022 / Published: 3 December 2022
(This article belongs to the Special Issue Composite Nanopowders: Synthesis and Applications)

Abstract

:
Rare earth activated powders are widely regarded as promising candidates for optical thermometry due to their unique photoluminescence characteristics. The paper presents the structural and luminescent properties of crystalline powders of gadolinium and yttrium oxides (Gd1−xYx)2O3, doped with Nd3+ ions, synthesized by the liquid polymer-salt method. The addition of polyvinylpyrrolidone increases the homogeneity of the mixture and ensures high adhesion of the resulting powders. Scanning electron microscopy shows that powders are μm-sized aggregates, which consist of particles with several tens of nanometers in size. A smooth shift of the diffraction peaks of the powders occurs when Gd is replaced by Y without additional peaks. The successive decrease in the lattice constant of the powders from 10.816 to 10.607 Å confirms the existence of continuous solid solutions in the system. The Stark sublevels of the 4F3/24I9/2 fluorescent band are shifted to 4 nm when Gd is replaced by Y since the strength of the local field has a stronger effect on the inner F-shell of Nd ions in the case of Y. For thermometry, we chose the ratio of the fluorescence intensities between the Stark sublevels 4F3/2(2)4I9/2(2) and 4F3/2(1)4I9/2(2). The best obtained sensitivity is 0.22% °C−1 for Nd-doped GdYO3 powder in the range of 10–70 °C. This value of temperature sensitivity, together with radiation and excitation lying in the biological window, opens the possibility of using Nd3+-doped (Gd1−xYx)2O3 powders for real-time thermal probing of under tissue luminescence with sub-degree resolution.

1. Introduction

Temperature represents an important regulatory function in all biological systems controlling physiological and biochemical processes from the macroscale to the nanoscale [1]. In biomedicine, one of the most important tasks is the precise evaluation of local temperature inside a living organism (in vivo), for example, detecting inflammation or tumor. Temperature measurement using fluorescence is based on various physical principles. The most precise luminescent method is the temperature redistribution of energy over excited levels, leading to a redistribution of the fluorescence intensity in thermo-coupled bands [2,3].
Fluorescent thermal sensing and deep tissue imaging using nanomaterials emitting in biological transparency windows (the first window is from 700 to 980 nm, the second is from 1000 to 1350 nm, and the third is from 1550 to 1870 nm) are of great interest [4]. Visualization by radiation inside transparency windows is characterized by the possibility of deeper penetration into biological tissues and increased spatial resolution due to smaller absorption and light scattering compared to UV and visible radiation. In biomedical applications, Nd3+ is used as a dopant, which is excited by IR radiation and emits in the same spectral region [5]. Neodymium 4F5/24I9/2 fluorescence bands fall into the first biological transparency window, in which the main tissue constituents, such as water and hemoglobin, are transparent [6]. Moreover, neodymium can be excited by 800 nm radiation, which is preferable owing to the lower level of absorption and scattering by bio tissues in comparison with 980 nm [7].
The synthesis of rare-earth sesquioxides has generated significant interest due to their excellent chemical stability, good thermal conductivity and transparency to infrared radiation [8,9]. Y2O3-based ceramics have been used as efficient host matrix materials due to their high energy band gap (5.8 eV), broad transparency region, high melting point (2450 °C), and low thermal expansion coefficient [10]. Low phonon frequency, thermal and chemical stability, and low cytotoxicity arise as relevant features for the increasing interest in biological applications of Gd2O3 and Y2O3 [5,11].
Thus, in this article, we synthesized (Gd1−xYx)2O3 sesquioxides crystalline powders doped with Nd3+ ions and investigated their structural and spectral properties under the equimolar substitution of Gd for Y, as well as their temperature sensitivity, the accuracy of temperature determining, and their competitiveness with already known nanothermometers in this spectral range.

2. Materials and Methods

High-purity aqueous solutions of Y(NO3)3 × H2O, Gd(NO3)3 × 6H2O and Nd(NO3)3 × 6H2O were applied as precursors for (Gd0.995−xYxNd0.01)2O3 phosphors synthesis, where x = 0; 0.245; 0.495; 0.745; 0.995. In the future, for simplification, we will not write the neodymium additive in the formula but imply it everywhere. Given volumes of these solutions, together with a solution of high molecular polyvinylpyrrolidone (PVP 10, average molecular weight 10,000, Sigma-Aldrich, St. Louis, MO, USA), were mixed with vigorous stirring for 30 min at room temperature. The addition of PVP should not only increase the homogeneity of the mixture but also ensure high adhesion of the resulting powders. After drying the solution at a temperature of 70 °C for 40 h, the homogeneous mixture was subjected to heat treatment in an electric muffle furnace at various temperatures: 600, 900, and 1100 °C for 2 h. The content of Nd2O3 was 1 wt.%.
X-ray diffraction patterns were obtained on a Rigaku Ultima IV (Rigaku Corporation, Tokyo, Japan) diffractometer with a copper anode and Bragg-Brentano focusing geometry. Experimental diffraction patterns were obtained at a wavelength of λCuKα = 1.5418 Å in the range of 15–65° at a scanning rate of 0.5°/min. The picture was obtained using a tube voltage of 40 kV and a tube current of 40 mA. The crystal size was estimated by the Williamson-Hall and Halder-Wagner methods. The crystalline phase was then determined using the ICDD PDF-2 database. The morphology and chemical composition of the resulting powders were studied using a scanning electron microscope (SEM) Carl Zeiss EVO MA 25 (ZEISS Group, Jena, Germany) with an EDX detector X-MaxN 80 (Oxford instruments, High Wycombe, UK). The analysis was carried out at a voltage value of 20 kV and a counting time of 120 s for EDS analysis. The 4F3/24I9/2 luminescent band was recorded in the spectral range 850–980 nm on an AvaSpec-2048 spectrometer (Avantes, Apeldoorn, The Netherlands) and excited by a diode laser with a wavelength of 808 nm. When measuring the temperature, the powders were heated and cooled in a quartz cuvette using a Water Peltier System PCB 1500 (Perkin Elmer, Waltham, MA, USA) with a temperature programmer in the range of 10–71 °C with an accuracy of 0.1 °C.

3. Results and Discussion
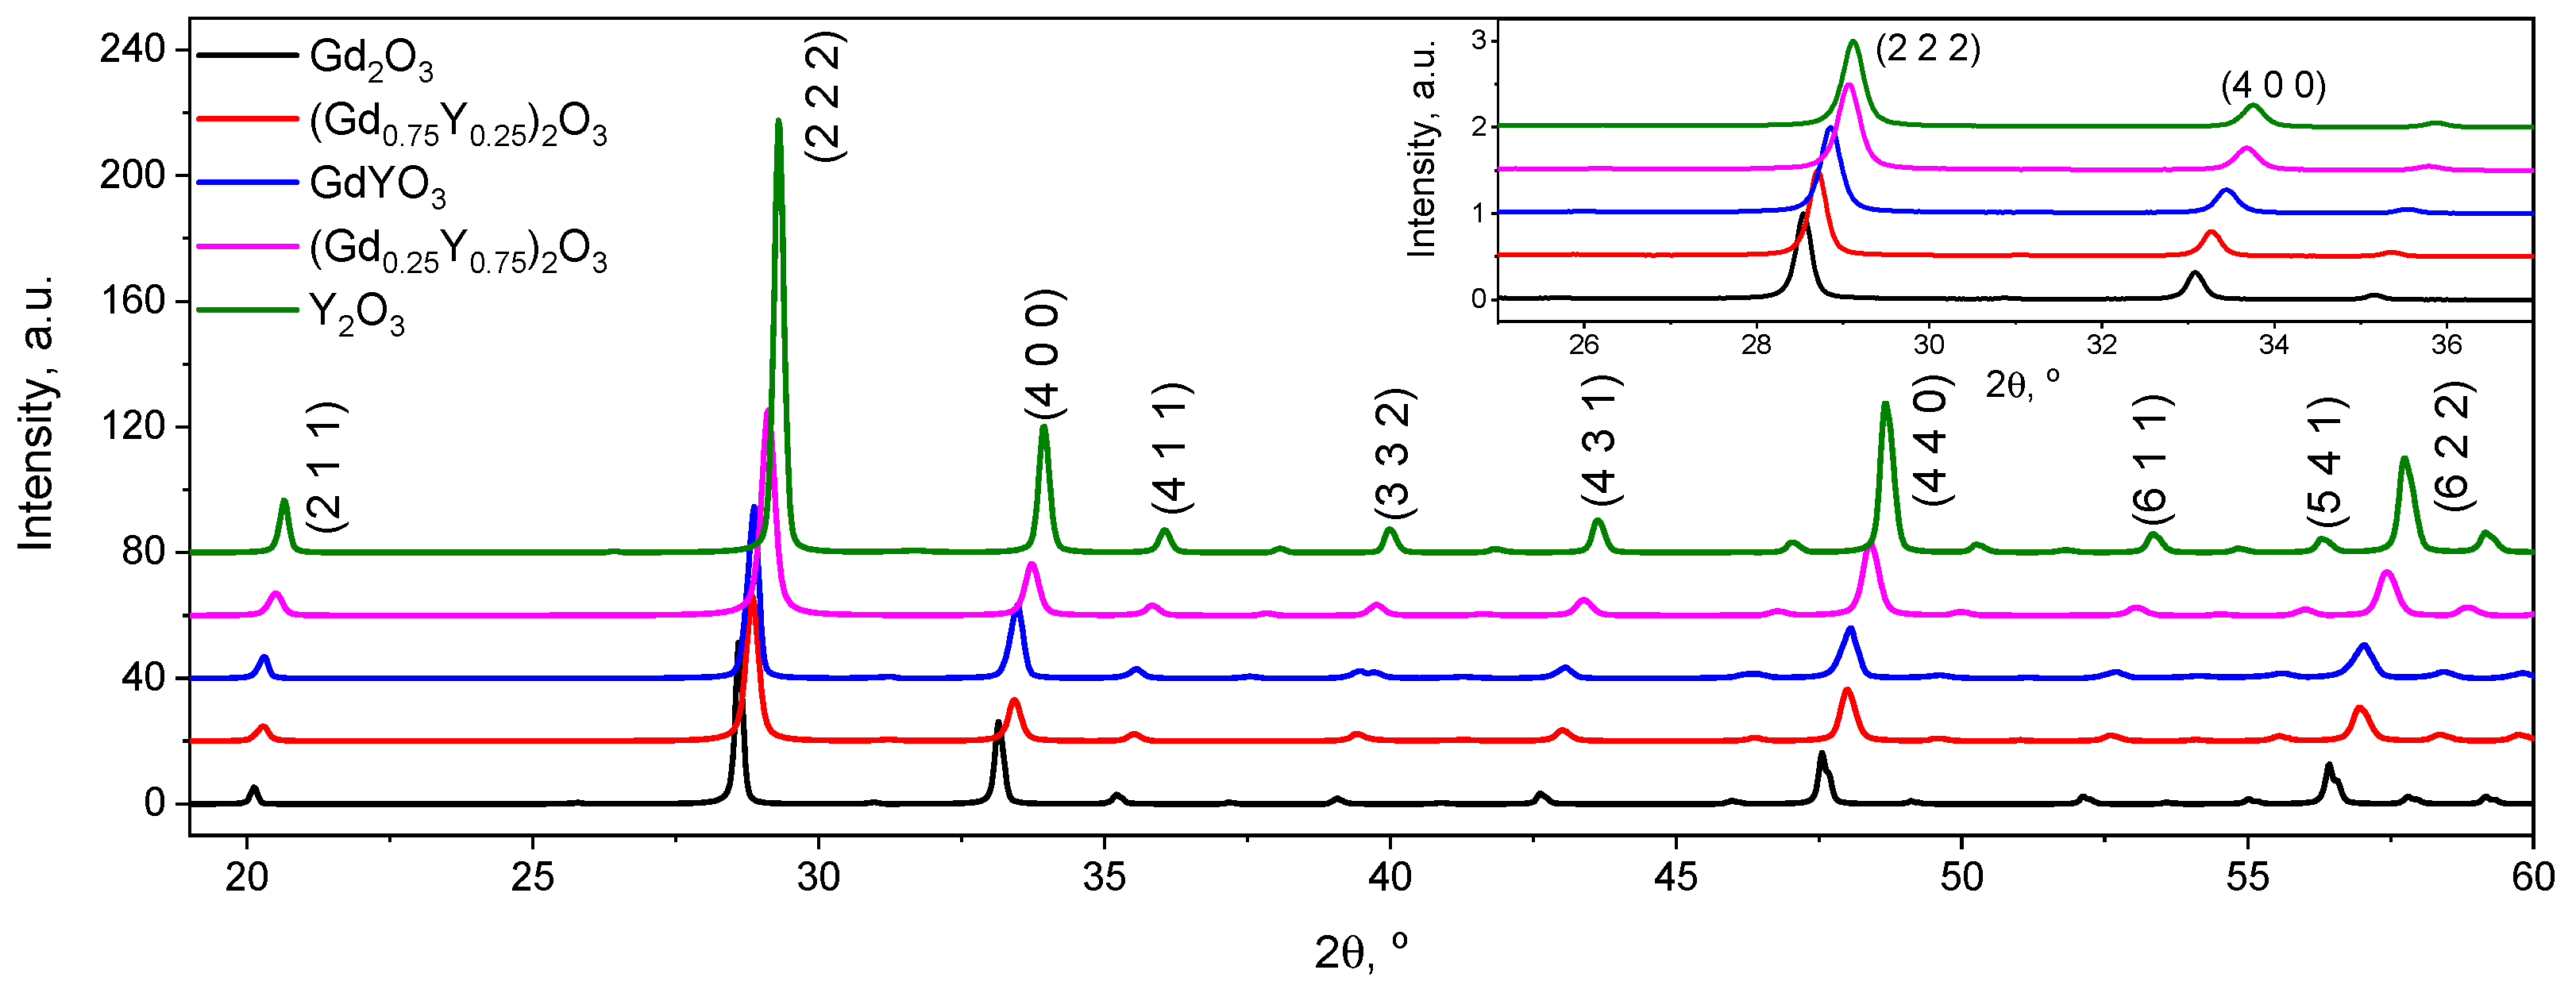
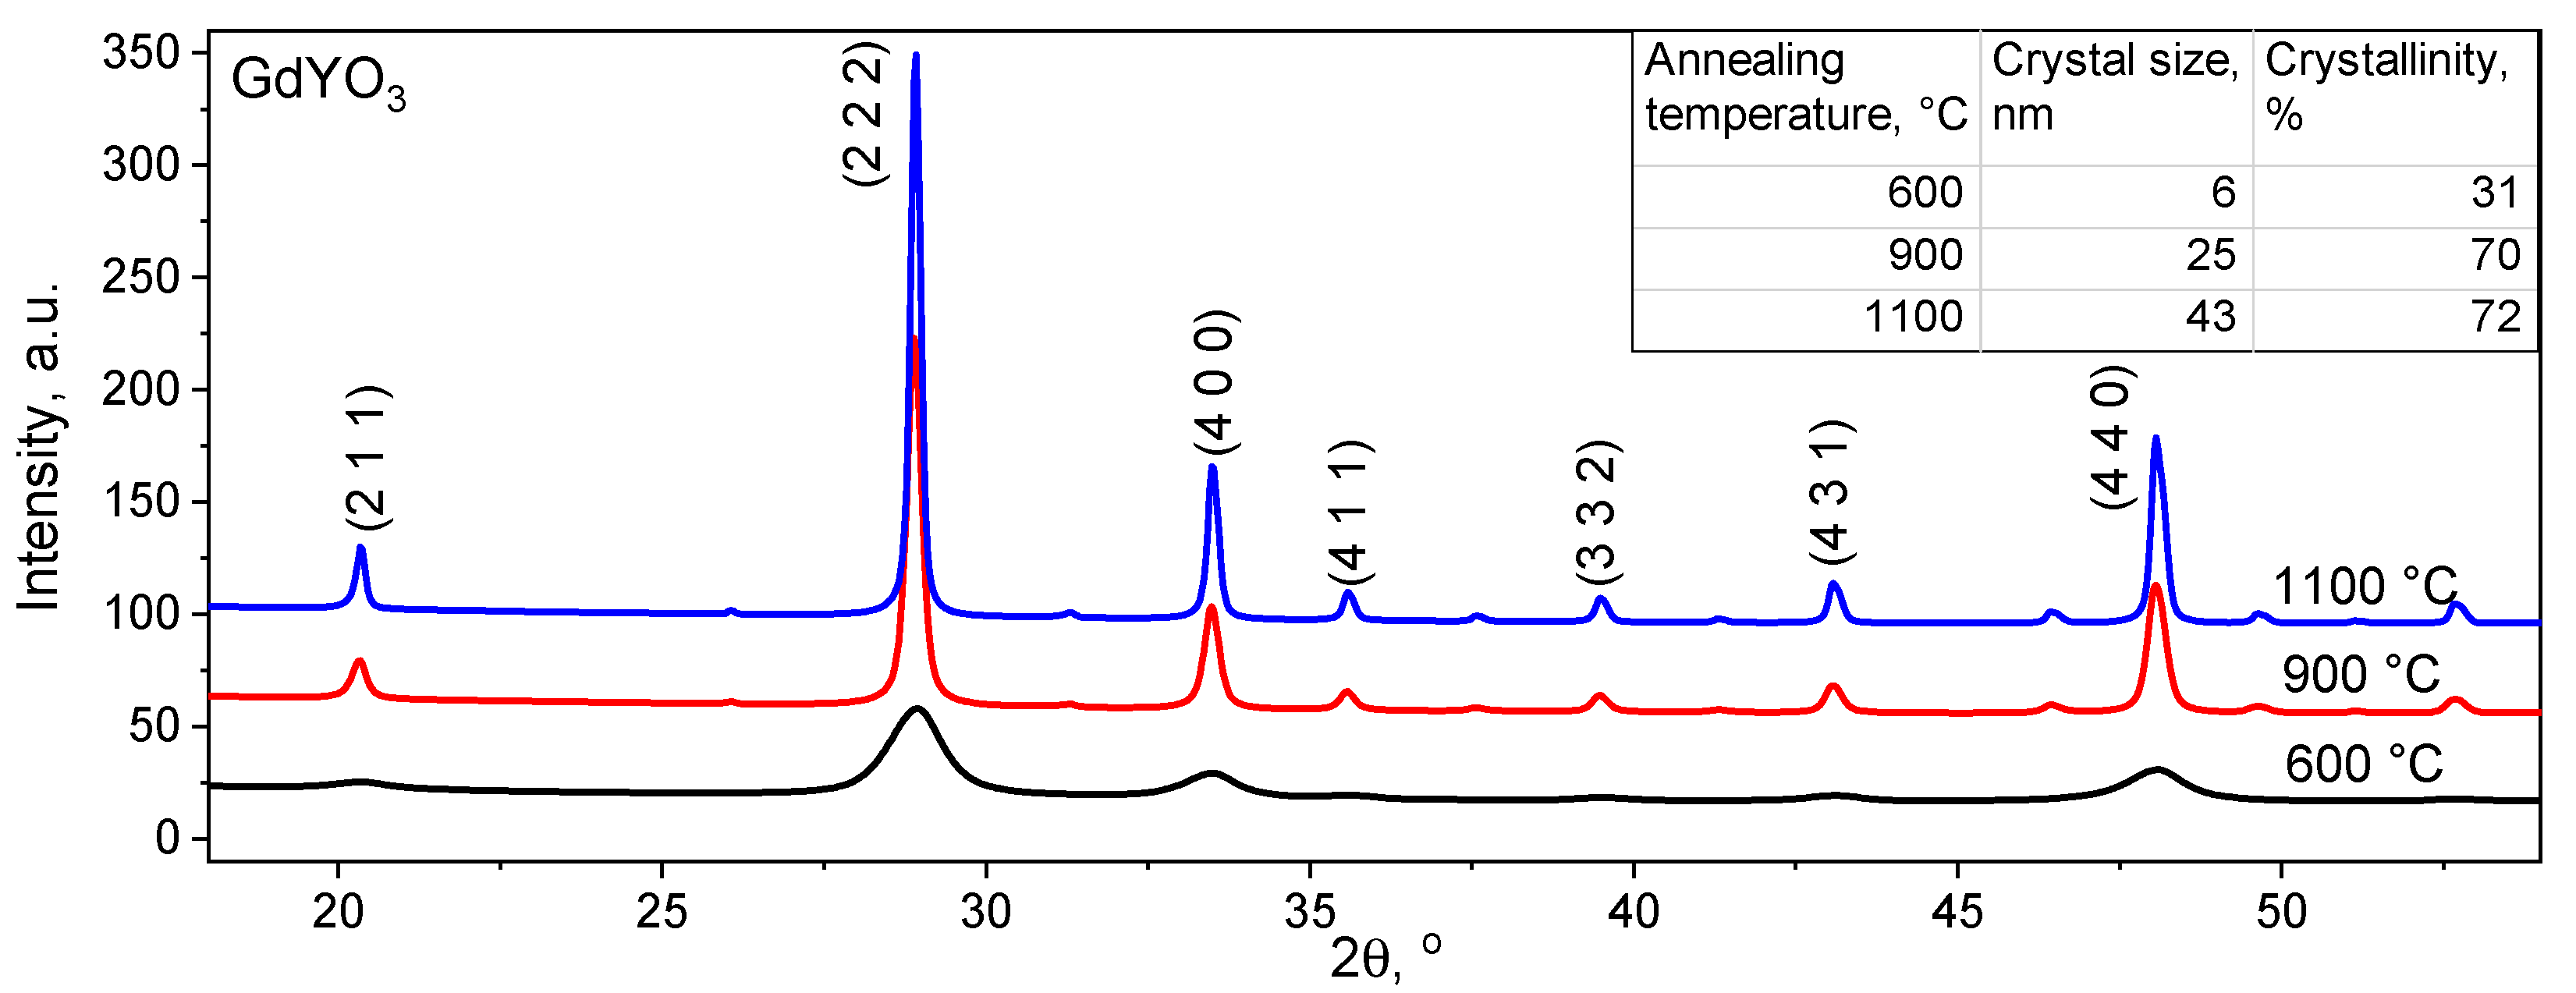
3.1. XRD Studies

The X-ray Diffraction (XRD) results of powders synthesized at different temperatures showed the absence of an amorphous halo, and the calculation of the degree of crystallinity using the diffractometer software showed a value of about 72% (Figure 1). With an increase in temperature from 600 to 1100 °C during synthesis by low-temperature thermolysis, the average grain size of the finished product increased from 6 to 43 nm (calculation error ±0.5 nm), and the degree of crystallinity increased from 31% to 72% (calculation error ±5%), reaching a maximum at temperature synthesis at 900 °C within the error (inset in Figure 1). A further increase in temperature did not lead to an increase in the degree of crystallinity; therefore, for all samples described below, the annealing temperature was 900 °C. According to XRD data, “Gd1Y1O3” powders do indeed contain cubic GdYO3 crystals (PDF card No. 00-055-1053) with lattice period a = 10.706 ± 0.015 Å (C-type sesquioxide). An increase in the duration of the synthesis of GdYO3 powders from an hour or more did not show an increase in the degree of crystallinity (Figure S1, in Supplementary Materials). For all samples, the single GdYO3 cubic structure was obtained.
With equimolar substitution of gadolinium by yttrium ions, X-ray diffraction analysis showed that all synthesized samples had cubic symmetry. This was not surprising: sesquioxides of rare earth elements can have a hexagonal, monoclinic, and cubic structure depending on temperature [8]. At low temperatures, most oxides have a C-type cubic structure [12]. Depending on the calculation method and experimental technique, the lattice constant of cubic Gd2O3 varies from 10.812 to 10.843 Å [9,12,13], of bixbyite-type Y2O3 varies from 10.572 to 10.615 Å [14,15,16] at room temperature and normal pressure. In our case, the lattice constants were 10.816 and 10.607 Å for Gd2O3 and Y2O3, respectively.
Figure 2 shows a smooth shift of the diffraction peaks when Gd is replaced by Y without the appearance of any other peaks with a smooth decrease in the lattice constant. This is a strong indication that no other phase has formed. Thus, the presented system of oxides is a system of continuous solid solutions [17]: that is, when gadolinium is replaced by yttrium, no additional crystalline phases appear in the samples, but there is a smooth change in the parameters of the crystal lattice structure, which is shown in Table 1. The determined lattice parameters are in a linear relationship with the composition of the sample, i.e., follow Vegard’s law.

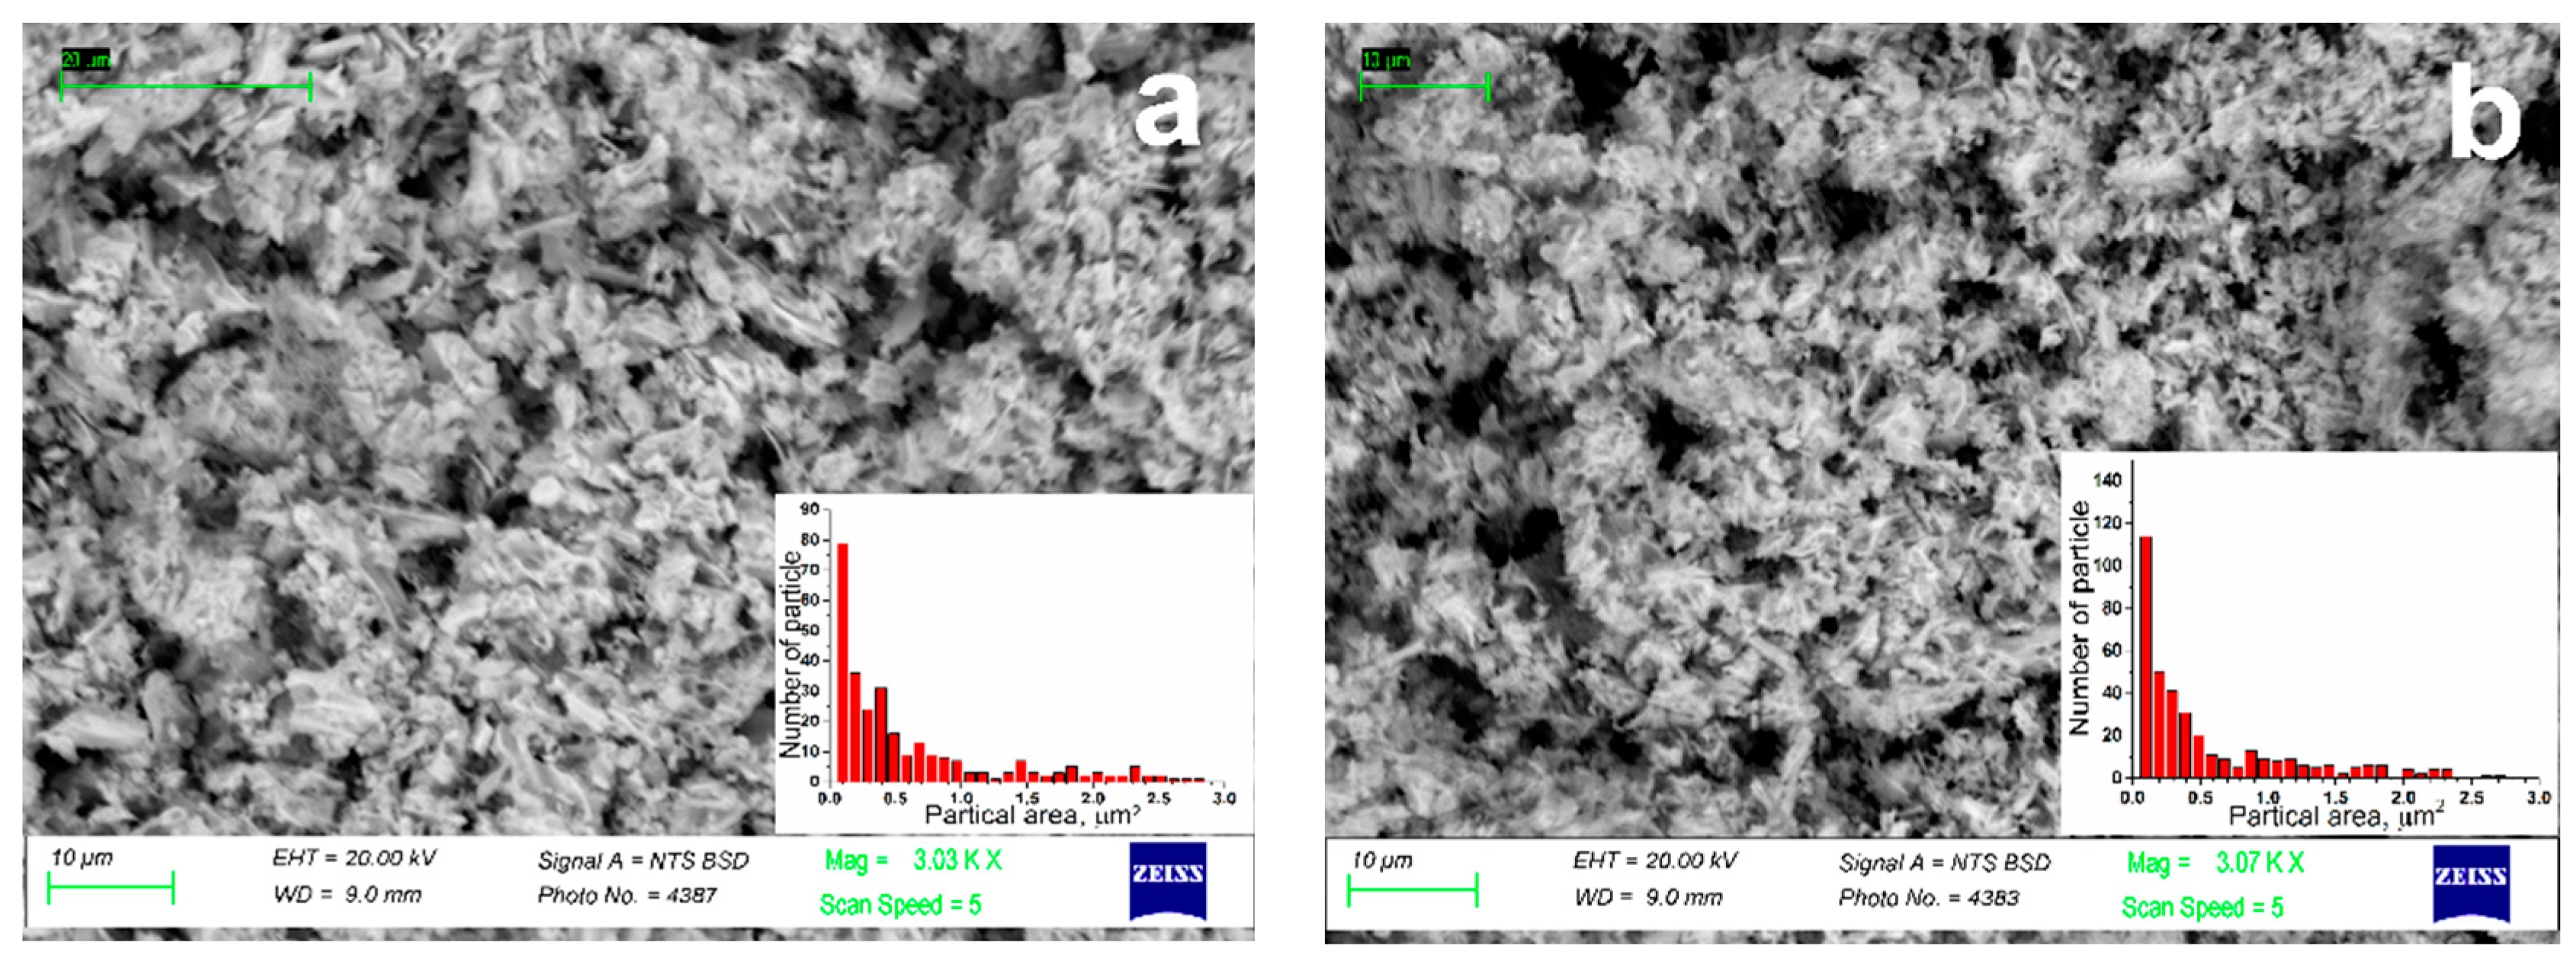
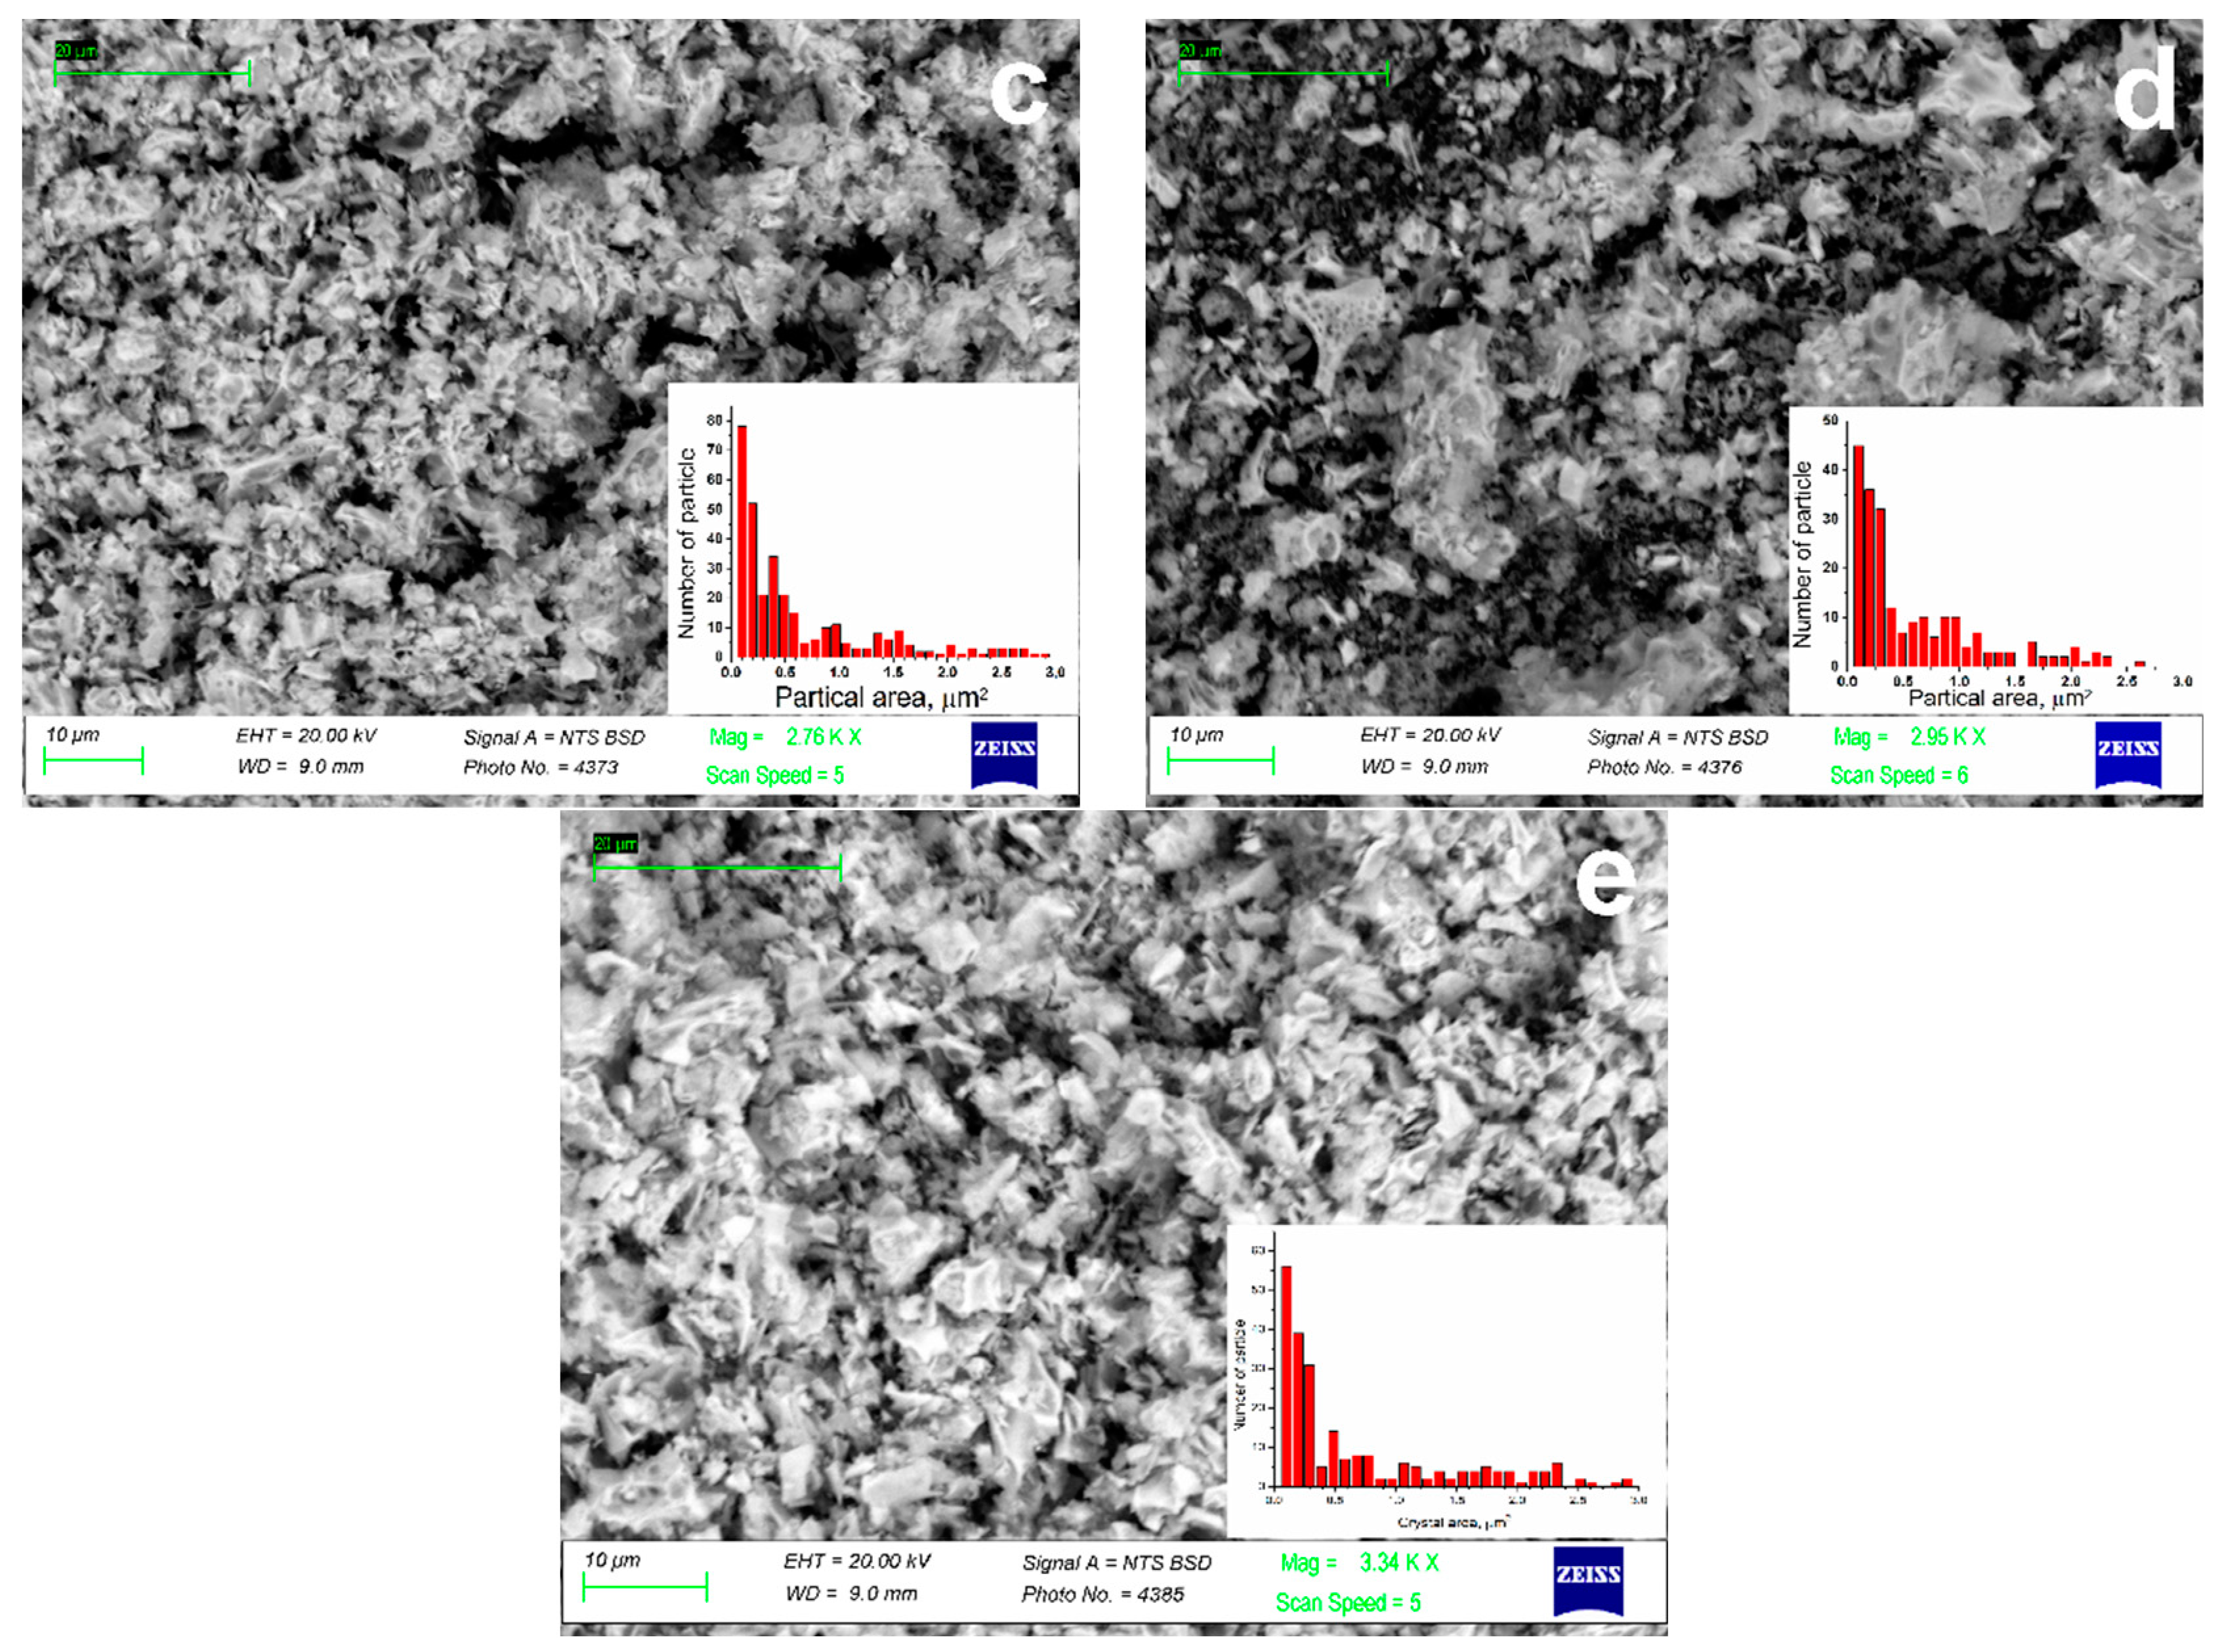
3.2. Morphology Studies

In order to observe the morphology of (Gd1−xYx)2O3 powder, scanning electron microscopy was performed. The obtained photographs are shown in Figure 3. Powders consisted of μm-sized aggregates, which consist of particles with several tens of nanometers in size (Table 1). This morphology was due to the presence of PVP in the precursor solution at the stage of crystal powder synthesis. Due to the release of a large amount of gas formed from PVP during the annealing of solutions, the resulting oxide nanosized particles were nucleated in the form of an aggregated powder.
Chemical analysis of powders was carried out at several points for each composition and averaged. The values presented in Table 2 show that the actual composition of the synthesized powders within 2 wt.% coincided with the calculated composition. The maximum deviations were observed for yttrium. The mass loss of high-water yttrium nitrate used for synthesis during its thermal decomposition into water and yttrium oxide is, on average, 70%, while the decomposition reaction proceeds completely only up to 600 °C [18]. The mass loss of high-water gadolinium nitrate is 58%, and the decomposition reaction into water and gadolinium oxide proceeds completely only up to 730 °C [19,20]. Since, during the synthesis of powders, the initial reagents were weighed without taking into account the different volatility of the components, the yttrium content in the final product can be underestimated, which is shown in Table 2. Despite the simplicity of the synthesis method, the distribution of chemical elements in the composition of the final powder was uniform, as can be seen in Figure S2, and the deviation of the chemical composition of different points from the average was within 0.5%.

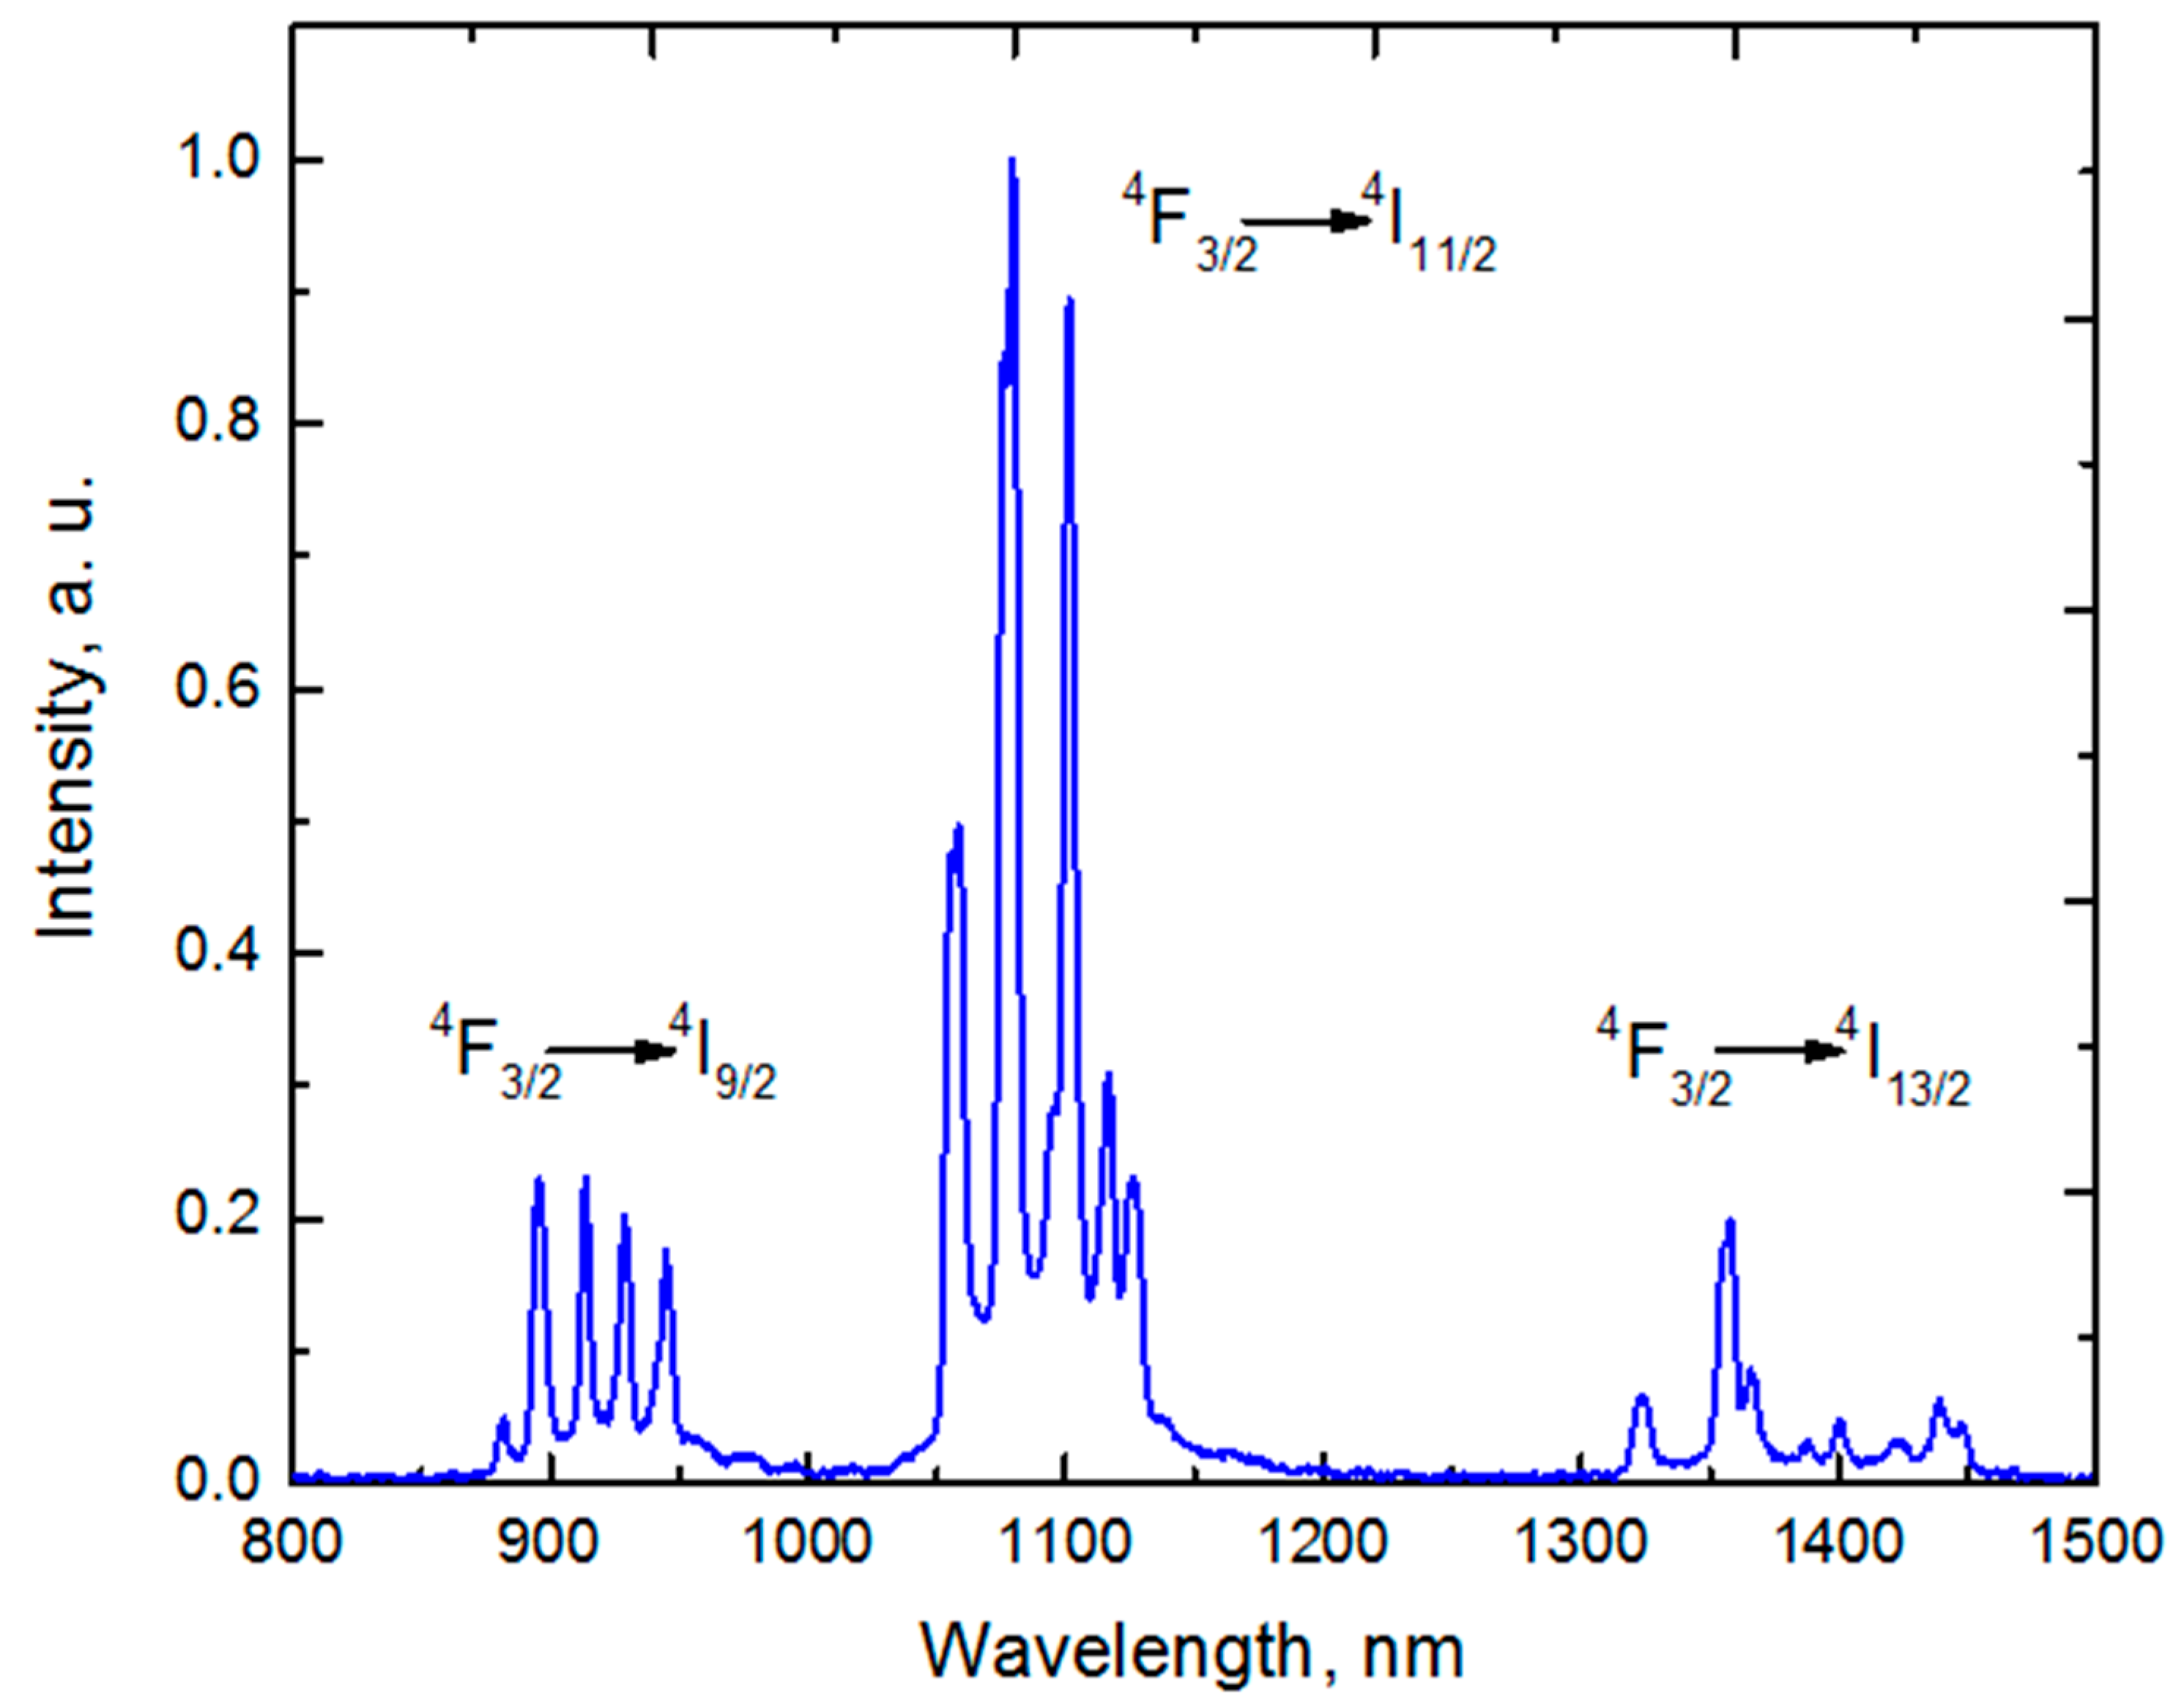
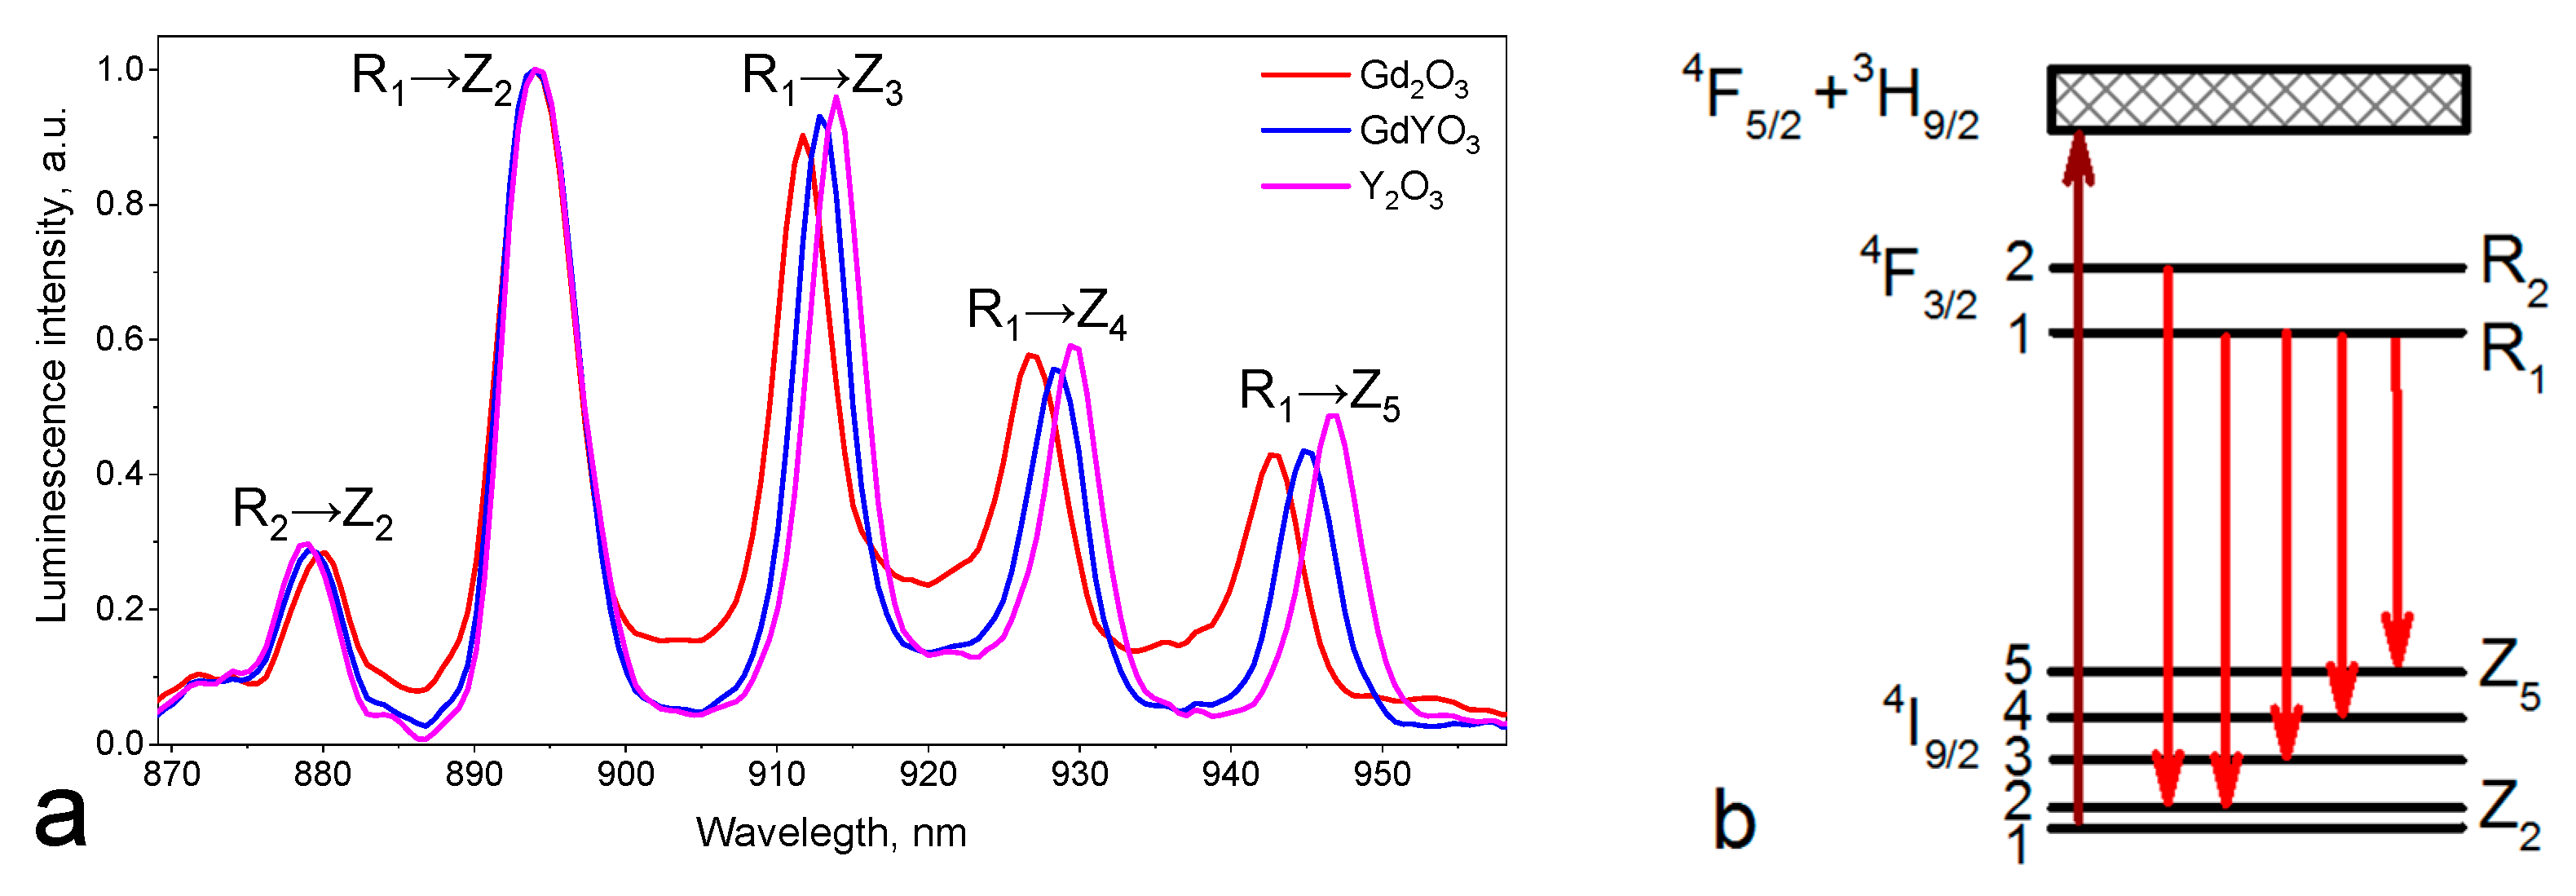
3.3. Spectral Properties

The fluorescence spectrum contains three fluorescence bands corresponding to the 2F3/24I9/2, 4I11/2 and 4I13/2 transitions with maxima at 900, 1064 and 1350 nm, respectively (Figure 4).
At least five emission peaks were clearly observed near 900 nm (Figure 5a). These lines can be associated with various transitions from 4F3/2 to 4I9/2 Stark sublevels [21].
For the RE3+ ions in the C2 positions in Y2O3, “forced” electric dipole transitions between the Stark energy levels of the 2S+1LJ Nd3+ (4f3) multiplet manifolds are allowed so that the J + ½ Stark levels expected in each manifold can be identified. By analyzing absorption and fluorescence spectra [22]. Comparing the energy difference between different Stark sublevels, we can conclude that the emission line centered at 879–880 nm was due to the transition from the higher-energy Stark sublevel 4F3/2(2) to 4I9/2(2), and the emission in the region of 943–947 nm was associated with the transition from the lower energy Stark sublevel 4F3/2(1) to 4I9/2(5) (Figure 5b) [23]. The band at 894 nm, corresponding to the 4F3/2(1)4I9/2(2) transition, remained immobile as the composition changed; it corresponded to the transition between thermally coupled levels and was taken into account when calculating the temperature sensitivity in what follows. The remaining lines were formed by the overlap of transitions from both 4F3/2 Stark sublevels to different 4I9/2 Stark sublevels [24]. It can be seen from Figure 5a that the Stark sublevels shifted as the composition changed from Gd2O3 to Y2O3, with the largest shift by 4 nm being observed for the 4F3/2(1)4I9/2(5) transition. The shift value is presented in Table 3. The fluorescence spectrum of Nd3+ ions in the region of the 4F3/24I11/2 transition (Figure S4) contained nine known transitions between the Stark sublevels [22] in the case of powder synthesis at 1100 °C.
The shift occurred due to a change in the composition: when the environment of neodymium ions changes, the energy of the Stark sublevels changes depending on the composition. The wavelength of the fluorescence peak depends on the energy gap between the upper and lower levels. The local field strength affects the inner F-shell of neodymium ions in the case of substitution of Y for Gd since the size of the unit cell of Gd2O3, and Y2O3 is different (Table 3).
Thus, the Stark fluorescence sublevels shifted to longer wavelengths when Gd was replaced by Y. The effect of the unit cell size on the spectral properties of Nd3+ can also be observed in the absorption spectra (Figure S3). According to Table 3, the dependence of the energy gap between the R1 and R2 sublevels of the 4F3/2 level on the lattice constant can be approximated by a linear function (with an error of 5%). The principle of operation of thermoluminescent sensors is based on the redistribution of populations between two thermally coupled levels separated by an energy gap. The efficiency of the temperature sensor depends on the size of this gap since such thermometers suffer from low sensitivity due to the limitation of a small energy gap [7]. The standard gap between the R1 and R2 sublevels of the 4F3/2 Nd3+ level for Y2O3 is about 200 cm−1 [24]. In our case, the maximum energy gap between adjacent Stark sublevels within the 4F3/2 level was 195 cm−1.

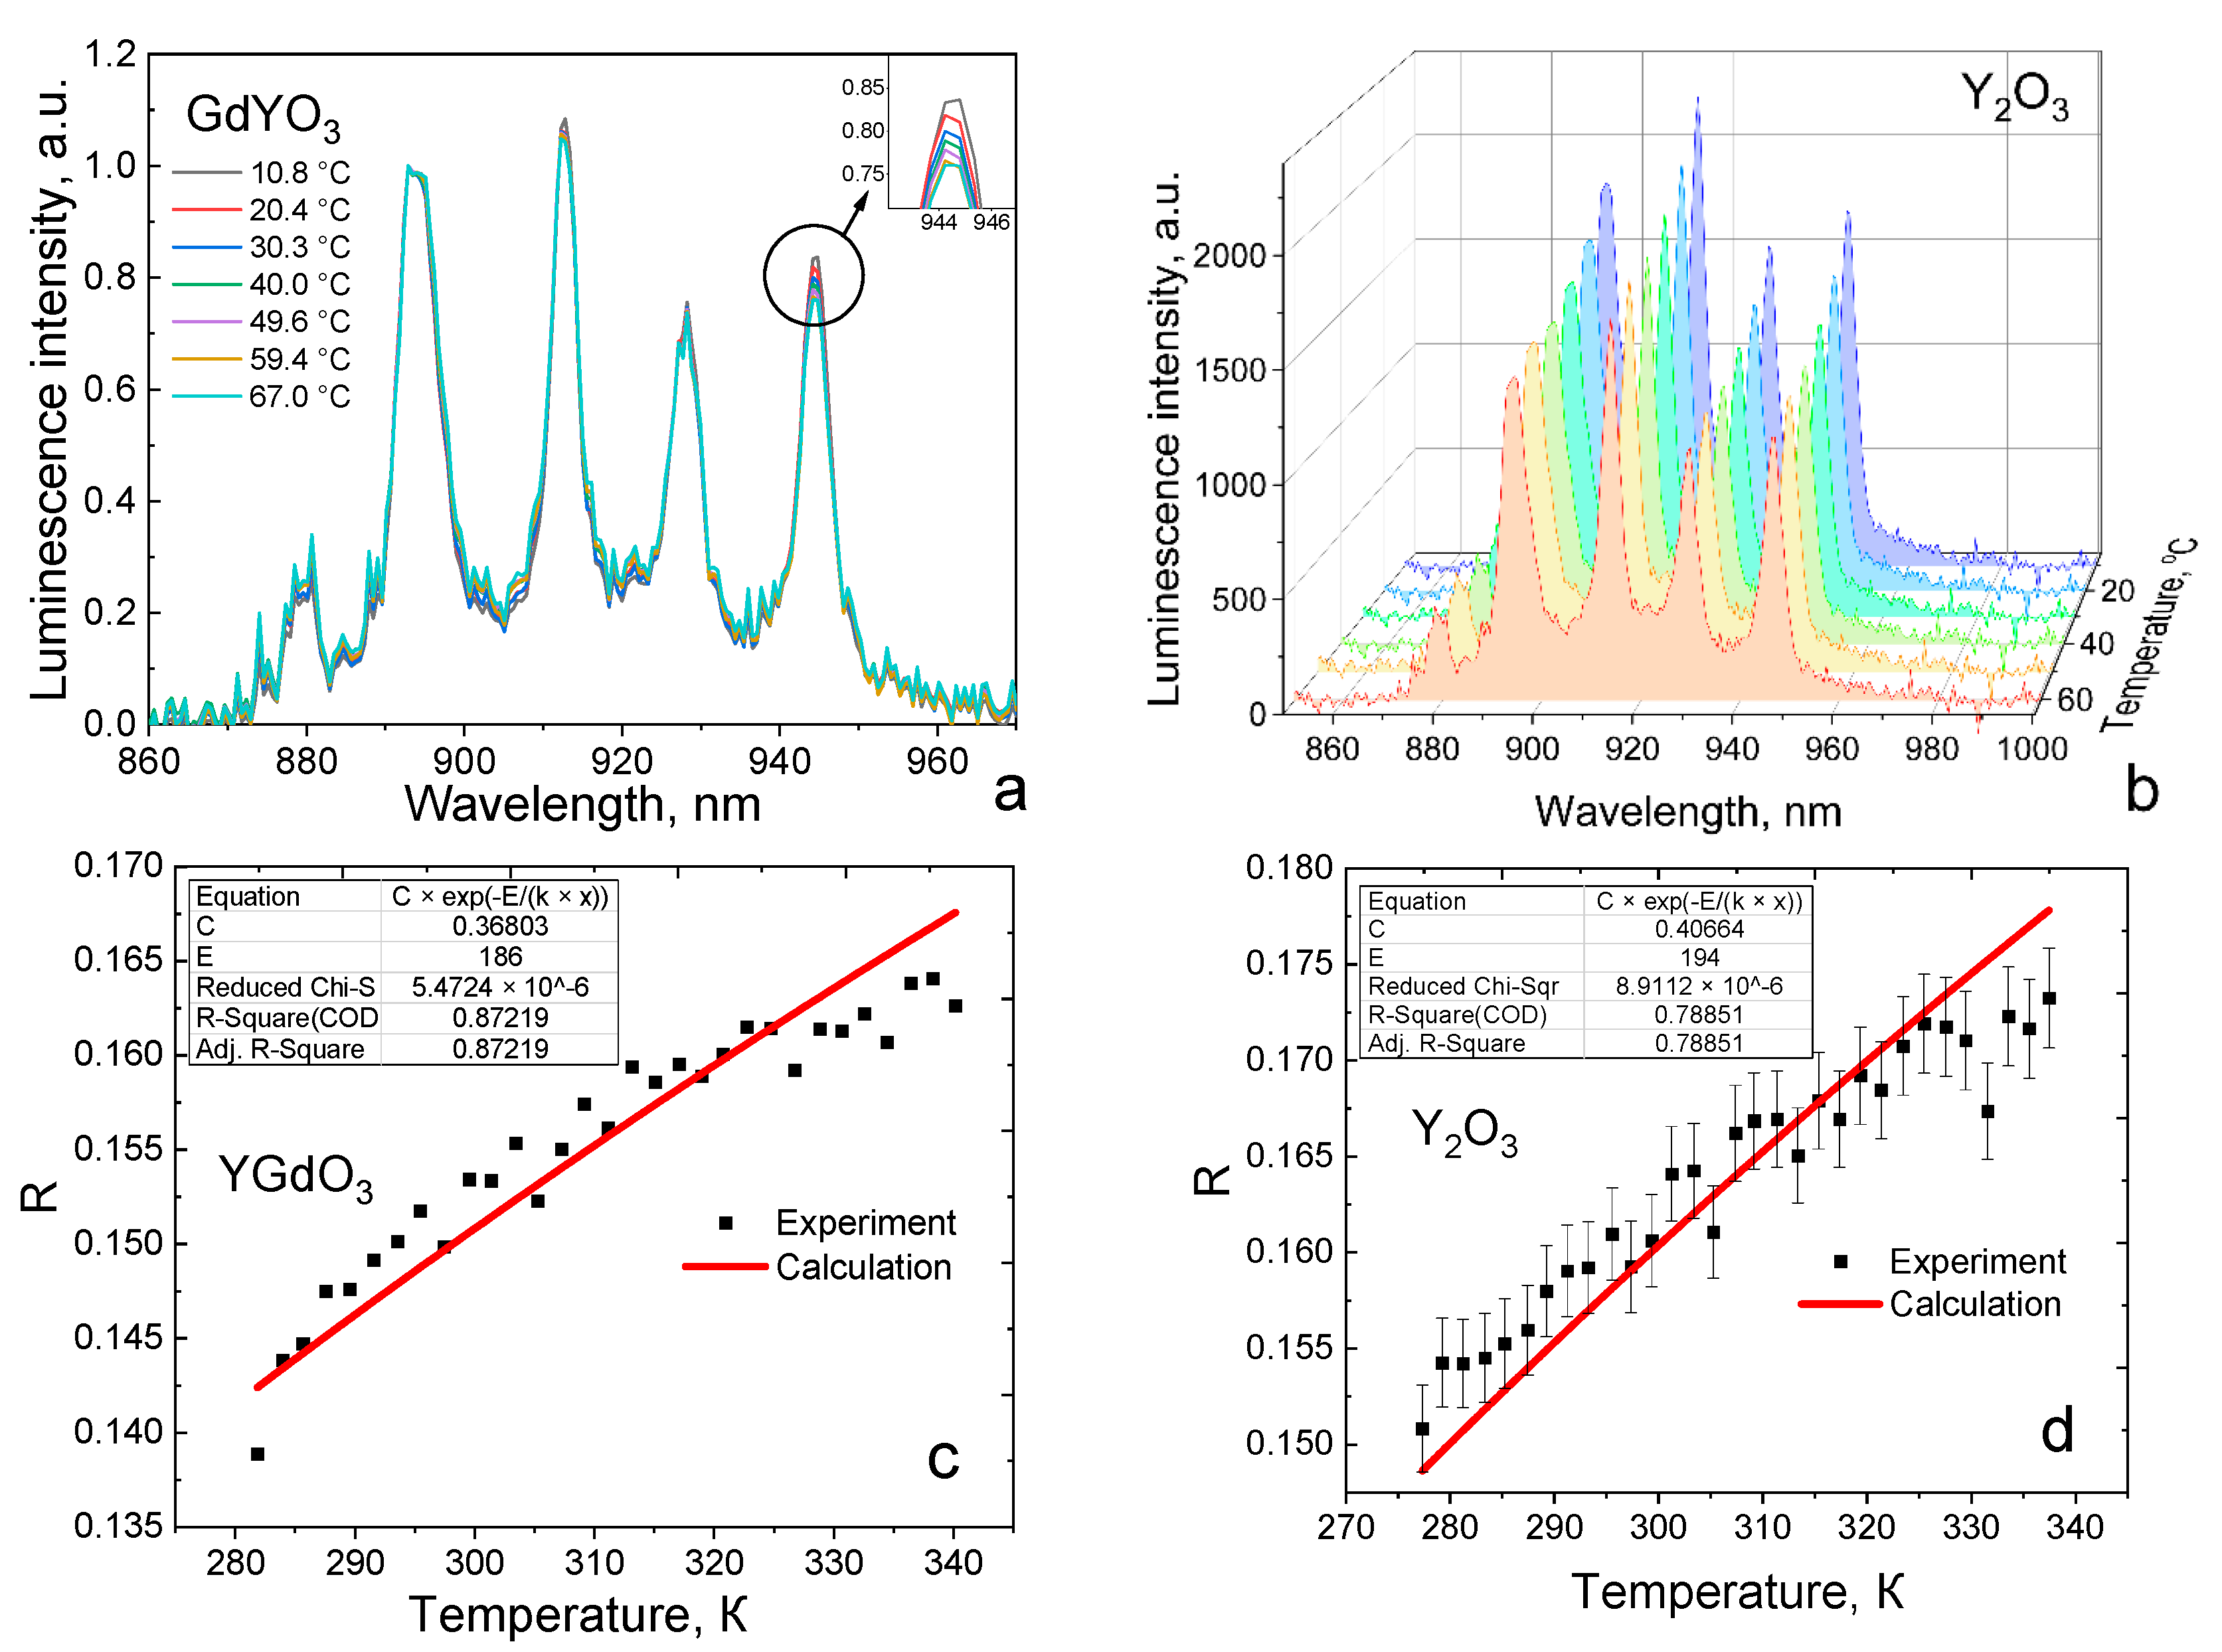
3.4. Thermometry Studies

Excitation near 800 nm promotes the 4I9/22H9/2 + 4F5/2 Nd3+ transition [24]. To study the characteristics of the obtained samples as optical nanothermometers in biological systems, the emission spectra of samples doped with 1 wt.% Nd3+ ions, upon excitation by a cw diode laser with a wavelength of 808 nm, were recorded, and the temperature of the sample varied in the range of 10–70 °C (Figure 5a), although the range of physiological temperatures is 30–60 °C. The change in temperature in the fluorescence spectra of other powders can be seen in Figure S5. An intensity redistribution of the fluorescence bands can be observed if the activator ion has two thermally coupled levels. The populations of such levels obey Boltzmann’s law (Formula (1)):
N ( R 1 ) N ( R 2 ) = g R 1 g R 2 e ( Δ E k T ) ,
where   N ( R i )—the population of each of the thermally coupled levels; g R i —level degeneracy; ΔE—is the energy gap between the levels, determined from the absorption or luminescence spectra; k—Boltzmann’s constant.
That is, at temperatures above absolute zero, thermal energy can be enough to overcome the gap between thermally coupled levels, which leads to a redistribution of the population over the levels. This, in turn, leads to a change in the fluorescence bands’ intensity corresponding to transitions from thermally coupled levels. After the establishment of a constant population at the levels during operation in a continuous mode, the ratio of the fluorescence bands corresponding to transitions from temperature-dependent levels can be related to temperature as follows:
R = I R 1 I R 2 = C e ( Δ E k T ) ,
where   I R 1 and   I R 2 —integrated luminescence intensities of transitions from thermally coupled levels. The constant C is defined as:
C = g R 1 σ R 1 ω R 1 g R 2 σ R 2 ω R 2 ,
where   g ,   σ ,   ω —degeneracy, radiation cross section, angular frequency of fluorescent transitions from the corresponding thermally coupled levels to the main one.
During the study, we measured the fluorescence spectra of the neodymium ion, for which the role of thermally coupled levels is played by the Stark sublevels of the 4F3/2 level—R1 and R2. Transitions are made to the Z2 sublevel of the main 4I9/2 level. As a result of the thermal population of the upper R2 sublevel from the lower R1 sublevel, the intensity of the band at about 880 nm increased relatively to the band at 894 nm with increasing temperature [22], i.e., comparing the integral intensities with each other these individual bands can provide temperature data.
The ratio of fluorescence intensities between 4F3/2(2)4I9/2(2) and 4F3/2(1)4I9/2(2) (hereinafter R) (Figure 6c,d) was chosen for thermometry since they have temperature dependence in the biological range due to the size of the energy gap between the Stark sublevels. Figure 6 shows the obtained fluorescence spectra, as well as the obtained fluorescence intensity coefficients and their approximation by an exponential function. The approximation parameters were the energy gap—a fixed value for each Y/Gd ratio and the coefficient C (Formula (3)). Parameter C was chosen programmatically to ensure maximum convergence [25].
The approximation accuracy (adjusted R2) lay in the range of 0.7 to 0.87. The incomplete correspondence between the experimental and theoretical dependences is due to the imperfection of the theoretical model. That is, that Equation (2) does not consider such phenomena as ion-ion interactions with temperature changes, an increase in temperature fluctuations, as well as various subtle effects. The maximum discrepancies are observed at the ends of the dependences since the contribution of temperature effects not taken into account in the theoretical model increases. That is, for the practical application of these crystalline systems as temperature sensors, it is necessary to use additional mathematical tools, such as regression analysis [26].
Figure S7 shows a graph of the dependence of the fluorescence intensity coefficient on temperature for different x from 0 to 1 in the (GdxY1−x)2O3 system. If we consider the entire temperature range in which the measurements were made, the coefficient R has maximum values for Y2O3:Nd (values lie in the range of 0.150–0.175) and minimum values for Gd2O3:Nd. The Gd1.5Y0.5O3 sample did not fit into the general dependence, and its intensity coefficient was close in its values to that of yttrium oxide. This may be because at such a Gd/Y ratio, nonequivalent neodymium substitution sites appear and or the structure of the unit cell is distorted.
Absolute thermal sensitivity expresses the suitability of a fluorescent thermometer for measuring temperature. However, to compare the thermal performance of different nanothermometers, regardless of their nature, it is useful to estimate the relative thermal sensitivity S, which can be expressed as follows [24,27]:
S = 1 R d R d T × 100 % ,
where R is the mean size of luminescence intensity ratio, dR express changes of luminescence intensity ratio with dT changes of temperature. Table 4 shows the relative thermal sensitivity of all samples for R fluorescence intensity ratios mean for the whole temperature region from 10 to 70 °C. The sensitivity of the intensity’s ratio of the R2 → Z2 to R1 → Z2 transitions varies from 0.18 to 0.22, increasing from pure gadolinium oxide to GdYO3. Table 4 shows that the sensitivity value for Gd2O3 doped with neodymium from [11] stands out from a number of other values. However, such a high sensitivity can be explained by the fact that the sensitivity was determined by comparing the fluorescence intensities of transitions from different excited levels and not between Stark sublevels. So, if we compare the sensitivity in terms of the ratio of fluorescence intensities between Stark transitions, then it lies in the range from 0.31 to 0.11% °C−1. The maximum sensitivity we obtained was 0.22% °C−1, which is a good result for this calculation method. To increase the sensitivity, it is possible to improve the mathematical processing of the obtained results, for example, using the partial least squares method [28]. The choice of spectral variables by the original method of searching for a combination moving window [26] in the multivariate model of partial least squares made it possible to reduce the mean square error of the temperature calibration of yttrium gadolinium oxide to 0.8 °C [29]. This result allows us to conclude that the proposed neodymium-doped crystalline powders and multivariate methods can be used to localize areas with febrile temperatures for biological and medical purposes.

4. Conclusions

Neodymium-doped crystalline powders of gadolinium and yttrium oxides (Gd1−xYx)2O3 were synthesized by the liquid-polymer-salt method. The addition of PVP increased the homogeneity of the mixture and ensured high adhesion of the obtained powders. The synthesized crystals are 23–35 nm in size and are part of micrometer-sized agglomerates (up to 14 μm). The largest aggregates were observed in the Gd2O3 sample and the smallest in the Y2O3 sample. The (Gd1−xYx)2O3 system was a system of continuous solid solutions showing a smooth shift in the diffraction peaks when replacing Gd with Y. The Stark sublevels of the 4F3/24I9/2 luminescent band shifted to 4 nm when Gd was replaced by Y since local fields had a stronger effect on the internal F-shell of Nd ions in the case of yttrium. Thermometers based on thermally coupled levels usually have low sensitivity due to the small energy gap limitation. The ratio of fluorescence intensities between 4F3/2(2)4I9/2(2) and 4F3/2(1)4I9/2(2) Stark sublevels was chosen for thermometry because of correspondence to the first biological window. The best obtained sensitivity was 0.22% °C−1 for Nd-doped GdYO3 powder in the range of 10–70 °C. These results may provide an effective way to improve thermometric performance and expand the application of fluorescent temperature measurement in various fields.

Supplementary Materials

The following supporting information can be downloaded at: https://www.mdpi.com/article/10.3390/ceramics5040084/s1. Figure S1. X-ray diffraction patterns of yttrium and gadolinium oxide GdYO3 obtained during heat treatment at a temperature of 1100 °C for various durations. Figure S2. Distribution of chemical elements over the volume of Gd0.5Y1.5O3 nanopowder obtained by SEM. Figure S3. Absorption spectra of Nd3+ ions at 4I9/24F5/2, 2H9/2 transitions in (Gd1−xYx)2O3 samples, where x=0; 1; 2. Figure S4. Luminescence spectra of Nd3+ ions at 4F3/24I11/2 transition in Y2O3 powder obtained during heat treatment at different temperatures for 1 hour. Figure S5. Luminescence spectra’ temperature dependence of Gd2O3 (a) and Gd1.5Y0.5O3 (b) samples. Figure S6. Luminescence intensity ratio R as a function of temperature for Gd2O3 (a) and Gd1.5Y0.5O3 (b) samples. Red lines correspond to the fitting by exponential function. Figure S7. Luminescence intensity coefficients (R) for all samples from the series (GdxY1−x)2O3.

Author Contributions

Writing—original draft, V.A. and I.S.; methodology, V.A.; resources, V.A., A.B. and S.E.; investigation, S.E., I.S., N.K., D.P. and M.K.; supervision, V.A.; writing—review & editing, A.B. and N.K.; funding acquisition, A.B.; Formal analysis, N.K. All authors have read and agreed to the published version of the manuscript.

Funding

The reported study was funded by RFBR and BRFBR, project number 20-58-00054.

Institutional Review Board Statement

Not applicable.

Informed Consent Statement

Not applicable.

Data Availability Statement

Not applicable.

Acknowledgments

The research held at ITMO University was supported by the Priority 2030 Federal Academic Leadership Program.

Conflicts of Interest

The authors declare no conflict of interest.

References

  1. Kim, M.M.; Giry, A.; Mastiani, M.; Rodrigues, G.O.; Reis, A.; Mandin, P. Microscale thermometry: A review. Microelectron. Eng. 2015, 148, 129–142. [Google Scholar] [CrossRef]
  2. Quintanilla, M.; Liz-Marzán, L.M. Guiding Rules for Selecting a Nanothermometer. Nano Today 2018, 19, 126–145. [Google Scholar] [CrossRef]
  3. Nexha, A.; Carvajal, J.J.; Pujol, M.C.; Díaz, F.; Aguiló, M. Lanthanide doped luminescence nanothermometers in the biological windows: Strategies and applications. Nanoscale 2021, 13, 7913–7987. [Google Scholar] [CrossRef] [PubMed]
  4. Soga, K.; Tokuzen, K.; Tsuji, K.; Yamano, T.; Hyodo, H.; Kishimoto, H. NIR bioimaging: Development of liposome-encapsulated, rare-earth-doped Y2O3 nanoparticles as fluorescent probes. Eur. J. Inorg. Chem. 2010, 2010, 2673–2677. [Google Scholar] [CrossRef]
  5. Sukul, P.P.; Kumar, K. Near-infrared (808 and 980 nm) excited photoluminescence study in Nd-doped Y2O3 phosphor for bio-imaging. Methods Appl. Fluoresc. 2016, 4, 044005. [Google Scholar] [CrossRef] [PubMed]
  6. Bashkatov, A.N.; Genina, E.A.; Kochubey, V.I.; Tuchin, V.V. Optical properties of human skin, subcutaneous and mucous tissues in the wavelength range from 400 to 2000 nm. J. Phys. D Appl. Phys. 2005, 38, 2543–2555. [Google Scholar] [CrossRef]
  7. Shang, F.; Hu, C.; Xu, W.; Zhu, X.; Zhao, D.; Zhang, W.; Zhang, Z.; Cao, W. Near-infrared emitting Nd3+-Yb3+ codoped Y2O3 nanocrystals for highly sensitive optical thermometry. J. Alloys Compd. 2021, 858, 157637. [Google Scholar] [CrossRef]
  8. Hirosaki, N.; Ogata, S.; Kocer, C. Ab initio calculation of the crystal structure of the lanthanide Ln2O3 sesquioxides. J. Alloys Compd. 2003, 351, 31–34. [Google Scholar] [CrossRef]
  9. Lonappan, D.; Shekar, N.V.C.; Sahu, P.C.; Kumarasamy, B.V.; Bandyopadhyay, A.K.; Rajagopalan, M. Cubic to hexagonal structural transformation in Gd2O3 at high pressure. Philos. Mag. Lett. 2008, 88, 473–479. [Google Scholar] [CrossRef]
  10. Lojpur, V.; Nikolic, M.; Mancic, L.; Milosevic, O.; Dramicanin, M.D. Y2O3:Yb,Tm and Y2O3:Yb,Ho powders for low-temperature thermometry based on up-conversion fluorescence. Ceram. Int. 2013, 39, 1129–1134. [Google Scholar] [CrossRef]
  11. Balabhadra, S.; Debasu, M.L.; Brites, C.D.S.; Nunes, L.A.O.; Malta, O.L.; Rocha, J.; Bettinelli, M.; Carlos, L.D. Boosting the sensitivity of Nd3+-based luminescent nanothermometers. Nanoscale 2015, 7, 17261–17267. [Google Scholar] [CrossRef] [PubMed]
  12. Adachi, G.Y.; Imanaka, N. The binary rare earth oxides. Chem. Rev. 1998, 98, 1479–1514. [Google Scholar] [CrossRef]
  13. Dargis, R.; Williams, D.; Smith, R.; Arkun, E.; Roucka, R.; Clark, A.; Lebby, M. Structural and Thermal Properties of Single Crystalline Epitaxial Gd2O3 and Er2O3 Grown on Si(111). ECS J. Solid State Sci. Technol. 2012, 1, N24–N28. [Google Scholar] [CrossRef]
  14. Barad, C.; Kimmel, G.; Rosen, B.A.; Sahartov, A.; Hayun, H.; Zabicky, J.; Gelbstein, Y. Lattice variation of cubic Y2O3 in three dimensions: Temperature, pressure and crystal size. J. Alloys Compd. 2021, 885, 161199. [Google Scholar] [CrossRef]
  15. Kruk, A. Structural and magneto-optical characterization of la, nd: Y2O3 powders obtained via a modified edta sol–gel process and hip-treated ceramics. Materials 2020, 13, 4928. [Google Scholar] [CrossRef] [PubMed]
  16. Gaboriaud, R.J.; Paumier, F.; Lacroix, B. Disorder-order phase transformation in a fluorite-related oxide thin film: In-situ X-ray diffraction and modelling of the residual stress effects. Thin Solid Films. 2016, 601, 84–88. [Google Scholar] [CrossRef]
  17. Schneider, S.J.; Roth, R.S. Phase equilibria in systems involving the rare-earth oxides. Part II. Solid state reactions in trivalent rare-earth oxide systems. J. Res. Natl. Bur. Stand. Sect. A Phys. Chem. 1960, 64A, 317. [Google Scholar] [CrossRef]
  18. Melnikov, P.; Nascimento, V.A.; Consolo, L.Z.Z.; Silva, A.F. Mechanism of thermal decomposition of yttrium nitrate hexahydrate, Y(NO3)3·6H2O and modeling of intermediate oxynitrates. J. Therm. Anal. Calorim. 2013, 111, 115–119. [Google Scholar] [CrossRef]
  19. Fukuda, T.; Nakano, Y.; Takeshita, K. Non-isothermal kinetics of the thermal decomposition of gadolinium nitrate. J. Nucl. Sci. Technol. 2018, 55, 1193–1197. [Google Scholar] [CrossRef]
  20. Melnikov, P.P.; Nascimento, V.A.; Zanoni Consolo, L.Z. Computerized modeling of intermediate compounds formed during thermal decomposition of gadolinium nitrate hydrate. Russ. J. Phys. Chem. A. 2012, 86, 1659–1663. [Google Scholar] [CrossRef]
  21. Leavitt, R.P.; Gruber, J.B.; Chang, N.C.; Morrison, C.A. Optical spectra, energy levels, and crystal-field analysis of tripositive rare-earth ions in Y2O3. I. Kramers ions in C2 sites. J. Chem. Phys. 1981, 76, 4775–4788. [Google Scholar] [CrossRef]
  22. Gruber, J.B.; Sardar, D.K.; Nash, K.L.; Yow, R.M. Comparative study of the crystal-field splitting of trivalent neodymium energy levels in polycrystalline ceramic and nanocrystalline yttrium oxide. J. Appl. Phys. 2007, 102, 023103. [Google Scholar] [CrossRef]
  23. Gomes, M.A.; Carvalho, I.S.; Domingos, L.F.A.; Brandão-Silva, A.C.; Avila, J.F.M.; Rodrigues, J.J.; Alencar, M.A.R.C.; Valerio, M.E.G.; Macedo, Z.S. Temperature-sensitive luminescence of Y2O3:Nd3+ nanocrystals produced by an eco-friendly route. Opt. Mater. 2019, 89, 536–542. [Google Scholar] [CrossRef]
  24. Kolesnikov, I.E.; Kalinichev, A.A.; Kurochkin, M.A.; Mamonova, D.V.; Kolesnikov, E.Y.; Kurochkin, A.V.; Lähderanta, E.; Mikhailov, M.D. Y2O3:Nd3+ nanocrystals as ratiometric luminescence thermal sensors operating in the optical windows of biological tissues. J. Lumin. 2018, 204, 506–512. [Google Scholar] [CrossRef]
  25. Collins, S.F.; Baxter, G.W.; Wade, S.A.; Sun, T.; Grattan, K.T.V.; Zhang, Z.Y.; Palmer, A.W. Comparison of fluorescence-based temperature sensor schemes: Theoretical analysis and experimental validation. J. Appl. Phys. 1998, 84, 4649–4654. [Google Scholar] [CrossRef]
  26. Khodasevich, M.A.; Aseev, V.A. Selection of Spectral Variables and Improvement of the Accuracy of Calibration of Temperature by Projection onto Latent Structures Using the Fluorescence Spectra of Yb3+:CaF2. Opt. Spectrosc. 2018, 124, 748–752. [Google Scholar] [CrossRef]
  27. Kolesnikov, I.E.; Kalinichev, A.A.; Kurochkin, M.A.; Mamonova, D.V.; Kolesnikov, E.Y.; Kurochkin, A.V.; Lähderanta, E.; Mikhailov, M.D. New strategy for thermal sensitivity enhancement of Nd3+-based ratiometric luminescence thermometers. J. Lumin. 2017, 192, 40–46. [Google Scholar] [CrossRef]
  28. Geladi, P.; Kowalski, B.R. Partial least-squares regression: A tutorial. Anal. Chim. Acta. 1986, 185, 1–17. [Google Scholar] [CrossRef]
  29. Khodasevich, M.A.; Borisevich, D.A.; Aseev, V.A.; Kuzmenko, N.K.; Sevastianova, I.M. Uni- and multivariate calibration of temperature from the neodymium fluorescence spectra in nanocrystals (YxGd1−x)2O3 and (YxGd1−x)3Al5O12. J. Belarusian State Univ. Phys. 2022; in press. [Google Scholar] [CrossRef]
  30. Wawrzynczyk, D.; Bednarkiewicz, A.; Nyk, M.; Strek, W.; Samoc, M. Neodymium (iii) doped fluoride nanoparticles as non-contact optical temperature sensors. Nanoscale 2012, 4, 6959–6961. [Google Scholar] [CrossRef]
  31. Marciniak, L.; Pilch, A.; Arabasz, S.; Jin, D.; Bednarkiewicz, A. Heterogeneously Nd3+ doped single nanoparticles for NIR-induced heat conversion, luminescence, and thermometry. Nanoscale 2017, 9, 8288–8297. [Google Scholar] [CrossRef] [PubMed]
  32. Benayas, A.; Del Rosal, B.; Pérez-Delgado, A.; Santacruz-Gómez, K.; Jaque, D.; Hirata, G.A.; Vetrone, F. Nd:YAG Near-Infrared Luminescent Nanothermometers. Adv. Opt. Mater. 2015, 3, 687–694. [Google Scholar] [CrossRef]
  33. Đačanin Far, L.; Lukić-Petrović, S.R.; Đorđević, V.; Vuković, K.; Glais, E.; Viana, B.; Dramićanin, M.D. Luminescence temperature sensing in visible and NIR spectral range using Dy3+ and Nd3+ doped YNbO4. Sens. Actuators A Phys. 2018, 270, 89–96. [Google Scholar] [CrossRef]
  34. Carrasco, E.; Del Rosal, B.; Sanz-Rodríguez, F.; De La Fuente, Á.J.; Gonzalez, P.H.; Rocha, U.; Kumar, K.U.; Jacinto, C.; Solé, J.G.; Jaque, D. Intratumoral thermal reading during photo-thermal therapy by multifunctional fluorescent nanoparticles. Adv. Funct. Mater. 2015, 25, 615–626. [Google Scholar] [CrossRef]
  35. Rocha, U.; Jacinto, C.; Kumar, K.U.; López, F.J.; Bravo, D.; Solé, J.G.; Jaque, D. Real-time deep-tissue thermal sensing with sub-degree resolution by thermally improved Nd3+:LaF3 multifunctional nanoparticles. J. Lumin. 2016, 175, 149–157. [Google Scholar] [CrossRef]
  36. Kolesnikov, I.E.; Golyeva, E.V.; Kurochkin, M.A.; Lähderanta, E.; Mikhailov, M.D. Nd3+-doped YVO4 nanoparticles for luminescence nanothermometry in the first and second biological windows. Sens. Actuators B Chem. 2016, 235, 287–293. [Google Scholar] [CrossRef]
  37. Savchuk, O.; Carvajal, J.J.; De La Cruz, L.G.; Haro-González, P.; Aguiló, M.; Díaz, F. Luminescence thermometry and imaging in the second biological window at high penetration depth with Nd:KGd(WO4)2 nanoparticles. J. Mater. Chem. C. 2016, 4, 7397–7405. [Google Scholar] [CrossRef]
  38. Marciniak, Ł.; Bednarkiewicz, A.; Hreniak, D.; Strek, W. The influence of Nd3+ concentration and alkali ions on the sensitivity of non-contact temperature measurements in ALaP4O12:Nd3+ (A = Li, K, Na, Rb) nanocrystalline luminescent thermometers. J. Mater. Chem. C. 2016, 4, 11284–11290. [Google Scholar] [CrossRef]
Figure 1. XRD patterns of GdYO3 powders synthesized at different temperatures (inset: crystal size and crystallinity degree).
Ceramics 05 00084 g001
Figure 2. XRD patterns of (Gd1−xYx)2O3 powders, where x = 0; 0.25; 0.5; 0.75, 1; the inset contains the most intense peaks on a larger scale.
Ceramics 05 00084 g002
Figure 3. SEM images of (Gd1−xYx)2O3 powders, where x = (a) 0; (b) 0.25; (c) 0.5; (d) 0.75; (e) 1.
Ceramics 05 00084 g003aCeramics 05 00084 g003b
Figure 4. Fluorescence spectrum of Gd2O3:Nd3+.
Ceramics 05 00084 g004
Figure 5. (a) Fluorescence spectra of (Gd1−xYx)2O3 crystalline powders at 4F3/24I9/2 band; (b) corresponding transitions between Stark sublevels.
Ceramics 05 00084 g005
Figure 6. Fluorescence spectra’ temperature dependence of Nd-doped GdYO3 (a) and Y2O3 (b); Luminescence intensity ratio R as a function of temperature for GdYO3 (c) and Y2O3 (d) powders. Red lines correspond to the fitting by an exponential function.
Ceramics 05 00084 g006
Table 1. Crystal characteristics of (Gd1−xYx)2O3 powders.
Sample CompositionCrystal Phase/Card No. ICDD PDF-2Lattice Constant Calculated, ÅCristal’s Size, nmCrystal System
Gd1.98Nd0.02O3Gd2O3/00-012-079710.81635 ± 1Cubic
Ia-3
Gd1.49Y0.49Nd0.02O3Gd6Y4O15/00-055-105510.73328 ± 3
Gd0.99Y0.99Nd0.02O3GdYO3/00-055-105310.70228 ± 3
Gd0.49Y1.49Nd0.02O3GdY9O15/00-055-104910.62524 ± 3
Y1.98Nd0.02O3Y2O3/01-071-597010.60723 ± 3
Table 2. The chemical composition of (Gd1−xYx)2O3 crystalline powders (wt.%).
AtomGd2O3Gd1.5Y0.5O3Gd1Y1O3Gd0.5Y1.5O3Y2O3
CalcAnalysisCalcAnalysisCalcAnalysisCalcAnalysisCalcAnalysis
O13.2513.2514.6114.4516.2915.9018.4118.4921.1521.13
Gd85.9585.7471.1172.8352.8557.4329.8529.1300
Y0013.411.5129.8825.5350.6351.4177.5777.3
Nd0.81.010.881.20.981.141.110.971.271.58
Table 3. Influence of (Gd1−xYx)2O3 composition on the luminescent transitions’ location and crystal lattice parameters.
Characteristics(Gd1−xYx)2O3 Nanopowder Composition
x = 0x = 0.25x = 0.5x = 0.75x = 1
4F3/2(1)4I9/2(3)
band location, nm (±0.5)
911.7912.5913.1913.8914.5
4F3/2(1)4I9/2(4)
band location, nm (±0.5)
927.1928.2928.8929.1929.5
4F3/2(1)4I9/2(5)
band location, nm (±0.5)
943944945946947
Energy gap between
R1 and R2 sublevels, cm−1 (±5)
177183186190194
Lattice constant, Å (±0.015)10.81610.73310.70210.62510.607
Table 4. Comparison of Nd3+-doped powders as luminescent thermometers.
HostExcitation Wavelength, nmTransitions Used Temperature Range, °CSensitivity S, % °C−1Ref.
Gd2O3808R2 → Z2 to
R1 → Z2
10–700.18This work
Gd6Y4O15808R2 → Z2 to
R1 → Z2
10–700.19
GdYO3808R2 → Z2 to
R1 → Z2
10–700.22
GdY9O15808R2 → Z2 to
R1 → Z2
10–700.21
Y2O3808R2 → Z2 to
R1 → Z2
10–700.21
NaYF4830I863/I8700–1500.12[30]
NaYF4808R2 → Z1 to
R1 → Z1
20–450.11[31]
YAG808R2 → Z5 to
R1 → Z5
15–700.15[32]
YNbO4808R2 → Z2 to
R1 → Z2
30–2000.28[33]
LaF3808I885/I86530–750.26[34]
LaF3808I885/I86320–600.2[35]
YVO4808R1 → Z1 to
R2 → Z2
25–600.19[36]
KGd(WO4)2 808I895.8/I883.820–650.12[37]
LiLaP4O12808R2 → Z1 to
R1 → Z1
−190–200.31[38]
Gd2O35804F5/24I9/2 to
4F3/24I9/2
15–501.75[11]
Publisher’s Note: MDPI stays neutral with regard to jurisdictional claims in published maps and institutional affiliations.

