Abstract
Freeze foams are novel and innovative cellular structures that are based on a direct foaming process and that can be manufactured using any material that can be processed by powder technology. The foam formation process is characterized by the highly complex interaction of various process and material parameters that were chosen empirically and that have so far been difficult to reproduce. To allow properties to be specifically tailored towards certain applications, it is necessary to examine the phenomena observed during foam formation as well as the impact of the process and material parameters on the structural constitution to deduce guidelines for manufacturing and quality assessment (e.g., mechanical strength, cell and pore sizes, pore size distribution). The variety of possible applications are a result of the wide spectrum of initial suspensions and especially the foam structure properties derived from process parameters such as the cell geometry, pore size distribution, fraction of open and closed porosity, and the textures of the cell struts. Due to earlier findings, the focus of this paper focuses on adjusting and tailoring the macrostructure (homogenization of the pore sizes and their distribution inside foam cells) to create load- and application-adapted ceramic foams. To this end, an experiment was designed using previously identified pore and characteristic influencers (air and water content, temperature of the suspension, pressure reduction rate) as influencing parameters. Their interconnected impacts on selected target values were examined during the freeze foaming process using an in situ freeze foaming device inside an X-ray.
1. Introduction
In recent years, the use of ceramic foams has developed far beyond their applications as catalysts [1] and thermal insulators [2] and in waste water treatment [3] or metal filtration [4]. They are becoming increasingly important, especially in scaffolds for bone substitutes [5,6]. In addition to conventional implant materials such as titanium [7], ceramics such as tricalcium phosphates (TCP) or hydroxyapatite (HAp) are not only biocompatible but also show osteoinductive properties [8]. Furthermore, HAp exhibits similar chemical and structural properties to normal human bones [9]. Ceramic bone substitute structures are often made by dip coating processes in order to realize highly regular and porous structures [10]. During these processes, foams made of polyurethane (pore-forming templates) are dipped into a ceramic suspension and are subsequently dried and then heat-treated in order to burn out the polyurethane template, leaving behind the desired porosity [11]. So-called freeze foams are produced by a special direct foaming process and do not require such pore formers and still offer the possibility of producing biocompatible, porous foams [12]. The desired cell structure is first created by means of pressure-induced foaming and then freezing the resulting foam structure and subsequently freeze-drying directed at the freeze foam. The resulting freeze foams are characterized by a hierarchical porous structure exhibiting a macroporosity comprising foam cells in the range of 100 to 1000 µm and a microporosity comprising pores from sublimated ice crystals in the range of 5 to 100 µm. This particular and interconnected pore structure makes them promising candidates for a use as scaffolds for bone replacements [13]. In combination with a ceramic additive manufacturing process, complex biocompatible, hybrid freeze foam scaffolds with enhanced compressive strength have been certified for a use as a possible jaw bone replacement [14].
However, the pore formation during freeze foaming is influenced by a very complex interaction between process parameters (e.g., the pressure reduction rate and temperature) as well as the composition and properties of the suspension (viscosity, liquid content, solid content, additives). For the targeted and application-related design of such foams, it is necessary to investigate the pore-forming phenomena. In particular, the effects of the relevant process and material parameters on the properties of the resulting foam structure must be analyzed.
In previous work [15], the authors investigated the influence of the suspension composition on macro- and microstructure development, through which both pore hierarchies could be adjusted individually. However, that procedure also implies complex suspension preparation and testing. As one of the main results, a reproducible model suspension was developed that resulted in reproducibly porous freeze foams. Based on this developed model suspension, the aim of this study is targeted process control to tune and validate the macrostructure of freeze foams by concentrating on the wet (unbound) state. However, with conventional analysis, the structural and process-related changes during the formation of the foam structure cannot be examined.
X-ray-based methods for material diagnostics, for the damage and degradation analysis of foams [16], for example, have been significantly improved by in situ investigation. In [17], in situ X-ray-computed tomography was used to characterize the foam morphology created during the batch-to-glass conversion of a simulated nuclear waste glass. A 1 min scan with 38 μm voxels was performed to capture the foam structure during heating and to describe its evolution while undergoing growth and subsequent collapse. In another study at the experimental station EDDI (Energy Dispersive Diffraction) of the synchrotron BESSY II (Berlin, Germany), the foaming of aluminium alloy granules at 923 K was investigated in situ (25 tomograms/s) via X-ray tomoscopy [18].
The in situ investigation of the foaming process of ceramic foams with a systematic interaction between the suspension composition and process control has not been presented thus far. To examine the targeted process control for adjusting the macrostructure of freeze foams, a customized in situ system for CT investigations was developed in [19]. With this device, more precise and adjustable process control were possible in contrast to commercial freeze dryers. Based on a design of experiments (DoEs), the influence of the pore and influencing characteristics (air content, water content, suspension temperature and pressure reduction rate) is to be identified on selected target variables (porosity, pore size distribution, strut thickness) during the foaming process. These examinations are carried out with the specially developed in situ CT system. The aim of this investigation is to reproduce and validate foams with defined pore properties via the systematic interaction of the suspension composition and process control. This is intended to allow the manufacturing of tailored freeze foams to be used for applications that require specific pore morphologies (e.g., bone replacement materials).
2. Materials and Methods
2.1. Material—Model Suspension
The model suspension developed in [15] is the basis for the research in this contribution. For this model suspension, hydroxyapatite (HAp) (Merck KGaA, Darmstadt, Germany; BET = 70 m2/g, d50 = 2.64 m) was chosen as a bioceramic powder. To reduce its specific surface area and thereby improve its processability, the powder was calcined at 900 °C for 2 h. The measured BET surface was 6.7 m2/g. For suspension preparation, the calcined HAp powder was mixed with water, 4.6 wt.% dispersing agent DOLAPIX CE64 (Co. Zschimmer & Schwarz Mohsdorf GmbH & Co., KG, Burgstädt, Germany), and different contents of polyvinyl alcohol as a binder in a conventual vacuum speed mixer. To increase the energy input, 3 zirconia milling balls with 10 mm diameters were added. Mixing was conducted for 1 min at 2000 rpm. Afterwards, the milling balls were removed, and the suspension was cooled to room temperature, as it typically heats up to around 30–40 °C depending on the solid content. This was followed by the addition of the polyacrylate thickener TAFIGEL AP15 (Co. Münzing Chemie GmbH, Heilbronn, Germany) and the alkaline chemical 2-Amino-2-methylpropanol (AMP) and then being mixed twice for 1 min at 1500 rpm. By shifting the pH value of the suspension to 8–10, AMP swelling of the HASE (hydrophobically modified alkali swellable emulsion) thickener TAFIGEL AP15 was initiated. After mixing was completed, a part of the suspensions was degassed for 3 min inside the vacuum speed mixer at 1000 rpm and 300 mbar according to the conducted DoE. Details regarding the development of the model suspension are stated in [15].
2.2. Methods—DoE with Radiographical and Computed-Tomography (CT) Evaluation
The starting points for the tailoring of foam structures are the previously identified factors that influence the structure of the pores and the resulting properties. The air and water content, the temperature of the suspension, and the pressure reduction rate all exhibit a significant impact on the macroscopic and microscopic structure of the foam. Due to these complex dependencies, measuring and analyzing the effect and interdependencies of all of the influencing factors is paramount to creating favorable macro- and microstructural characteristics. For that purpose, a design of experiments was created to evaluate the impact on selected target values (macrostructure—28 µm and larger), resulting in the ability to predict the structural properties of completely foamed samples (green state). It was carried out using the software JMP PRO (version 16.0.0). The basis of the study was a randomized two-stage full factorial DoE using the four pore- and characteristic-influencing parameters: air content (A) in minutes of degassing, water content (W) in weight-%, suspension temperature (T) in °C, and the pressure reduction rate (P) in minutes from ambient pressure to 3 mbar (Figure 1). Each experiment was repeated once and the central point (C) was repeated three times, for a total of four measurements. The DoE, including all of the parameters, is shown in Table 1.
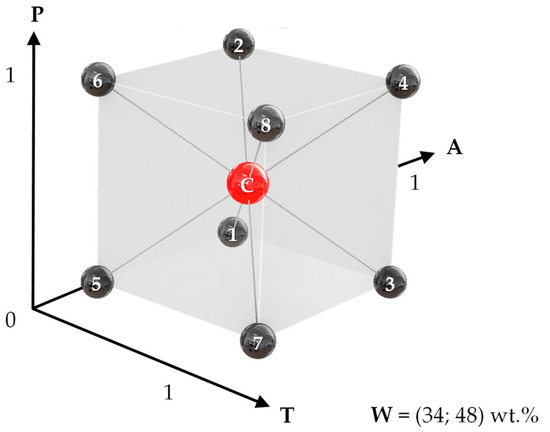
Figure 1.
Graphical representation of the DoE.

Table 1.
Full factorial DoE including all parameters.
Evaluation was partly carried out using the contrast method. To calculate the main and secondary effect, the mean values of stage +1 were subtracted from the mean values of stage −1. The difference represents the effect (e) caused when transitioning from the higher to the lower stage and vice versa. On the other hand, the contrast depicts a change in the mean value of all of the values. As all of the effects are calculated from the entirety of the samples, they all intersect with the same mean value. As a result, the value of the effect is twice that of the contrast [20].
The DoE was evaluated using 2D (radiographic imaging) and 3D (CT) X-ray scans. During earlier research activities, an in situ freeze foaming examination device (Figure 2) that can be placed inside a V|TOME|X L450 commercial tomography system and that allows for the freeze foaming process to be investigated during the process was developed [15,19]. In the first step, radiographic images of the suspension during foam formation are recorded and examined utilizing the X-ray radiographic rasterization method [19]. Using two-dimensional information, the positions of individual pixels are tracked, and the foam growth is correlated with the corresponding pressure via the process time (foaming process, porosity, pore size distribution, strut thickness). A subsequent CT analysis of the created foam structure is used to provide the necessary 3D data to assess the porosity and pore size distribution.
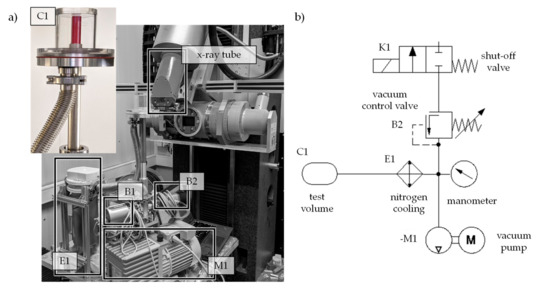
Figure 2.
Test setup: (a) installation in the in situ radiographical and computed tomography; (b) schematic diagram.
An acceleration voltage of 100 kV and a beam current of 300 µA were chosen as parameters for the 300 kV micro-focus X-ray tube. The GE DXR-300 FLAT-BED DETECTOR was set to the highest sensitivity setting and to an exposure time of 333 ms. The resulting CT scans have cubic voxels with an edge length of 28.18 µm. The complete test set-up and suspension preparation is described in detail in [15].
Porosity, pore size, and strut thickness distribution were determined using VGStudio 3.4. To minimize the influence of both the mold surface and its ground, a region of interest with the same basic shape (rectangular with rounded edges) but that was smaller in size was created by cutting around 0.5 mm from each of the four sides. For the porosity, the defect analysis module was used, and pore size as well as strut thickness distribution were determined using the foam and powder analysis modules. Both modules use an automatically defined surface as a starting point or threshold for the analysis. The grey value for surface determination was calculated as the average of the maxima of both the sample and the air peak on the histogram. For the defect analysis module, the least-involved algorithm (“Threshold only”) was used. To account for noise, only pores with a size of more than eight voxels were incorporated into the analysis. The parameters for the foam and powder analysis module were set to a threshold of 50% and to have a fast accuracy. The z-axis value of (001) was chosen as the primary analysis direction.
3. Results
3.1. Foaming
By analyzing the radiographic images, it is possible to determine the beginning and end of the foaming process.
- Beginning of the foaming process
As shown in Figure 3a,b, the water content (W), temperature (T), and pressure reduction rate (P) have no particular influence on the start of the foaming process (between 500–590 mbar). For A3 (air content—3 min degassed), strong variation in the starting point of growth can be observed in Figure 3c (e(A) = −178). Due to the prior degassing of the suspension, there is little to no air entrapment, resulting in delayed pore growth and coalescence effects until lower pressures are reached. Furthermore, this effect is amplified (e(T) = −105) at lower temperatures (T5) as the viscosity of the suspension increases. At A0, no influence of T is observed.
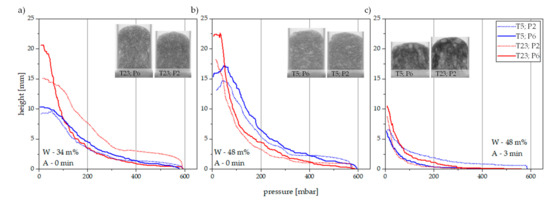
Figure 3.
Foaming as a function of decreasing pressure ((a)-W34A0, (b)-W48A0, (c)-W48A3).
- End of the foaming process
The A0 samples finished foam growth at around 30–60 mbar, with most exhibiting collapses of varying intensities afterwards (Figure 3a,b), irrespective of W, T, and P. Additionally, a lot of movement can be observed right before the growth stops. On the other hand, the foaming of A3/A1.5 samples ceases at around 5–20 mbar. They also remain stable and show no signs of collapsing (Figure 3c).
- Foam growth
The A3 samples exhibit the lowest growth of all of the samples. Foam creation in an air-containing suspension is dictated by the air content (main driving force) as well as the partial pressure of the water vapour. On the other hand, the foaming of degassed samples is solely reliant on the partial pressure of the water vapour: as the boiling temperature of water decreases during the reduction in the ambient pressure, the partial pressure of the water vapour increases accordingly, resulting in the expansion of the suspension.
A high water content and high temperatures supported the growth of the A0 samples significantly (Figure 3b, red line). A slower pressure reduction (P) also promoted foam growth. The T23 samples especially illustrate this difference between faster and slower pressure reductions (Figure 3a,b, red lines). A reduced pressure reduction (P6) results in slower pore growth, as shown by a lower slope in the growth curve. As a result, tensile forces in the foam struts are decreased, and the pores reach higher volumes before strut failure.
3.2. Porosity
An arrangement of all of the sample configurations and their corresponding porosities is shown in Figure 4. They are ordered by stage level, and the mean value of each stage is indicated by a horizontal line with the corresponding length. The levels were sorted by T, A, W, and, finally, P. As such, samples 1–8 represent T5, and samples 11–18 represent T23. C represents the four samples of the central point (see DoE Table 1). The minimum and maximum porosities of all of the stages differ by 47% percentage points. T and A are shown to have the highest influence on the porosity, with effects of e(T) = 17.1 and e(A) = 16.1, respectively. Furthermore, both A0 and T23 exhibit a significantly increased porosity compared to other samples in the same stage. An increased water content also favors foam growth as well as porosity (e(W)= 8.3). On the other hand, the impact of the pressure reduction rate (P) is relatively low (e(P)= 3.8). Overall, the highest porosity was measured for the configuration T23A0W48P6 (sample 18–59.7%), while the configuration T5A3W34P2 exhibited the lowest porosity (sample 1–12.5%).
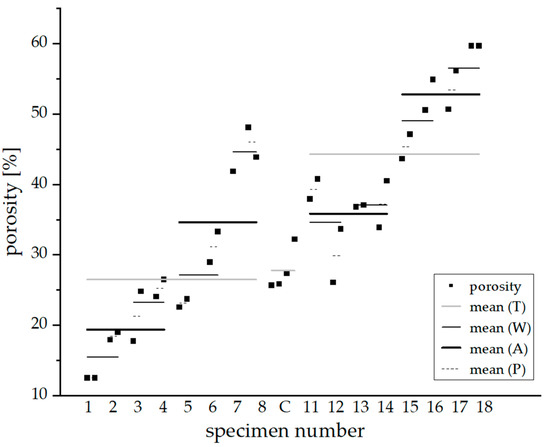
Figure 4.
Porosity of the samples of DoE.
Via a two-way-interactions analysis (Figure 5), it is possible to identify additional interdependencies between the four influencing parameters. Figure 5a shows the interaction with P, and Figure 5b shows the interaction with W. As a result, for T23 as well as for A3, a significantly decreased effect was observed for the pressure reduction rate (e(P*T) = 2.5 and e(P*A) = −3.6), resulting in almost overlapping points in Figure 5a. In conclusion, only T5 and A0 are considerably influenced by P. At the same time, P and W exhibit no significant interdependency (Figure 5a, right; almost parallel curves). On the other hand, the water content W (Figure 5b) shows a distinct influence on the porosity. It is possible to increase the porosity in both T23 and A3 by raising the water content. Nonetheless, the influence of W on the T5 and A0 samples was significantly stronger.
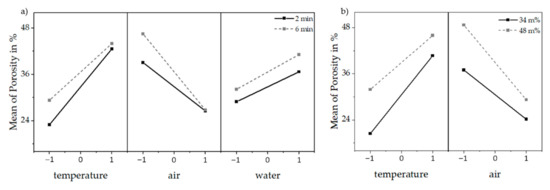
Figure 5.
Two-way interaction effects as a function of P (a) and W (b).
3.3. Pore Size Distribution
Foam cell analysis was performed using the software VGStudio 3.4 (Foam and Powder analysis module, VolumeGraphics). The volume model consisted of a voxel with an edge length of 28.18 µm. As noise is of considerable concern, pores with a volume of less than eight voxels in size were disregarded in the analysis. As a result, the smallest evaluated pores had a volume of around 179.000 µm3, corresponding to a sphere with a diameter of 69.93 µm. The pore size distributions were plotted logarithmically. Figure 6 depicts the plot for the A0 samples.
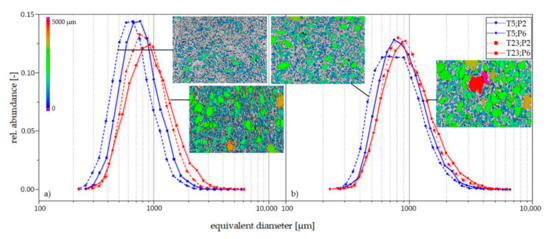
Figure 6.
Relative abundance of the equivalent diameter ((a)—W34; (b)—W48) for non-degassed samples (A0).
In general, the T5 samples exhibit smaller pore sizes, and the temperature together with the air content show the biggest impact on pore size distribution. While the mean variation in the pores in the W34 samples is small due to a higher number of smaller pores, the W48 samples have a smaller number of pores and therefore spread further (Figure 6a,b, respectively). When the foaming time is increased (P6), a small gain in the mean pore size is observed. As stated in Section 3.1, this increase in pore size is the result of slower pore growth, leading to reduced tensile loads in the struts, delaying their rupture until lower ambient pressures.
The samples made from degassed suspensions (A3) exhibited a large number of defects below the analysis threshold. Consequently, the smallest detected volumes were also the most numerous (Figure 7), accounting for 40–60% of all of the detected effects and resulting in significantly different pore size distributions for A0 and A3.
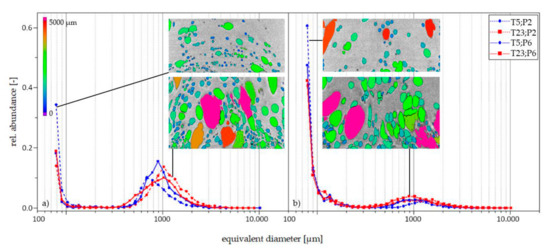
Figure 7.
Relative abundance of the equivalent diameter ((a)—W34; (b)—W48) for degassed samples (A3).
The latter also shows a significant peak in larger pores between 700 and 1050 µm of the equivalent diameter, making up around 20% of the identified pores. On the other hand, the highest relative abundance of A0 can be found in the range between 600–900 µm, with a value of 0.15. Air bubbles that were potentially trapped during the filling of the mold are able to expand to large, singular pores. As there is no other air in the degassed suspension, alternative sources of pores are scarce, preventing the occurrence of coalescence effects. Due to the high influence of the air content, P and W show no significant impact on the pore size distribution. Only a reduction in the suspension temperature (T5) prevents the formation of pores above 5000 µm.
3.4. Strut Thickness
The strut thickness distribution was also determined using the VGStudio 3.4 foam and powder analysis tool. Strut thicknesses are defined by the largest sphere that can be placed inside the surface. A and T as well as the interdependency of A*W had the highest impact on the measured strut thicknesses. The abundance distributions for the A0 (a) and A3 (b) samples depending on the water content are shown in Figure 8. The strut thickness is apparently strongly influenced by the amount of air in the suspension. In the samples of the A0 type, the cell pressure working against the struts during pressure reduction is composed of both the air expanding as well as an increase in the partial pressure of the water vapour. On the other hand, degassed samples do not contain additional air, and their only driving force for foam growth is their water content and the resulting water vapour’s partial pressure.
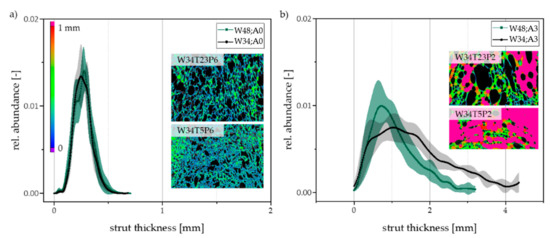
Figure 8.
Relative abundance of the strut thickness for not-degassed (a) and degassed samples (b).
Furthermore, the A0 samples show a more homogeneous distribution (0.05–0.6 mm). Additionally, the number of struts is significantly increased in the T5 samples (W34T5P6) when compared to the T23 samples (W34T23P6), with otherwise identical parameters. In samples of the A3 type, a change in water content led to a strong alteration in the distribution of the strut thicknesses. By reducing the water content from 48 to 34 percent, the range of the determined strut thicknesses increased significantly to 0.1–5 mm (Figure 8b).
The A3 samples show significantly lower interconnectivity with a high variation (10–86%). Sample W34T5P2A3 (Figure 8b) has the lowest interconnectivity of around 10% and a closed-pored structure, as evidenced by large, wide struts enclosing individual pores. On the other hand, the A0 samples exhibit interconnectivities between 92–99% and can therefore be regarded as having open-pored structures. The interconnectivity was estimated using the CT data. For this purpose, the largest connected pore was set in relation to the total pore volume.
4. Discussion
The conducted experiments and analysis show that the previously identified pore and characteristic influencers (A, T, W, and P) have a strong impact on the macroscopic structure of the foam constitution. Using a DoE, different interdependencies between selected target values (foaming process, porosity, pore size distribution, and strut thickness) were identified and quantified. Figure 9 shows the cell volumes of samples 1–9 (W48). The cell volumes are marked in colour according to size. The solid part is represented transparently.
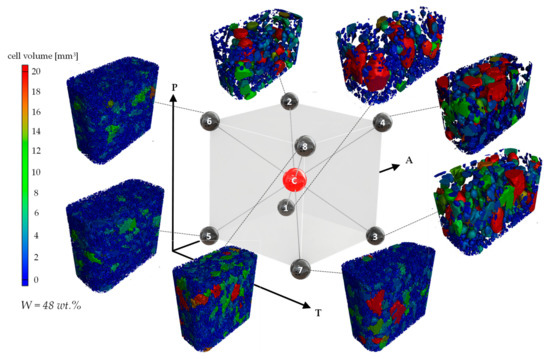
Figure 9.
Cell volume of samples 1–9 for W48 (no. 1–4 degassed, no. 5–9 non-degassed).
As a result, A and T were shown to have the strongest influence on all four target values. All of the A3 samples exhibited very low porosities as well as high strut thicknesses with a wide distribution. Due to the degassing of those samples, little to no air was found in the suspension, reducing the possibility of expansion during the foaming process. Consequently, coalescence and destabilizing effects as well as pore growth was delayed to lower pressures, and small, individual air bubbles developed into large pores with wide struts in between, as seen in the large transparent segments in Figure 9 (no. 1–4). On the other hand, the A0 samples were more susceptible to the remaining three characteristic influencers (Figure 9, no. 5–8).
Compared to the T5 samples, higher porosities as well as larger pore diameters (on average 100 µm larger) were identified in the T23 samples. As the viscosity in the T23 samples was lower than that in the T5 samples, pore growth was promoted significantly. At the same time, foaming results in a more inhomogeneous constitution, and destabilizing effects are also of importance.
The high influence of W and P on the target values was only be observed in the A3 samples. An increased water content enhances pore growth as well as increased porosity. The W48 samples also exhibited a significantly higher spread, but the number of pores was reduced. This behavior is caused by a lower viscosity of the suspension and less accompanying destabilizing effects. A reduction in the water content to around 25 wt.% could further decrease this effect and preserve smaller pores.
Reducing the pressure reduction rate (P6) results in a slight increase in the mean pore size. Our investigation has shown that the cell walls of the foam remain stable at lower pressures if foaming is slowed down. At the same time, foam-destabilizing effects such as coalescence and Ostwald ripening gain importance. As a result, the foam cells of the samples processed at the lower pressure reduction rate (P6) exhibited higher porosities in combination with a less homogeneous overall structure. Additional experiments at even higher pressure reduction rates (P1) should be conducted to evaluate the resulting foam structures and their homogeneity.
5. Conclusions
In this contribution, the pore formation mechanisms of the freeze foaming process were analyzed in-depth and replicated for the first time using in situ computed tomography. A quantifiable influence of the previously identified pore influencers (air and water content, temperature of the suspension, pressure reduction rate) on the freeze foaming process and the resulting foam structures was determined. The investigation clearly showed that the temperature and air content of the suspension have the greatest influence on the foaming process and thus the foam structure. The parameter configuration of W34T5P6A0 produced the most homogeneous structure within the DoE. Building on these research results, we were able to directly influence and tailor the morphological properties of the pores of freeze foams on a macroscopic level according to specific application needs.
Author Contributions
Conceptualization, J.M. and D.W.; methodology, J.M., D.W. and T.B.; validation, J.M.; formal analysis, J.M. and D.W.; investigation, J.M., D.W. and V.G.; writing—original draft preparation, J.M. and V.G.; writing—review and editing, J.M., D.W., V.G., T.B., M.A., A.M., M.G. and T.M.; visualization, J.M.; supervision, M.G., A.M., M.A. and T.M.; project administration, J.M. and D.W.; funding acquisition, T.M. and M.G. All authors have read and agreed to the published version of the manuscript.
Funding
This research was funded by the Deutsche Forschungsgemeinschaft (DFG, German Research Foundation)—grant number 310892168.
Institutional Review Board Statement
Not applicable.
Informed Consent Statement
Not applicable.
Data Availability Statement
Data are included in the article.
Acknowledgments
The authors would like to thank the Deutsche Forschungsgemeinschaft (DFG, German Research Foundation) for funding this project.
Conflicts of Interest
The authors declare no conflict of interest.
References
- Palma, V.; Ruocco, C.; Castaldo, F.; Ricca, A.; Boettge, D. Ethanol steam reforming over bimetallic coated ceramic foams: Effect of reactor configuration and catalytic support. Int. J. Hydrogen Energy 2015, 40, 12650–12662. [Google Scholar] [CrossRef]
- Luo, H.; Li, Y.; Xiang, R.; Li, S.; Luo, J.; Wang, H.; Li, X. Novel aluminum borate foams with controllable structures as exquisite high-temperature thermal insulators. J. Eur. Ceram. Soc. 2020, 40, 173–180. [Google Scholar] [CrossRef]
- Ahmad, S.; Latif, M.A.; Taib, H.; Ismail, A.F. Short Review: Ceramic Foam Fabrication Techniques for Wastewater Treatment Application. In Proceedings of the 2nd International Conference on Sustainable Materials (ICoSM 2013), Penang, Malaysia, 26–27 March 2013; Volume 795, pp. 5–8. [Google Scholar]
- Olson, R.A., III; Martins, L.C.B. Cellular Ceramics in Metal Filtration. Adv. Eng. Mater. 2005, 7, 187–192. [Google Scholar] [CrossRef]
- Juhasz, J.A.; Best, S.M. Bioactive ceramics: Processing, structures and properties. J. Mater. Sci. 2012, 47, 610–624. [Google Scholar] [CrossRef]
- Albulescu, R.; Popa, A.C.; Enciu, A.M.; Albulescu, L.; Dudau, M.; Popescu, I.D.; Mihai, S.; Codrici, E.; Pop, S.; Lupu, A.-R.; et al. Comprehensive in vitro testing of calcium phosphate-based bioceramics with orthopedic and dentistry applications. Materials 2019, 12, 3704. [Google Scholar] [CrossRef] [PubMed] [Green Version]
- Takemoto, M.; Fujibayashi, S.; Neo, M.; Suzuki, J.; Kokubo, T.; Nakamura, T. Mechanical properties and osteoconductivity of porous bioactive titanium. Biomaterials 2005, 26, 6014–6023. [Google Scholar] [CrossRef] [PubMed]
- Zwingenberger, S.; Nich, C.; Valladares, R.D.; Yao, Z.; Stiehler, M.; Goodman, S.B. Recommendations and considerations for the use of biologics in orthopedic surgery. BioDrugs 2012, 26, 245–256. [Google Scholar] [CrossRef] [PubMed]
- Beig, B.; Liaqat, U.; Niazi MF, K.; Douna, I.; Zahoor, M.; Niazi, M.B.K. Current challenges and innovative developments in hydroxyapatite-based coatings on metallic materials for bone implantation: A review. Coatings 2020, 10, 1249. [Google Scholar] [CrossRef]
- Rastogi, V.K.; Jiang, B.; Sturzenegger, P.N.; Gonzenbach, U.T.; Vetterli, M.; Blugan, G.; Kuebler, J. A processing route for dip-coating and characterization of multi-structured ceramic foam. Ceram. Int. 2019, 45, 21887–21893. [Google Scholar] [CrossRef]
- Karl, S.; Somers, A.V. Method of Making Porous Ceramic Articles. Google Patent US3090094A, 21 May 1963. [Google Scholar]
- Colonetti, V.; Sanches, M.; de Souza, V.; Fernandes, C.; Hotza, D.; Quadri, M. Cellular ceramics obtained by a combination of direct foaming of soybean oil emulsified alumina suspensions with gel consolidation using gelatin. Ceram. Int. 2018, 44, 2436–2445. [Google Scholar] [CrossRef]
- Ahlhelm, M.; Werner, D.; Maier, J.; Abel, J.; Behnisch, T.; Moritz, T.; Michaelis, A.; Gude, M. Evaluation of the pore morphology formation of the Freeze Foaming process by in situ computed tomography. J. Eur. Ceram. Soc. 2018, 38, 3369–3378. [Google Scholar] [CrossRef]
- Ahlhelm, M.; Latorre, S.H.; Mayr, H.O.; Storch, C.; Freytag, C.; Werner, D.; Schwarzer-Fischer, E.; Seidenstücker, M. Mechanically Stable β-TCP Structural Hybrid Scaffolds for Potential Bone Replacement. J. Compos. Sci. 2021, 5, 281. [Google Scholar] [CrossRef]
- Werner, D.; Maier, J.; Kaube, N.; Geske, V.; Behnisch, T.; Ahlhelm, M.; Moritz, T.; Michaelis, A.; Gude, M. Tailoring of hierarchical porous freeze foam structures. Materials 2022, 15, 836. [Google Scholar] [CrossRef] [PubMed]
- Ni, Y.; Liao, H.; Zhao, Q.; Wu, W.; Shi, Y.; Wu, S. Investigations of the failure behaviors of open-cell copper foam based on in-situ X-ray tomography compression experiments and image reconstructed finite element modeling. Eng. Fract. Mech. 2022, 263, 108323. [Google Scholar] [CrossRef]
- Luksic, S.A.; Pokorny, R.; George, J.; Hrma, P.; Varga, T.; Reno, L.R.; Buchko, A.C.; Kruger, A.A. In situ characterization of foam morphology during melting of simulated waste glass using x-ray computed tomography. Ceram. Int. 2020, 46, 17176–17185. [Google Scholar] [CrossRef]
- Kamm, P.H.; García-Moreno, F.; Neu, T.R.; Heim, K.; Mokso, R.; Banhart, J. Fast Synchrotron X-ray Tomography of Dynamic Processes in Liquid Aluminium Alloy Foam. Adv. Eng. Mater. 2017, 19, 1600550. [Google Scholar] [CrossRef]
- Maier, J.; Behnisch, T.; Geske, V.; Ahlhelm, M.; Werner, D.; Moritz, T.; Michaelis, A.; Gude, M. Investigation of the Foam Development Stages by Non-Destructive Testing Technology Using the Freeze Foaming Process. Materials 2018, 11, 2478. [Google Scholar] [CrossRef] [PubMed] [Green Version]
- Eriksson, L.; Johansson, E.; Kettaneh-Wold, N.; Wikström, C.; Wold, S. Design of Experiments: Principles and Applications; Umetrics AB, Umeå Learnways AB: Stockholm, Sweden, 2000. [Google Scholar]
Publisher’s Note: MDPI stays neutral with regard to jurisdictional claims in published maps and institutional affiliations. |
© 2022 by the authors. Licensee MDPI, Basel, Switzerland. This article is an open access article distributed under the terms and conditions of the Creative Commons Attribution (CC BY) license (https://creativecommons.org/licenses/by/4.0/).