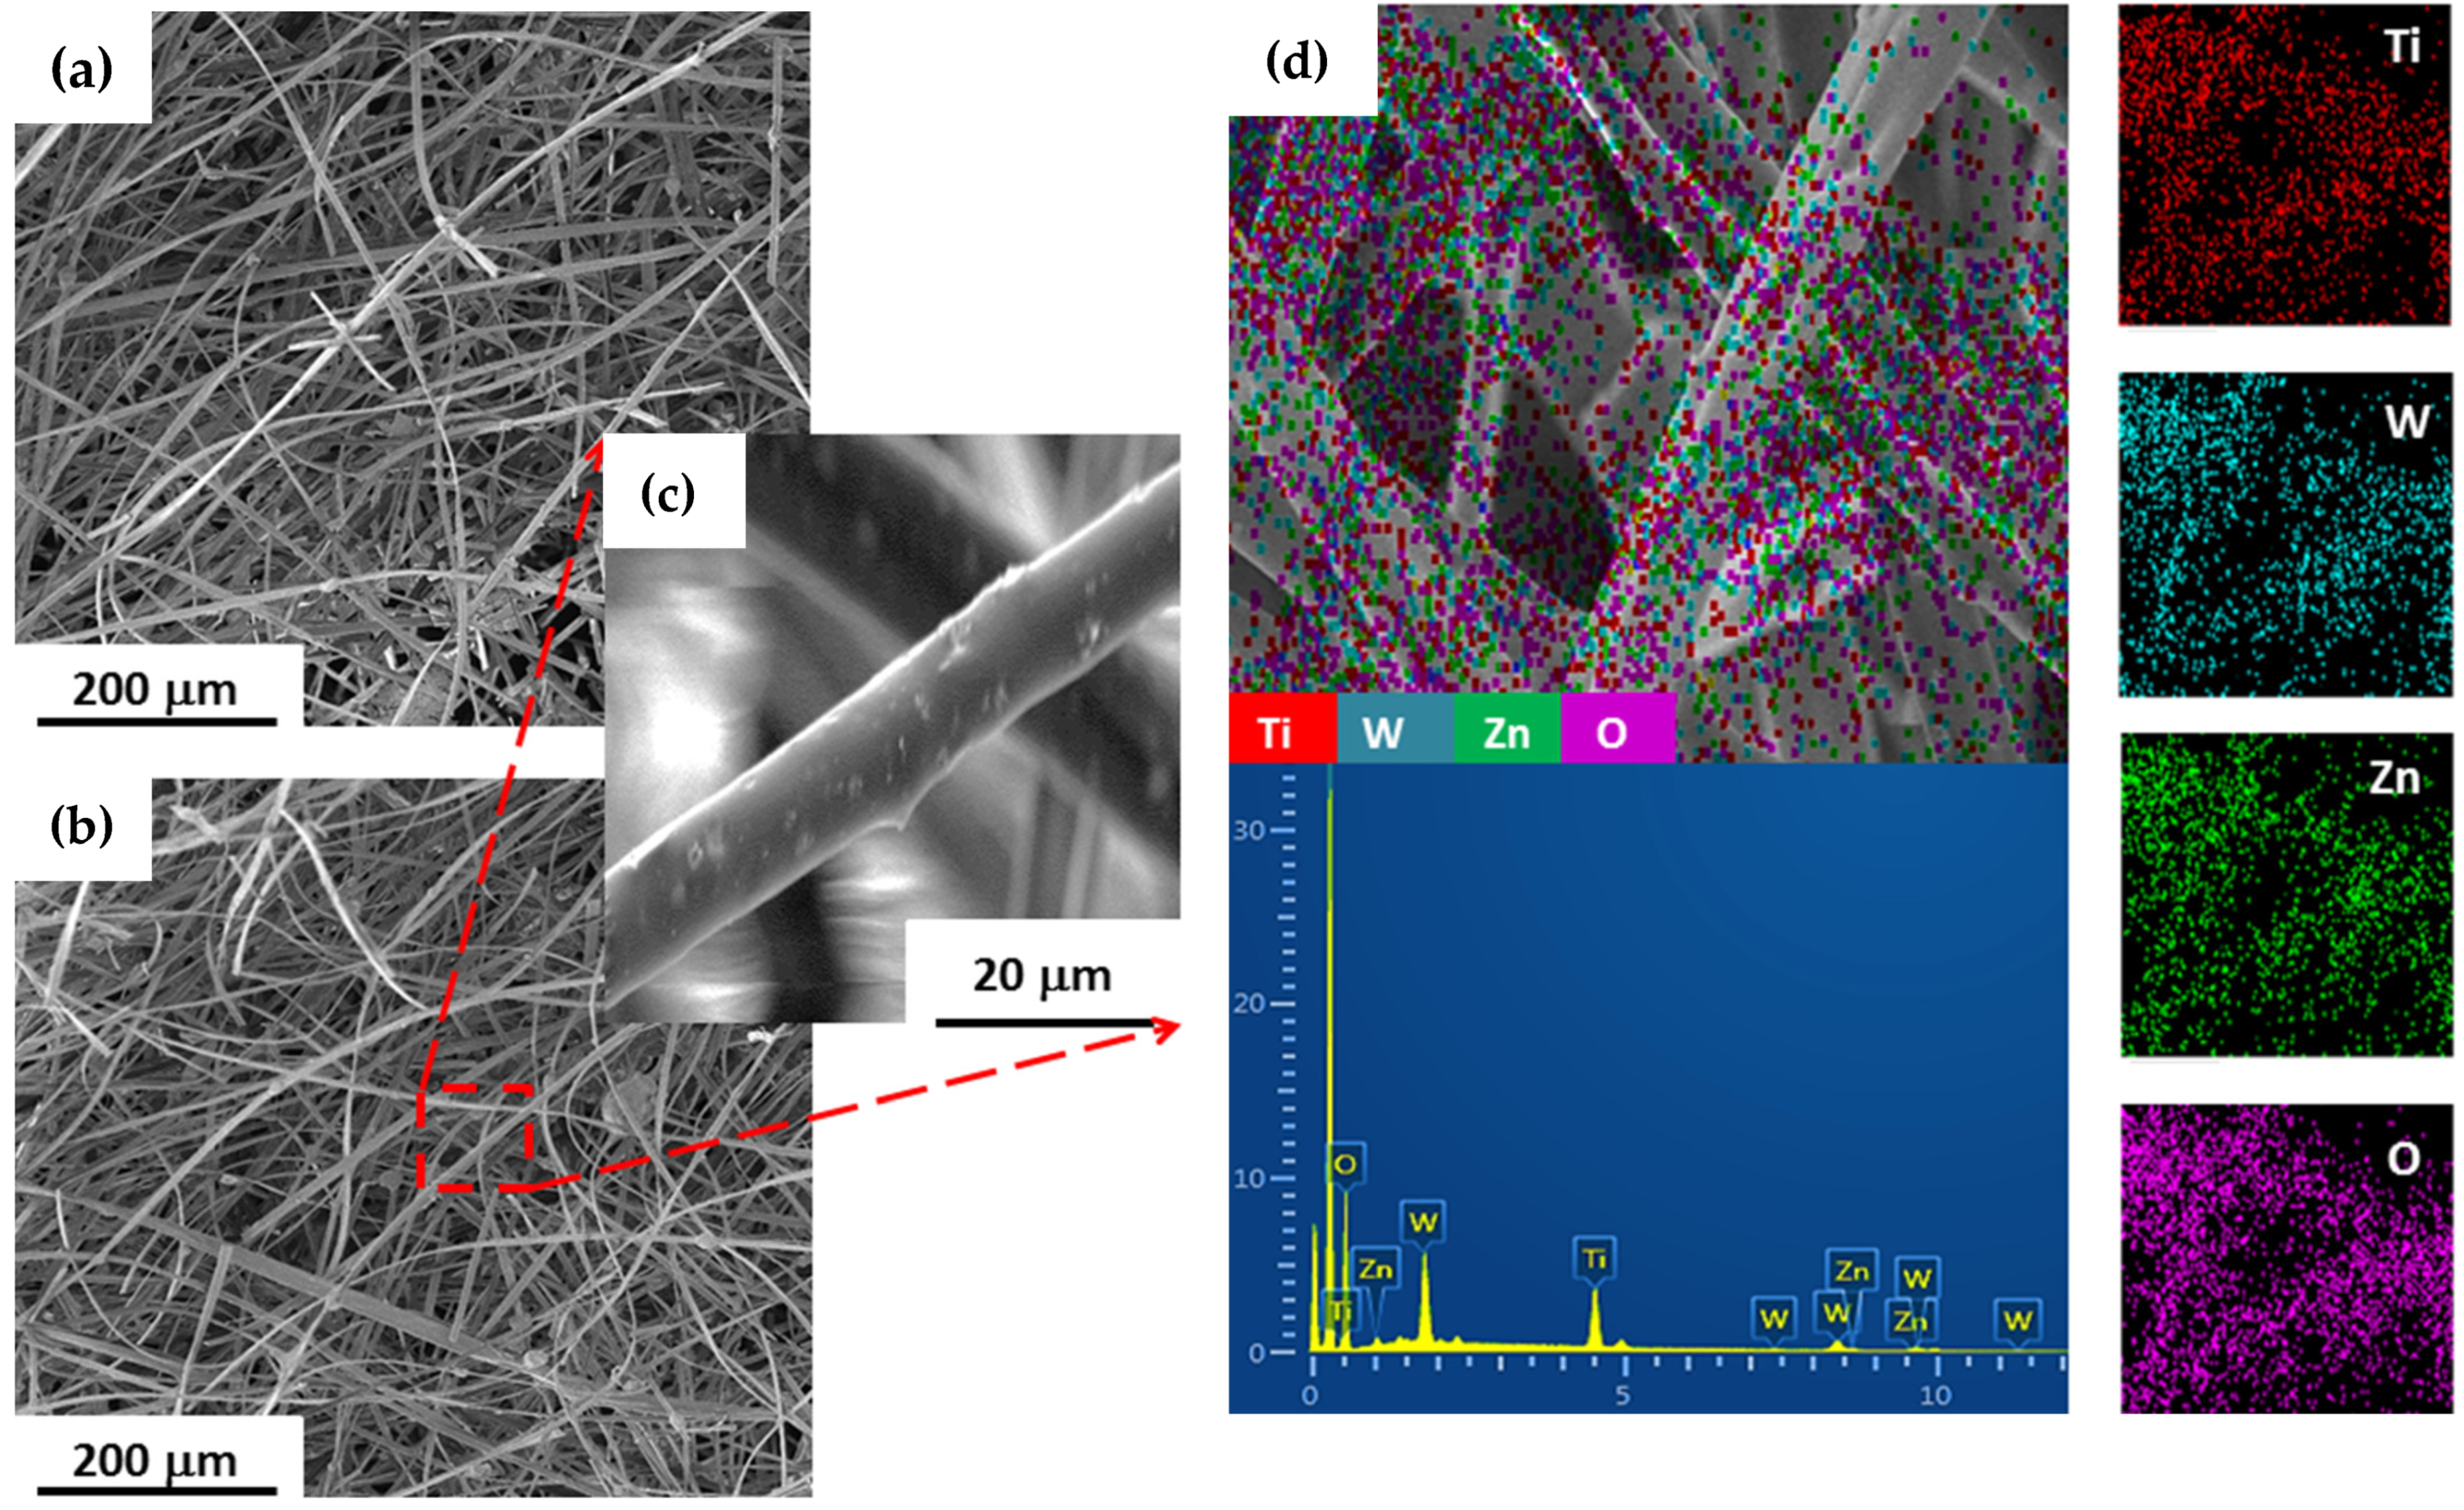
3.1. Microstructural Analysis
The SEM micrographs and EDS mappings of the
and
-loaded fibers are shown in
Figure 2. The surface morphology analysis returned regular diameter composite fibers with no apparent structural defects, indicating that the electrospinning process parameters were adequate for preparation of these materials (first step of sensors production).
The mean diameters of
,
and
fibers were estimated as
(
) [
11],
(
) and
(
), respectively. All
-loaded fiber configurations presented diameters with normal distribution. In addition, the hypothesis tests on the population mean difference, with unknown standard deviation, revealed that there is no statistically significant difference in the mean diameter of the composite fibers (
).
The EDS elemental composition and maps of the
models-loaded fibers confirmed that the
,
,
and
element populations are evenly distributed in the polymer matrix, as exemplified for the
sample (
Figure 2c). In addition, these combined analyses indicate that the moisture sensitivity of the nanocomposites is mainly influenced by the microstructure of the oxides and their interactions, since there is no significant variation in the volume fraction of nanoparticles in the produced polymeric matrices.
With electrospinning, particle aggregation is minimized and dispersion of the
combinations over the interdigitated electrodes is promoted. As a consequence, higher surface contact areas, and in turn, with higher sensitivity materials to RH are expected [
11]. In other words, electrospinning proves to be a simple and low-cost technique (when compared with other methods such as coating and sputtering [
18]) that can be viably used for the deposition of metal oxides on substrates.
Thus, it is possible to produce sensing materials with a high surface area to volume ratio, which directly leads to better RH sensitivity. The application of
as RH sensors involves the processes of chemisorption and physisorption of water molecules on the oxides surface. Additionally, the improved efficiency of these processes is also directly related with the larger porosity of sensing materials, as expected for the case of
produced by electrospinning [
11].
The surface morphology of the materials used for the electrical response tests to moisture, resulting from the sintering process at 500 °C, is shown in
Figure 3. After sintering, the obtained initial fibrous morphology is no longer present, however, based on the SEM images, the obtained nanostructures seem to present significant overall contact surface together with open porosity.
The EDS analyses of the sintered
confirmed the continuity of the uniform distribution of
:
metal matrix and of the zinc dopant, as shown for the
sample (
Figure 3c). The micrographs of
and
samples revealed a porous nanostructure, with spherical particles in the order of 100–250 nm, and free of polymeric phase. These features are known to favor the application of these structures for RH sensing, as discussed earlier. The mean sample diameters were calculated to be
[
11],
and
, for
,
and
systems, respectively.
The hypothesis tests’ analyses for the difference in mean particle diameter showed that there were no significant differences in particle size among the all produced sintered (, for all mean comparisons). This proves that the best results for the sensitivity of these systems to RH are predominantly related to the atomic and surface interaction levels between the constituent oxides of the nanocomposites. It is important to, once more, point out that all morphological characteristics discussed here (such as nanometric size, spherical shape, porosity and regular distribution) are fundamental for RH sensing, since they favor the adsorption processes of water vapor from the environment, on the oxides surface and the porous structure.
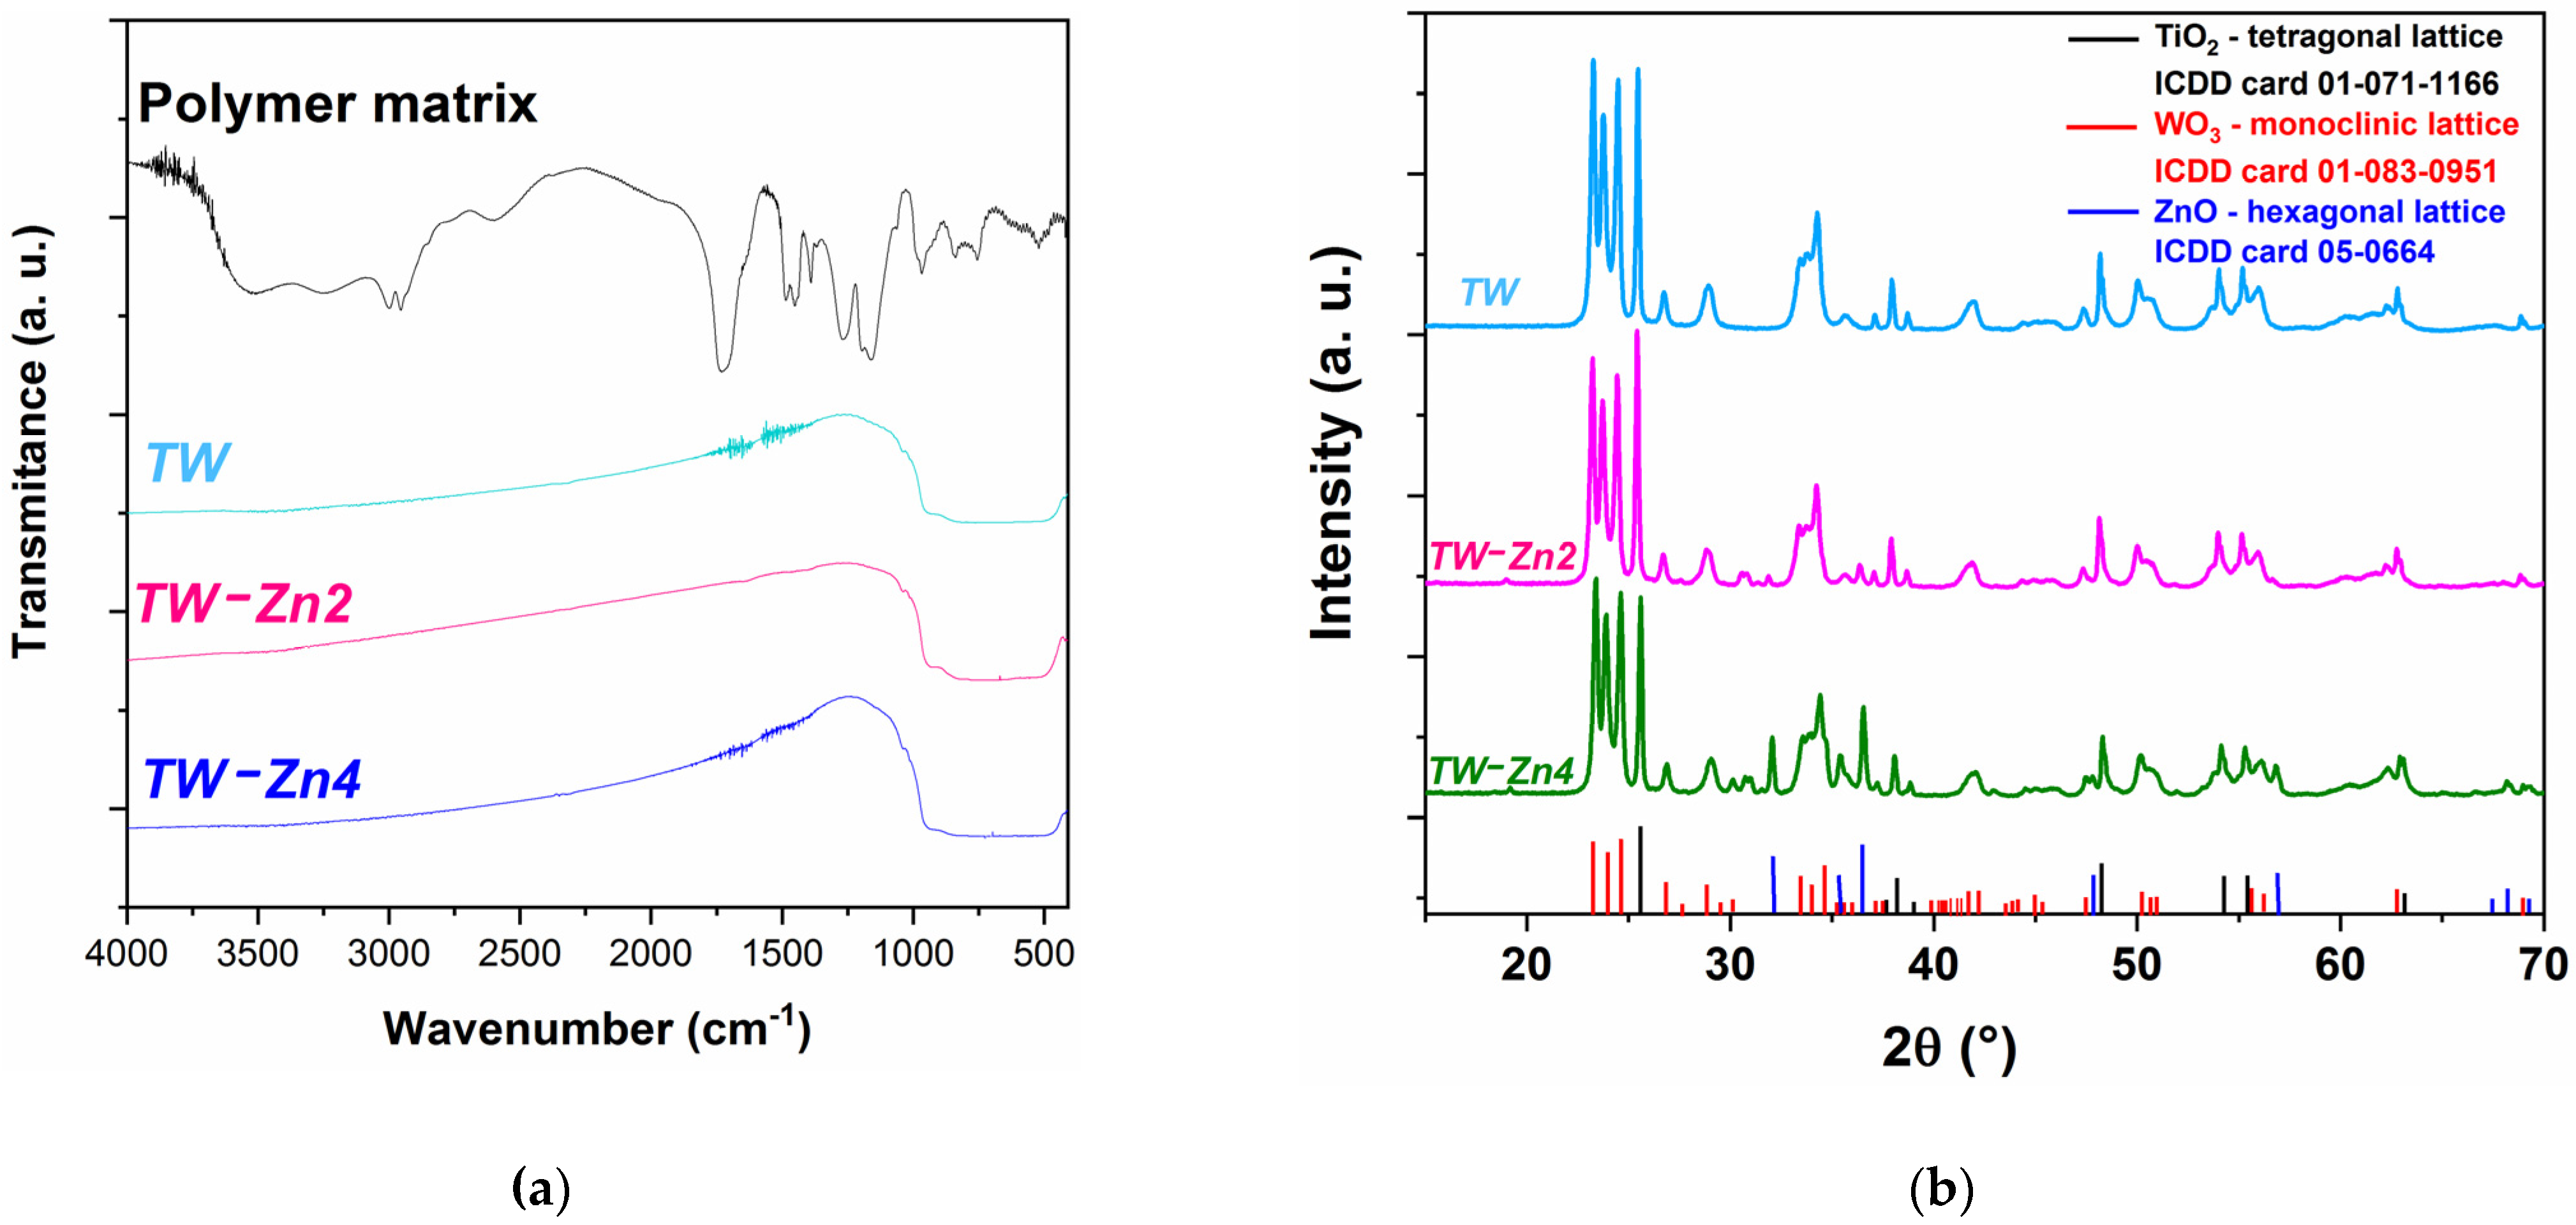
The FTIR spectra of the polymer matrix and sintered samples are shown in
Figure 4a. For all three
samples, it is possible to observe a broad transmission band in the
wavenumber range, due to the superposition of bands belonging to the different metal oxides present in the structures. In addition, the characteristic bands of the polymer matrix in the range of
to
(including the broad band around 3380
due to the adsorbed water molecules by the polymer) [
19], are not observed in the
spectra, proving that the sensor materials are free from the organic phase, as suggested by the results obtained by SEM.
The X-ray diffractograms of the
,
, and
are presented in
Figure 4b. The characteristic crystallographic planes of the anatase
with tetragonal structure (
and
lattice constants [
20]) and monoclinic
(
7.306
,
and
[
21]) were confirmed in the experimental data of the three composite systems, from 01-071-1166 and 01-083-0951 ICDD cards, respectively. The results show that the electrospinning and sintering processes at 500 °C causes no phase change or solid solution formation from these oxides in the tested
[
1,
22].
In all three samples, the experimental values of
unit cell parameters (
, b = 7.54 Å,
,
and
) showed no significant changes, related to pristine oxide. The lattice parameters for
in the
sample were calculated to be
and
,
[
11], in accordance with the data of the starting material. In addition, it is possible to verify in
Table 1 the dependence of
parameters on
concentrations in the
and
samples. A decrease in the values of
and
parameters, and an increase in the value of
, from the undoped material to the doped material with
of zinc, can be noticed, due to a variation in the volume of the
unit cell. The
sample, on the other hand, does not present significant changes in the values of these parameters (no change in the cell volume), compared to the
sample, indicating that part of the zinc concentration remains on the surface material after the interaction saturation between zinc and titanium ions at the atomic level.
In fact, there is the occurrence of zinc ion doping in the atomic structure of titanium: the ionic radius of
ions (0.74 Å [
23]) is close to that of
ions, promoting the occupation of vacancies of the
atom sites by
elements, after the sintering process.
The crystallite average size (
) of the anatase
(
Table 1) and monoclinic
in the investigated
,
and
nanocomposites was determined by the modified Scherrer equation (MSE),
[
24], where 1/3 is the correction value of the shape factor
in Scherrer Equation [
25]; λ is the X-ray radiation wavelength; β and θ are the full width half maxima and the half of the diffraction angle (2θ) at the crystal planes detected in the XRD spectrum, respectively.
The average size () of the crystallites was estimated to be 15.01 ) nm, 15.32 nm and 15.95 nm for , , and samples, respectively. For , D values were calculated to be 19.12 nm, 24.27 nm, and 23.75 nm, with increasing zinc concentration.
The equality of means test (with sample size n = 3 and level of significance α = 0.05) showed that the crystallite average sizes present no significant differences in the three tested systems. On the other hand, average size values calculated for the and compositions are significantly higher than that observed for the model. The D values in and samples did not show significant difference. These results corroborate the previously reported effects of dopant and indicate that at promotes saturation of the atomic interactions, which increases the presence of surface interactions between the oxides. This behavior is confirmed by the emergence of peaks with a hexagonal crystal structure (from the plane at , and according to the supplier) in the diffractograms of doped samples.
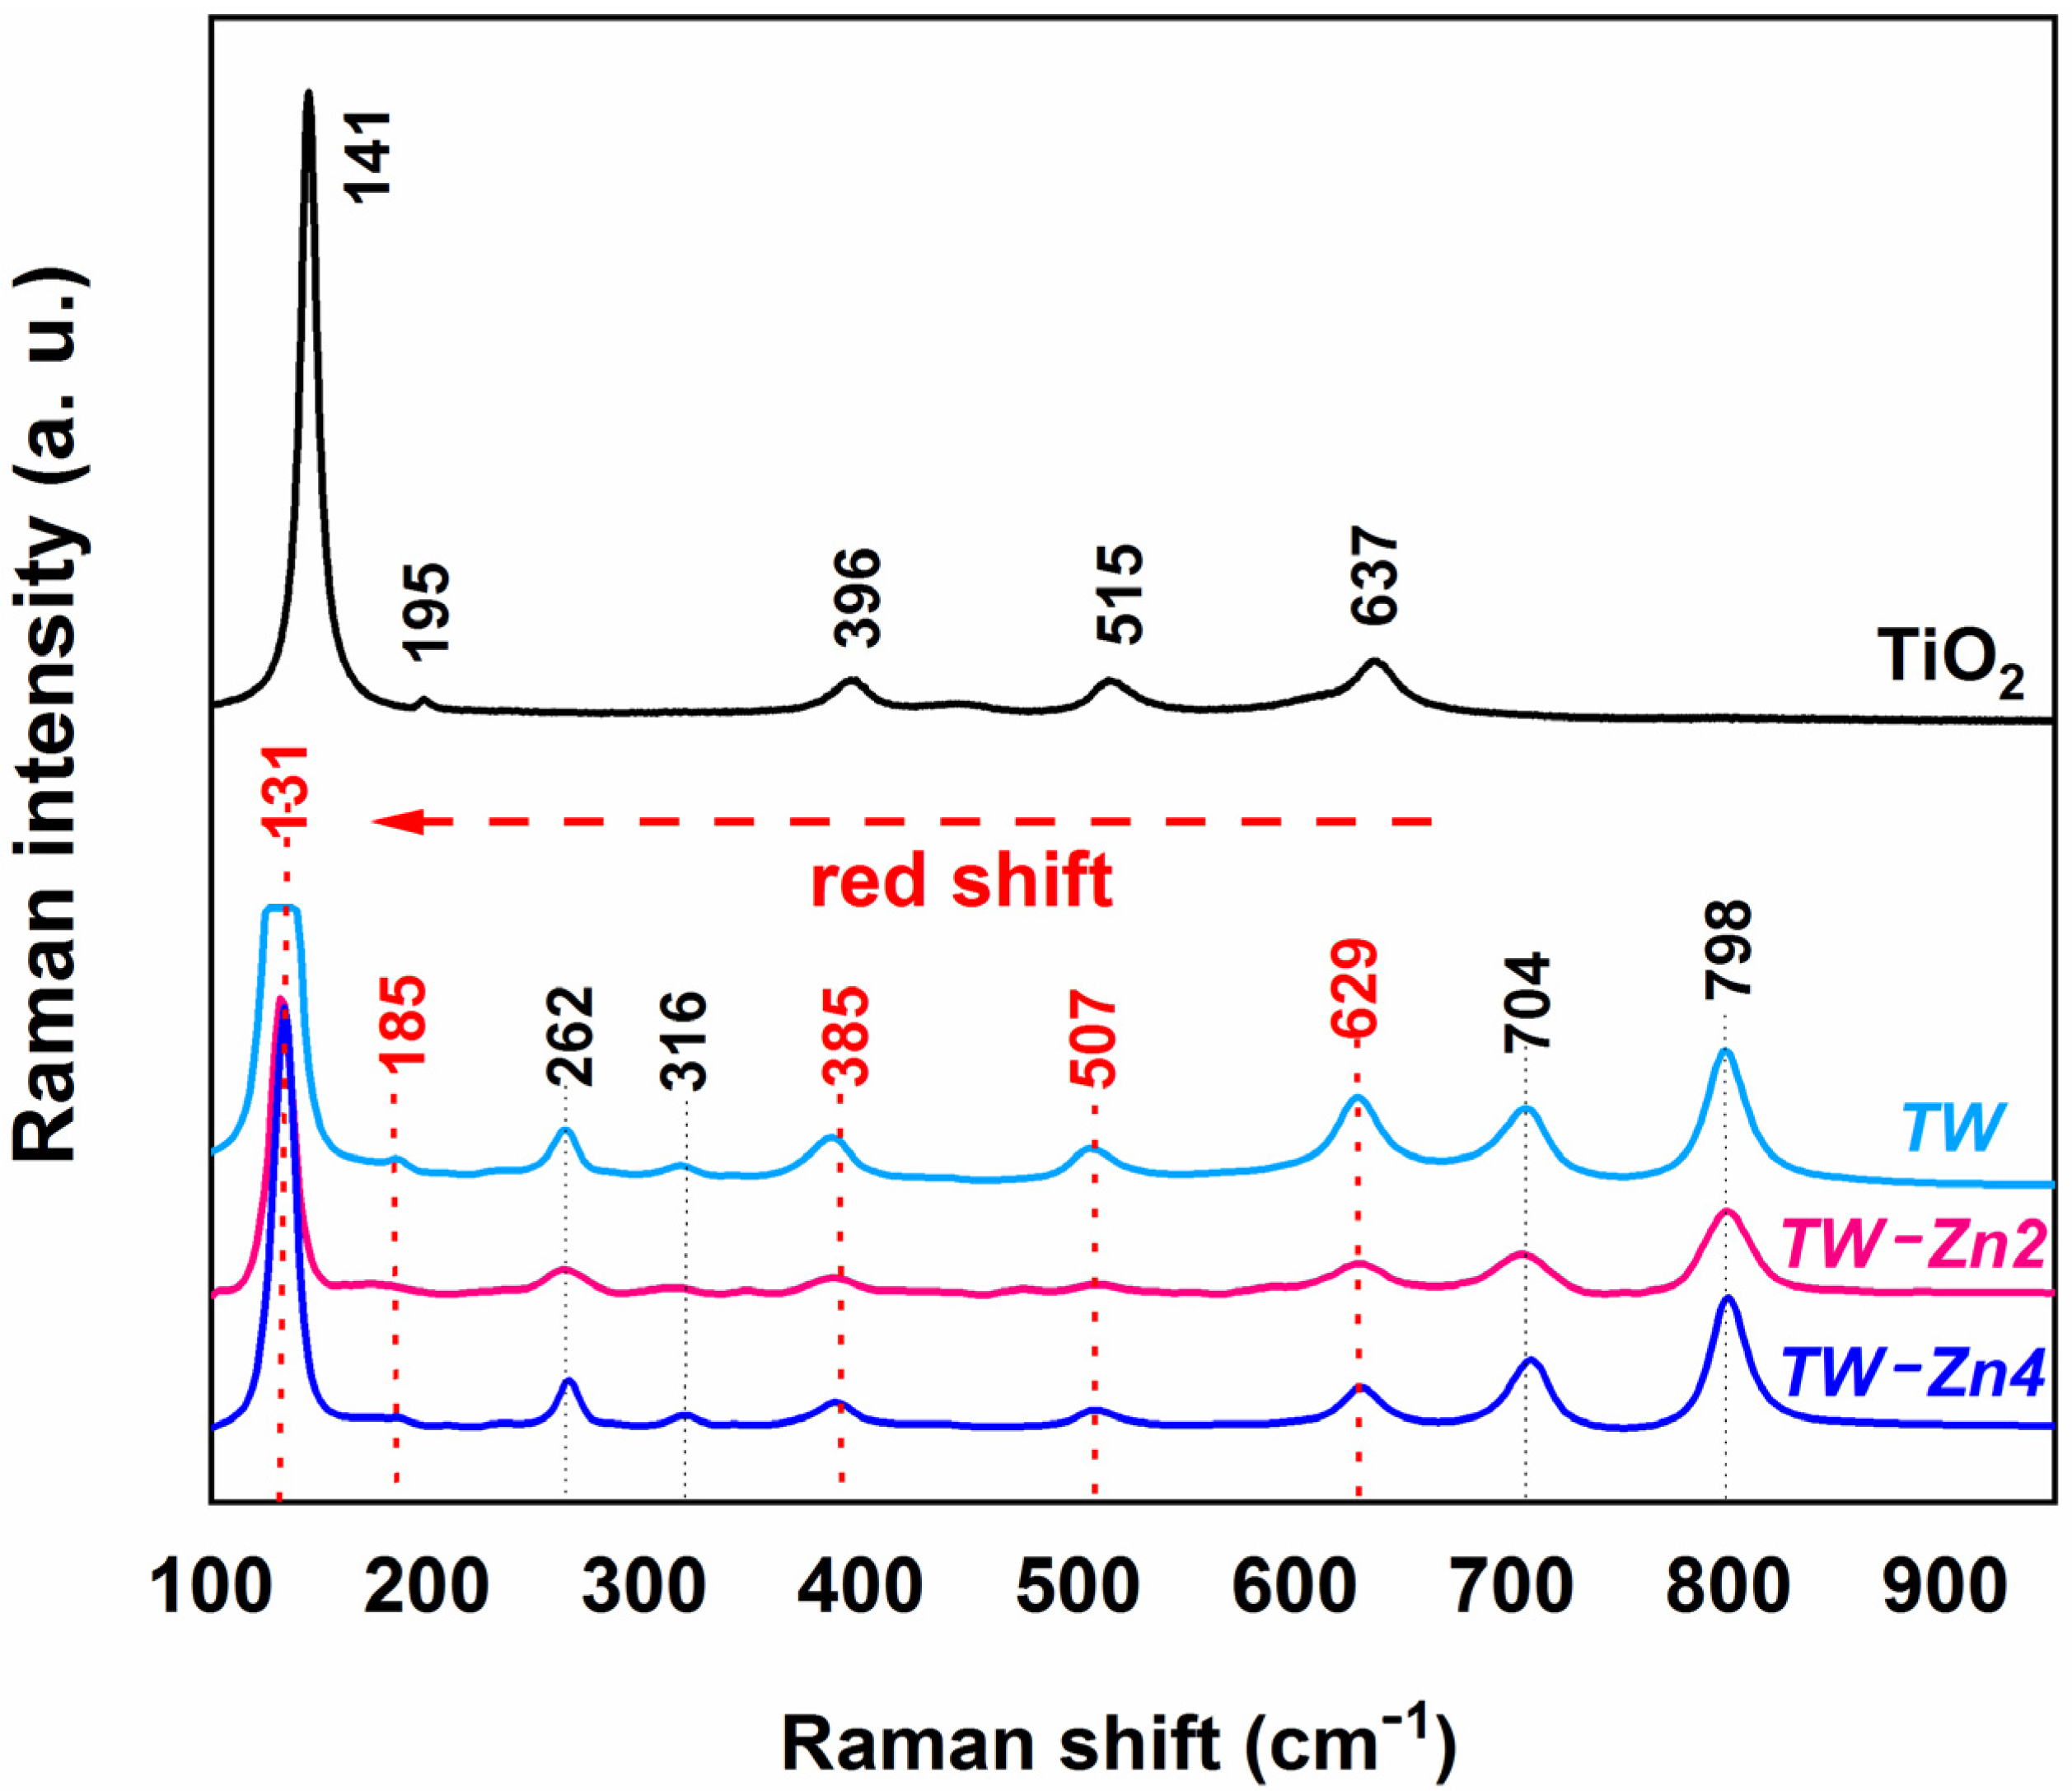
The Raman spectra of the sintered
are presented in
Figure 5. The spectrum of pristine anatase
sintered at
was also analyzed for comparison with the
spectra. The characteristic molecular vibration bands of the anatase phase were observed at
,
,
,
and
wavenumbers [
26].
These bands were also found in the
and
samples with
and
of Zinc, but shifted to lower wavenumber regions (about
shift) of the spectrum (red shift). In addition, the spectral analysis of undoped and Zn-doped samples proved the continuity of the
monoclinic structure after sintering at
, with characteristic vibration bands at 262, 316, 704, and 798
wavenumbers, as described in the literature [
27,
28].
The red shift phenomenon of
vibrational bands is attributed to distortions and confinement of phonons in its crystalline lattice, promoted by the introduction of impurities in the atomic structure of the material [
29]. In fact, the combined analysis of the XRD and Raman results confirmed that
ions occupied the available sites of
atoms in the anatase crystal lattice.
3.2. Electrical Response
The electrical response of to RH variations was investigated by electrical impedance spectroscopy. The electrical response to moisture depends on the moisture concentration and is the consequence of chemisorption and physisorption of water molecules along the surface, and on the porous structure of these nanostructures.
For low moisture concentrations, only chemisorption takes place; this occurs when the first layer of water molecules that will cover the oxides surface and porous structure gets formed. This layer, which is strongly bonded to the oxides, covers entirely the contact surface (including the open porous surface) of the materials at around 30 to 40% RH concentration. At this point, oxygen from the humidified air at room temperature is typically adsorbed in the form of
,
,
and
ions. As RH concentration keeps increasing, a first physiosorbed layer forms on top of the chemisorbed one: with continuous increment of moisture concentration, subsequent physiosorbed layers form one after the other. However, all physiosorbed layers are unstable and can be easily removed by increasing the temperature or by decreasing RH [
7,
30]. At this stage,
ions with a high quantity of
protons, get formed and start participating as charge carriers, a process known as Grotthuss mechanism [
31]. Once the hydronium chemical bonds are instable,
protons hopping to the nearest water molecule takes place; consequently,
molecules get ionized and form
ions, which perpetuate the charge transportation, unless, the material is heated or the RH concentration is reduced.
As the amount of water molecules begins to get saturated over the materials surface, they start to condense in the existing pore structure, within the bulk of the sensor material. When the pores in the mesoporous region (pores around 10–100 nm) get totally filled with water, new carrier paths are established for ions migration.
The measured impedance spectra highlight the different phenomena of electrical conduction and polarization that occur in these materials in the presence of water molecules, making the use of electrical impedance spectroscopy a very powerful technique in the evaluation of the materials future use in sensing devices.
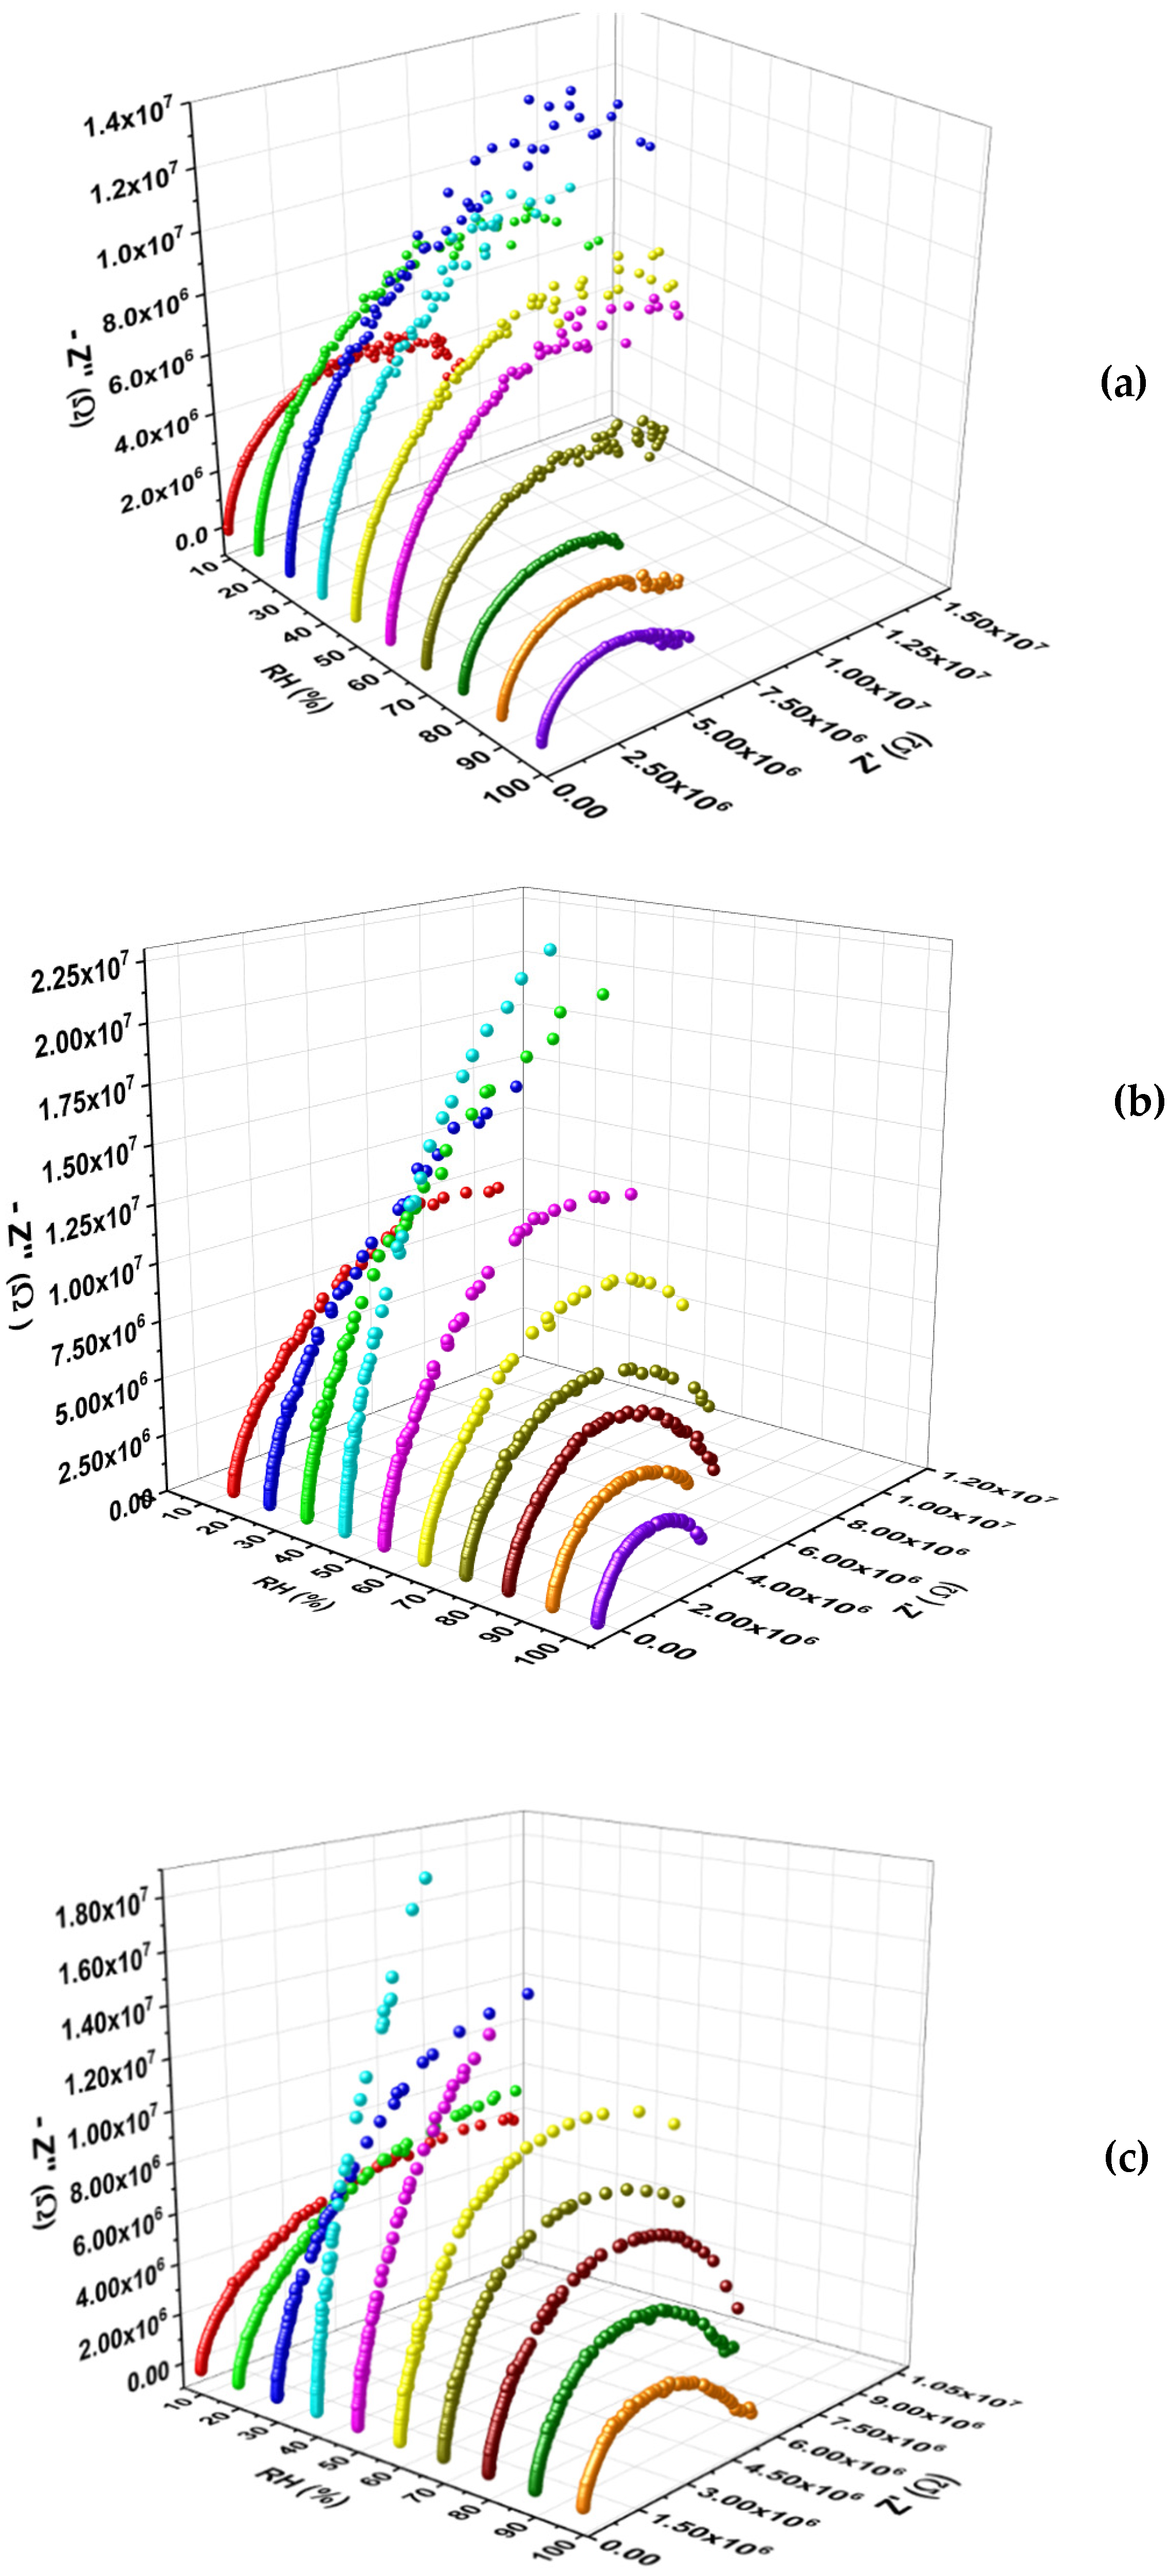
In
Figure 6 are plotted the Nyquist plots of
,
, and
, in the full range of relative humidity (10–100% RH).
With the increase in RH concentration, a maximum value in impedance is observed for all tested samples. From
Figure 6 this characteristic is perceived in the Nyquist plots (imaginary
versus real parts of the impedance,
) for all samples. This type of behavior is a typical of a p-to n-type conduction transition in materials [
32,
33,
34,
35].
Although this phenomenon has already been reported in gas sensing metal oxide based devices, the mechanism that governs this transition has not been widely described in the literature. For RH sensing with high surface area
(produced by the suggested preparation route), at low RH regime, the oxygen ions from ambient air and moisture molecules act as different agents when adsorbed on the material surface, with direct influence on the conduction properties. Herein, at low RH concentrations, oxygen from the humidified air at room temperature (in the form of
,
,
and
ions) are preferentially adsorbed on the surface of
films, by capturing electrons from the conduction band [
35].
This process results in the formation of an electron depletion layer [
32,
35], which causes the decrease in the density of free electrons and their entrapment by holes in the valence band. Consequently, the impedance of the material increases due to the removal of charge carriers from the conduction band. With the beginning of exposure to moisture, the surface of the material also begins to adsorb oxygen from the water molecules, but at a much lower rate than that of ambient oxygen, which does not favor their interaction. At this point, it is suggested that there are no significant surface active sites available for H
2O gas adsorption. Thus, the increase in system resistance is attributed to the occupying of negatively charged surface of oxygen from the air instead of moisture ions. With increasing RH, moisture adsorption tends to occur primarily by replacing the initially adsorbed oxygen ions.
When the is exposed to increasing RH concentrations in a low range (up to 40% of RH), the water vapor ions will progressively substitute the oxygen from the air and promote the distribution of surface adsorbed active sites. At this stage, the distance between ions from both oxygen sources will become smaller, with a consequent increase in the chemical interaction between them on the materials surface.
At this stage, water adsorption can be favoured if the sensing materials possess high surface area to volume ratio. It is know that adsorption of water vapour on the materials surface is promoted by a higher contact surface area, due to its porous nature, which affects the electrical conduction; this change encompasses the resistance, capacitance or electrolytic conduction depending on the sensor type [
36].
Adsorption of ions from moisture becomes dominant above 30–40% RH in the tested , allowing the electrons to return to the conduction band and thus defining the transition from p- to n-type conduction in these materials.
In fact, when is known to adsorb a large amount of oxygen from the environment at a low RH range, a significant water vapor concentration is required so that the expected usual n-type conduction process can be established (as noted for pristine anatase titanium dioxide). In sequence, when RH concentration keeps raising above , the Grotthuss chain reaction dominates and ion hopping becomes the main conduction process.
As a consequence, electrons continue to be released to the conduction band, and consequently the sensors conductance increases (n-type behavior). In general, the equilibrium between these reactions defines the dominant behavior of sensing mechanism at the level of electronic bands.
The impedance of these systems continues to decrease progressively with the continuous increase of the moisture concentration, with the formation of the first and following physiosorbed layers, mainly due to transport and electrical polarization mechanisms, especially the hopping conduction of protons described earlier.
As already seen in a previous work by the authors [
11], the production of
sensing films by electrospinning may allow the obtention of nanostructured systems with high surface area to volume ratio. On close inspection of the micrographs, that seems to be the case, by a regular distribution of small spherical grains with low agglomeration, contributing to a higher contact surface area. Nevertheless, the larger presence of agglomerates in samples with higher zinc content is most likely the key factor that determines their lower sensitivity, when compared to samples with
content. This further confirms the validity of electrospinning as an efficient and low-cost fabrication process compared to other approaches, such as vapor deposition, or sputtering techniques, among others.
By looking again to the Nyquist plots for all
nanostructures, the presence of compressed semicircles indicates that conduction in these materials is dominated by relaxation processes at the surface of grains and through grain boundaries [
37]. Diffusion processes are present, at least at the interface between the measuring electrodes and the material and inside the pores that get filled with water vapour. However, their diffusion contributions are clearly small with respect to the overall measured impedance of the sensors, and in comparison to the remaining conduction contributions present [
12,
38]. Despite the SEM images showing that the samples are highly porous, there is low evidence for the existence of a significant amount of pores in the mesoporous region (pore size ranging from units to tens of nm). This behavior is directly associated with the arrangement of nanoparticles as films on the electrodes instead of the use of volumetric pellets, in which the impedance variation has a significant influence of micro/nanopores presence [
12,
38]. As an example, TiO
2/WO
3 pellets (with 100/36 Titanium/tungsten atoms proportion and sintered at 600 °C) showed a typical n-type conduction behavior in the range of 0 to 100% RH, with strong influence of diffusion processes and, consequently, an impedance variation around 2 order of magnitude [
38].
The TiO
2:WO
3 volumetric systems (1:1 in mol) have been also doped with 7 wt% of ZnO [
12]. The results showed that the doped samples electrically respond to RH (with a n-type conduction) but with a smaller impedance variation (close to 1 order of magnitude) [
12]. The transition from p- to n-type conduction has also been reported in the TiO
2:WO
3 pelletized system (1:1 in mol), induced by vanadium ions doping [
27]. The dopant introduction improved the stability of the anatase phase and considerably increased the sensitivity of the final material (relative to the initial binary mixture).
Electrospun TiO
2:WO
3 models [
11] were also tested as moisture sensors, with the same binary mixture proportion as that used in other previous works [
12,
27] and sintered at 500 °C. The p- to n-type transition was observed and related to the change in the preparation route of the sensors by electrospinning. These systems showed excellent sensitivity to RH variations (around 1 order of magnitude) compared to pelletized samples, but using a much smaller amount of sensor material.
This configuration promotes the use of a small amount of sensor material (2.24 ± 0.21 mg (n = 3), 2.18 ± 0.33 mg (n = 3) and 2.20 ± 0.29 mg (n = 3), from 0 to 4 wt% ZnO, respectively). The mass is invariant from one sample to another, with uniform distribution of the material over the electrode area. This is a result of the proper control of the electrospinning process parameters, the use of electrospinning as part of the material preparation and the sintering process. Thus, the errors related to the impedance measurements of the samples allocated in the humidity chamber (with ambient RH stabilized before each measurement), given a composition, are shown negligible and the best sensitivity results can be discussed based on the material properties.
On the other hand, in this work, the sensitivity of the produced films was increased in relation to that detected in the volumetric and electrospun TiO
2:WO
3 models [
11,
38]. The obtained impedance variations greater than 1 order of magnitude are an indication that the transport and electrical polarization mechanisms, especially the hopping conduction of protons, were considerably improved by: (i) the Zn ions doping and; (ii) high surface area to volume ratio of
promoted by the preparing alternative method of the sensor materials.
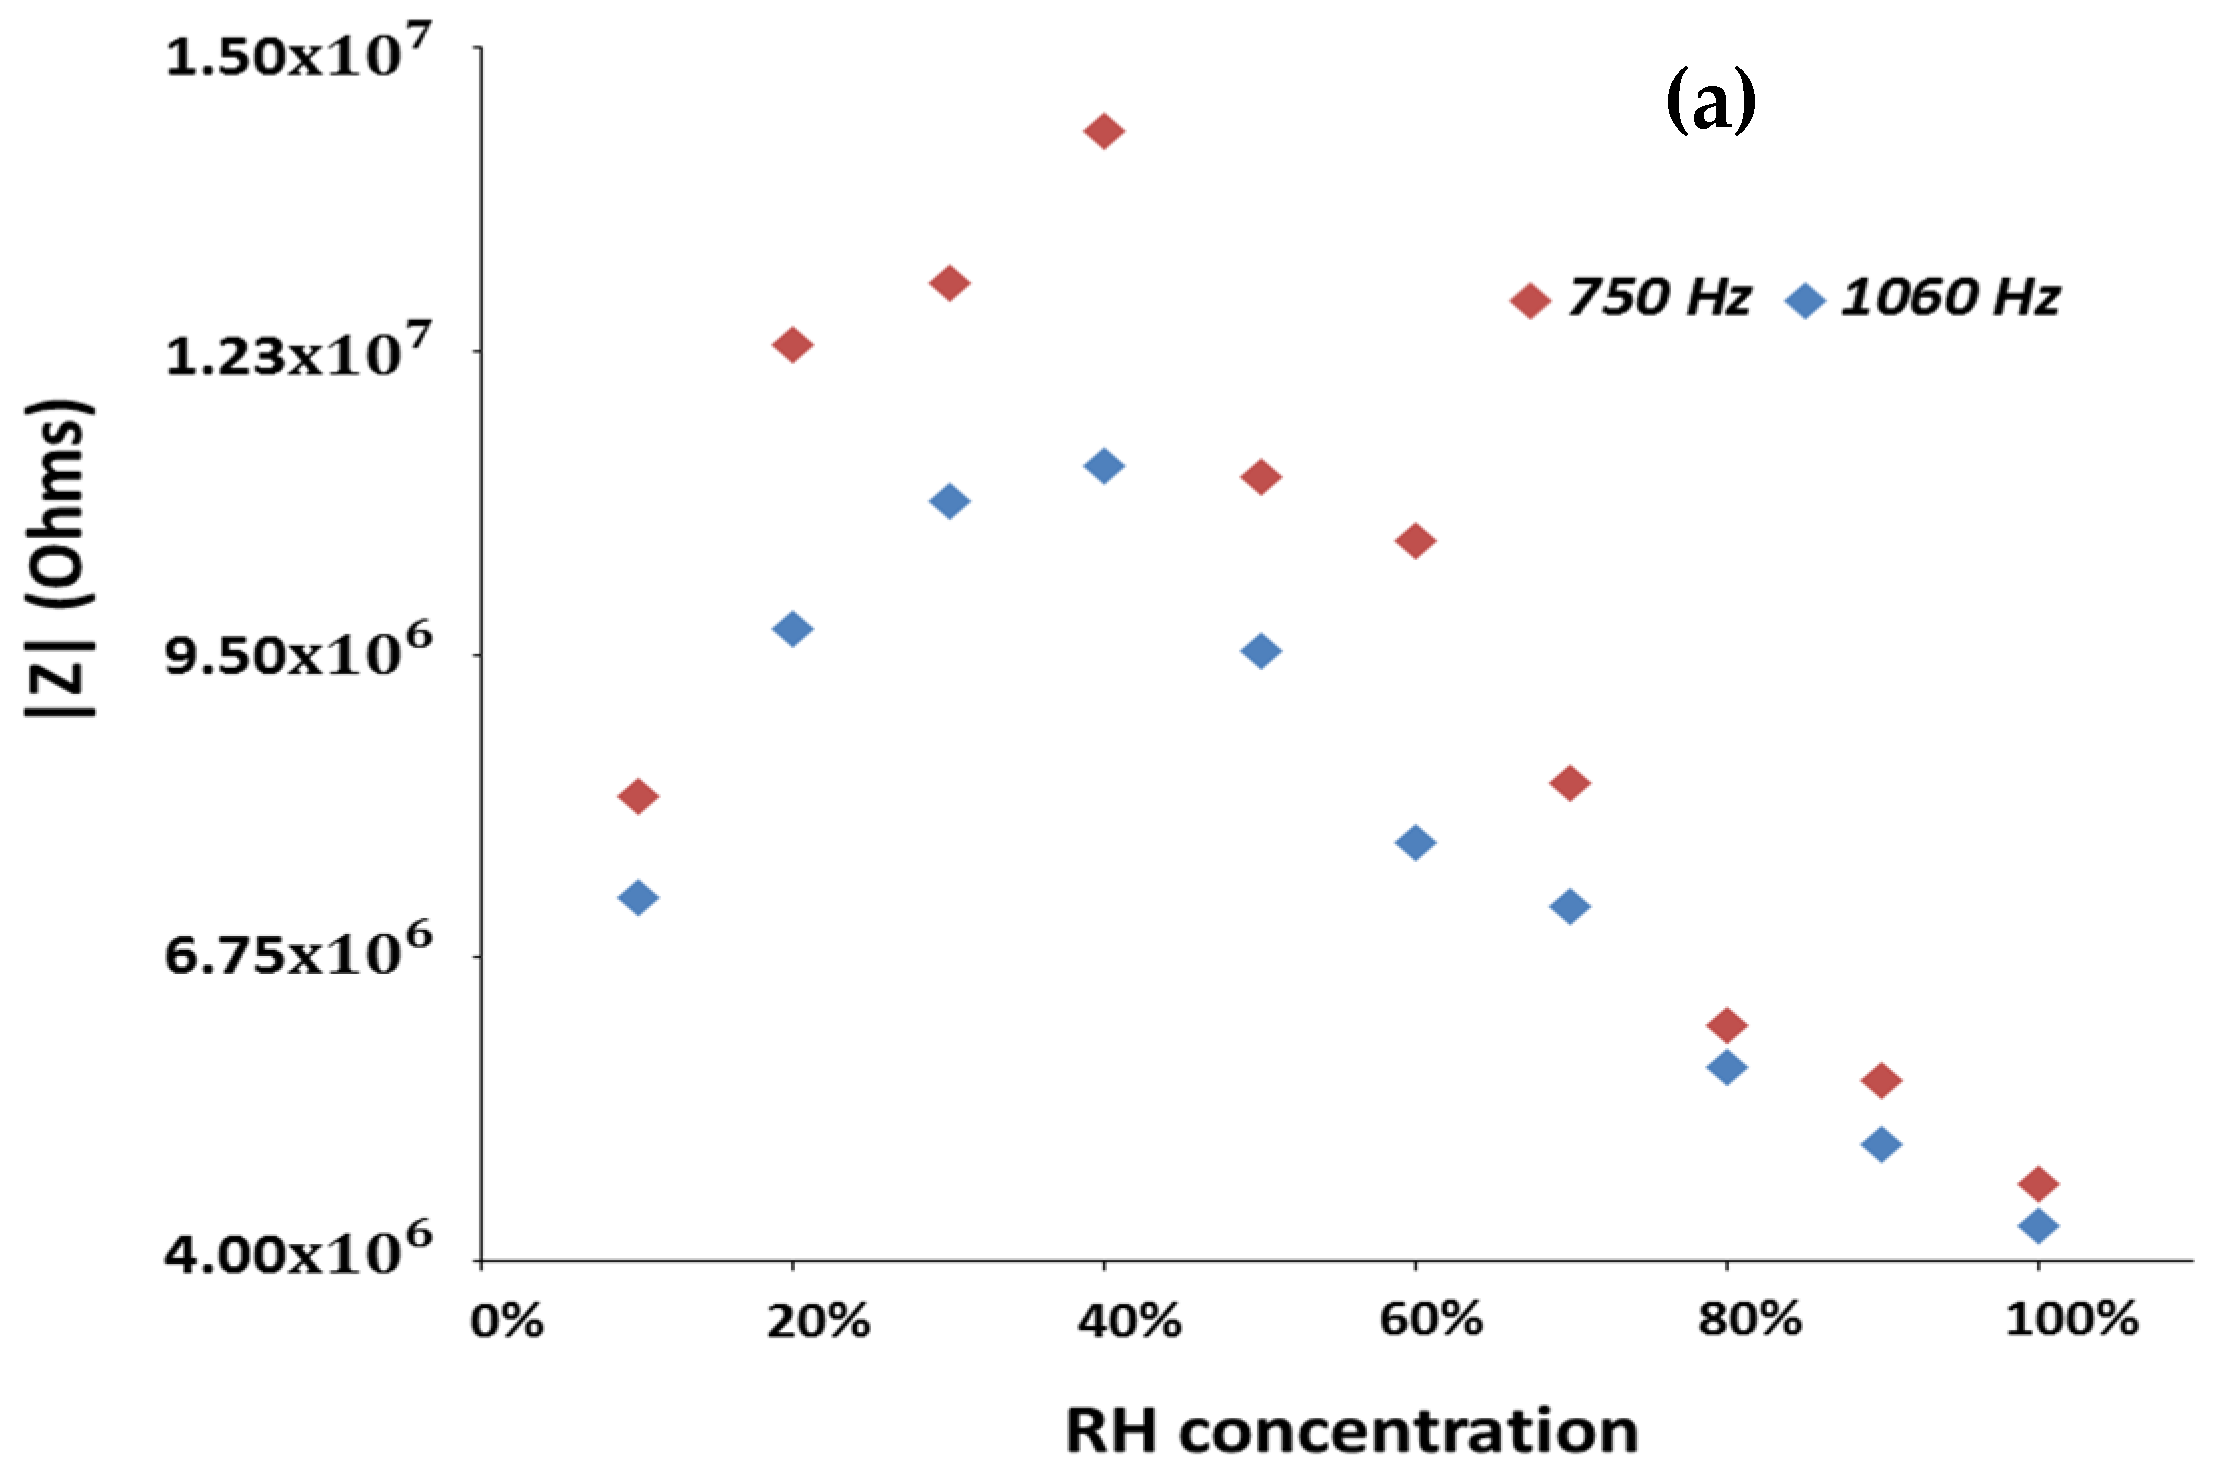
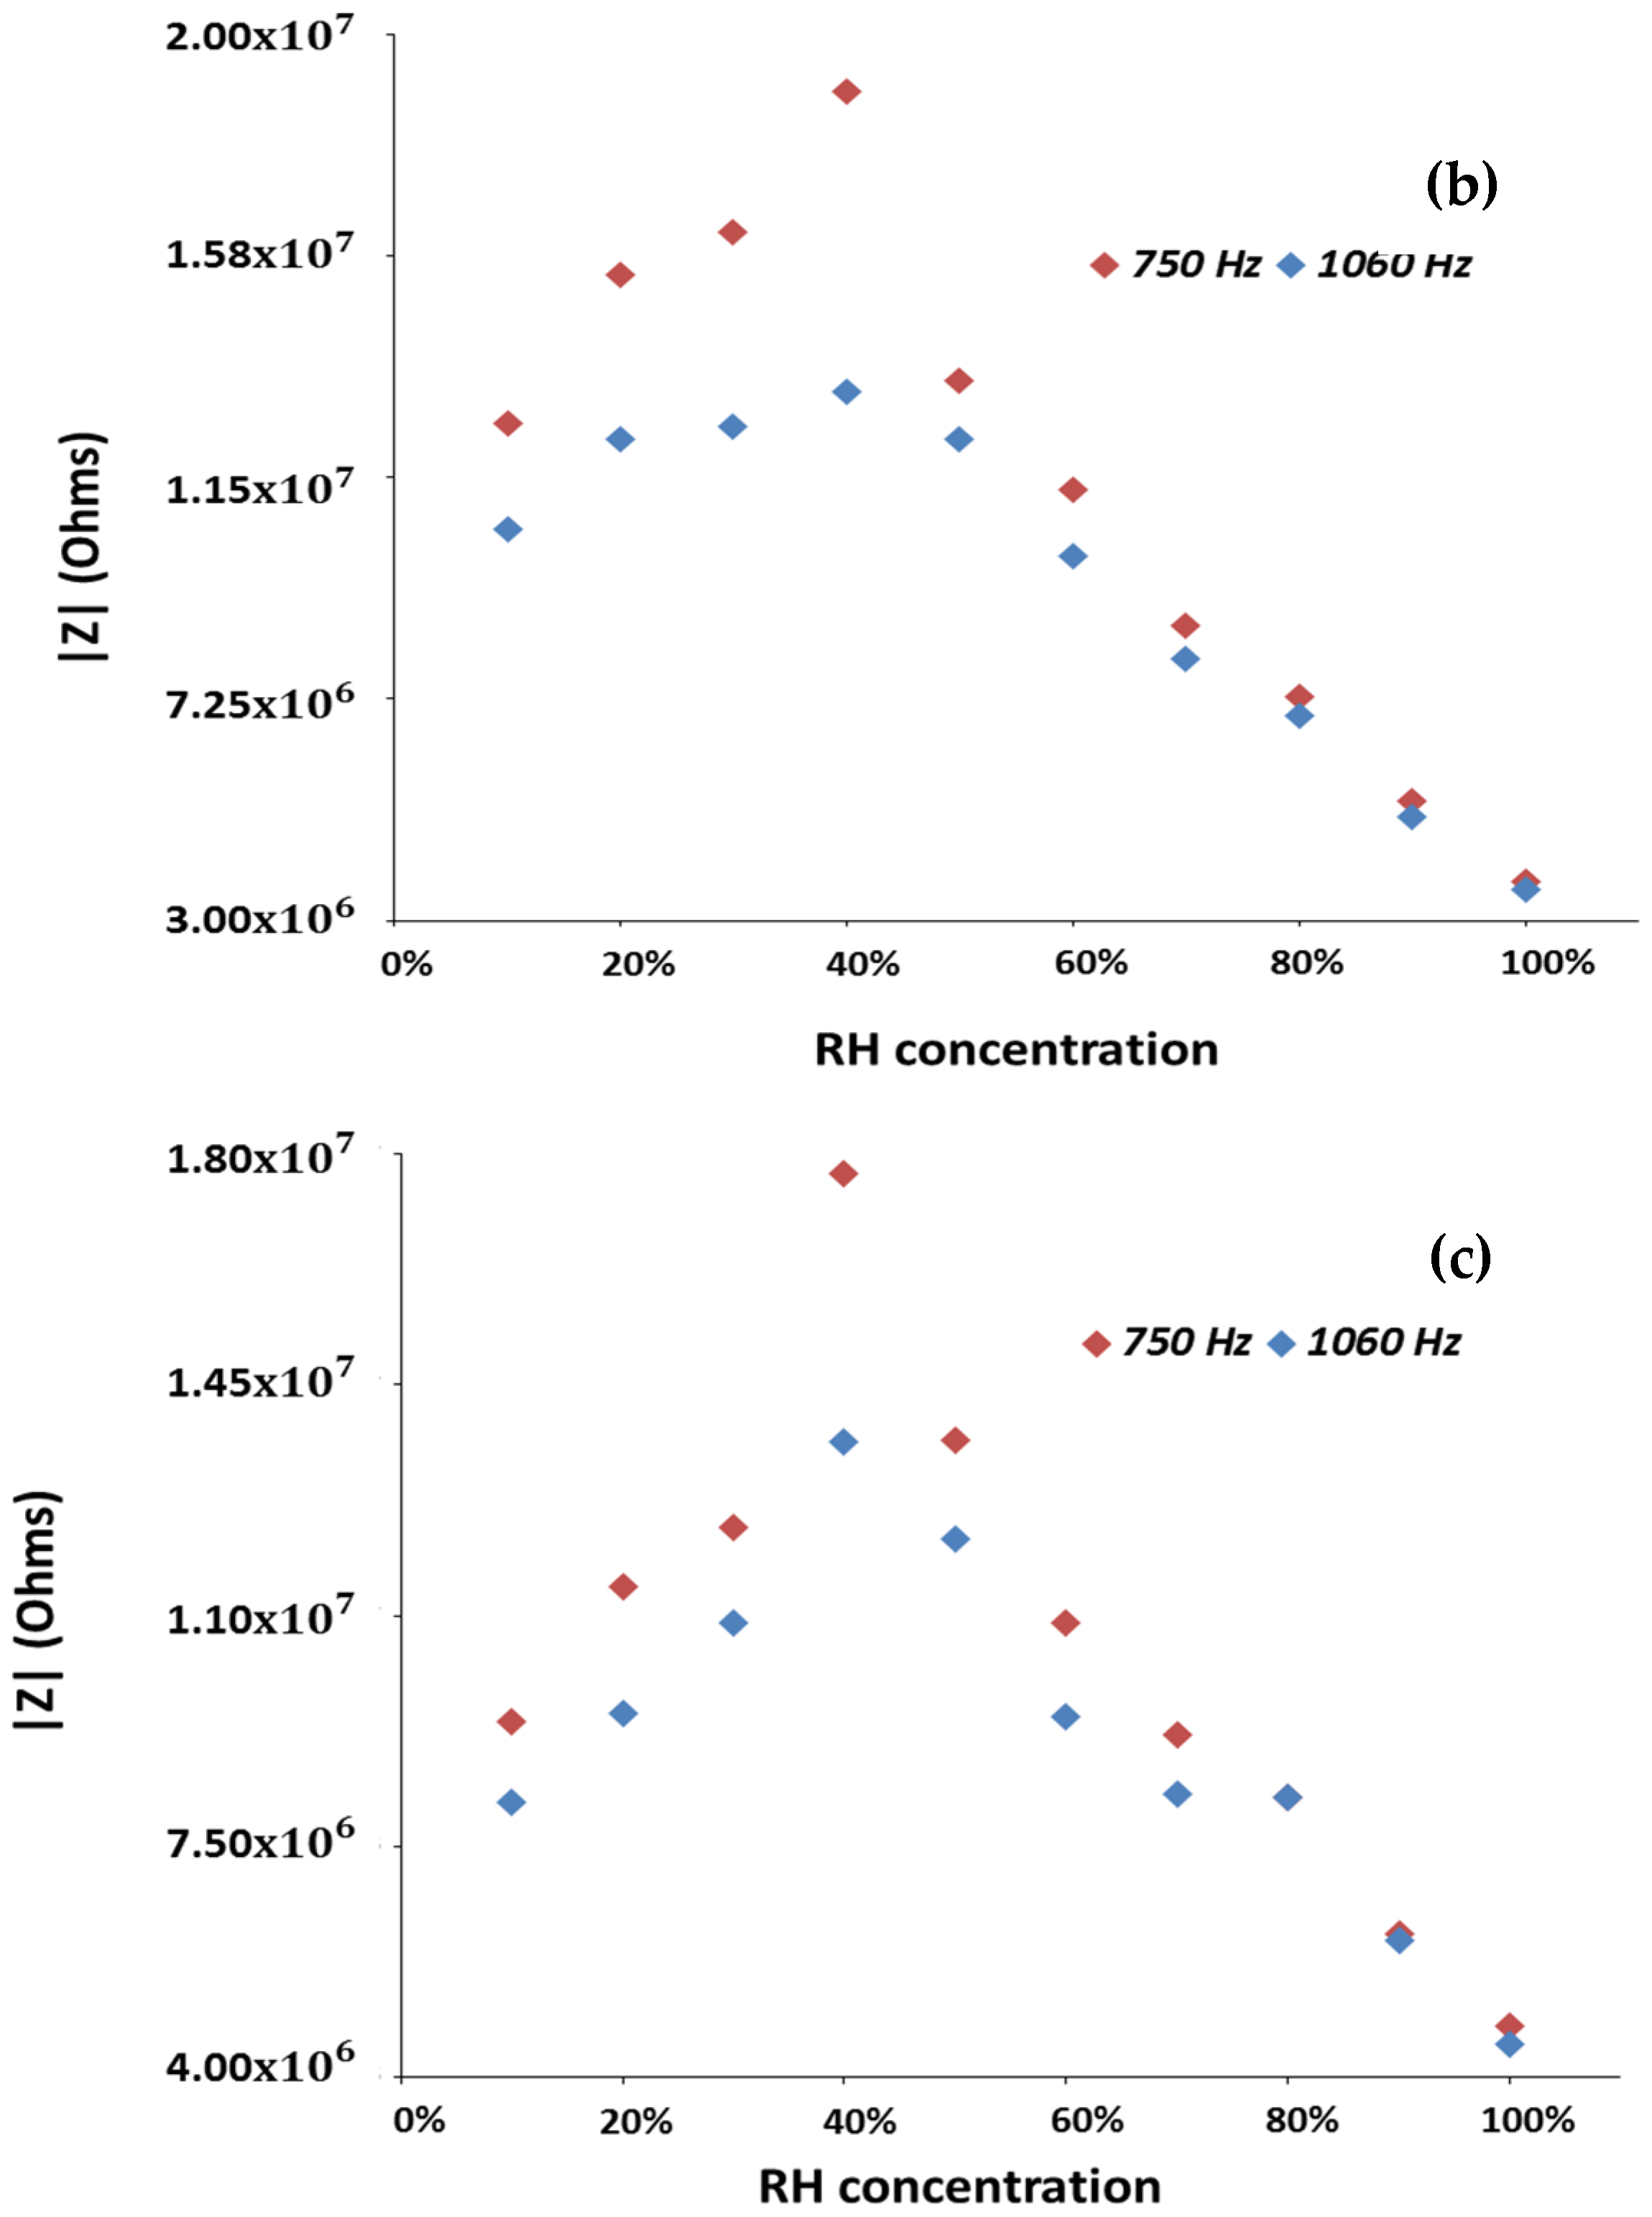
Figure 7 shows the variations in the impedance modulus obtained for the
and
systems as a function of RH, in the 10–100% RH range.
Frequencies above 1 kHz were also analyzed but the overall observed impedance variations were smaller than the ones here reported and plotted. The and samples display an overall impedance variation of 0.95, 1.52 and 1.29 order of magnitude, respectively, at the frequency of 750 Hz, where all tested sensors display the highest variations to RH changes.
These results allow to state that the use of zinc as dopant is an effective approach to improve the sensitivity of electrospun TiO
2/WO
3. In fact, the
systems containing zinc exhibit higher overall impedance to RH variations (higher overall impedance modulus variation) than those obtained with the
systems (produced in the form of pellets or prepared by electrospinning, without addition of dopants) [
11]. Besides, the depicted results also allow to clearly observe the mentioned p- to n-type transition, and to notice that the
system with 2 wt% zinc content presents the highest sensitivity to moisture. Additionally, and for all sensors, it is possible to see that the frequency at which the higher overall impedance modulus variation is observable, is of 750 Hz.
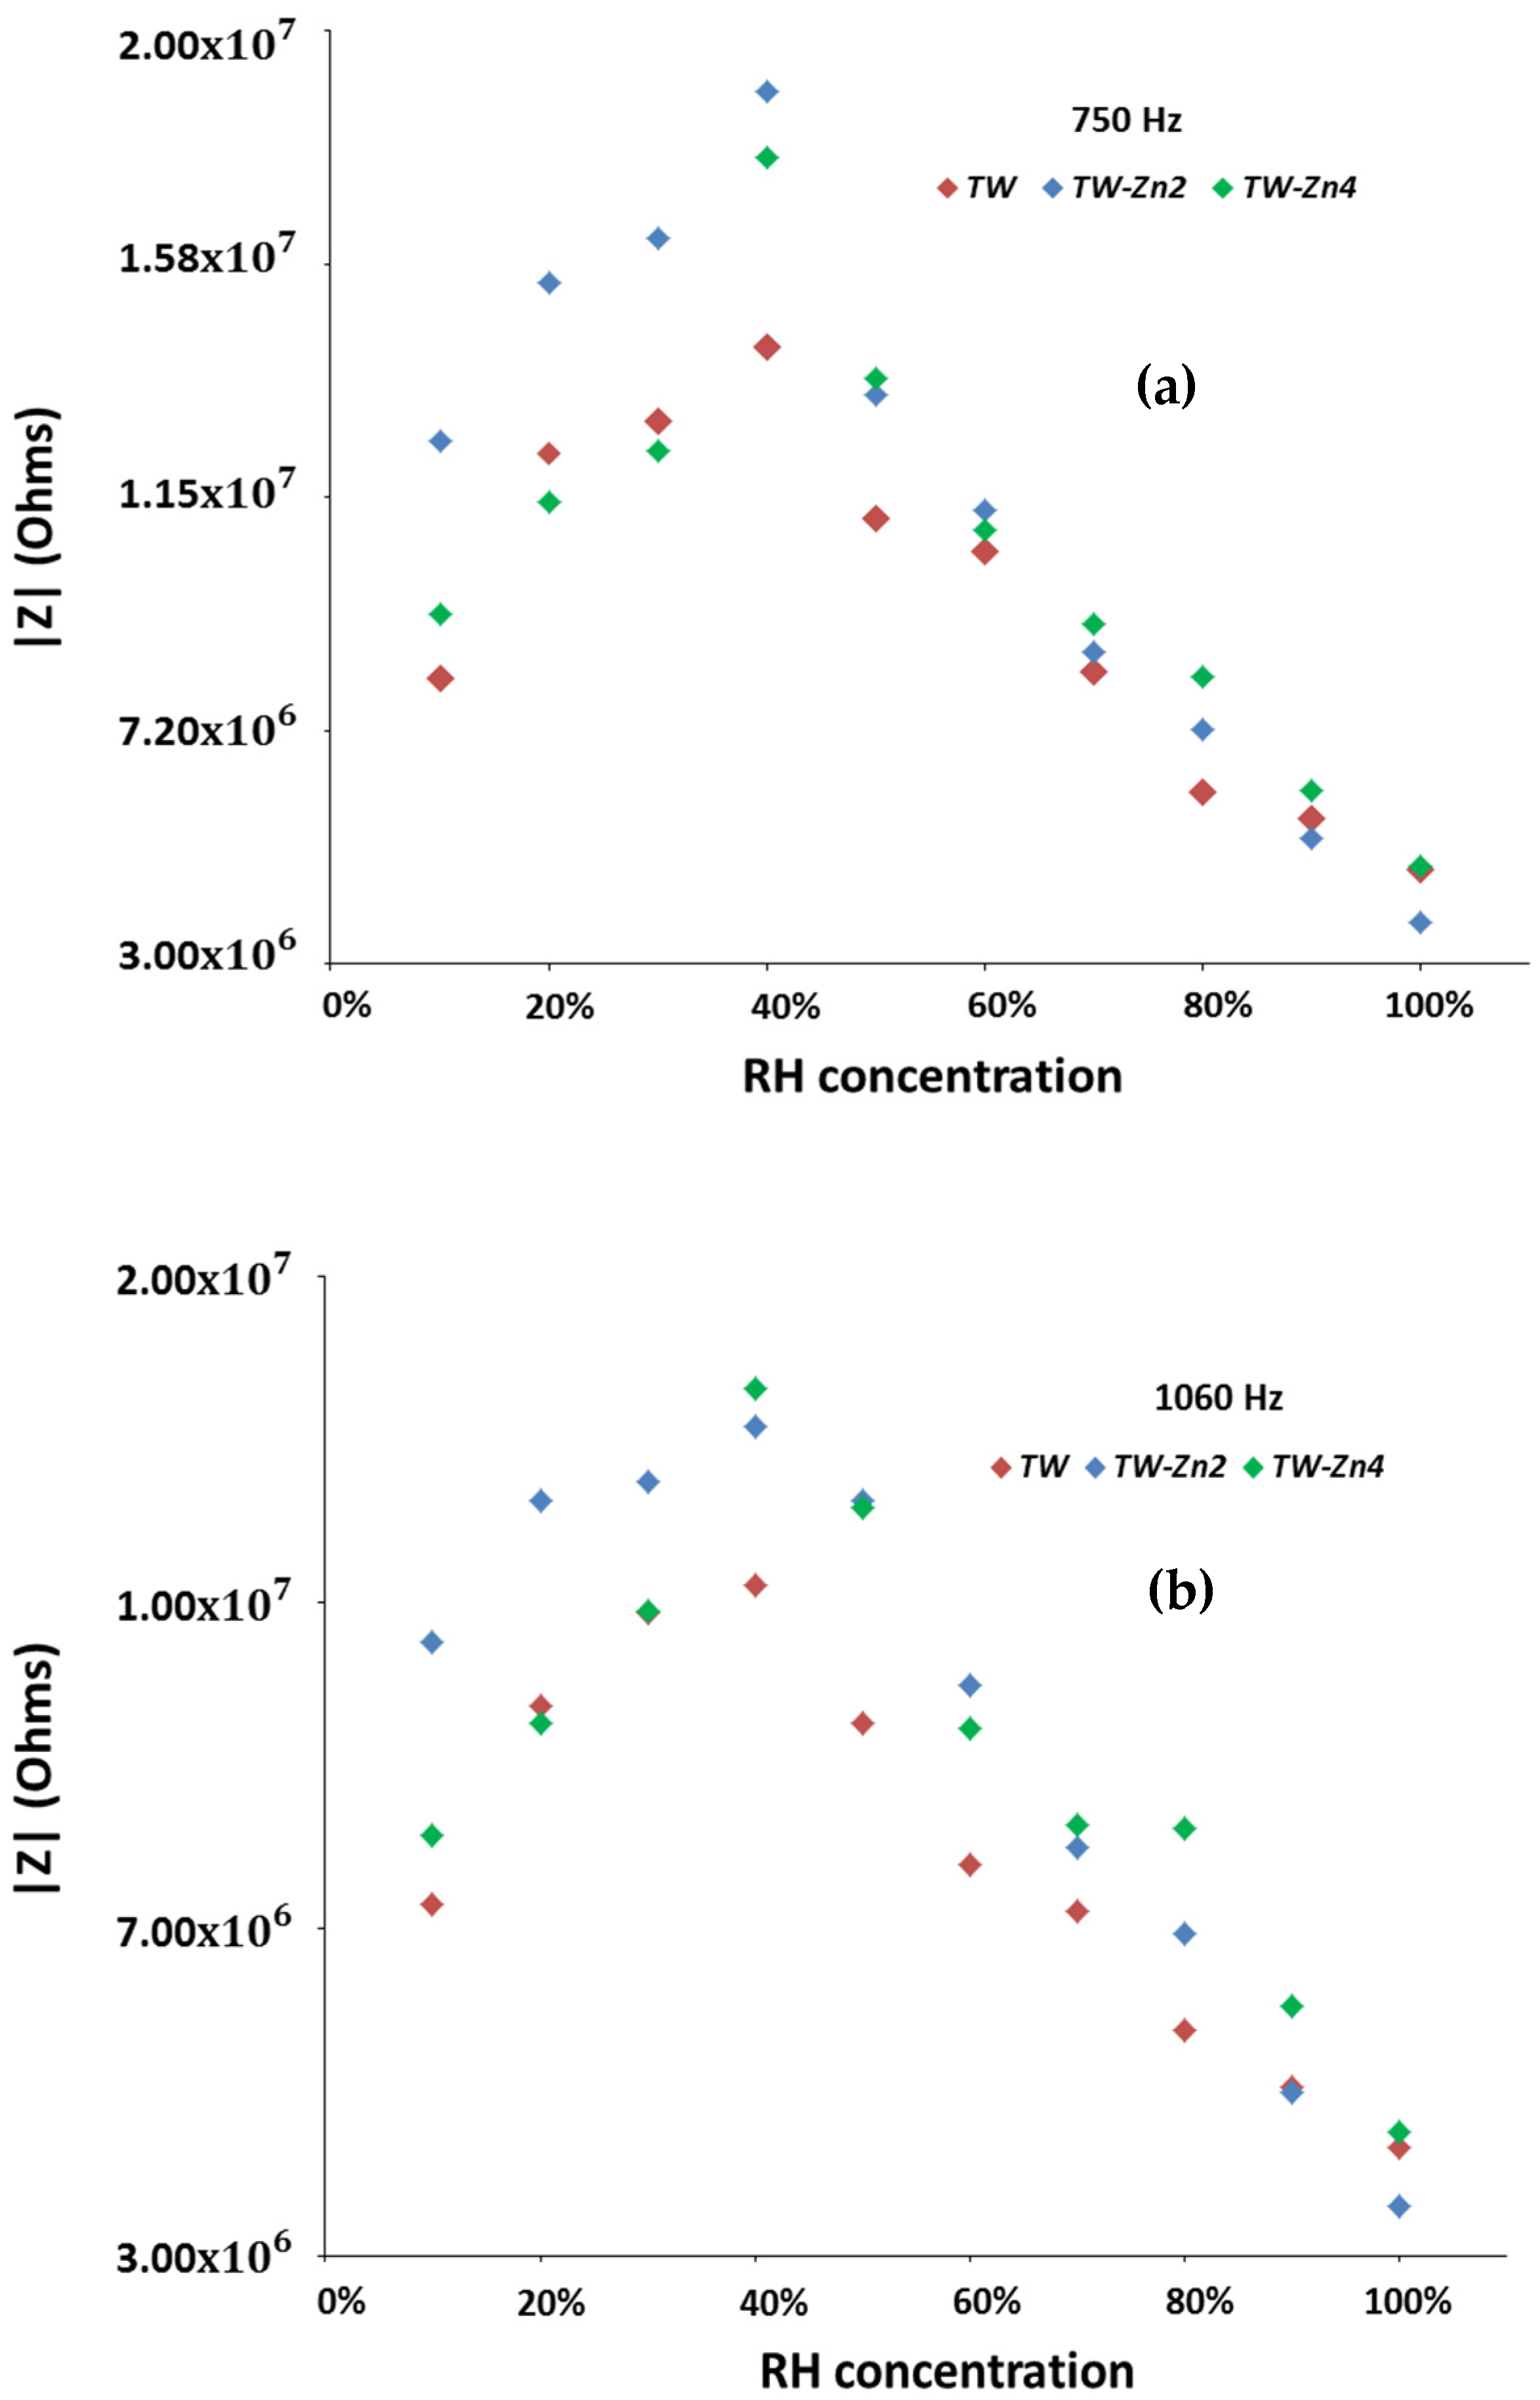
In
Figure 8, a close comparison of the impedance modulus variation between the three
, done for the two test frequencies, allows to: (i) confirm that the best testing frequency is 750 Hz (the overall impedance modulus variation found at 1060 Hz is clearly smaller than the observed at 750 Hz); (ii) confirm that the system containing 2 wt% of zinc does not only exhibit always a higher overall impedance variation to moisture changes, but it also exhibits an almost linear variation with it.
The electrical response stability to moisture of
and
samples was tested at three RH working values (at 50, 70 and 90% RH—after the p-n transition) at 750 Hz, in terms of the relative variation of impedance, over the seven-day measurement interval under constant RH regime.
Table 2 reports the stability of the electrical response based on the working values
of
measured after the p-n transition, and at
of relative humidity, respectively. The results showed that all doped samples have small variation in the measured impedance modulus values (
) with time, considering a fixed RH (similar to the variation observed for the undoped one), with high potential usage in moisture sensing devices. The actual obtained materials, and in particular the composition doped with
of zinc exhibits, specifically in the high humidity range, does not only show better sensitivity, but also a linear variation of the impedance modulus, characteristics not found in other materials reported in literature [
39,
40,
41,
42].
In resume, the electrical moisture sensitivity results obtained with the use of a dopant (see
Figure 8 and
Table 2), confirm that electrospinning is an effective and convenient processing route to prepare RH sensing devices.


 and
and 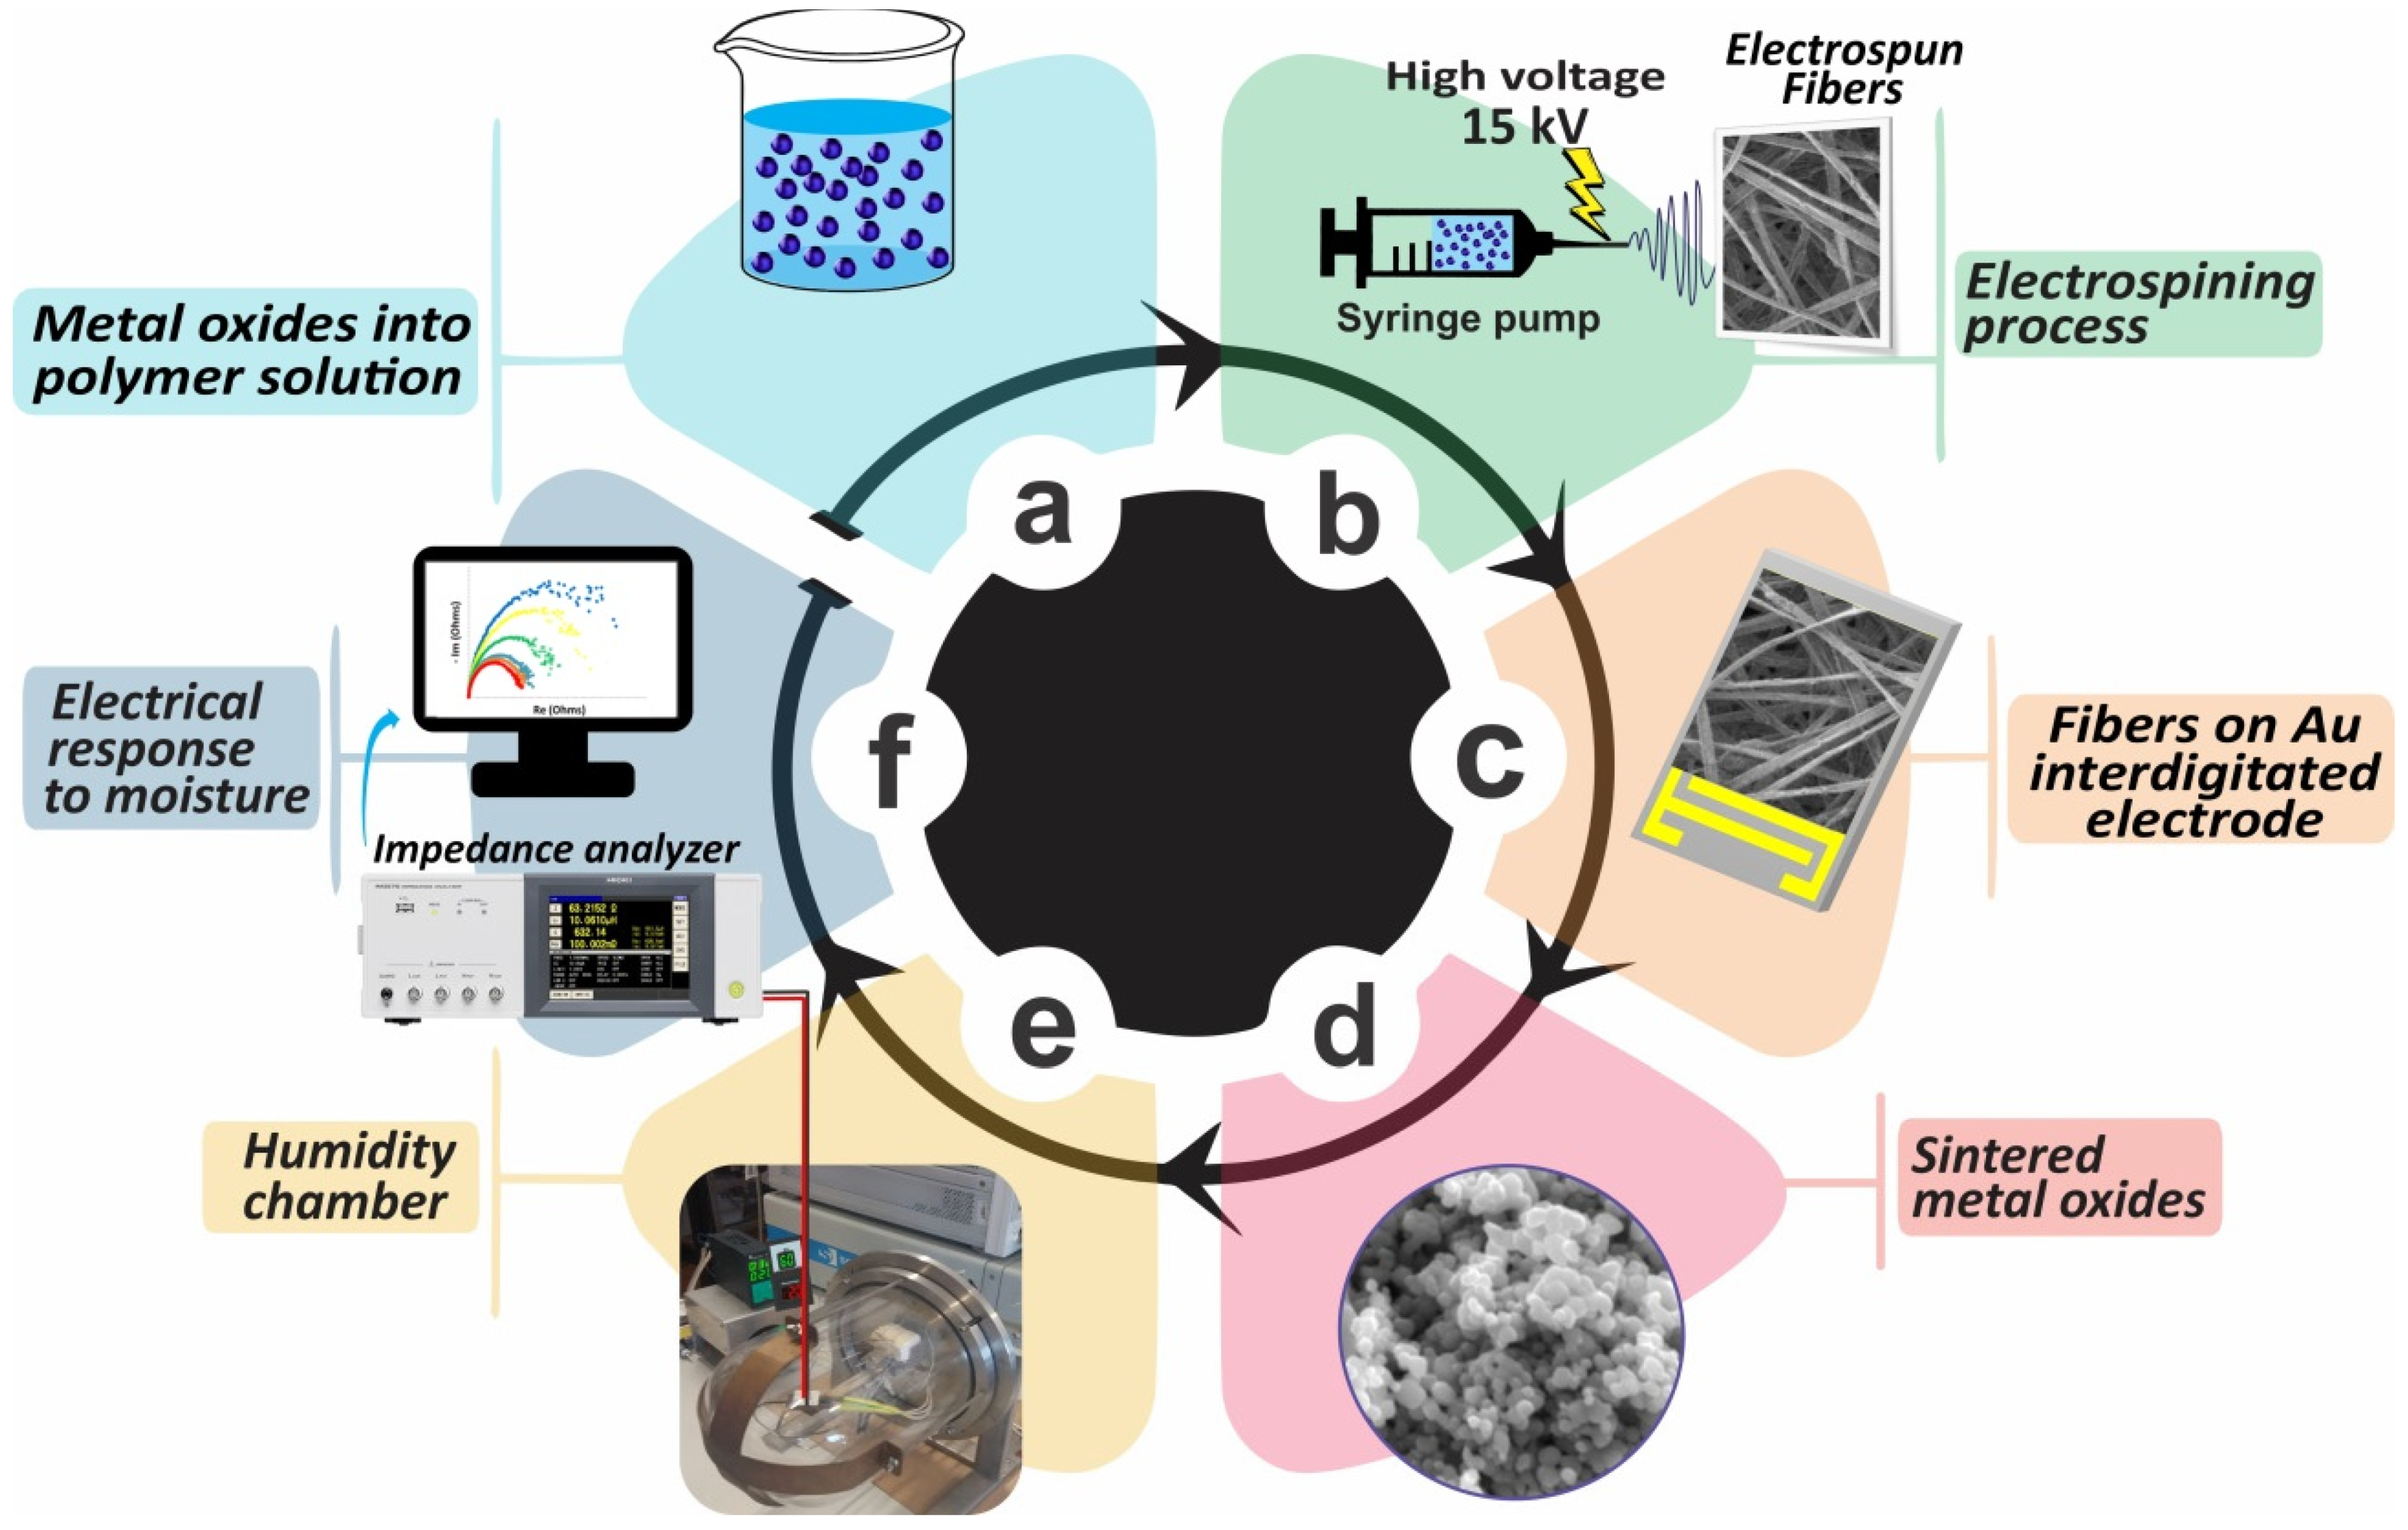

