Flexure Strength and Fracture Propagation in Zirconia Ceramic Composites with Exfoliated Graphene Nanoplatelets
Abstract
1. Introduction
2. Materials and Methods
2.1. Powder Processing and Sintering
2.2. Microstructural Characterization
2.3. Mechanical Characterization
3. Results and Discussions
3.1. Microstructural Characterization
3.2. Mechanical Characterization
4. Conclusions
Author Contributions
Funding
Acknowledgments
Conflicts of Interest
Appendix A
References
- Wang, X.; Dai, H. Etching and narrowing of graphene from the edges. Nat. Chem. 2010, 2, 661–665. [Google Scholar] [CrossRef] [PubMed]
- Lee, C.; Wei, X.; Kysar, J.W.; Hone, J. Measurement of the elastic properties and intrinsic strength of monolayer graphene. Science 2008, 321, 385–388. [Google Scholar] [CrossRef] [PubMed]
- Allen, M.J.; Tung, V.C.; Kaner, R.B. Honeycomb carbon: A review of graphene. Chem. Rev. 2010, 110, 132–145. [Google Scholar] [CrossRef] [PubMed]
- Geim, A.K.; Novoselov, K.S. The rise of graphene. Nat. Mater. 2007, 6, 183–191. [Google Scholar] [CrossRef]
- Singh, V.; Joung, D.; Zhai, L.; Das, S.; Khondaker, S.I.; Seal, S. Graphene based materials: Past, present and future. Prog. Mater. Sci. 2011, 56, 1178–1271. [Google Scholar] [CrossRef]
- París, F.; Cañas, J.; Marín, J.C.; Barroso, A. Introducción al análisis y diseño con materiales compuestos. Ed. Univ. Sevilla 2006. [Google Scholar]
- Michálková, M.; Kašiarová, M.; Tatarko, P.; Dusza, J.; Šajgalík, P. Effect of homogenization treatment on the fracture behaviour of silicon nitride/graphene nanoplatelets composites. J. Eur. Ceram. Soc. 2014, 34, 3291–3299. [Google Scholar] [CrossRef]
- López-Pernía, C.; Muñoz-Ferreiro, C.; González-Orellana, C.; Morales-Rodríguez, A.; Gallardo-López, Á.; Poyato, R. Optimizing the homogenization technique for graphene nanoplatelet/yttria tetragonal zirconia composites: Influence on the microstructure and the electrical conductivity. J. Alloys Compd. 2018, 767, 994–1002. [Google Scholar] [CrossRef]
- Obradović, N.; Kern, F. Properties of 3Y-TZP zirconia ceramics with graphene addition obtained by spark plasma sintering. Ceram. Int. 2018, 44, 16931–16936. [Google Scholar] [CrossRef]
- Rutkowski, P.; Klimczyk, P.; Jaworska, L.; Stobierski, L.; Zientara, D.; Tran, K. Mechanical properties of pressure sintered alumina-graphene composites. Mater. Ceram. 2016, 68, 168–175. [Google Scholar]
- Ramirez, C.; Miranzo, P.; Belmonte, M.; Isabel Osendi, M.; Poza, P.; Vega-Diaz, S.M.; Terrones, M. Extraordinary toughening enhancement and flexural strength in Si3N4 composites using graphene sheets. J. Eur. Ceram. Soc. 2014, 34, 161–169. [Google Scholar] [CrossRef]
- Shin, J.-H.; Hong, S.-H. Fabrication and properties of reduced graphene oxide reinforced yttria-stabilized zirconia composite ceramics. J. Eur. Ceram. Soc. 2014, 34, 1297–1302. [Google Scholar] [CrossRef]
- Kwon, S.-M.; Lee, S.-J.; Shon, I.-J. Enhanced properties of nanostructured ZrO2–graphene composites rapidly sintered via high-frequency induction heating. Ceram. Int. 2015, 41, 835–842. [Google Scholar] [CrossRef]
- Gómez-Gómez, A.; Ramírez, C.; Llorente, J.; Garcia, A.; Moreno, P.; Reveron, H.; Chevalier, J.; Osendi, M.I.; Belmonte, M.; Miranzo, P. Improved crack resistance and thermal conductivity of cubic zirconia containing graphene nanoplatelets. J. Eur. Ceram. Soc. 2020, 40, 1557–1565. [Google Scholar] [CrossRef]
- Balazsi, K.; Furkó, M.; Klimczyk, P.; Balázsi, C. Influence of Graphene and Graphene Oxide on Properties of Spark Plasma Sintered Si3N4 Ceramic Matrix. Ceramics 2020, 3, 40–50. [Google Scholar] [CrossRef]
- Wang, X.; Padture, N.P.; Tanaka, H. Contact-damage-resistant ceramic/single-wall carbon nanotubes and ceramic/graphite composites. Nat. Mater. 2004, 3, 539–544. [Google Scholar] [CrossRef]
- Walker, L.S.; Marotto, V.R.; Rafiee, M.A.; Koratkar, N.; Corral, E.L. Toughening in graphene ceramic composites. ACS Nano 2011, 5, 3182–3190. [Google Scholar] [CrossRef]
- Garvie, R.C.; Hannink, R.H.; Pascoe, R.T. Ceramic steel? Nature 1975, 258, 703–704. [Google Scholar] [CrossRef]
- Piconi, C.; Maccauro, G. Zirconia as a ceramic biomaterial. Biomaterials 1999, 20, 1–25. [Google Scholar] [CrossRef]
- Chen, F.; Jin, D.; Tyeb, K.; Wang, B.; Han, Y.-H.; Kim, S.; Schoenung, J.M.; Shen, Q.; Zhang, L. Field assisted sintering of graphene reinforced zirconia ceramics. Ceram. Int. 2015, 41, 6113–6116. [Google Scholar] [CrossRef]
- Ramesh, S.; Khan, M.M.; Chee, H.C.A.; Wong, Y.H.; Ganesan, P.; Kutty, M.G.; Sutharsini, U.; Chew, W.J.K.; Niakan, A. Sintering behaviour and properties of graphene oxide-doped Y-TZP ceramics. Ceram. Int. 2016, 42, 17620–17625. [Google Scholar] [CrossRef]
- Li, S.; Xie, Z.; Zhang, Y.; Zhou, Y. Enhanced toughness of zirconia ceramics with graphene platelets consolidated by spark plasma sintering. Int. J. Appl. Ceram. Technol. 2017, 14, 1062–1068. [Google Scholar] [CrossRef]
- Picot, O.T.; Rocha, V.G.; Ferraro, C.; Ni, N.; D’elia, E.; Meille, S.; Chevalier, J.; Saunders, T.; Peijs, T.; Reece, M.J. Using graphene networks to build bioinspired self-monitoring ceramics. Nat. Commun. 2017, 8, 14425. [Google Scholar] [CrossRef] [PubMed]
- Baskut, S.; Cinar, A.; Seyhan, A.T.; Turan, S. Tailoring the properties of spark plasma sintered SiAlON containing graphene nanoplatelets by using different exfoliation and size reduction techniques: Anisotropic electrical properties. J. Eur. Ceram. Soc. 2018, 38, 3787–3792. [Google Scholar] [CrossRef]
- Wang, Q.; Ramírez, C.; Watts, C.S.; Borrero-López, O.; Ortiz, A.L.; Sheldon, B.W.; Padture, N.P. Fracture, fatigue, and sliding-wear behavior of nanocomposites of alumina and reduced graphene-oxide. Acta Mater. 2020, 186, 29–39. [Google Scholar] [CrossRef]
- Gallardo-López, A.; Márquez-Abril, I.; Morales-Rodríguez, A.; Muñoz, A.; Poyato, R. Dense graphene nanoplatelet/yttria tetragonal zirconia composites: Processing, hardness and electrical conductivity. Ceram. Int. 2017, 43, 11743–11752. [Google Scholar] [CrossRef]
- Anstis, G.R.; Chantikul, P.; Lawn, B.R.; Marshall, D.B. A critical evaluation of indentation techniques for measuring fracture toughness: I, direct crack measurements. J. Am. Ceram. Soc. 1981, 64, 533–538. [Google Scholar] [CrossRef]
- Niihara, K. A fracture mechanics analysis of indentation-induced Palmqvist crack in ceramics. J. Mater. Sci. Lett. 1983, 2, 221–223. [Google Scholar] [CrossRef]
- Shetty, D.K.; Wright, I.G.; Mincer, P.N.; Clauer, A.H. Indentation fracture of WC-Co cermets. J. Mater. Sci. 1985, 20, 1873–1882. [Google Scholar] [CrossRef]
- Gallardo-López, A.; Poyato, R.; Morales-Rodríguez, A.; Fernández-Serrano, A.; Muñoz, A.; Domínguez-Rodríguez, A. Hardness and flexural strength of single-walled carbon nanotube/alumina composites. J. Mater. Sci. 2014, 49, 7116–7123. [Google Scholar] [CrossRef]
- Venezuela, P.; Lazzeri, M.; Mauri, F. Theory of double-resonant Raman spectra in graphene: Intensity and line shape of defect-induced and two-phonon bands. Phys. Rev. B-Condens. Matter Mater. Phys. 2011, 84, 1–25. [Google Scholar] [CrossRef]
- Pimenta, M.A.; Dresselhaus, G.; Dresselhaus, M.S.; Cançado, L.G.; Jorio, A.; Saito, R. Studying disorder in graphite-based systems by Raman spectroscopy. Phys. Chem. Chem. Phys. 2007, 9, 1276–1291. [Google Scholar] [CrossRef] [PubMed]
- Sadezky, A.; Muckenhuber, H.; Grothe, H.; Niessner, R.; Pöschl, U. Raman microspectroscopy of soot and related carbonaceous materials: Spectral analysis and structural information. Carbon N. Y. 2005, 43, 1731–1742. [Google Scholar] [CrossRef]
- Ferrari, A.C.; Basko, D.M. Raman spectroscopy as a versatile tool for studying the properties of graphene. Nat. Nanotechnol. 2013, 8, 235–246. [Google Scholar] [CrossRef] [PubMed]
- Claramunt, S.; Varea, A.; López-Díaz, D.; Velázquez, M.M.; Cornet, A.; Cirera, A. The importance of interbands on the interpretation of the raman spectrum of graphene oxide. J. Phys. Chem. C 2015, 119, 10123–10129. [Google Scholar] [CrossRef]
- Malard, L.M.; Pimenta, M.A.; Dresselhaus, G.; Dresselhaus, M.S. Raman spectroscopy in graphene. Phys. Rep. 2009, 473, 51–87. [Google Scholar] [CrossRef]
- Díez-Betriu, X.; Álvarez-García, S.; Botas, C.; Álvarez, P.; Sánchez-Marcos, J.; Prieto, C.; Menéndez, R.; De Andrés, A. Raman spectroscopy for the study of reduction mechanisms and optimization of conductivity in graphene oxide thin films. J. Mater. Chem. C 2013, 1, 6905–6912. [Google Scholar] [CrossRef]
- Gutiérrez-Mora, F.; Morales-Rodríguez, A.; Gallardo-López, A.; Poyato, R. Tribological behavior of graphene nanoplatelet reinforced 3YTZP composites. J. Eur. Ceram. Soc. 2019, 39, 1381–1388. [Google Scholar] [CrossRef]
- Muñoz-Ferreiro, C.; Morales-Rodríguez, A.; Rojas, T.C.; Jiménez-Piqué, E.; López-Pernía, C.; Poyato, R.; Gallardo-López, A. Microstructure, interfaces and properties of 3YTZP ceramic composites with 10 and 20 vol% different graphene-based nanostructures as fillers. J. Alloys Compd. 2019, 777, 213–224. [Google Scholar] [CrossRef]
- Muchtar, A.; Lim, L.C.; Lee, K.H. Finite element analysis of vickers indentation cracking processes in brittle solids using elements exhibiting cohesive post-failure behaviour. J. Mater. Sci. 2003, 38, 235–243. [Google Scholar] [CrossRef]
- Yonezu, A.; Xu, B.; Chen, X. Indentation induced lateral crack in ceramics with surface hardening. Mater. Sci. Eng. A 2009, 507, 226–235. [Google Scholar] [CrossRef]
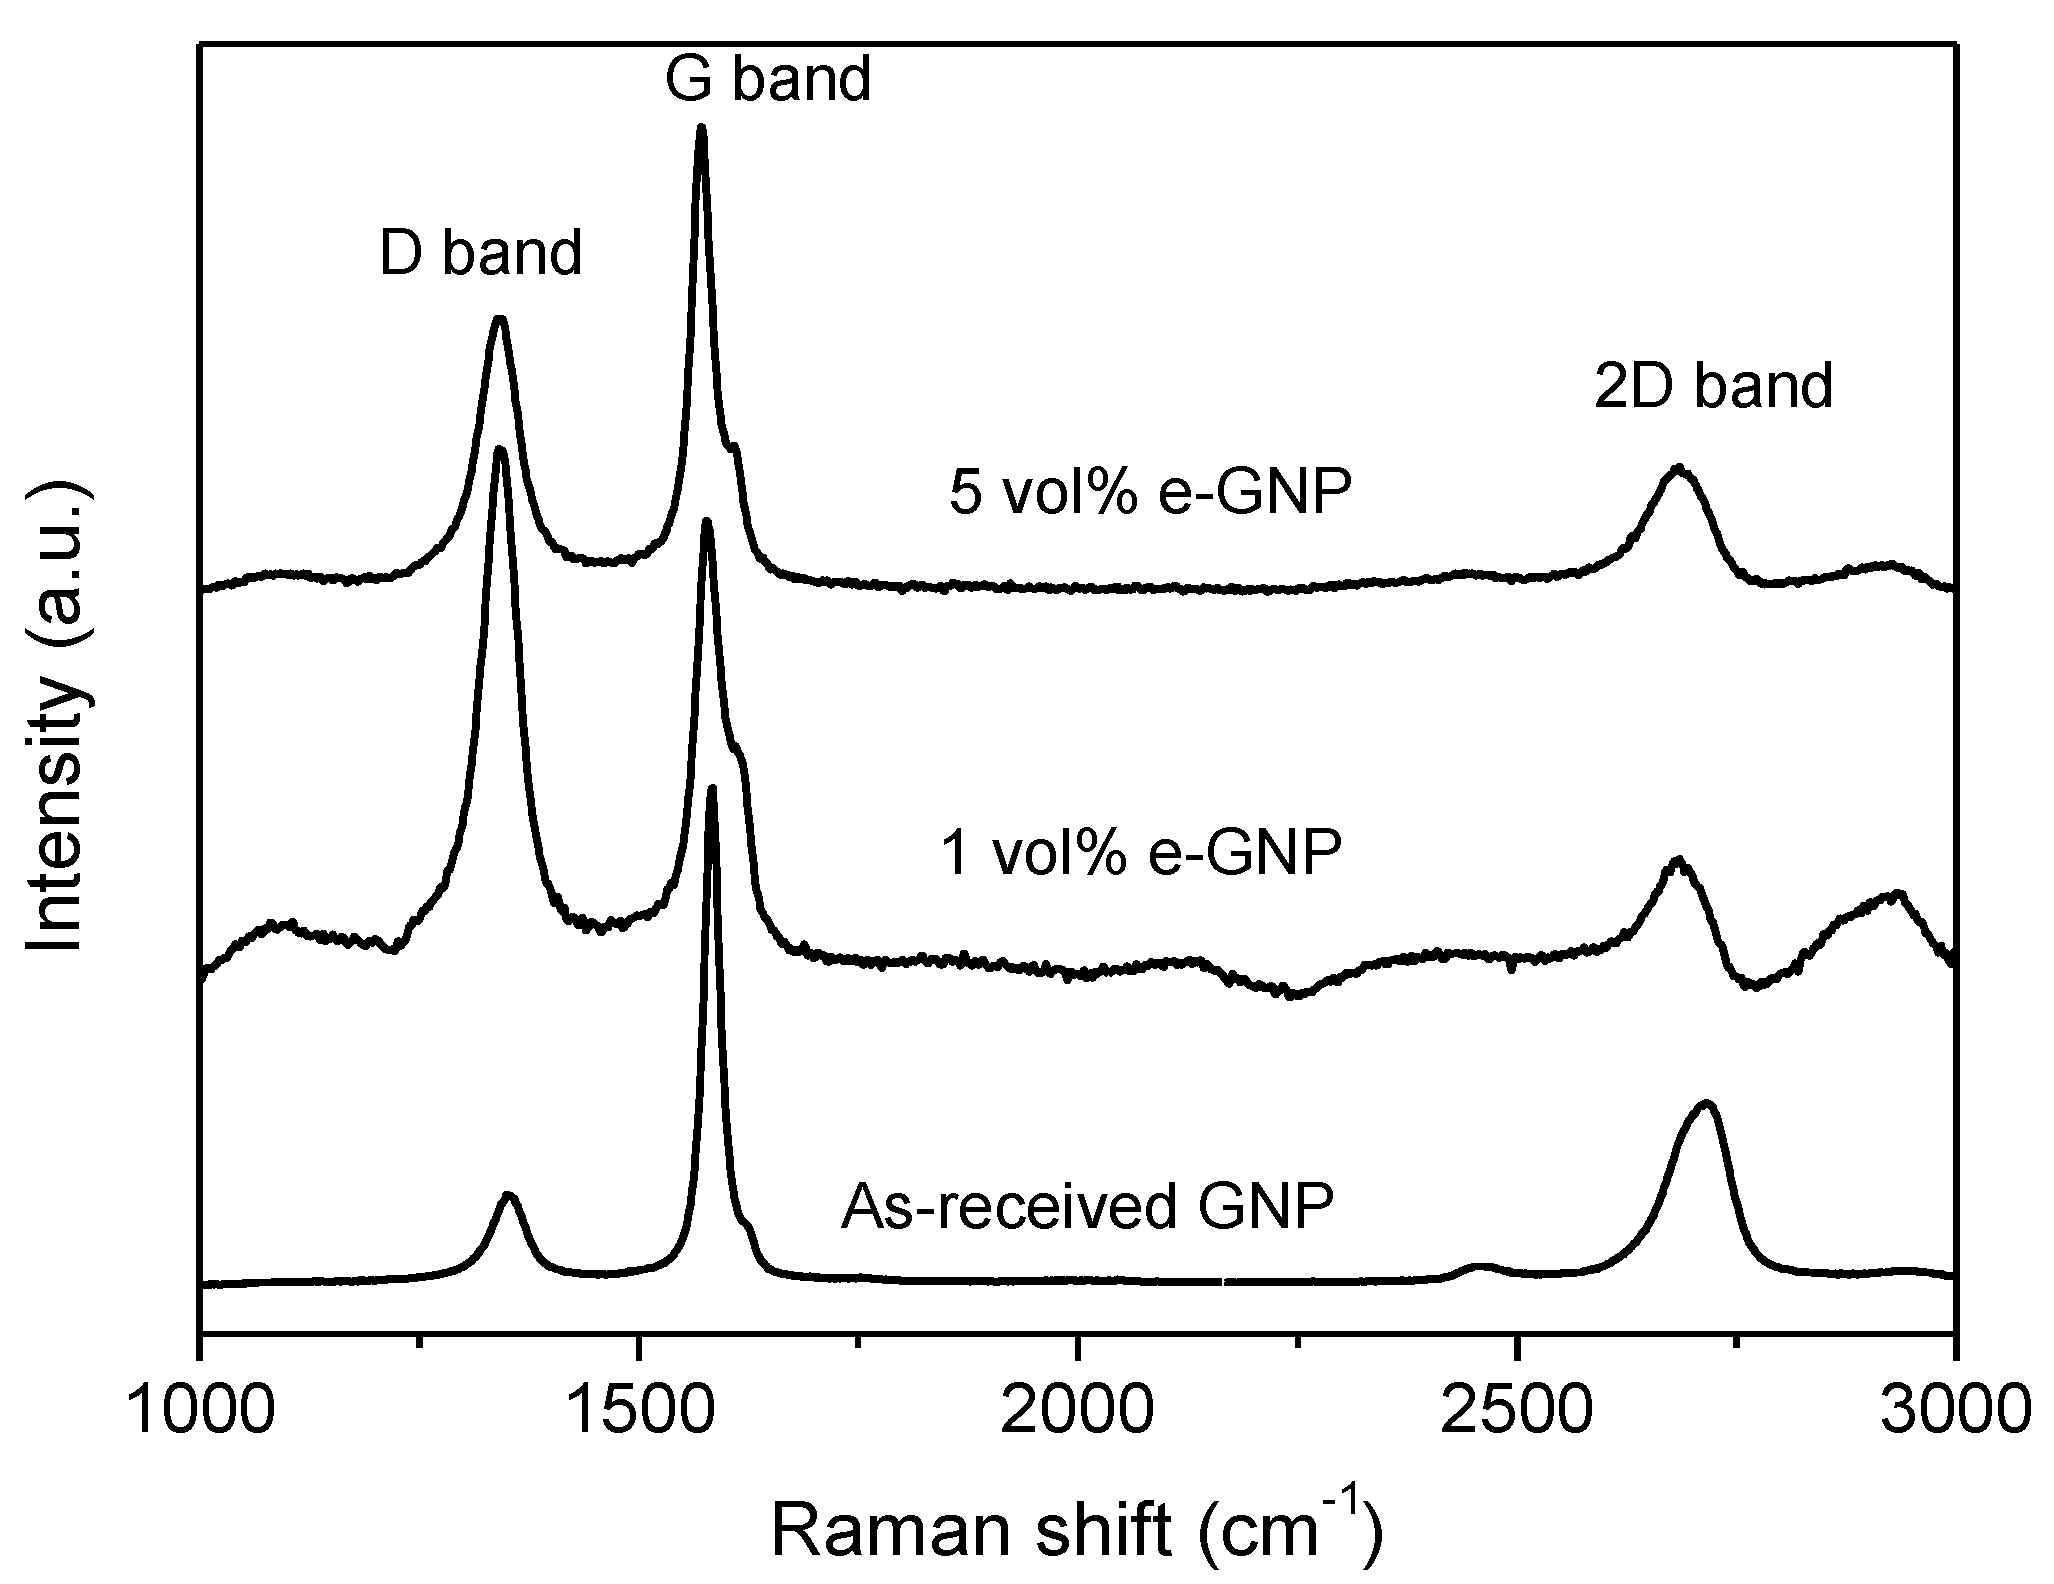
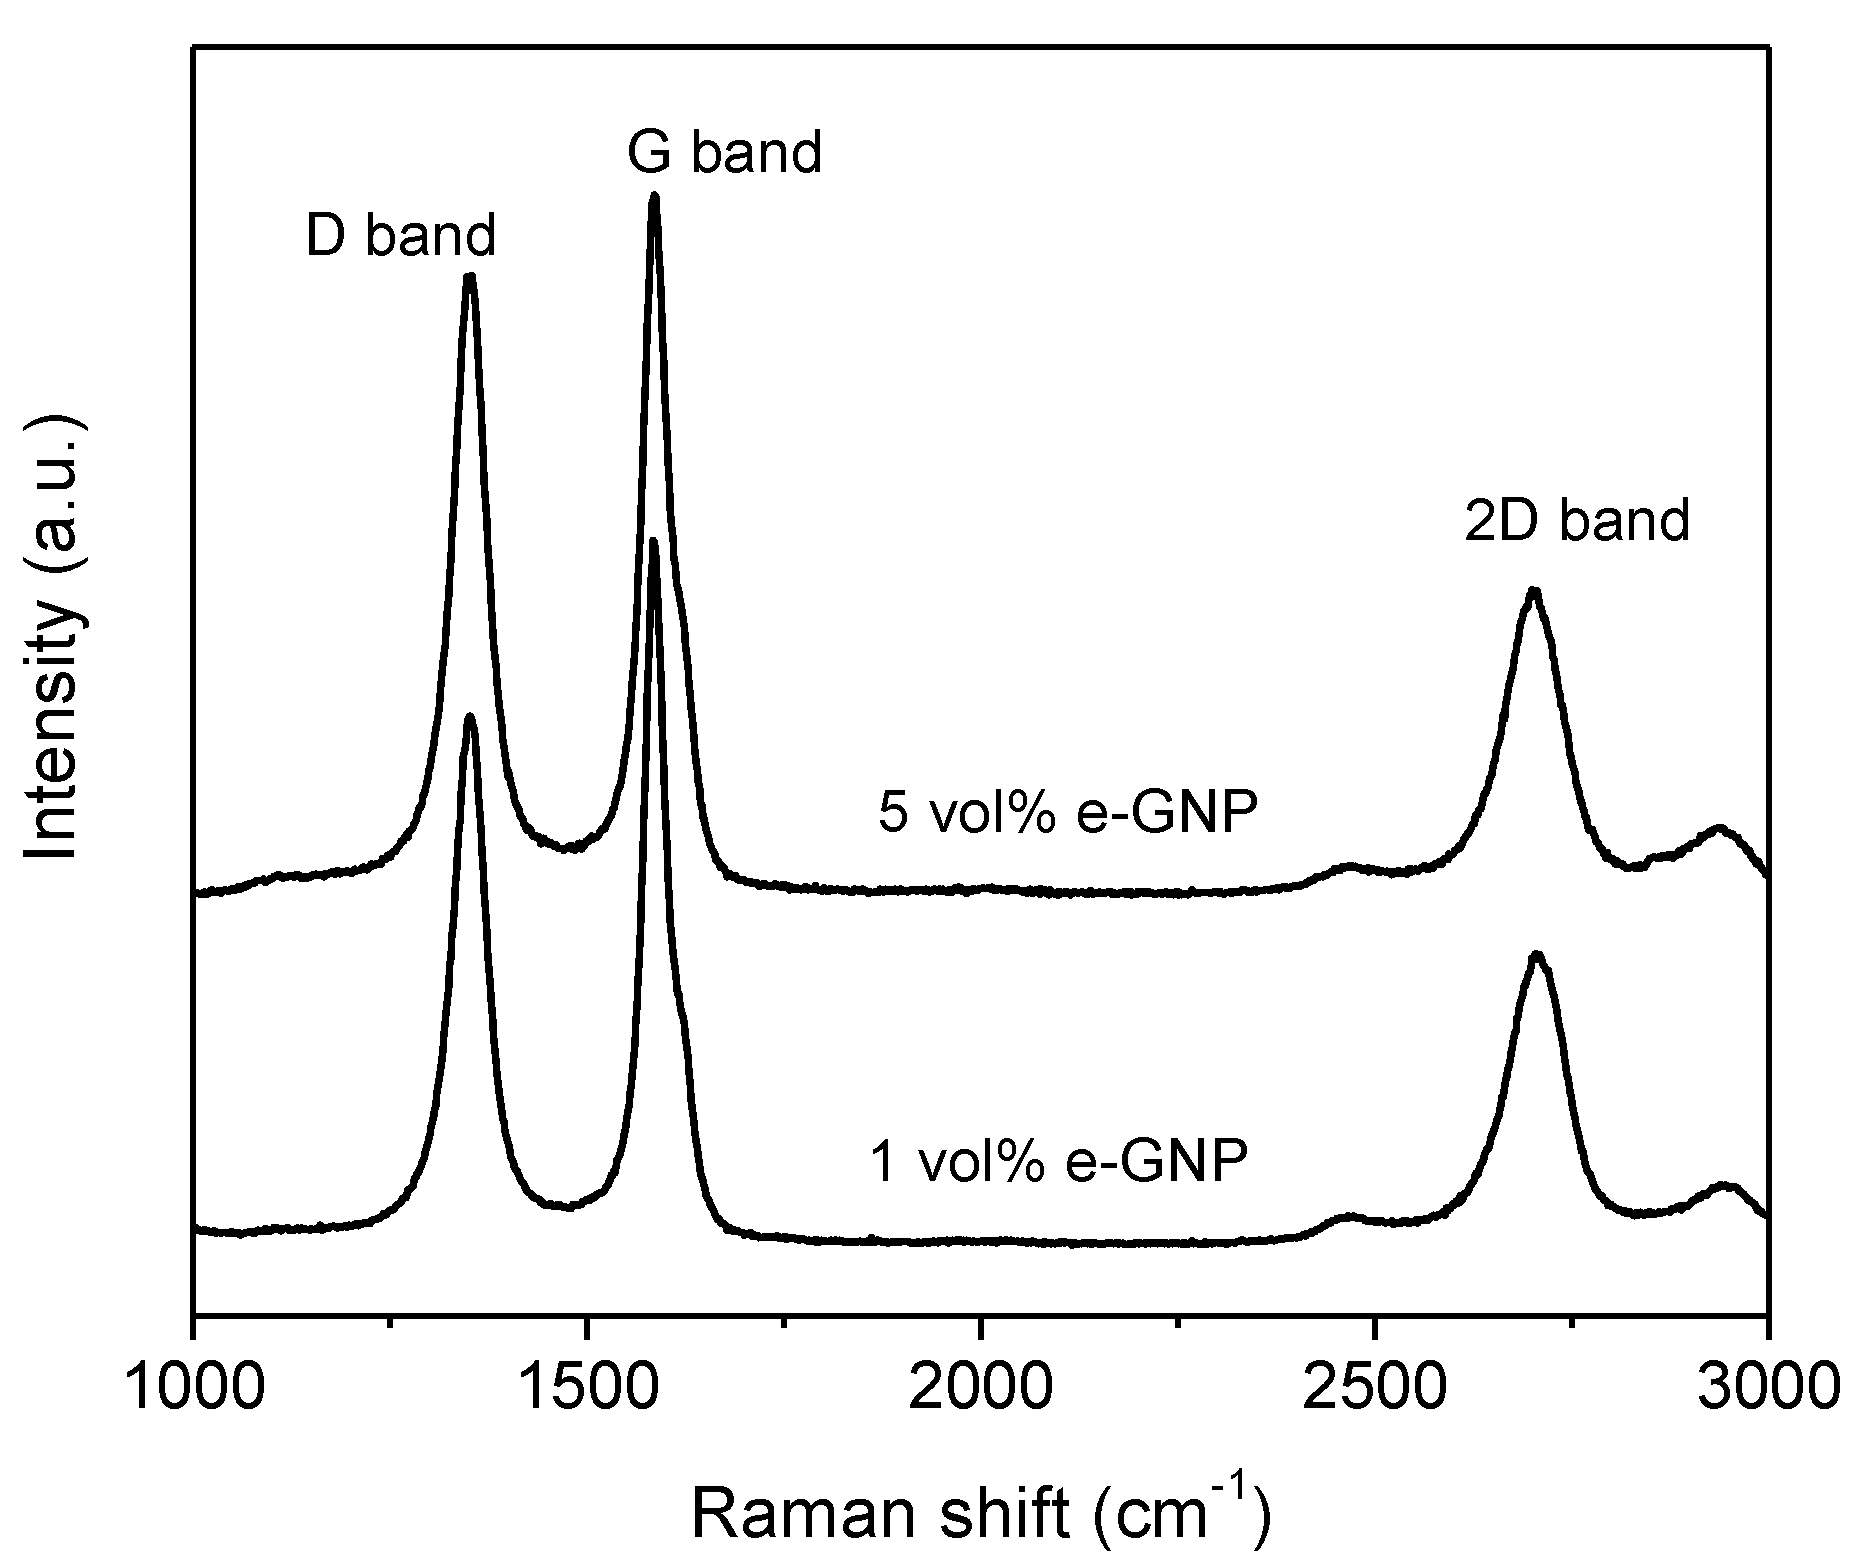


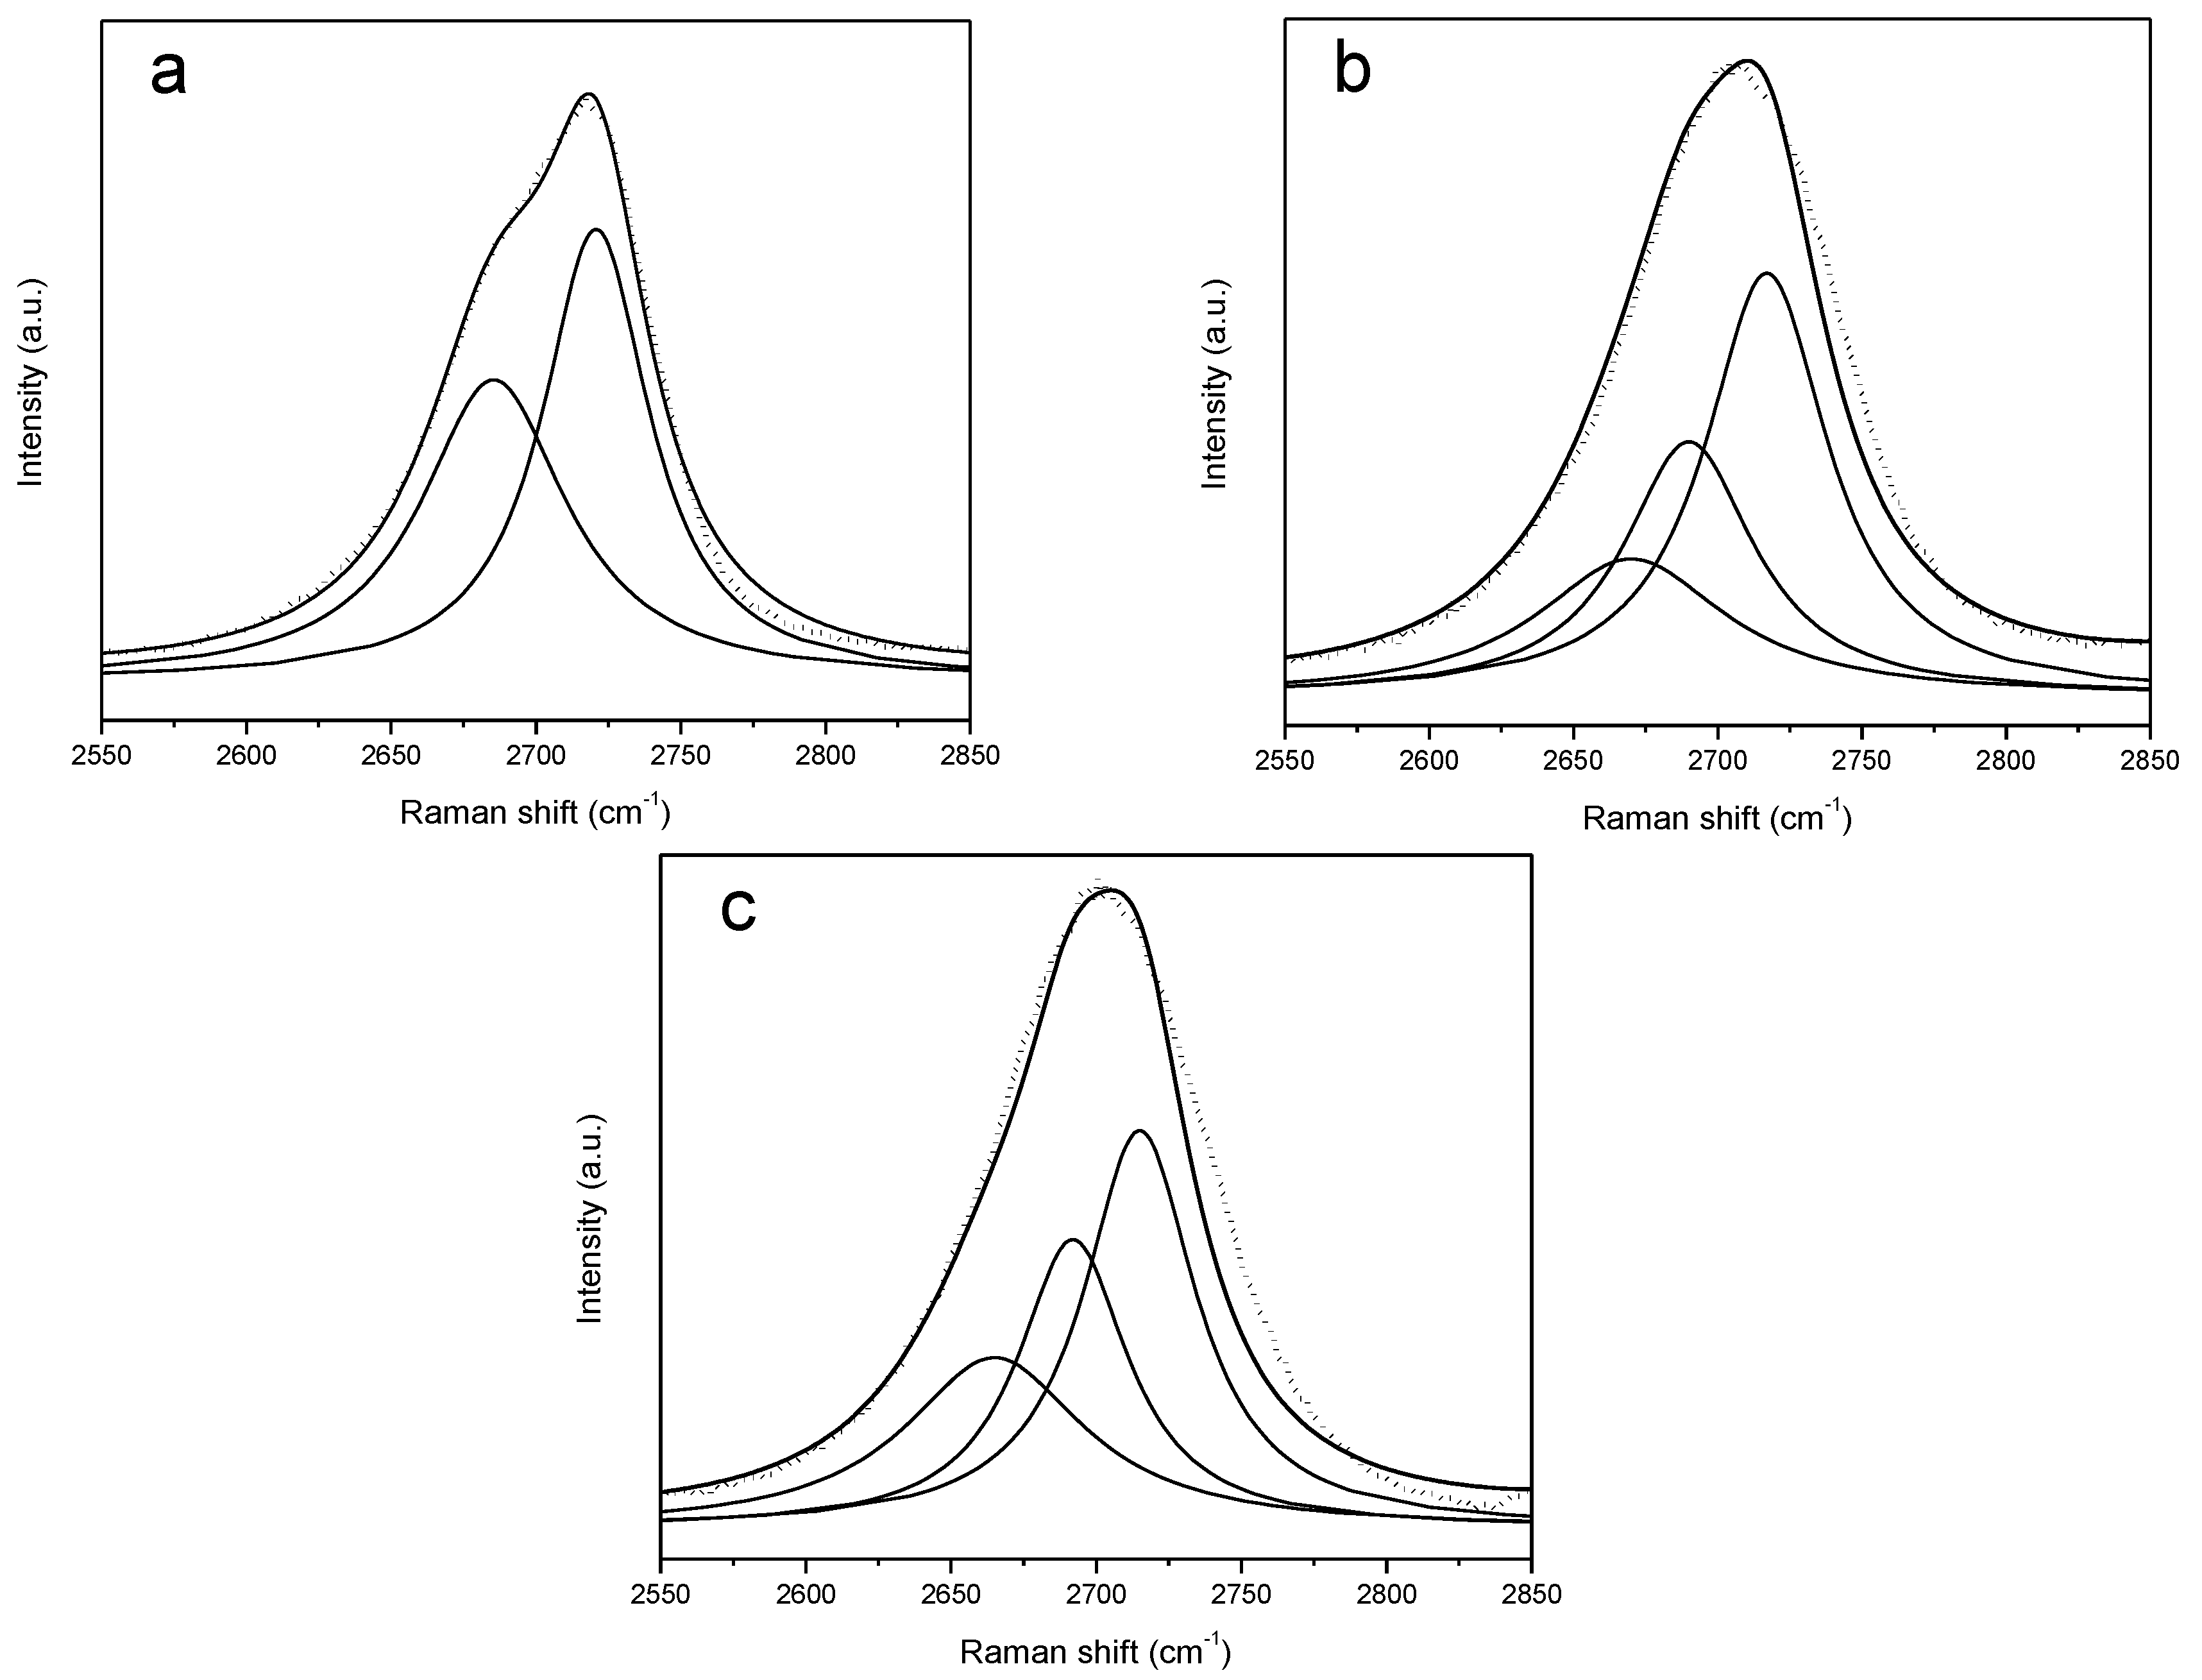
| Sample | ID*/IG | ID/IG | ID”/IG | ID’/IG |
|---|---|---|---|---|
| As-received GNP | 0.04 ± 0.02 | 0.33 ± 0.09 | 0.014 ± 0.006 | 0.028 ± 0.012 |
| 1 vol.% e-GNP powder | 0.15 ± 0.04 | 1.84 ± 0.11 | 0.07 ± 0.05 | 0.25 ± 0.04 |
| 5 vol.% e-GNP powder | 0.060 ± 0.015 | 1.3 ± 0.4 | 0.036 ± 0.008 | 0.18 ± 0.03 |
| 1 vol.% e-GNP sintered | 0.05 ± 0.03 | 1.24 ± 0.06 | 0.012 ± 0.004 | 0.140 ± 0.004 |
| 5 vol.% e-GNP sintered | 0.052 ± 0.011 | 1.25 ± 0.12 | 0.015 ± 0.010 | 0.144 ± 0.020 |
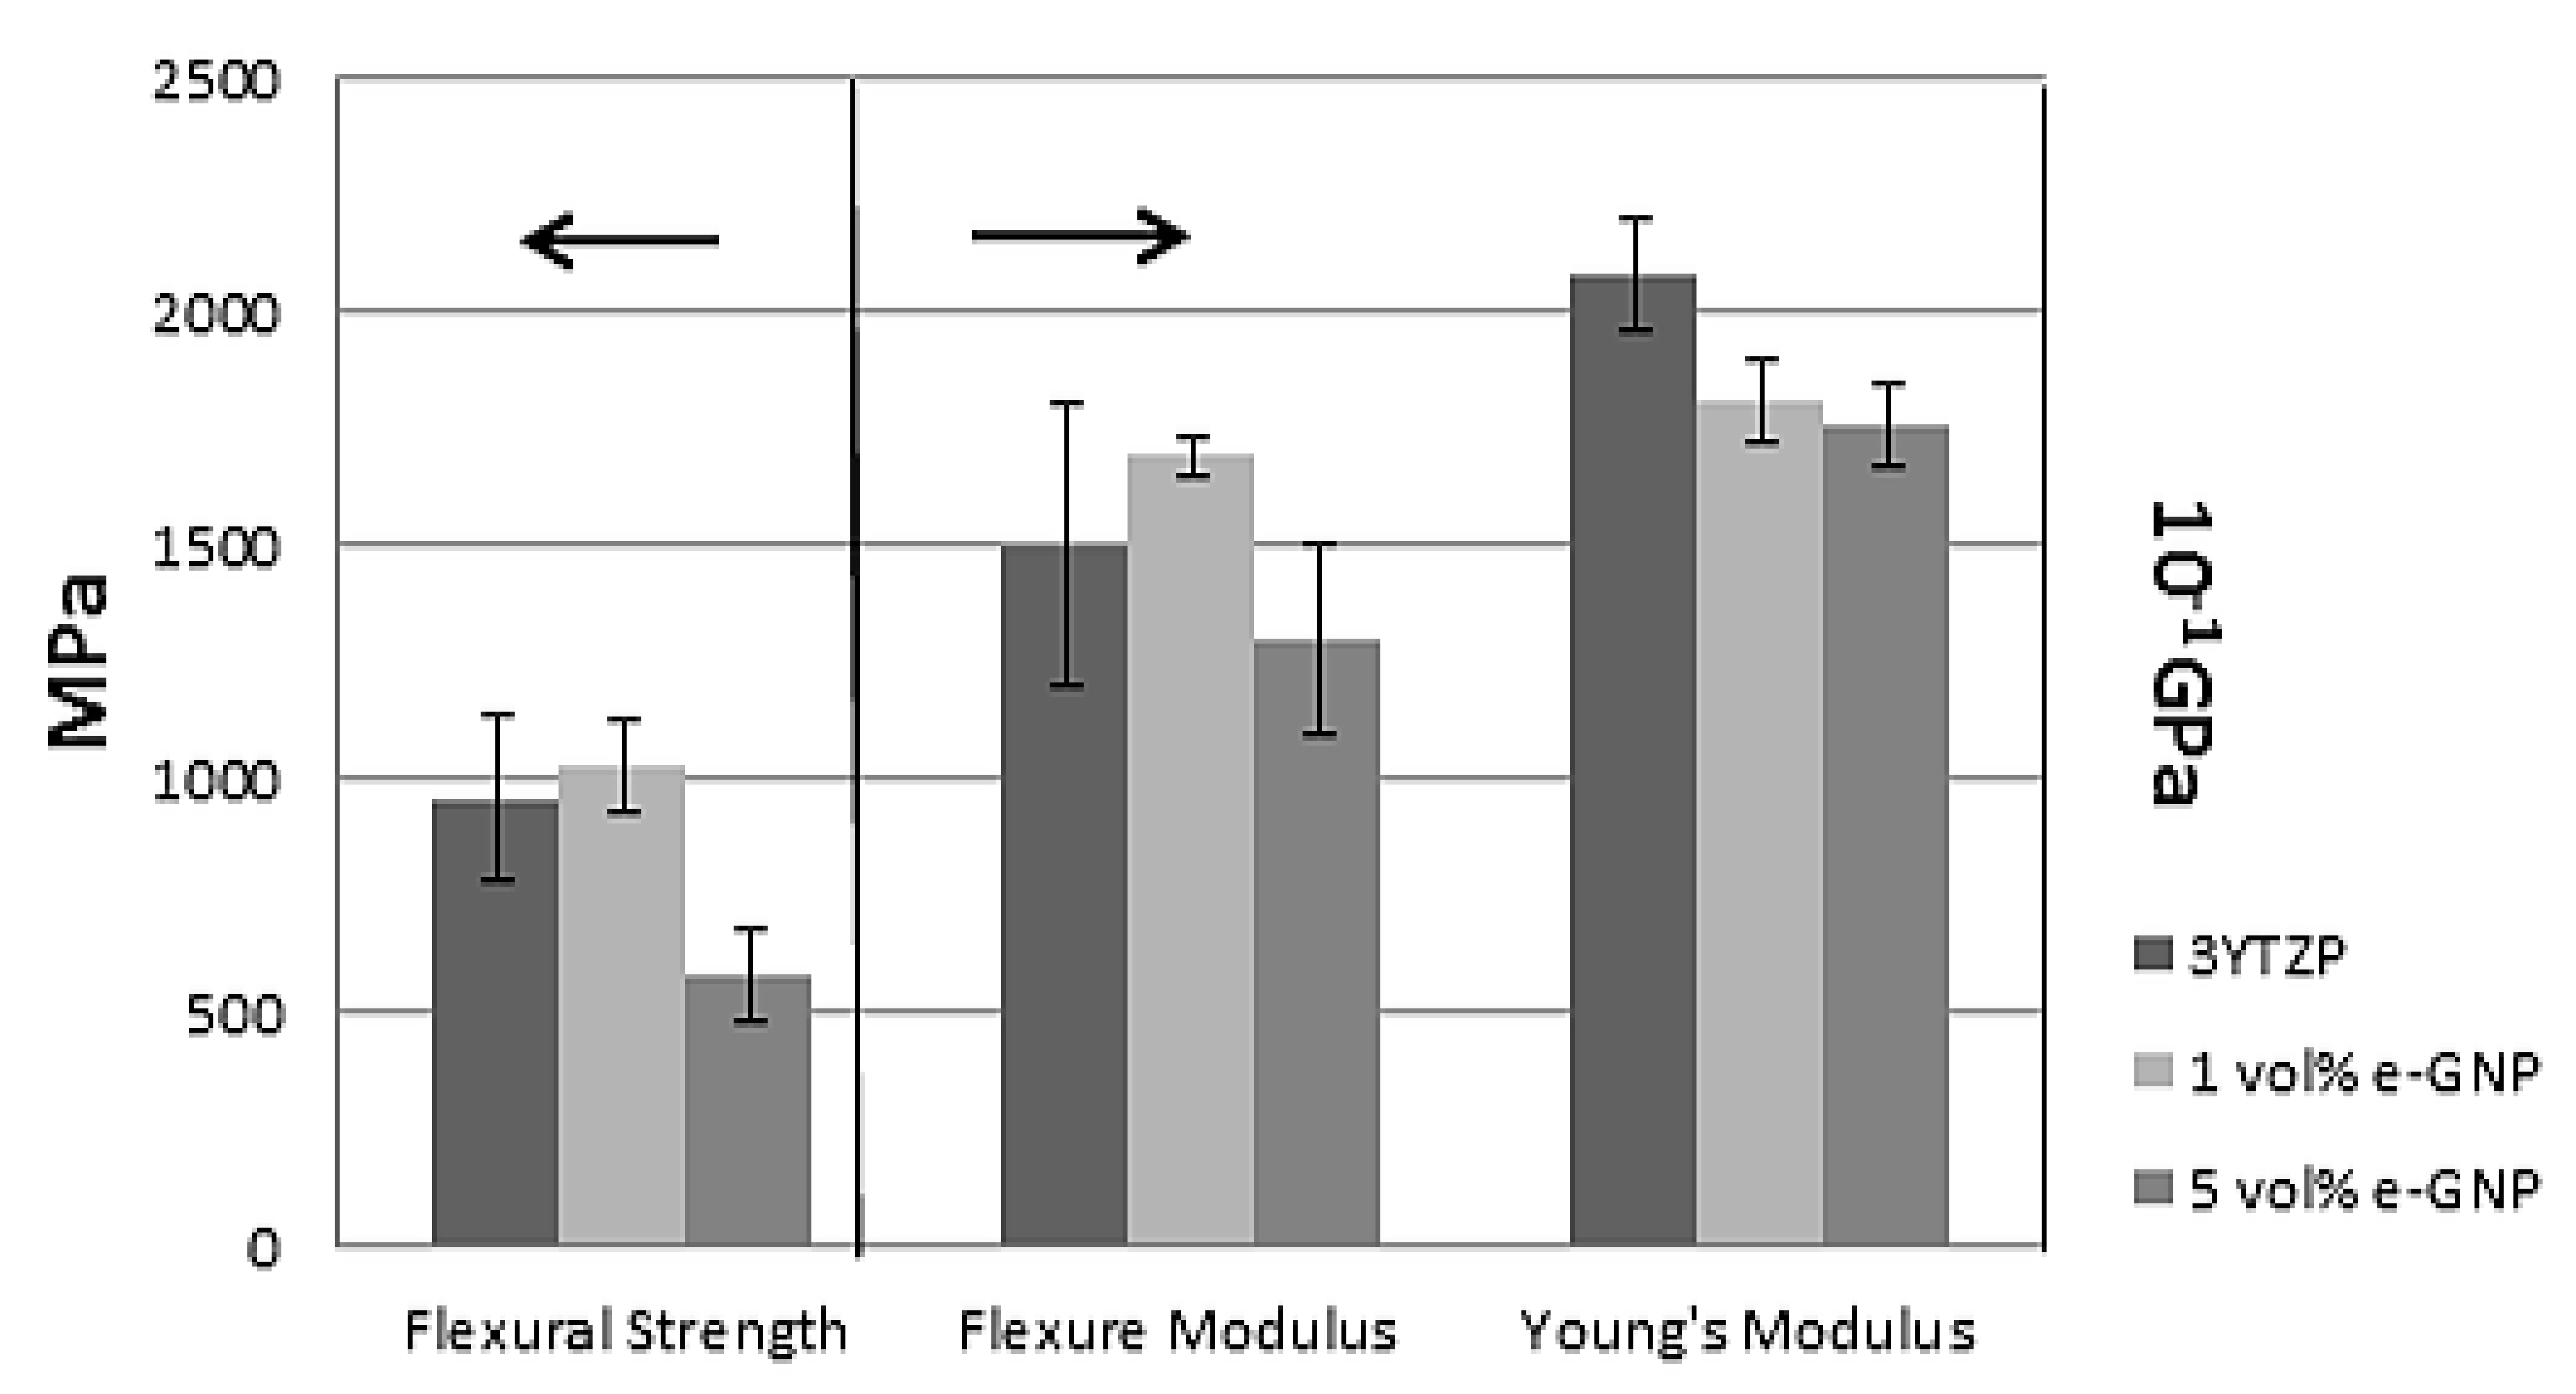
| 3YTZP | 1 vol.% e-GNP | 5 vol.% e-GNP |
|---|---|---|
| Flexural strength (MPa) | ||
| 780 | 1137 * | 662 * |
| 888 | 1055 | 644 |
| 1147 * | 943 | 455 |
| 1041 | 972 | 545 |
| 960 ± 180 | 1030 ± 100 | 580 ± 100 |
| Flexural modulus (GPa) | ||
| 170.0 | 172.3 | 153.1 |
| 149.1 | 165.3 | 122.1 |
| 176.2 | 170.7 | 131.6 |
| 110.1 | 168.4 | 112.8 |
| 150 ± 30 | 169 ± 4 | 130 ± 20 |
| 3YTZP | 1 vol.% e-GNP | 5 vol.% e-GNP | ||
|---|---|---|---|---|
| Young’s modulus, E (GPa) | 208 ± 12 | 181 ± 9 | 176 ± 9 | |
| Hardness HV (GPa) | Top surface | 13.9 ± 0.5 | 13.6 ± 0.8 | 11.9 ± 0.2 |
| Cross-section | 13.9 ± 0.5 | 12.7 ± 0.7 | 11.5 ± 0.6 | |
| 3YTZP | 1 vol.% e-GNP | 5 vol.% e-GNP | |||
|---|---|---|---|---|---|
| Crack length (μm) | Top surface | 134 ± 7 | 143 ± 6 | 139 ± 7 | |
| Cross-section * | H | - | 155 ± 4 | 141 ± 3 | |
| V | - | 145 ± 1 | 134 ± 4 | ||
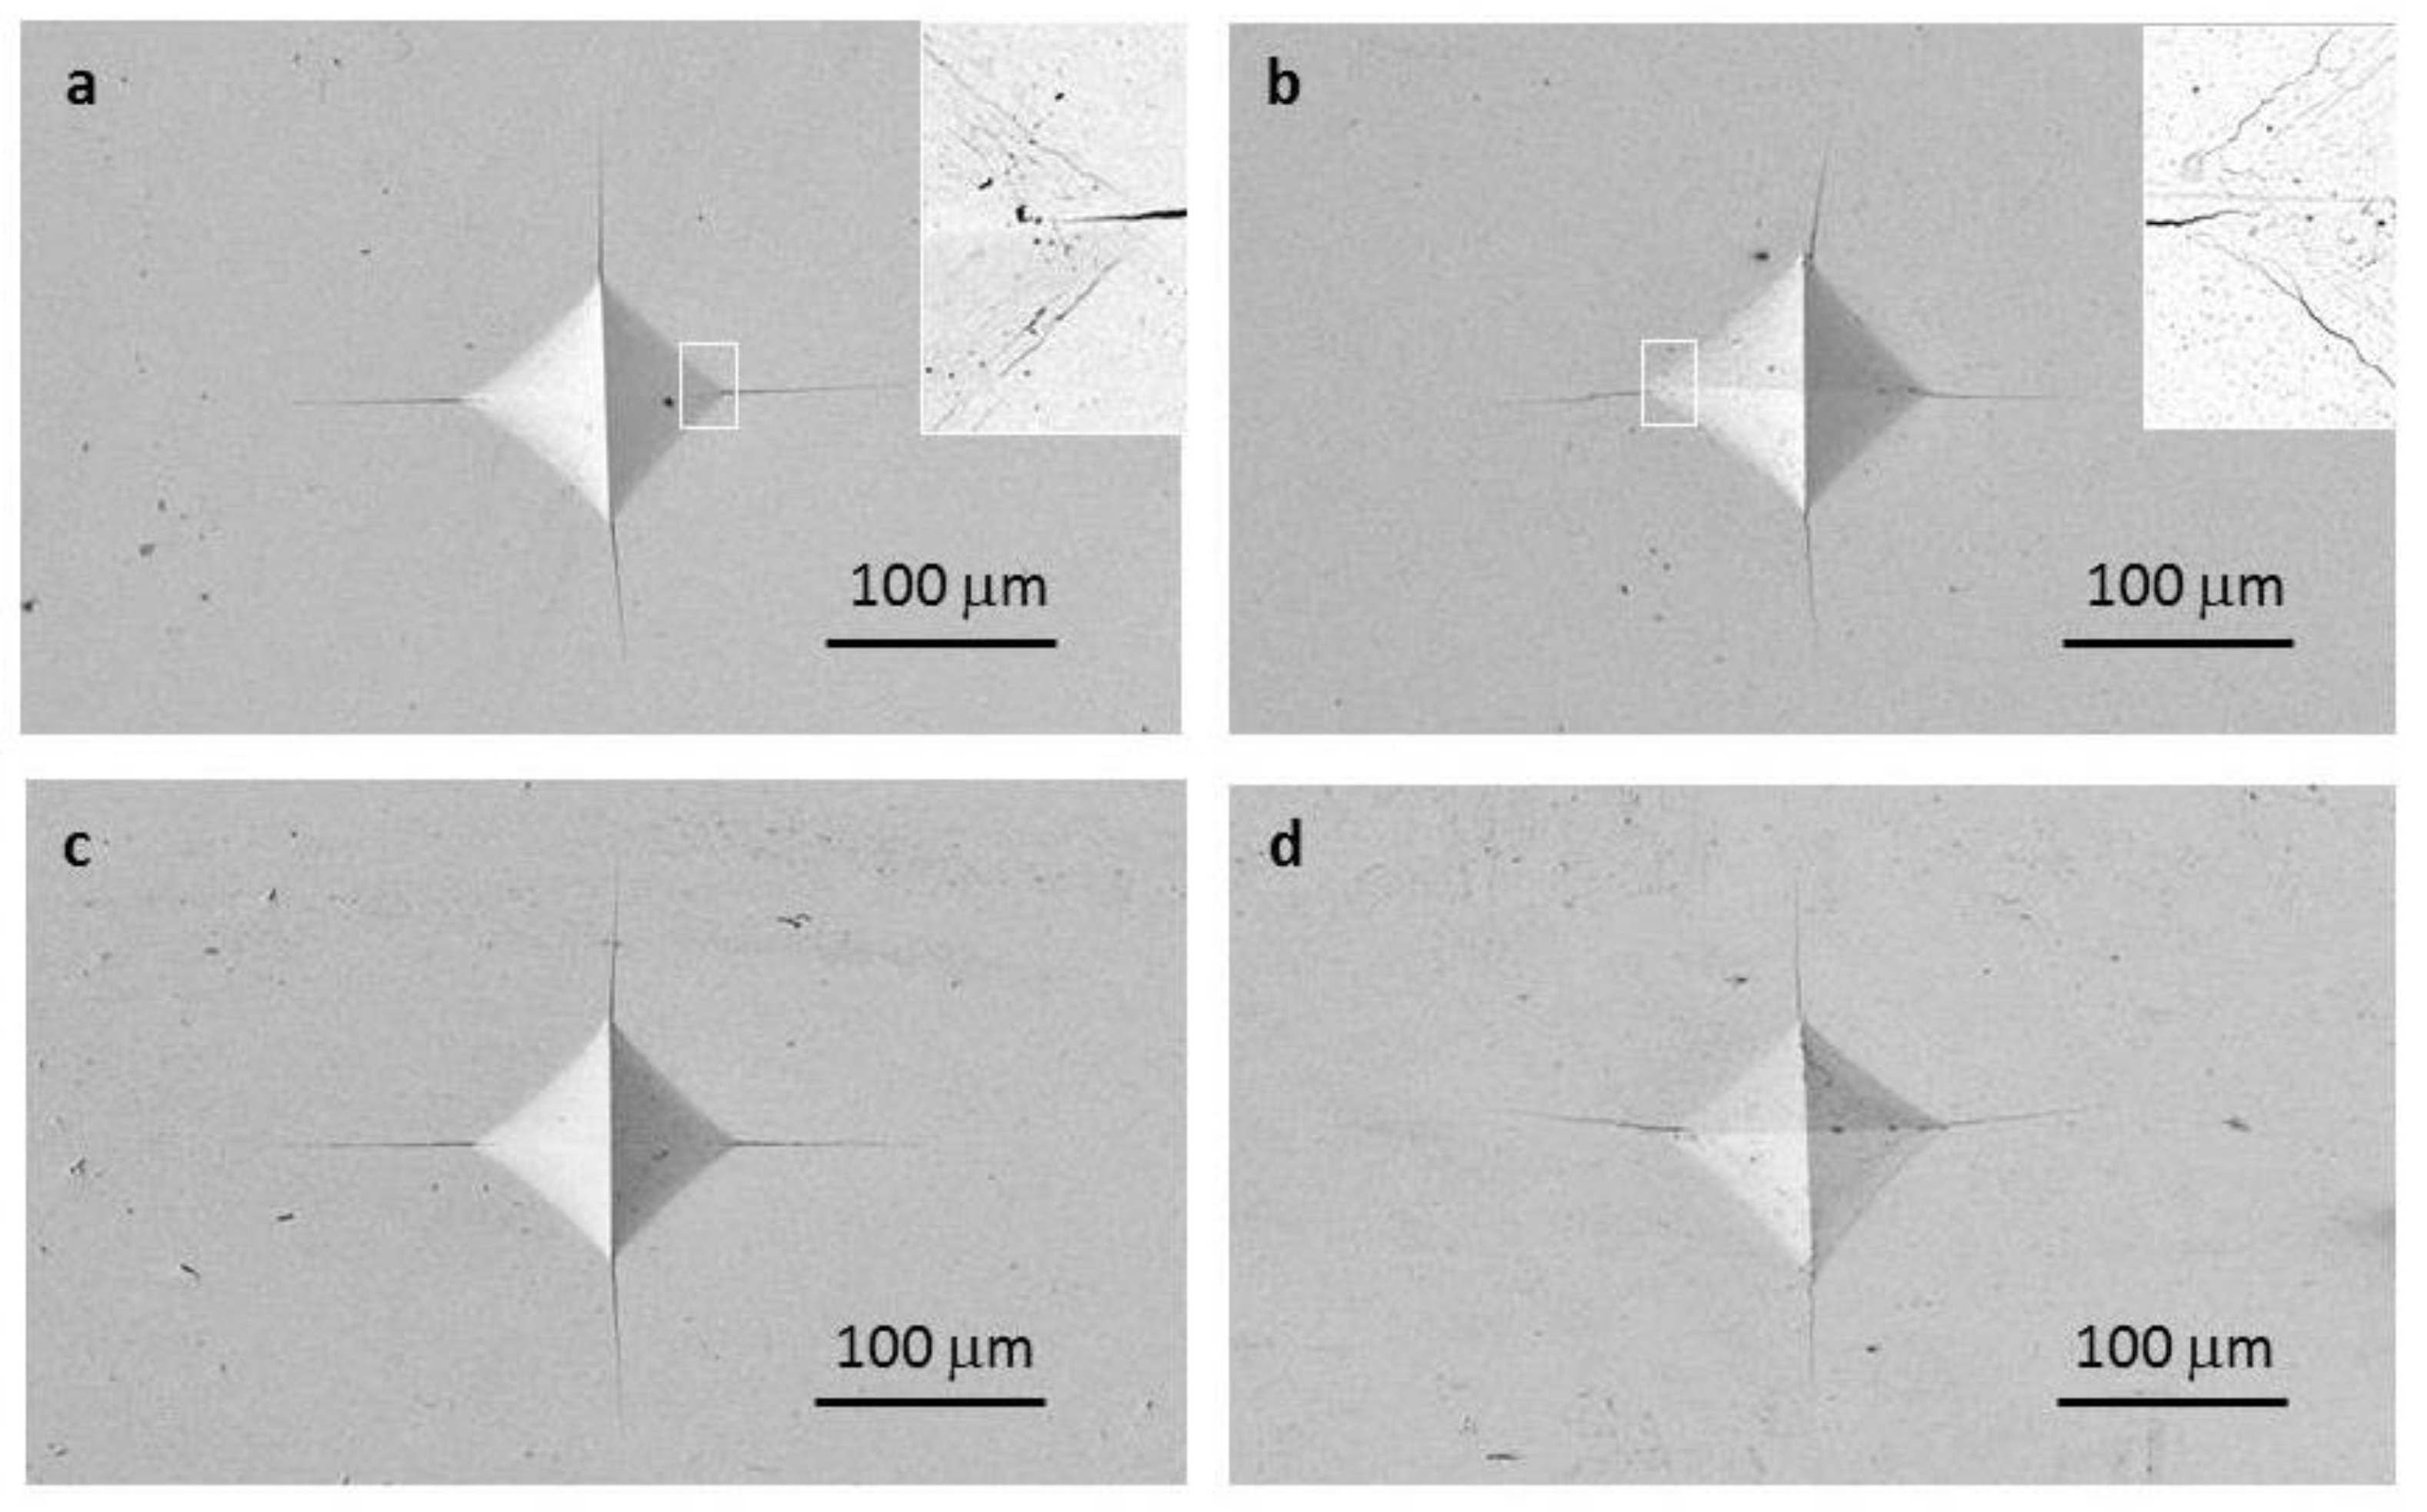
| KIC (MPa∙m−0.5) | 3.9 ± 0.3 | 3.4 ± 0.3 | 3.8 ± 0.4 | ||
© 2020 by the authors. Licensee MDPI, Basel, Switzerland. This article is an open access article distributed under the terms and conditions of the Creative Commons Attribution (CC BY) license (http://creativecommons.org/licenses/by/4.0/).
Share and Cite
Gallardo-López, Á.; Castillo-Seoane, J.; Muñoz-Ferreiro, C.; López-Pernía, C.; Morales-Rodríguez, A.; Poyato, R. Flexure Strength and Fracture Propagation in Zirconia Ceramic Composites with Exfoliated Graphene Nanoplatelets. Ceramics 2020, 3, 78-91. https://doi.org/10.3390/ceramics3010009
Gallardo-López Á, Castillo-Seoane J, Muñoz-Ferreiro C, López-Pernía C, Morales-Rodríguez A, Poyato R. Flexure Strength and Fracture Propagation in Zirconia Ceramic Composites with Exfoliated Graphene Nanoplatelets. Ceramics. 2020; 3(1):78-91. https://doi.org/10.3390/ceramics3010009
Chicago/Turabian StyleGallardo-López, Ángela, Javier Castillo-Seoane, Carmen Muñoz-Ferreiro, Cristina López-Pernía, Ana Morales-Rodríguez, and Rosalía Poyato. 2020. "Flexure Strength and Fracture Propagation in Zirconia Ceramic Composites with Exfoliated Graphene Nanoplatelets" Ceramics 3, no. 1: 78-91. https://doi.org/10.3390/ceramics3010009
APA StyleGallardo-López, Á., Castillo-Seoane, J., Muñoz-Ferreiro, C., López-Pernía, C., Morales-Rodríguez, A., & Poyato, R. (2020). Flexure Strength and Fracture Propagation in Zirconia Ceramic Composites with Exfoliated Graphene Nanoplatelets. Ceramics, 3(1), 78-91. https://doi.org/10.3390/ceramics3010009


