Article

Mechanism of Carbon Contamination in Transparent MgAl2O4 and Y3Al5O12 Ceramics Sintered by Spark Plasma Sintering

INSA-Lyon, MATEIS, University of Lyon, UMR CNRS 5510, 7 Avenue Jean Capelle, F-69621 Villeurbanne, France
*
Author to whom correspondence should be addressed.
Ceramics 2019, 2(4), 612-619; https://doi.org/10.3390/ceramics2040048
Submission received: 11 October 2019 / Revised: 21 November 2019 / Accepted: 4 December 2019 / Published: 13 December 2019

Abstract

:
An investigation of MgAl2O4 spinel and Y3Al2O5 (YAG) materials sintered by spark plasma sintering (SPS) was performed. The optical properties of the materials are modified depending on the powder source and the SPS sintering conditions. Spectrophotometer and Raman analysis are presented in this work, along with optical and scanning electron microscope (SEM) observations and cathodoluminescence analysis. The results show a correlation between carbon contamination and the optical properties of the materials. Herein, the source of the contamination is explained, along with its genesis and diffusion. The carbon contamination originates from the powder itself (carbonates), as well as the SPS environment (papiex® graphite foil, graphite die, graphite felt) to form carbon clusters. During the high-temperature SPS process, carbon from those carbon clusters diffuses, resulting in an increase in the contamination volume, thereby increasing the light absorption.

1. Introduction

Extremely high-density polycrystalline ceramics are regarded as promising materials due to their optical properties, such as their high transparency in the near ultraviolet (0.16 µm) to the mid-infrared (10 µm) range. Compared to single-crystal ceramics, polycrystalline ceramics demonstrate better performance in terms of mechanical properties [1,2,3,4,5]. The MgAl2O4 spinel and Y3Al5O12 (YAG) are the most widely used transparent ceramics materials, as they are used for several optical applications, including transparent armor for air and ground vehicles, optical lenses, windows for lasers, high-pressure arc lamps, and refractories and electronic ceramics [6,7,8,9,10].
The fabrication of these materials by spark plasma sintering (SPS) possesses some advantages over classical techniques such as hot pressing and hot isostatic pressing. In fact, the SPS technique produces dense ceramics at lower temperatures in a shorter time. For example, transparent and dense MgAl2O4 can be obtained at a temperature of 1300 °C after only a 20 min soak, without sintering aids [11].
To obtain ceramics with high transparency by SPS sintering, many factors have to be controlled, including the sintering conditions, the starting powder quality, and the setup environment. Transparency losses are the result of either absorption or light scattering (refractive index variation between grains (birefringence), grain porosity, and grain secondary phases). The main outcome of absorption is the coloring, which is the consequence of lattice defects, such as electrons trapped in oxygen vacancies (referred to as color centers F or F+) and carbon contamination [12]. Several studies have been published aiming towards a reduction in the coloring by SPS. Frage et al. [13] demonstrated an improved in-line transmittance of 65% at λ = 550 nm for a commercial powder doped with 1 wt. % LiF and sintered by SPS. Morita et al. [14] reported the effect of carbon phases arising from the presence of carbonate in the raw powder on optical transmission. This results in coloring under SPS sintering conditions. Moreover, they showed that the pre- and post-treatments of the spinel are able to reduce its coloring. Carbon contamination can also be attributed to the graphite die that has been used during the SPS, as well as the possible specific heating process in SPS. Those factors may also contribute to the migration of carbon in the bulk through open pores during the process of fabrication by SPS [15,16]. G. Bernard-Granger et al. [17] suggested that carbon contamination arises from a CO-containing residual atmosphere during the SPS experiments, but they also conceded that, for an unexplained reason and via an unexplained mechanism, carbon-based particles (mostly graphite) precipitate throughout the bulk of the sample. Meir et al. [18] observed the existence of small dark spots in dense specimens, and they also suggested that these originated in the composition of the atmosphere within the SPS setup (Ar and carbon oxides CO, CO2). Precipitation of carbon on the free surface of the pores may, in principle, take place.
Therefore, the objectives of this work are to understand the coloring sources and to know how they are generated.

2. Experimental Procedure

Commercial powders MgAl2O4 (Baikowski, France) and Y3Al5O12 containing 1 at. % of Cerium substituted for Yttrium for luminescence (Baikowski, France) were used (see Table 1) for the elaboration of dense specimens by SPS using HP D25 (FCT, Germany). Two different SPS graphite die diameters were tested (20 and 40 mm) using papiex® graphite foil between the powder and the die. For improved temperature accuracy, the vertical pyrometer was used for the die with a diameter of 40 mm, rather than the horizontal pyrometer, which was used for the 20 mm die. A graphite insulating felt was used around the die to limit the heat loss by radiation for the samples C and D, which have large diameters. For all of the other samples, no graphite felt was used. For all of the samples, 72 MPa was applied throughout the process. The SPS sintering conditions are summarized in Table 1, along with the diameters of the sintered samples; the SPS thermal cycles are shown in Figure 1.
Moreover, the spinel samples were characterized using Raman spectroscopy (EnSpectr R532®) with an excitation wavelength (λ) of 532 nm, and SEM cathodoluminescence was performed using Zeiss Supra 55VP equipped with a cathodoluminescence system. By contrast, optical observations were made using a microscope (Hirox KH 7700), and a numerical camera with a macro lens canon 70D was also used. In addition, the optical properties of the samples were obtained using a spectrophotometer (JASCO V-670) at λ = 550 nm, with a normalized thickness of 1 mm for all the samples.

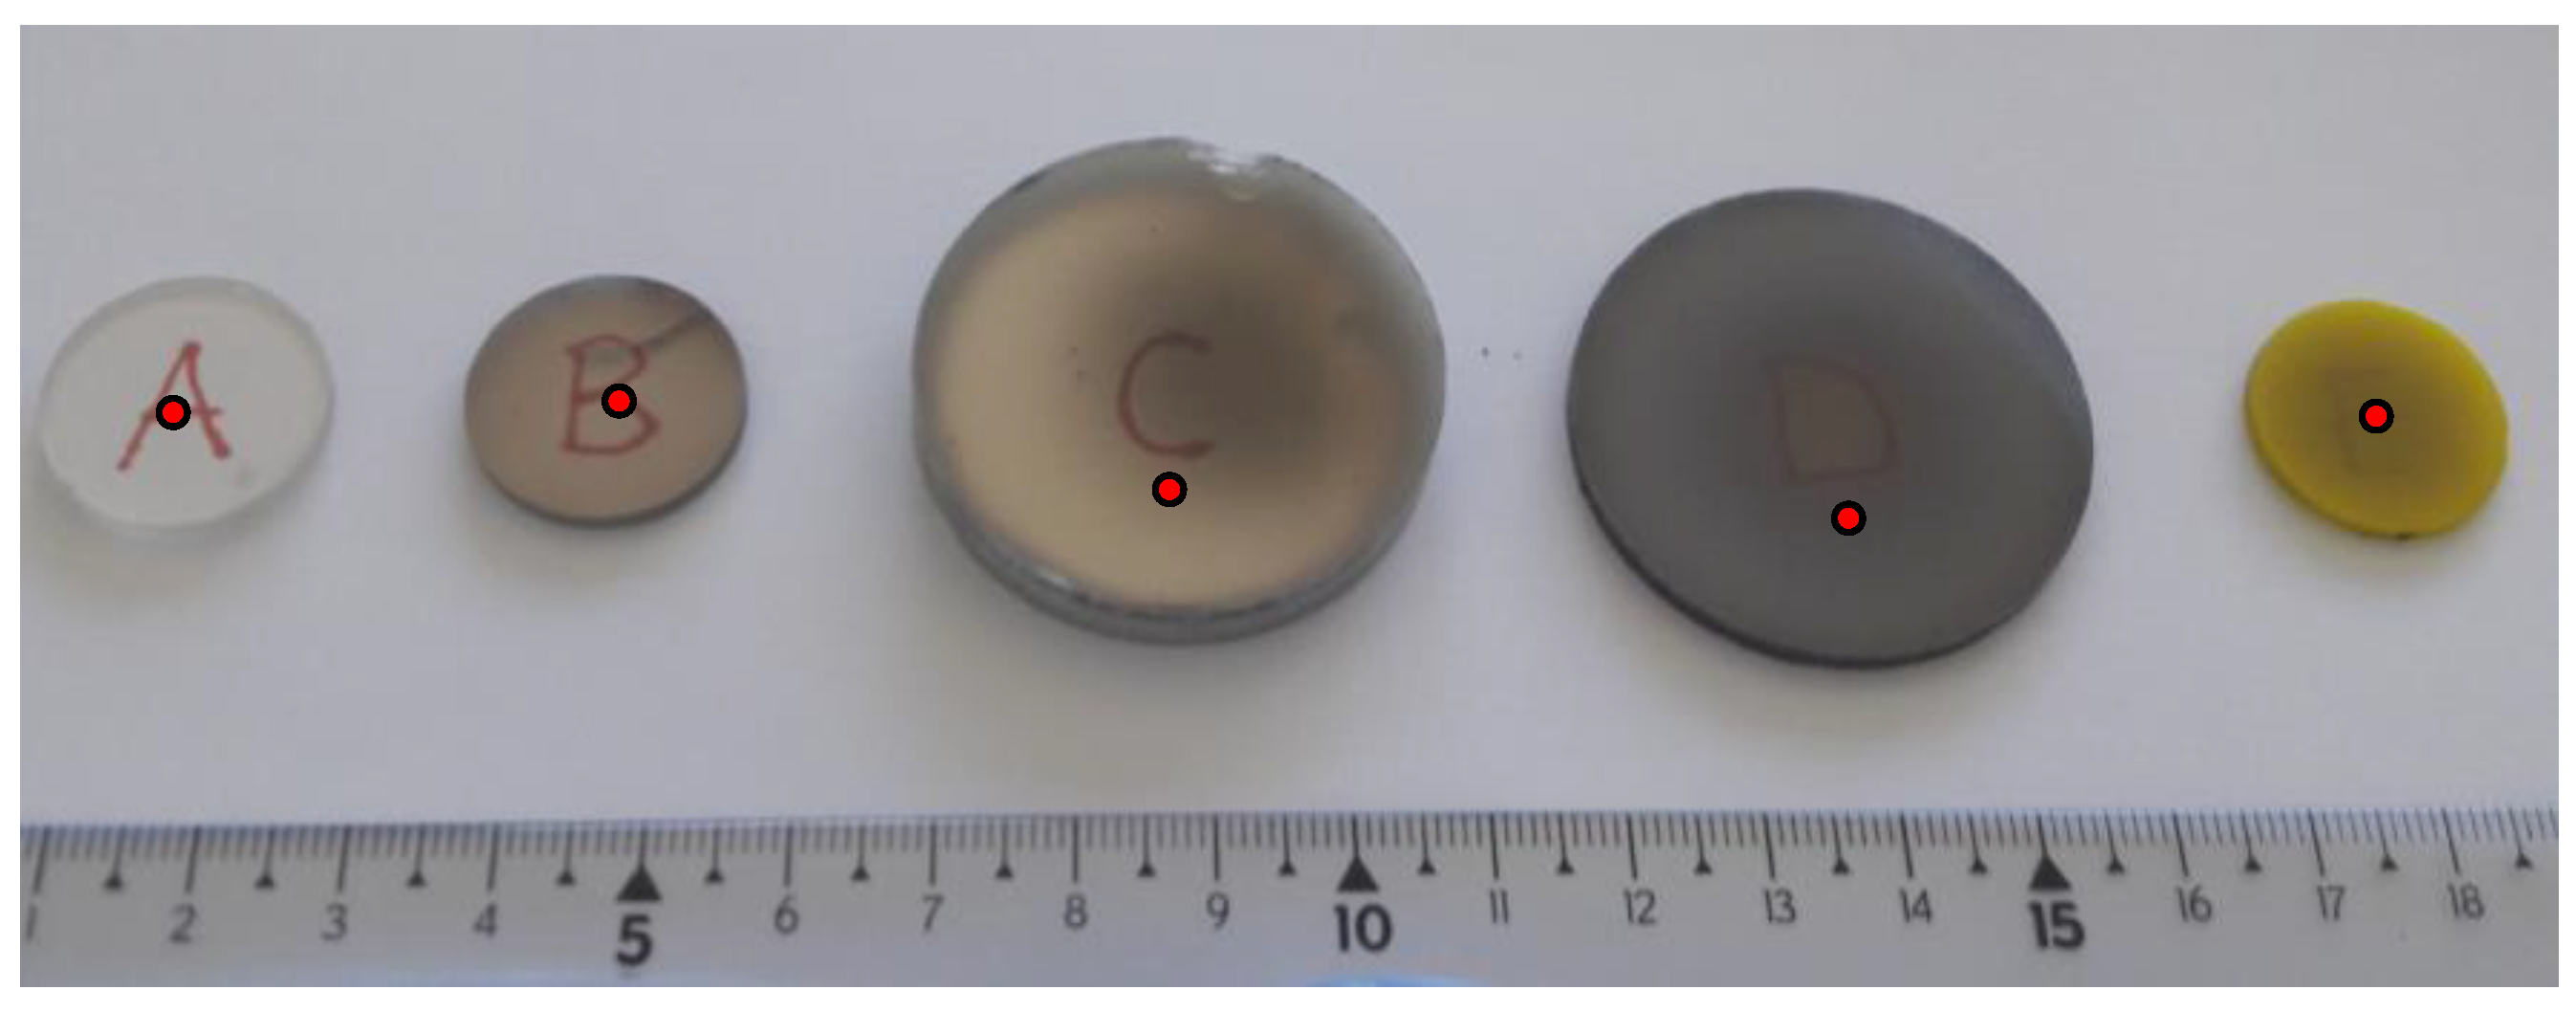
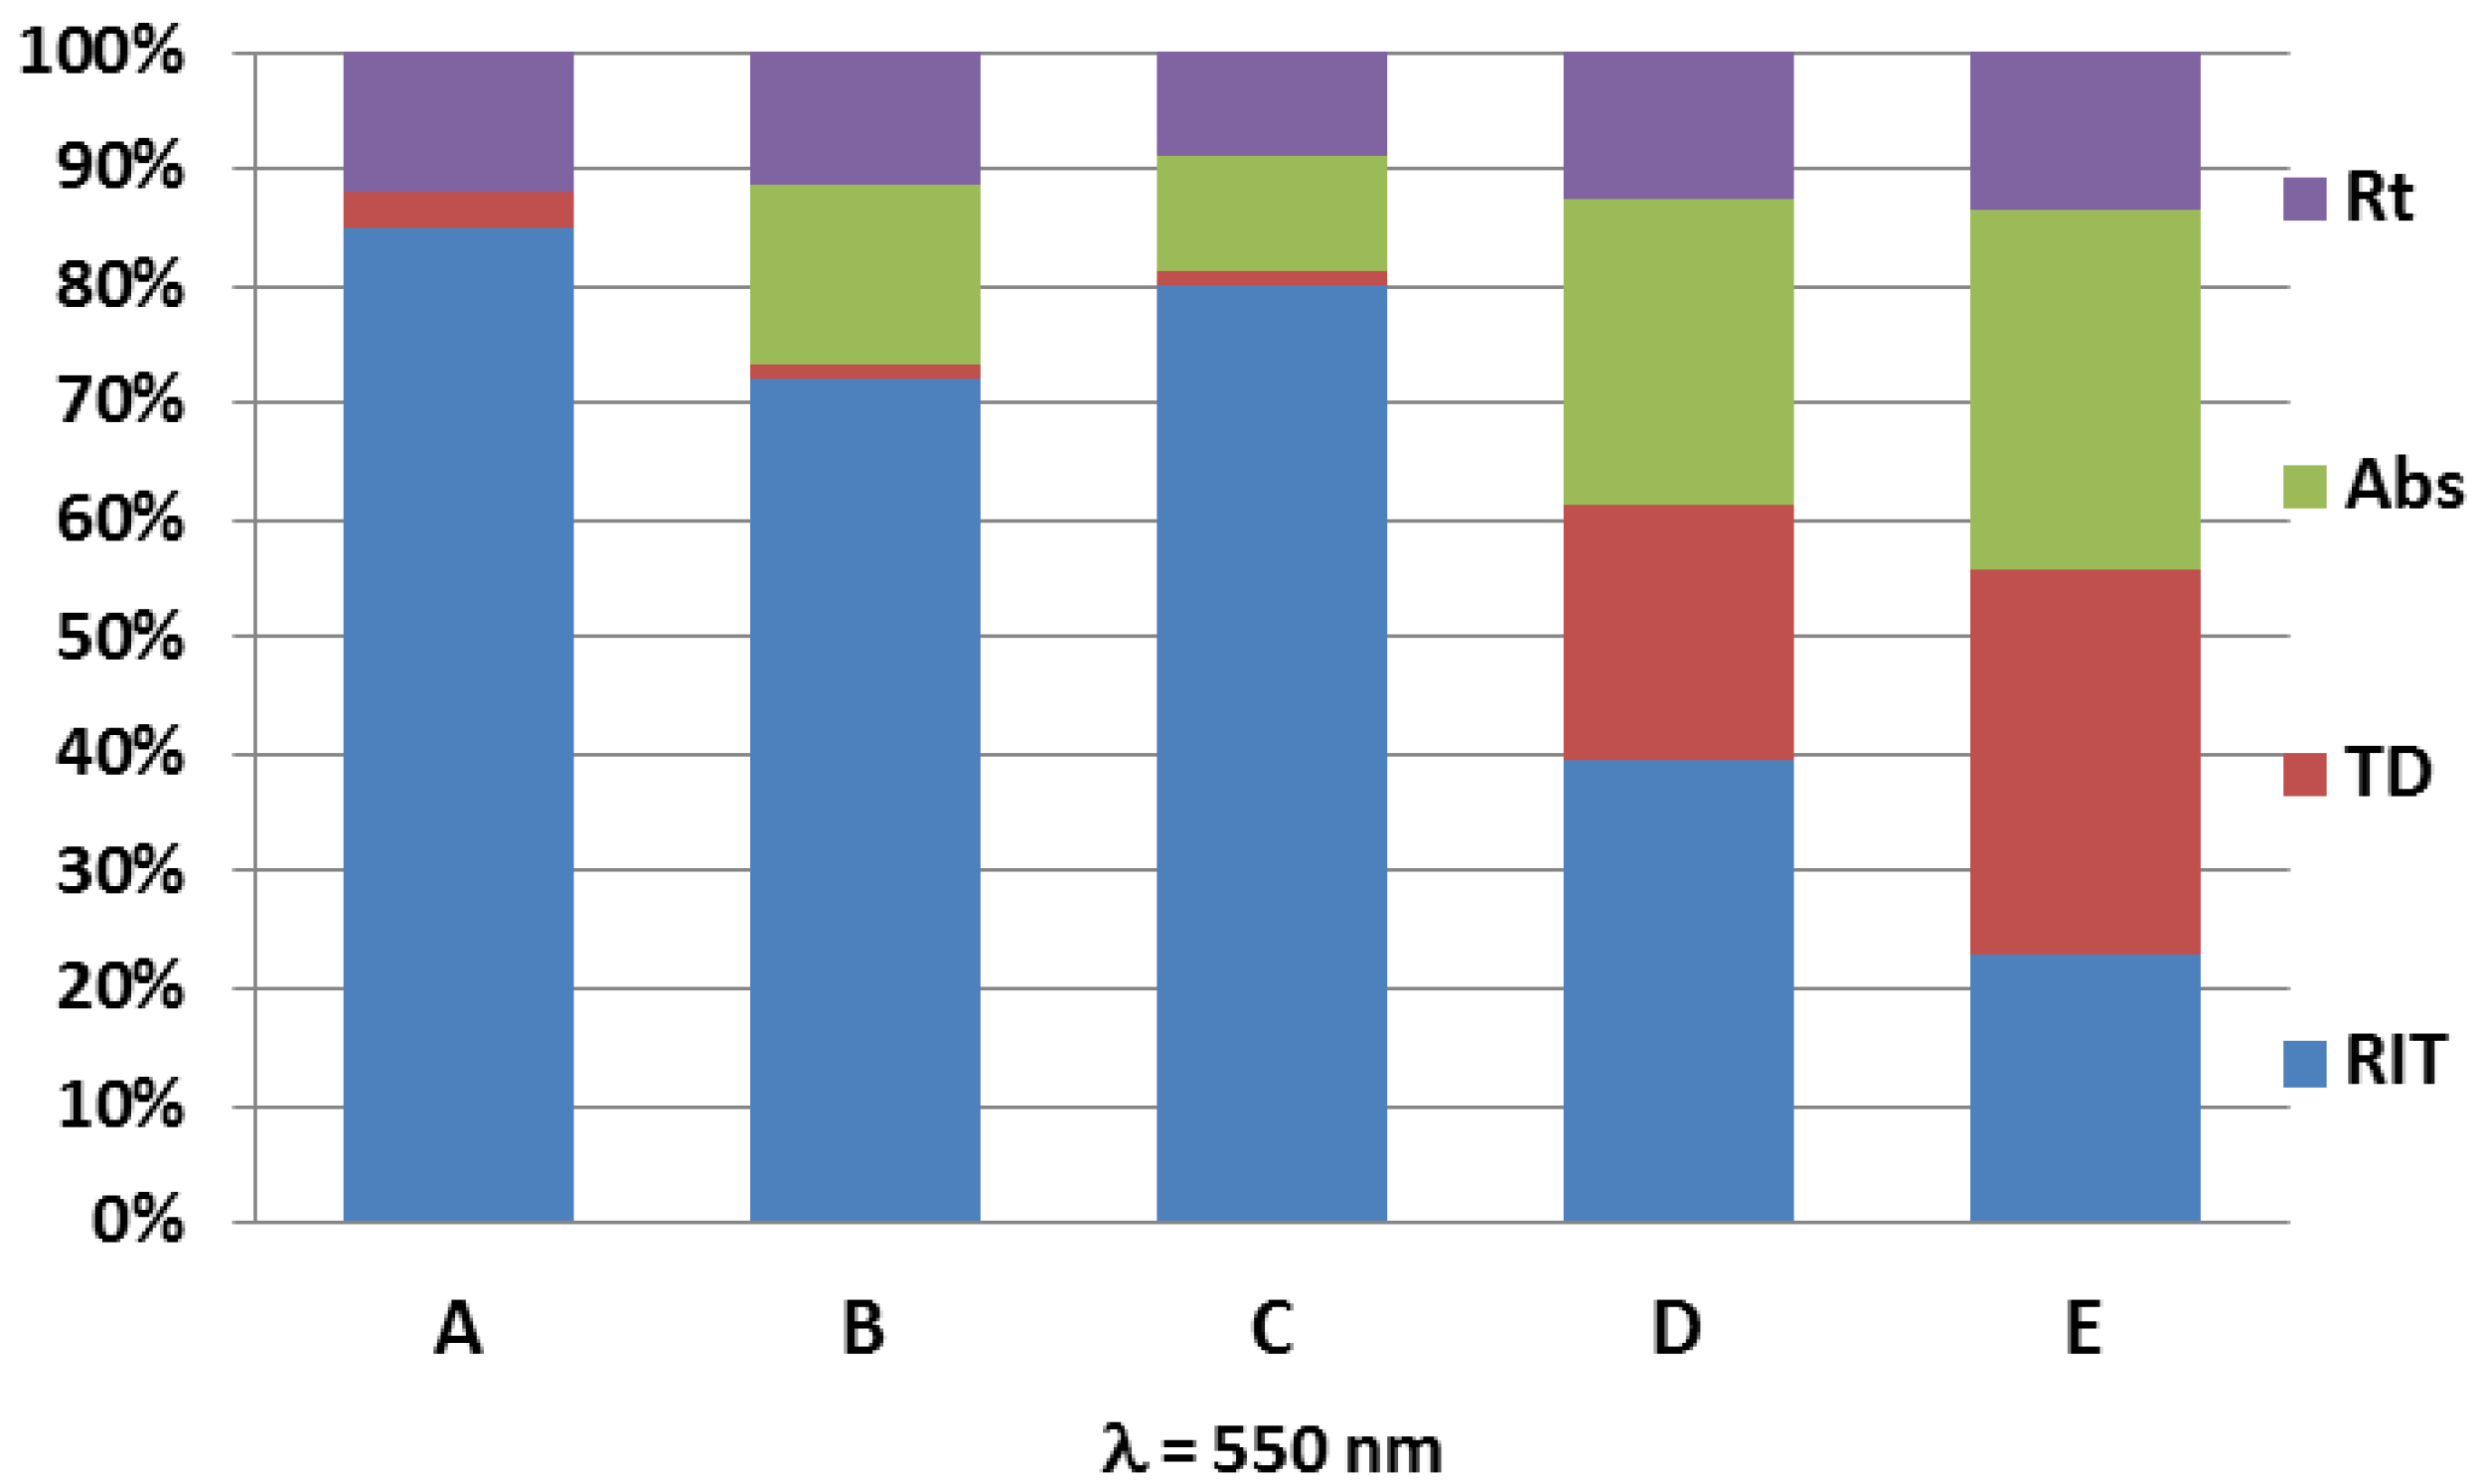
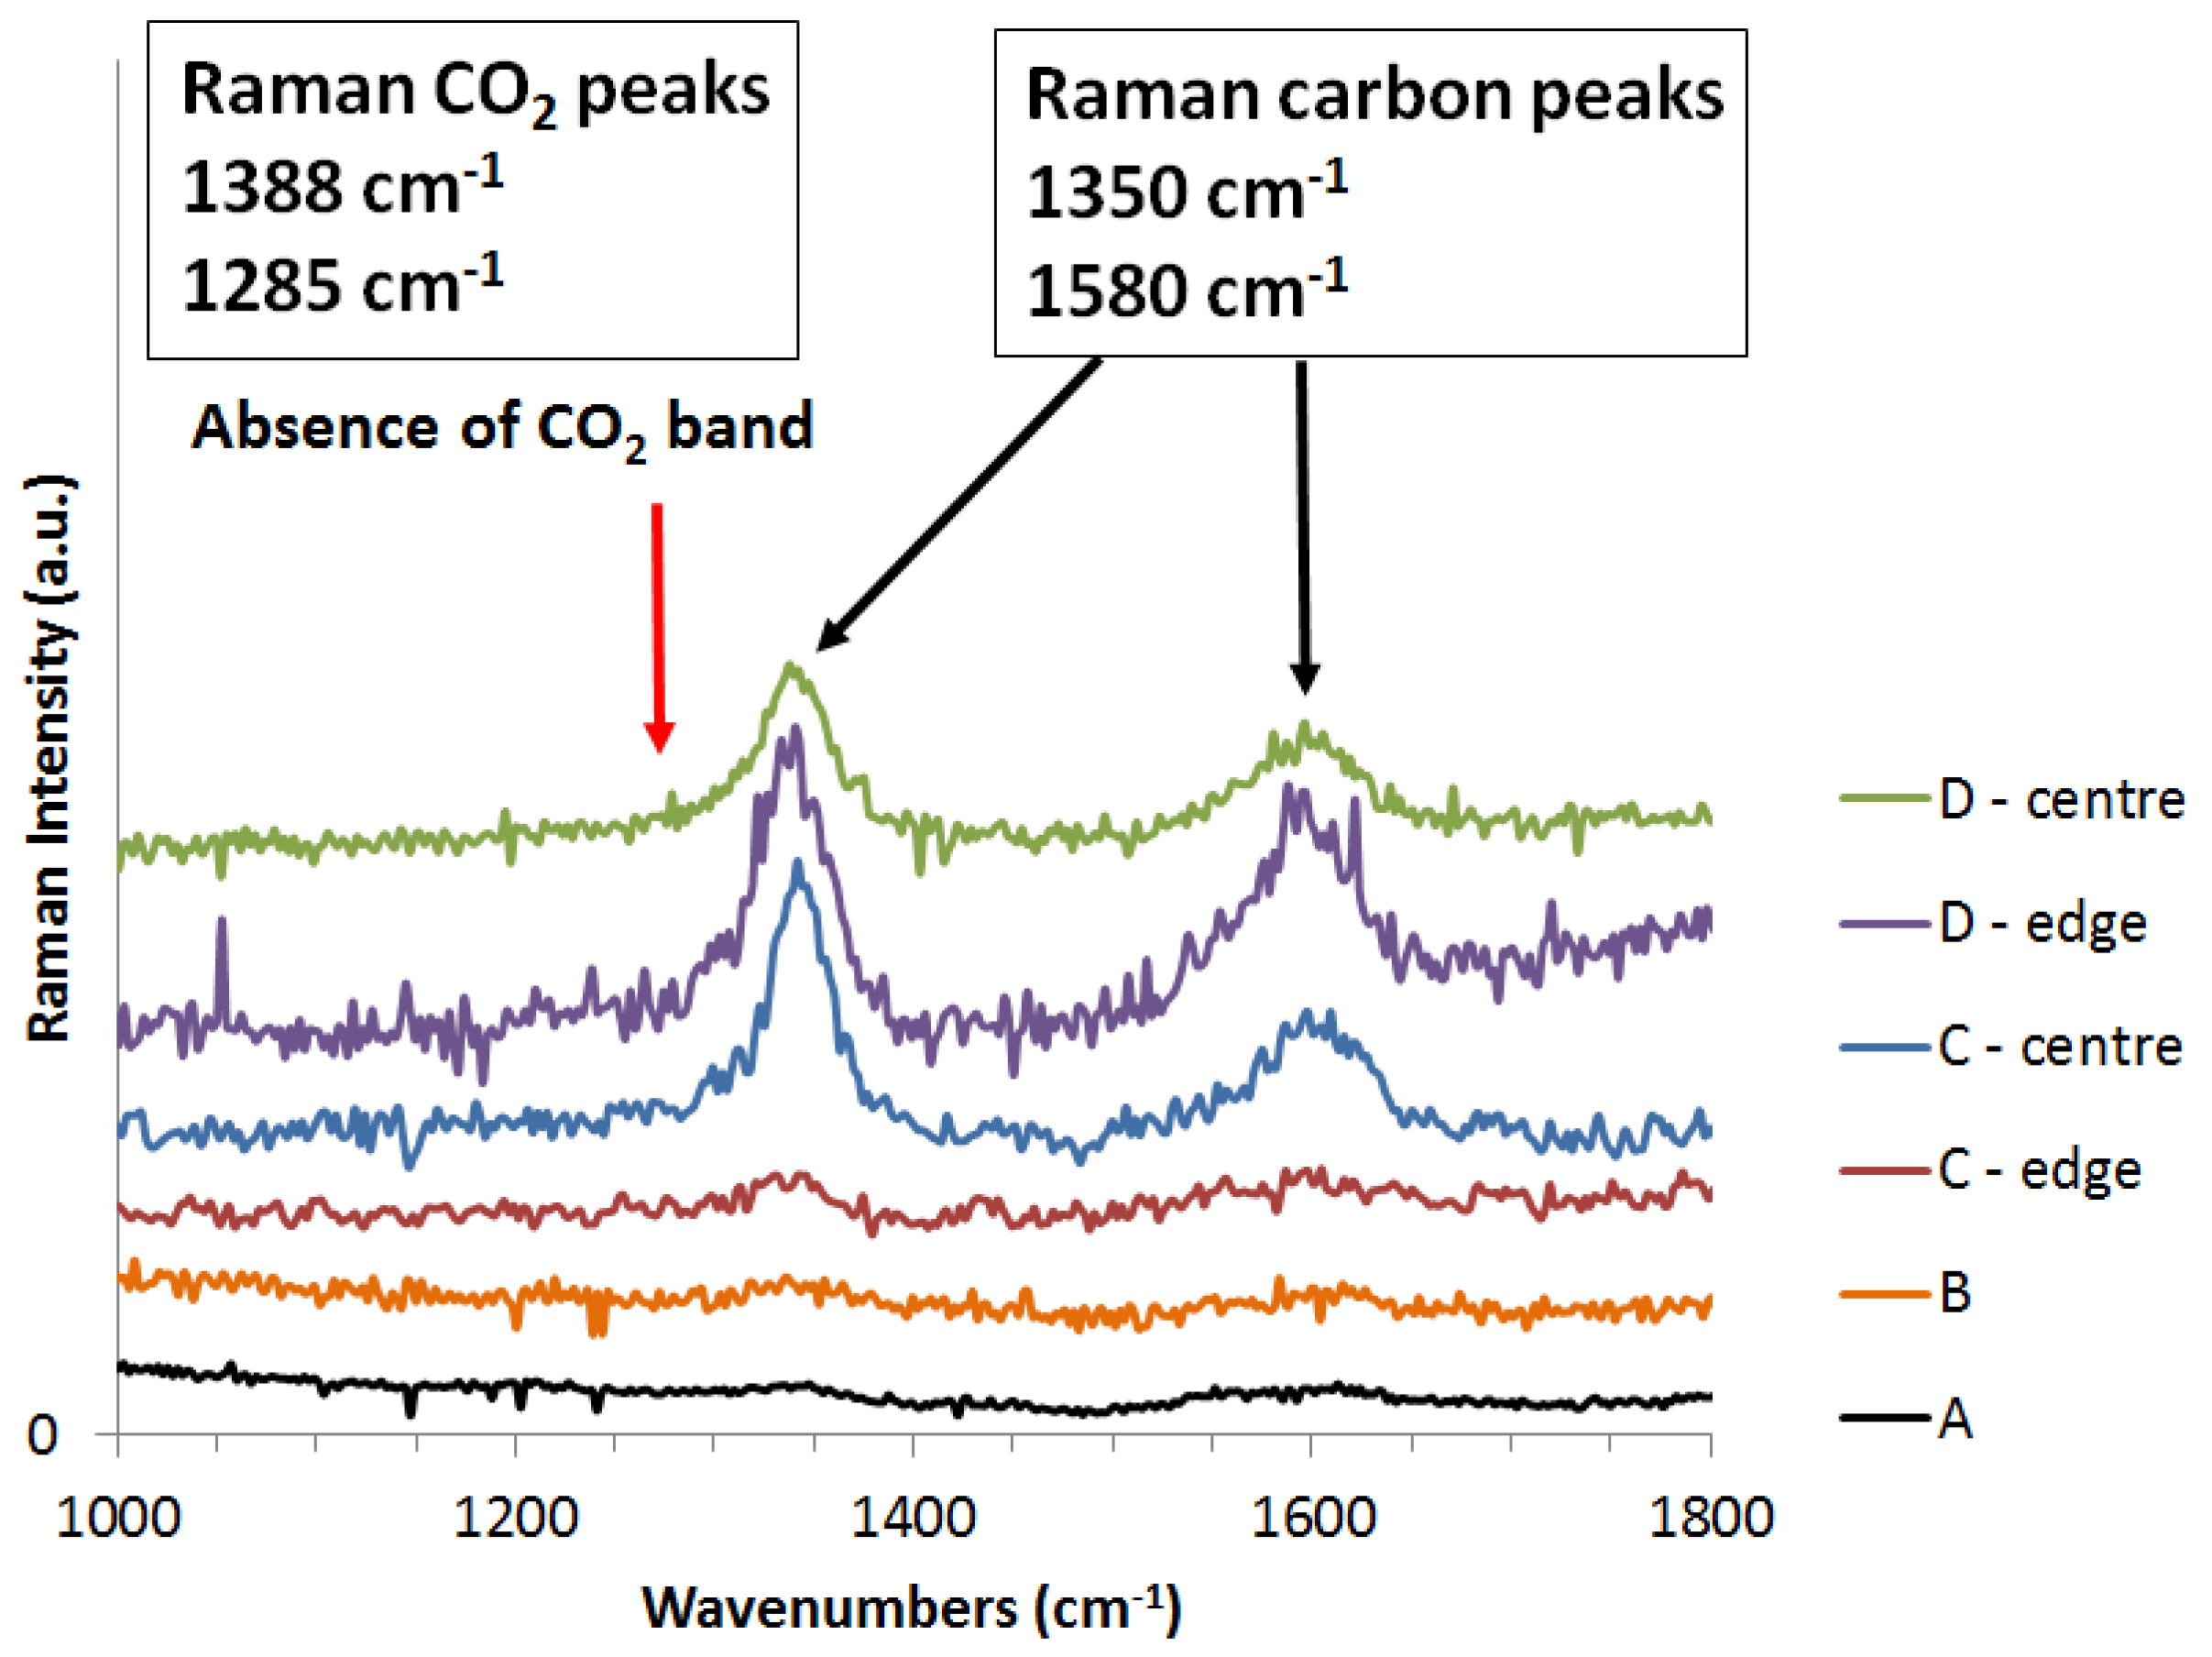
3. Results and Discussion

The differences in the coloration and homogeneity of the different samples are shown in Figure 2. Despite the longer heating time, sample A, which has a smaller diameter (20 mm) and the lowest specific surface area (SSA= 17.1 m2/g), demonstrated less contamination compared to sample D with a 40 mm diameter and larger SSA (27.9 m2/g). The existence of graphite felt in sample C did not influence the sample coloration compared to sample B. Moreover, a darker color was observed in sample D as a result of the stronger current compared to sample C.
The red points in Figure 2 show the position of the spectrophotometer measurement for each sample. A spectrophotometer was used to first determine the real in-line transmission (noted RIT) of the samples, while with a second experiment, using an integration sphere, the total forward transmission was measured (TFT = RIT + TD (transmitted diffused light)). The diffuse reflection (Rd) and the total reflection (Rt) were also measured using the integration sphere. The specular reflection Rs was then calculated from the difference between these two values (Rs = Rt − Rd). The absorption part was also calculated from the measurements (Abs = 100 − TFT − Rt). The spectrophotometer results are reported in Figure 3.
The transmitted diffused light is associated with pore diffusion, which causes the scattering of light, meaning that an incomplete sintering and the main loss are related to the absorption. The absorption (green parts in the histograms) increases with the intensity of the coloration zone (red spot in Figure 2), which can be linked to some interaction between light and dark particles (carbon contamination) within the sample volume.
The Raman analysis of the different spinel pellets is shown in Figure 4. However, it was not possible to do a Raman analysis for the YAG pellet due to the presence of cerium, which generates a huge signal in the measurement because of its luminescence.
The carbon peaks at 1350 and 1580 cm−1 for spinel samples increase with the dark coloration intensity presented in the four samples and between the edges and the centers of the two large samples (C and D), while there were no CO2 peaks. Therefore, this dark coloration is related to the presence of carbon in the graphite allotropic form and not due to the presence of CO2 in the pores.
The optical observations with the Hirox equipment are presented in Figure 5 for the different samples. An effective focus is performed on black artefacts at a certain depth of the sample. A few isolated and well-defined black spots of about 50 µm are observed in sample A. Less defined black spots (not pores) of 50 µm or smaller are observed for all the other samples, and they look blurred and more diffused. Those black spots are carbon clusters which may have different sources. Those clusters may originate from CO32− impurities of the starting powder which are then transformed to carbon contamination during the heating process [12]. Indeed, carbonates undergo thermal decomposition, to give carbon dioxide gas, which then, due to the reducing SPS environment, can be converted into disordered sp2 carbon phases, such as glassy carbon and/or graphite oxide phases [14,19]. The carbon clusters may also come from the SPS environment. Indeed, carbon coming from papiex® graphite foil, graphite die, and graphite felt may enter into the samples. Different diffusion paths are possible in the spinel and the YAG due to the grain boundaries and the intrinsic point defects correlated with the partially occupied octahedral and tetrahedral interstices. Defect chemistry is a key parameter that influences the diffusion, and this defect chemistry can be modified by a reducing atmosphere. Indeed, sintering in graphitic furnaces adds an additional reaction affecting the defect equilibrium by generating oxygen vacancies [19]. However, oxygen vacancies and color centers which are formed under reducing conditions are absorbed out of the visible range [3]. Nevertheless, the reducing condition and the presence of the SPS carbon environment close to the oxide samples is favorable for the formation of CO2 or CO depending on the temperature and oxygen partial pressure. Those gases become trapped inside closed porosity, but due to the pore shrinkage occurring in sintering and the SPS applied pressure, thermodynamics conditions are favorable to precipitating carbon. This phenomenon is also enhanced by the stress and volume reduction induced when cooling to room temperature [19]. Carbon atoms and CO may also diffuse along grain boundaries and accumulate in closed porosity [20]. This diffusion may be exacerbated by the current or electric field applied during SPS. Indeed, it has been shown that the mass transport mechanism evolves preferentially along the electric field vector [21], thus showing that the diffusion of carbon also depends on the orientation of the electric field during sintering.
The carbon species appearing during the heating process, either coming from carbonates or from the SPS environment, condenses, collects, and stays in the grain junctions as carbon clusters. The abundance of black diffused spots observed by optical microscope is similar among samples B, C, D, and E. Those black spots are a little bit smaller for the D and E samples than for the other samples. The samples’ color (Figure 2) does not seem to be correlated with the black spot density. However, the more carbon is measured by Raman, the more the sample is observed to be a dark-grey color, and the more absorbance is also measured by the spectrophotometer.
SEM cathodoluminescence performed on the YAG sample (doped with cerium) is shown in Figure 6. The brightness corresponds to the cerium luminescence. Spherical nonluminescent zones may correspond to the dark-grey diffused spots observed previously in the optical microscope. However, those zones are much more numerous and smaller. This means that using an optical microscope, only the biggest and less diffused spots can be detected. Diffused nonluminescent spots are getting bigger when the sintering temperature of the YAG increases. This diffusion makes the spots more diffused, and the general sample color is also darker when the temperature increases. The very small black points of the few microns observed in all of the images are due to some nonluminescent alumina particles presented in the raw powder. Carbon diffusion from the carbon clusters increases the sample volume fraction of the carbon contamination. The correlation between optical characteristics and carbon contamination has been established with the absorption measurements. Sample E (Figure 3) sintered at 1375 °C has an absorption of 30.8%, while the YAG samples, shown in Figure 6, sintered at 1400, 1425, 1450, and 1475 °C, have absorptions of 38.9%, 54%, 55%, and 56%, respectively.

4. Conclusions

The obtained results lead to the following conclusions:
-
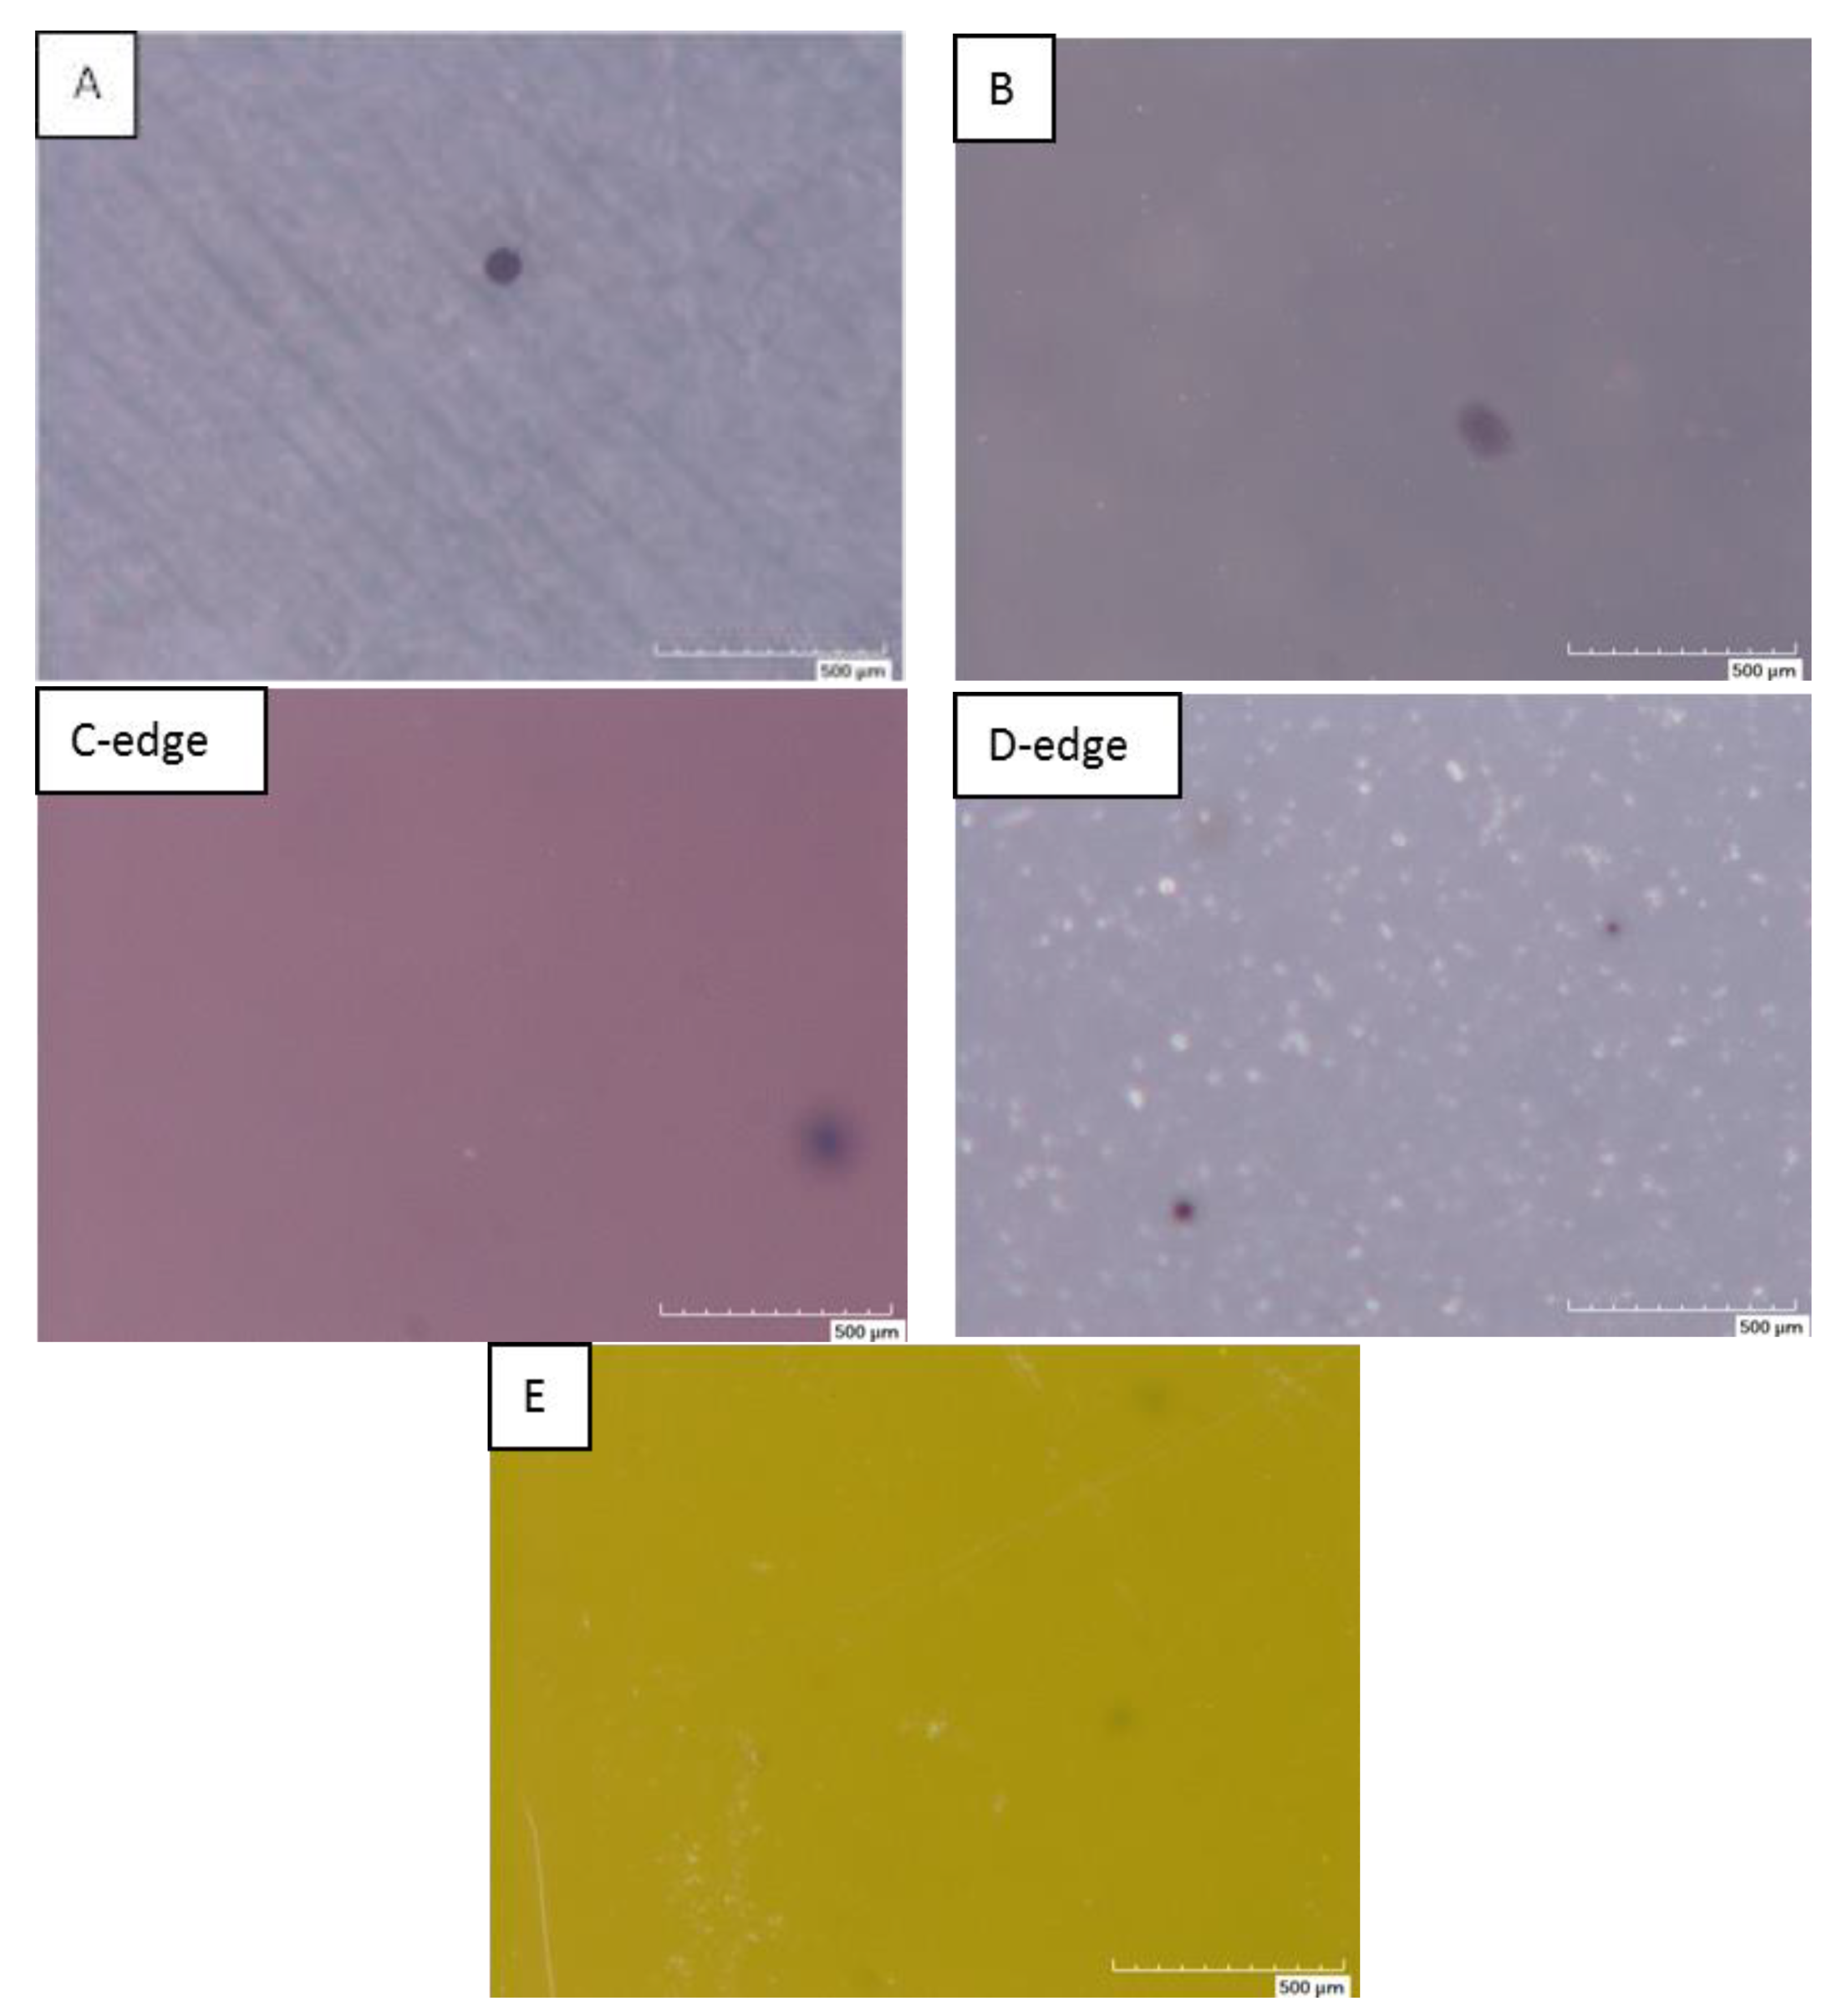
Carbon contamination originates from carbon clusters which are formed by carbon originating from the powder itself and from the SPS environment (papiex® graphite foil, graphite die, graphite felt).
-
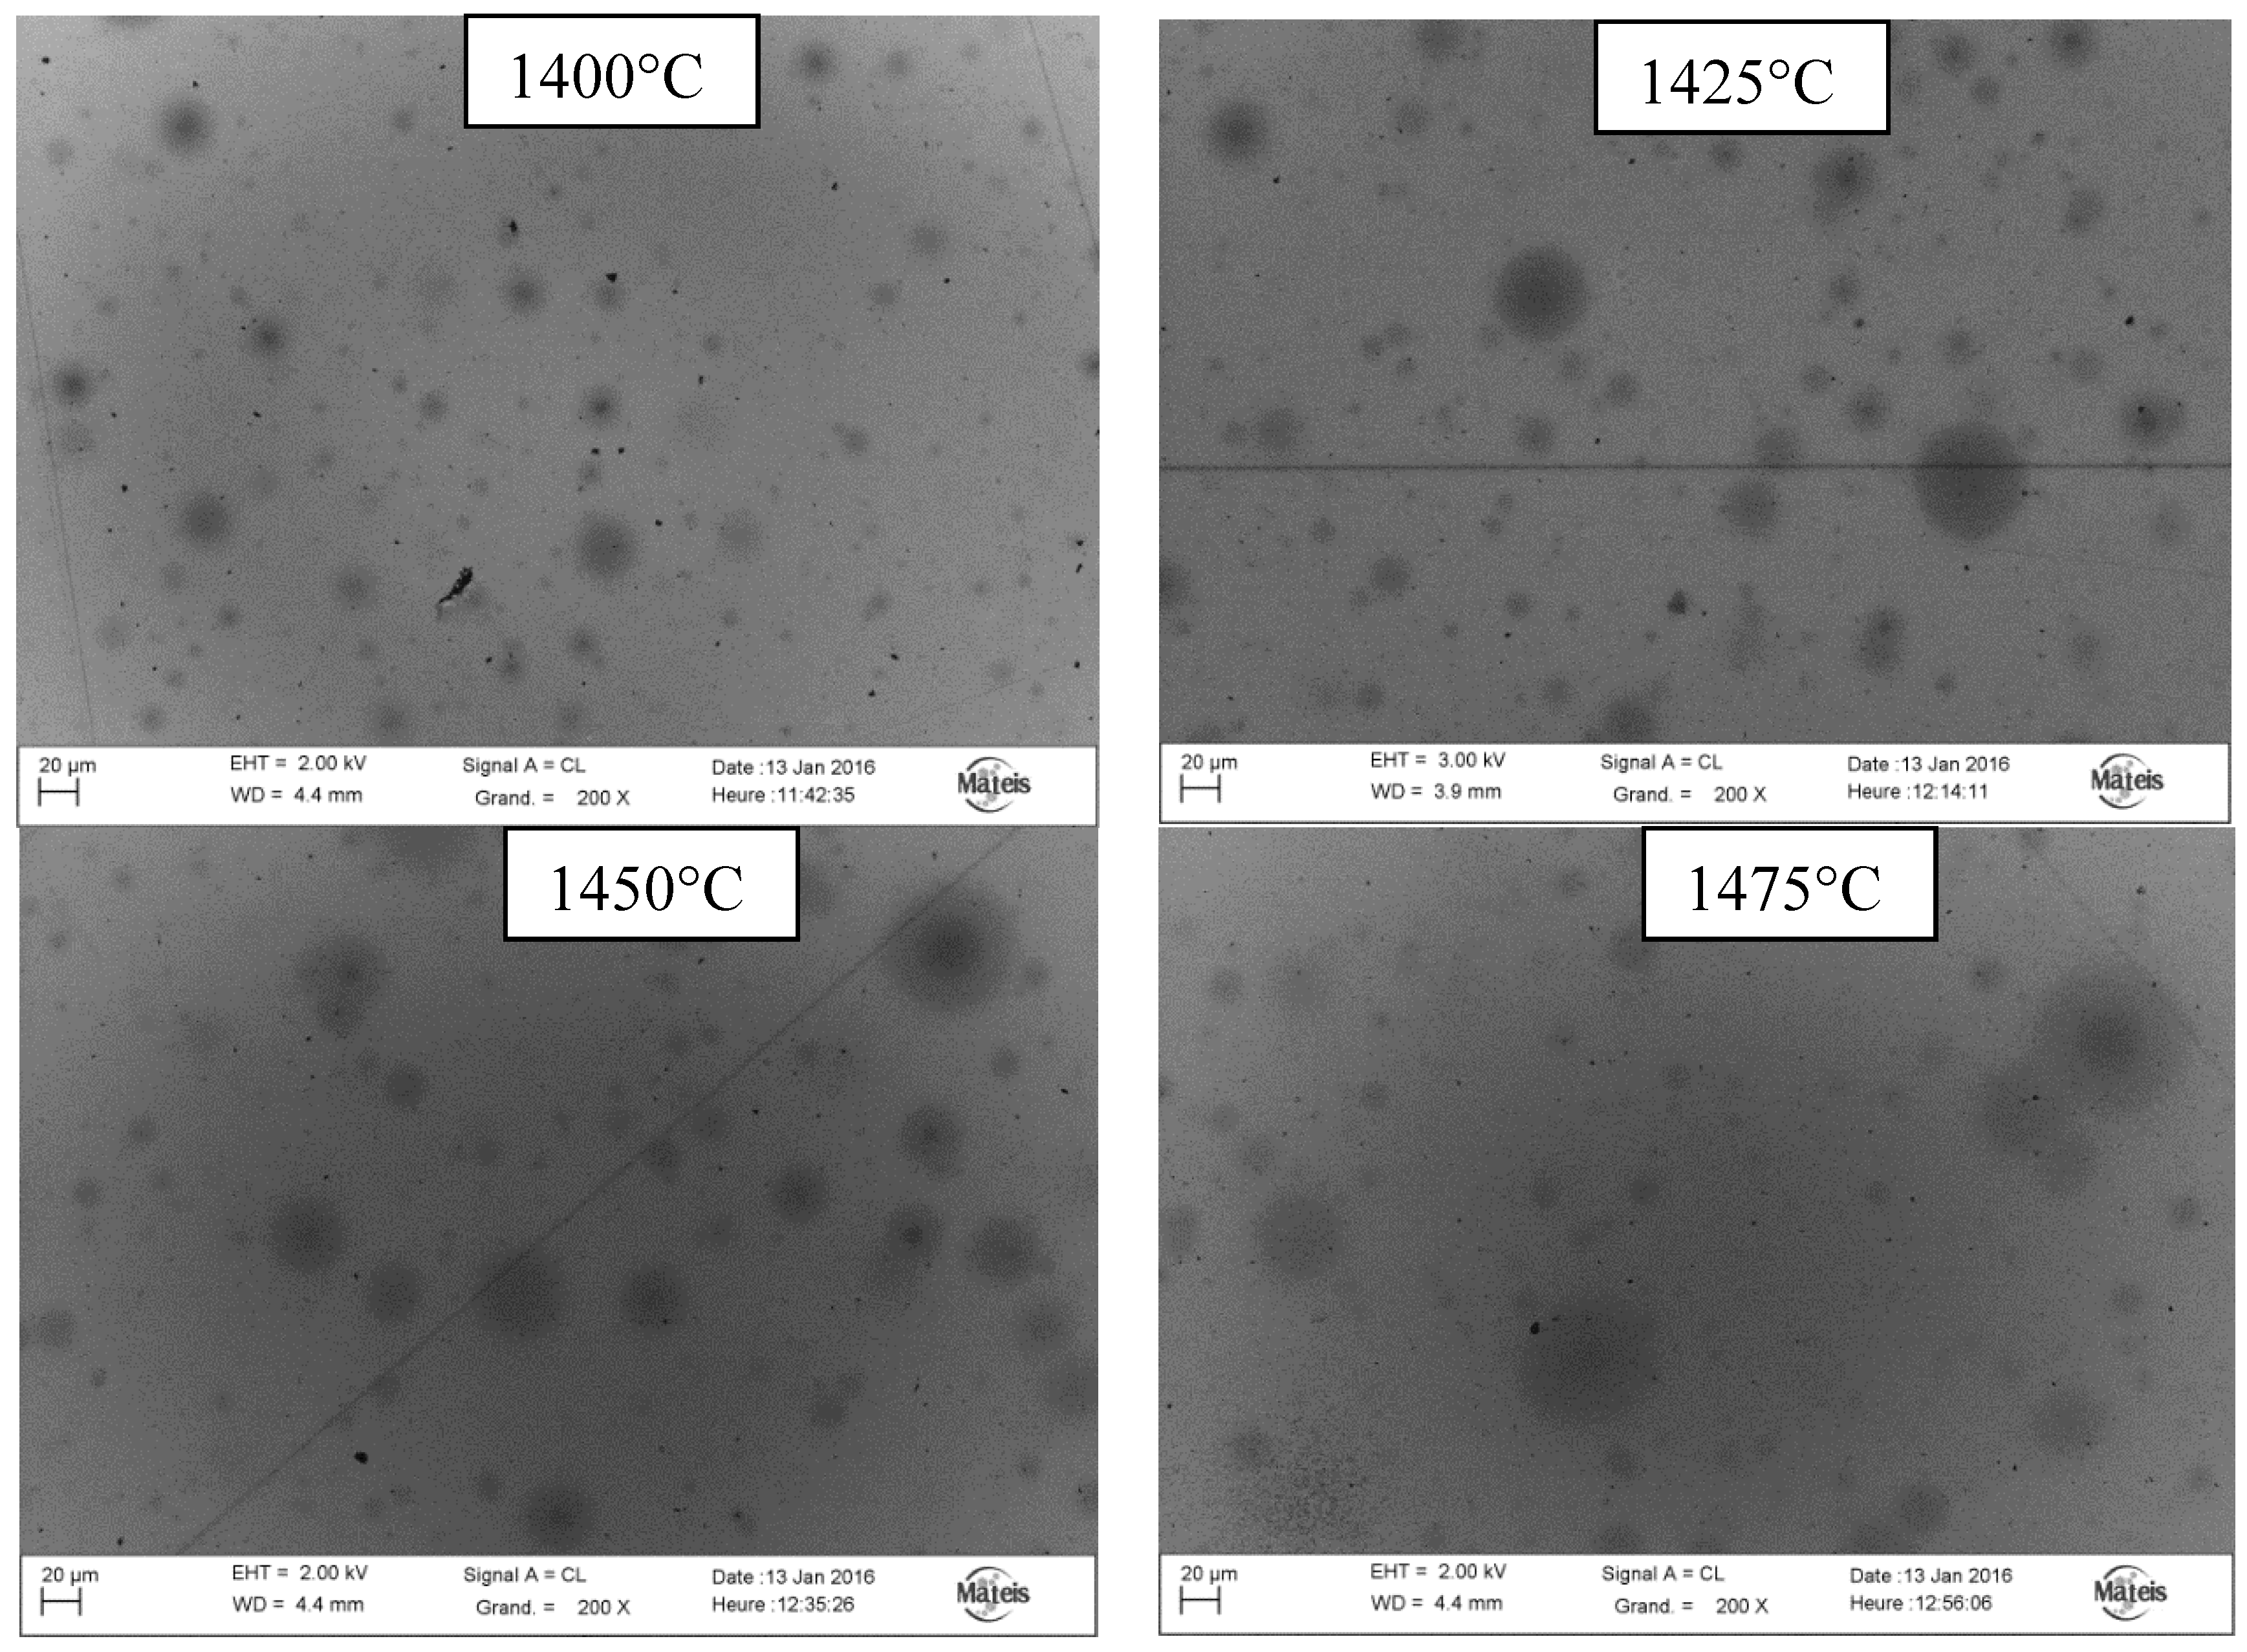
Longer SPS time and a higher temperature are responsible for carbon diffusion from the carbon clusters. The carbon diffuses in the volume around each cluster, which then increases more and more in size.
-
Once the kinetics of diffusion is thermally activated (Arrhenius law), the most significant parameter which can explain the light absorption increase is temperature.
-
SPS conditions such as the current and insulating felt can also influence the temperature and so impact carbon diffusion.
-
Cleaner powders with a low specific surface area can limit the formation of carbon clusters. Lower temperature and shorter heat treatment will also limit their diffusion and preserve the transparency.

Author Contributions

H.H. and E.L. have contributed to perform the experiments and all the authors have contributed to analyze the data and write this paper.

Funding

The research received no external funding.

Conflicts of Interest

The authors declare no conflict of interest.

References

  1. Krell, A.; Hutzler, T.; Klimke, J. Transparent Ceramics for Structural Applications, Ceram. Forums Int. 2007, 84, e41–e50. [Google Scholar]
  2. Bonnefont, G.; Fantozzi, G.; Trombert, S.; Bonneau, L. Fine-grained transparent MgAl2O4 spinel obtained by spark plasma sintering of commercially available nanopowders. Ceram. Int. 2012, 38, 131–140. [Google Scholar] [CrossRef]
  3. Goldstein, A.; Shames, A.I.; Stevenson, A.J.; Cohen, A.; Vulfson, M. Parasitic Light Absorption Processes in Transparent Polycrystalline MgAl2O4 and YAG. J. Am. Ceram. Soc. 2013, 96, 3523–3529. [Google Scholar] [CrossRef]
  4. Li, J.G.; Ikegami, T.; Lee, J.H.; Mori, T. Fabrication of Translucent Magnesium Aluminate Spinel Ceramics. J. Am. Ceram. Soc. 2000, 83, 2866–2868. [Google Scholar] [CrossRef]
  5. Gilde, G.; Patel, P.; Patterson, P.; Blodgett, D.; Duncan, D.; Hahn, D. Evaluation of Hot Pressing and Hot Isostastic Pressing Parameters on the Optical Properties of Spinel. J. Am. Ceram. Soc. 2005, 88, 2747–2751. [Google Scholar] [CrossRef]
  6. Reimanis, I.; Kleebe, H.J. A Review on the Sintering and Microstructure Development of Transparent Spinel (MgAl2O4). J. Am. Ceram. Soc. 2009, 92, 1472–1480. [Google Scholar] [CrossRef]
  7. Kim, B.N.; Hiraga, K.; Morita, K.; Yoshida, H. Spark plasma sintering of transparent alumina. Scr. Mater. 2007, 57, 607–610. [Google Scholar] [CrossRef]
  8. Jiang, D.T.; Hulbert, D.M.; Anselmi-Tamburini, U.; Ng, T.; Land, D.; Mukherjee, A.K. Optically transparent polycrystalline Al2O3 produced by spark plasma sintering. J. Am. Ceram. Soc. 2008, 91, 151–154. [Google Scholar] [CrossRef]
  9. Kim, B.N.; Hiraga, K.; Morita, K.; Yoshida, H. Effects of heating rate on microstructure and transparency of spark-plasma-sintered alumina. J. Eur. Ceram. Soc. 2009, 29, 323–327. [Google Scholar] [CrossRef]
  10. Kim, B.N.; Hiraga, K.; Morita, K.; Yoshida, H.; Miyazaki, T.; Kagawa, Y. Microstructure and optical properties of transparent alumina. Acta Mater. 2009, 57, 1319–1326. [Google Scholar] [CrossRef]
  11. Morita, K.; Kim, B.N.; Yoshida, H.; Hiraga, K. Densification behavior of a fine-grained MgAl2O4 spinel during spark plasma sintering (SPS). Scr. Mater. 2010, 63, 565–568. [Google Scholar] [CrossRef]
  12. Morita, K.; Kim, B.N.; Yoshida, H.; Hiraga, K.; Sakka, Y. Spectroscopic study of the discoloration of transparent MgAl2O4 spinel fabricated by spark-plasma-sintering (SPS) processing. Acta Mater. 2015, 84, 9–19. [Google Scholar] [CrossRef]
  13. Frage, N.; Cohen, S.; Meir, S.; Kalabukhov, S.; Dariel, P.M. Spark plasma sintering (SPS) of transparent magnesium-aluminate spinel. J. Mater. Sci. 2007, 42, 3273–3275. [Google Scholar] [CrossRef]
  14. Morita, K.; Kim, B.N.; Yoshida, H.; Hiraga, K.; Sakka, Y. Influence of pre- and post-annealing on discoloration of MgAl2O4 spinel fabricated by spark-plasma-sintering (SPS). J. Eur. Ceram. Soc. 2016, 36, 2961–2968. [Google Scholar] [CrossRef]
  15. Morita, K.; Kim, B.N.; Yoshida, H.; Hiraga, K.; Sakka, Y. Distribution of carbon contamination in MgAl2O4 spinel occurring during spark-plasma-sintering (SPS) processing: I—Effect of heating rate and post-annealing. J. Eur. Ceram. Soc. 2018, 38, 2588–2595. [Google Scholar] [CrossRef]
  16. Morita, K.; Kim, B.N.; Yoshida, H.; Hiraga, K.; Sakka, Y. Distribution of carbon contamination in oxide ceramics occurring during spark-plasma-sintering (SPS) processing: II—Effect of SPS and loading temperatures. J. Eur. Ceram. Soc. 2018, 38, 2596–2604. [Google Scholar] [CrossRef]
  17. Bernard-Granger, G.; Benameur, N.; Guizard, C.; Nygren, M. Influence of graphite contamination on the optical properties of transparent spinel obtained by spark plasma sintering. Scr. Mater. 2009, 60, 164–167. [Google Scholar] [CrossRef]
  18. Meir, S.; Kalabukhov, S.; Froumin, N.; Dariel, M.P.; Frage, N. Synthesis and Densification of Transparent Magnesium Aluminate Spinel by SPS Processing. J. Am. Ceram. Soc. 2009, 92, 358–364. [Google Scholar] [CrossRef]
  19. Rubat du Merac, M.; Kleebe, H.-J.; Muller, M.M.; Reimanis, I.E. Fifty Years of Research and Development Coming to Fruition; Unraveling the Complex Interactions during Processing of Transparent Magnesium Aluminate (MgAl2O4) Spinel. J. Am. Ceram. Soc. 2013, 96, 3341–3365. [Google Scholar] [CrossRef]
  20. Goldstein, A. Correlation between MgAl2O4-Spinel Structure, Processing Factors and Functional Properties of Transparent Parts (Progress Review). J. Eur. Ceram. Soc. 2012, 32, 2869–2886. [Google Scholar] [CrossRef]
  21. Whittaker, A.G. Diffusion in Microwave-Heated Ceramics. Chem. Mater. 2005, 17, 3426–3432. [Google Scholar] [CrossRef]
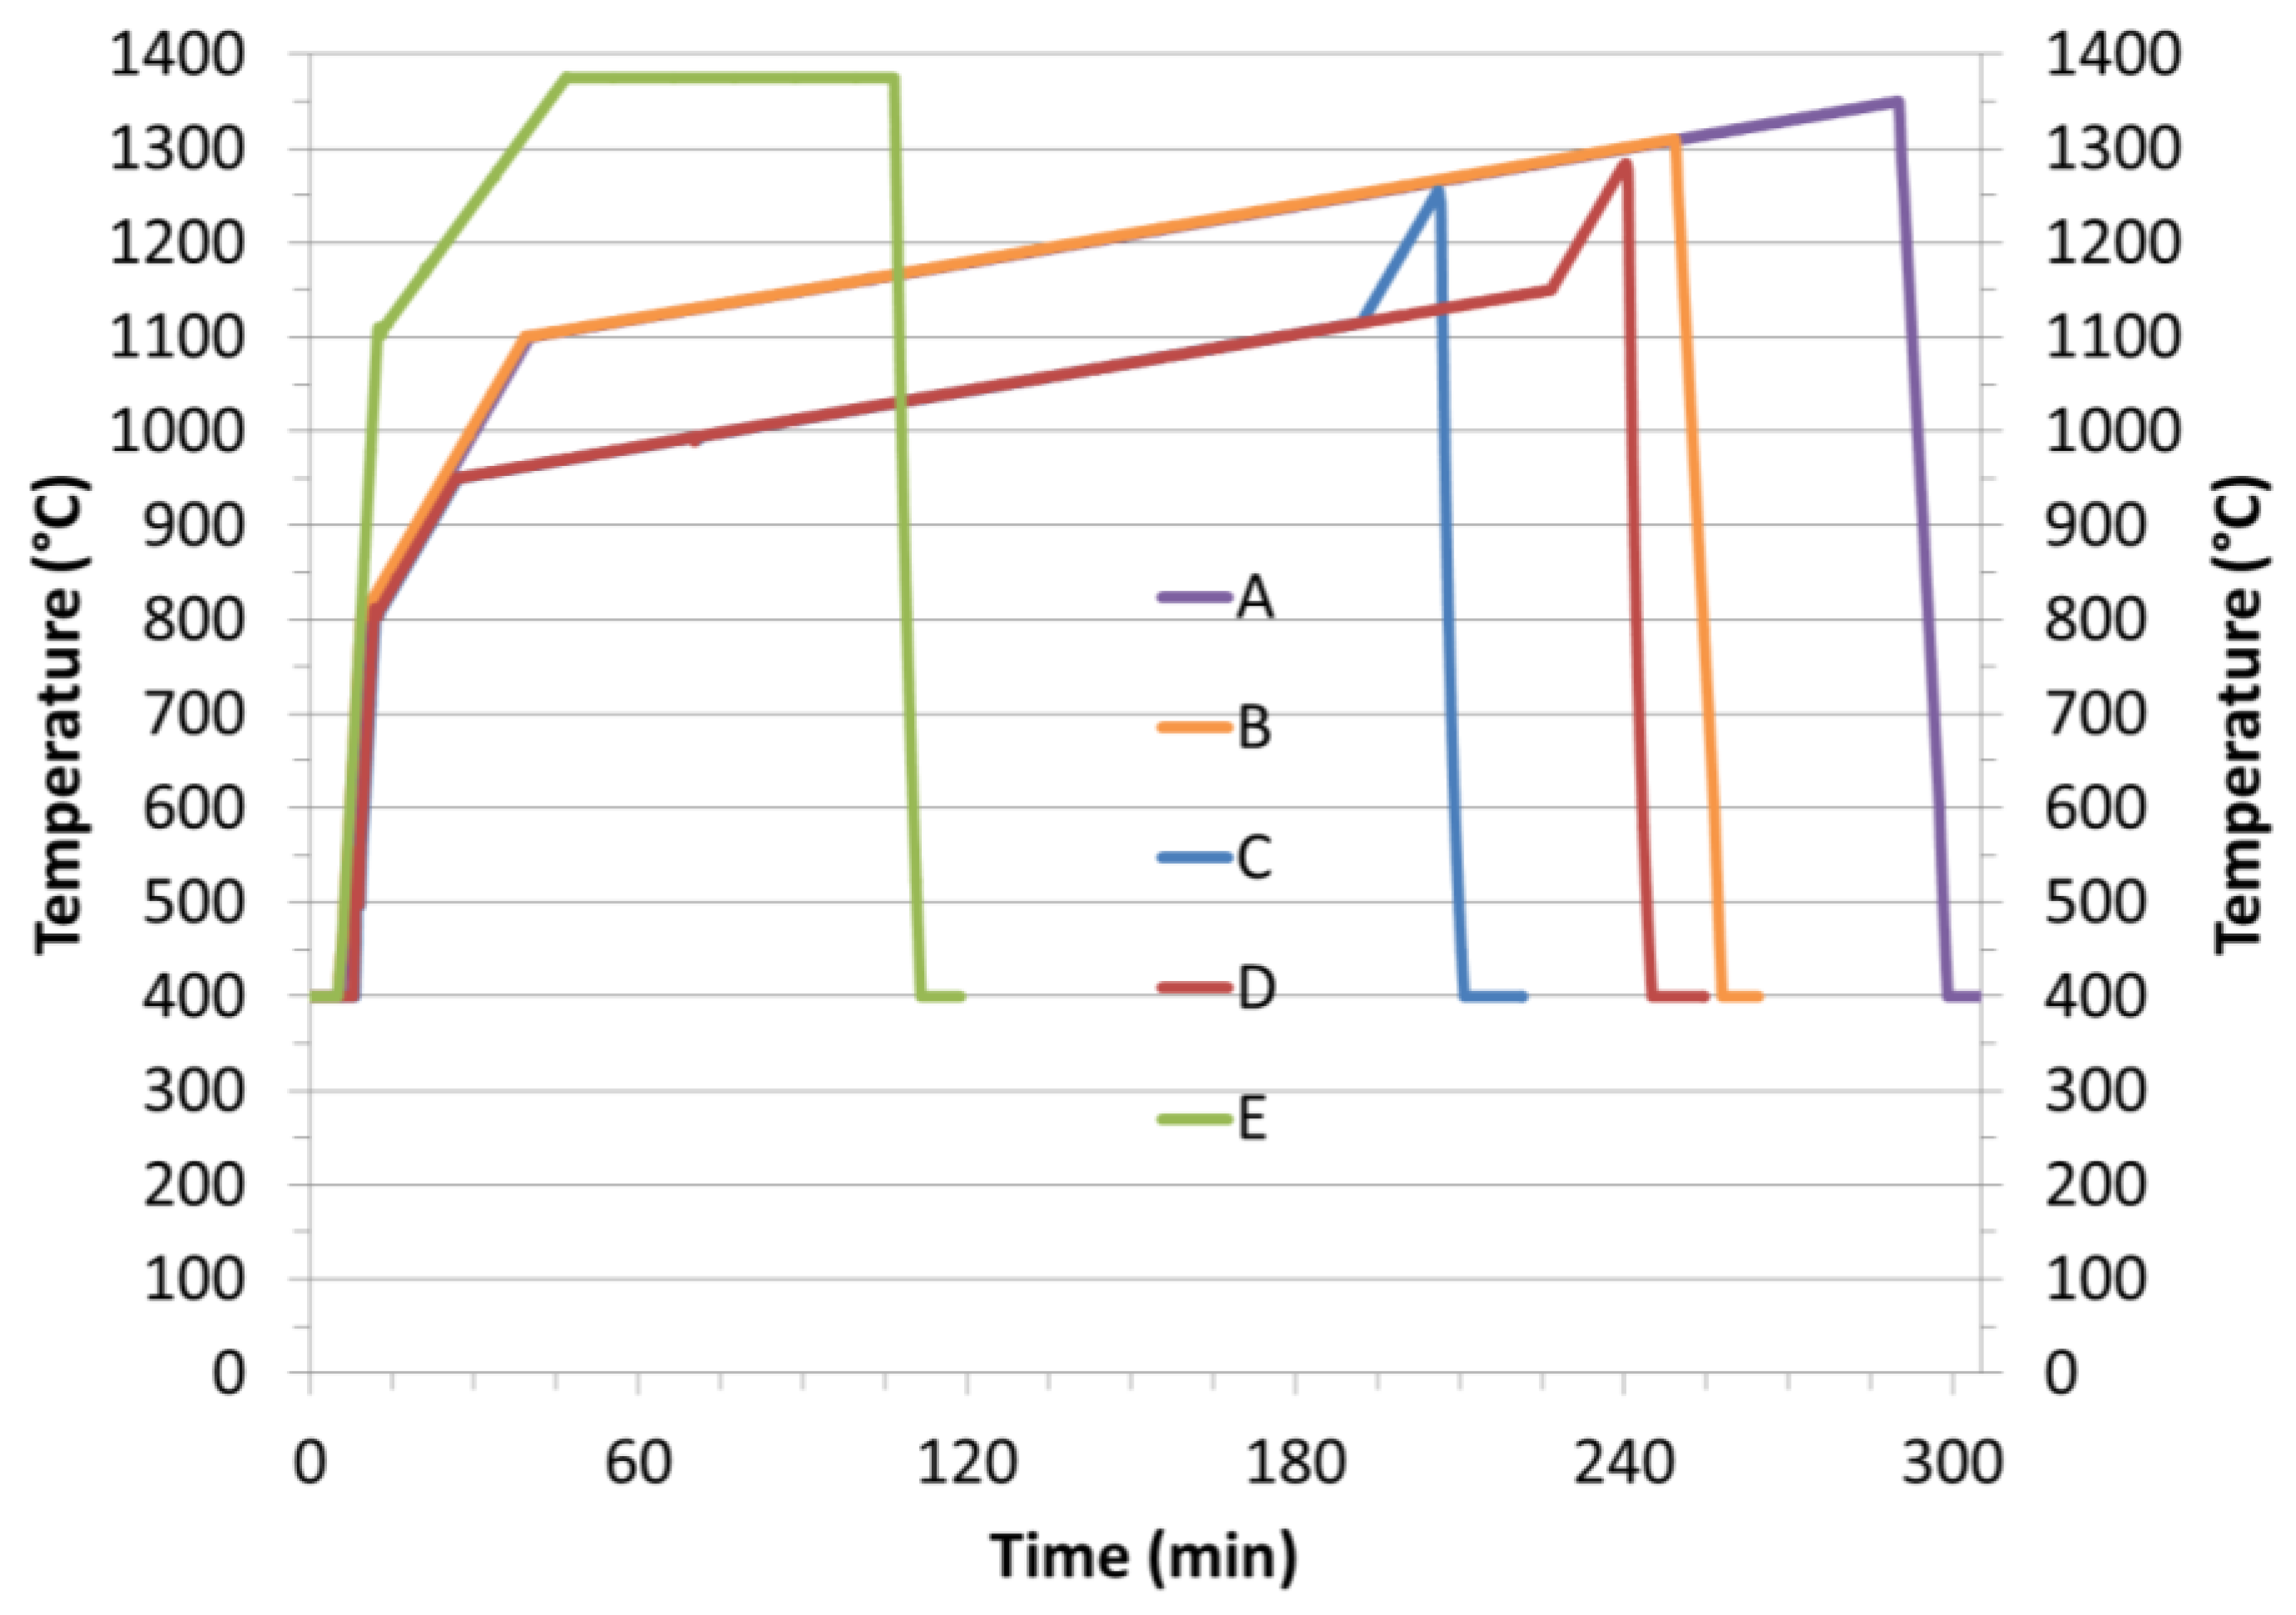
Figure 1. SPS thermal profiles for all samples.
Ceramics 02 00048 g001
Figure 2. The sintered samples from left to right: A, B, C, D, and E (see Table 1 for more details).
Ceramics 02 00048 g002
Figure 3. 2D histograms showing the percentage of the optical characteristics for the five samples at 550 nm and normalized for 1 mm sample thickness.
Ceramics 02 00048 g003
Figure 4. Raman spectra of spinel samples.
Ceramics 02 00048 g004
Figure 5. Optical microscope observations.
Ceramics 02 00048 g005
Figure 6. Y3Al2O5 (YAG) sintered at different temperature and observed in SEM in CL (cathodoluminescence) mode.
Ceramics 02 00048 g006
Table 1. Properties of the starting powders and sintering conditions for all samples.
SamplesStarting PowderMax Sintering Temperature (°C)Graphite FeltSample Diameter (mm)Max Irms (A)Pyrometer
A = MgAl2O4S25CRX lot 121350no201390Horizontal
SSA = 17.1 m2/g
d50 = 29 nm
B = MgAl2O4S25CRX lot 141310no201200Horizontal
SSA = 27.4 m2/g
d50 = 60 nm
C = MgAl2O4S30X-W (granulated)1250yes402850Vertical
SSA = 27.9 m2/g
d50 = 73 nm
D = MgAl2O4S30X-W (granulated)1280yes402950Vertical
SSA = 27.9 m2/g
d50 = 73 nm
E = Y3Al5O12YAG:Ce1375no201070Horizontal
SSA = 7 m2/g
d50 = 150 nm

