1. Introduction
Ceramic matrix composites (CMCs) offer a combination of low density and thermal stability for structural engineering applications where long-term exposure to high-temperature environments is envisaged. Advanced processing techniques have been optimised to produce CMC materials based on oxide/oxide and silicon carbide fibre-reinforced silicon carbide composite (SiCf/SiC) systems, for example, which can be tailored to the manufacture of engineering components destined to operate above 800 °C. However, the uptake of these composite materials has been restricted to advanced, high-performance applications, mainly due to the high inherent cost of both the raw material constituents and processing techniques. Hence, previous focus on such systems has been largely restricted to aerospace, power generation and high-end automotive applications.
CMCs made from woven silicon carbide (SiCf) fibres embedded within a SiC matrix have shown the greatest promise for high-temperature application over extended periods in oxidising environments. Their beneficial properties include high-temperature strength, low density, resistance to thermal shock, improved toughness (relative to monolithic variants), good creep and corrosion resistance.
From a disruptive perspective, SiC-based CMCs provide a considerable temperature and weight advantage over existing material systems. Their density is approximately 33% of nickel-based superalloys, providing opportunities for significant weight reductions in the combustor and turbine sections of future aero-engine designs. The material retains reasonable strength at temperatures as high as 1300 °C which allows for significant reductions in cooling requirements. When compared with current engine marks, it has been claimed that the advantages provided by CMCs could potentially offer a 20% reduction in component weight, decrease the fuel burn by approximately 3–6%, cut NOx emissions by 40% and reduce cooling requirements by up to 60% [
1].
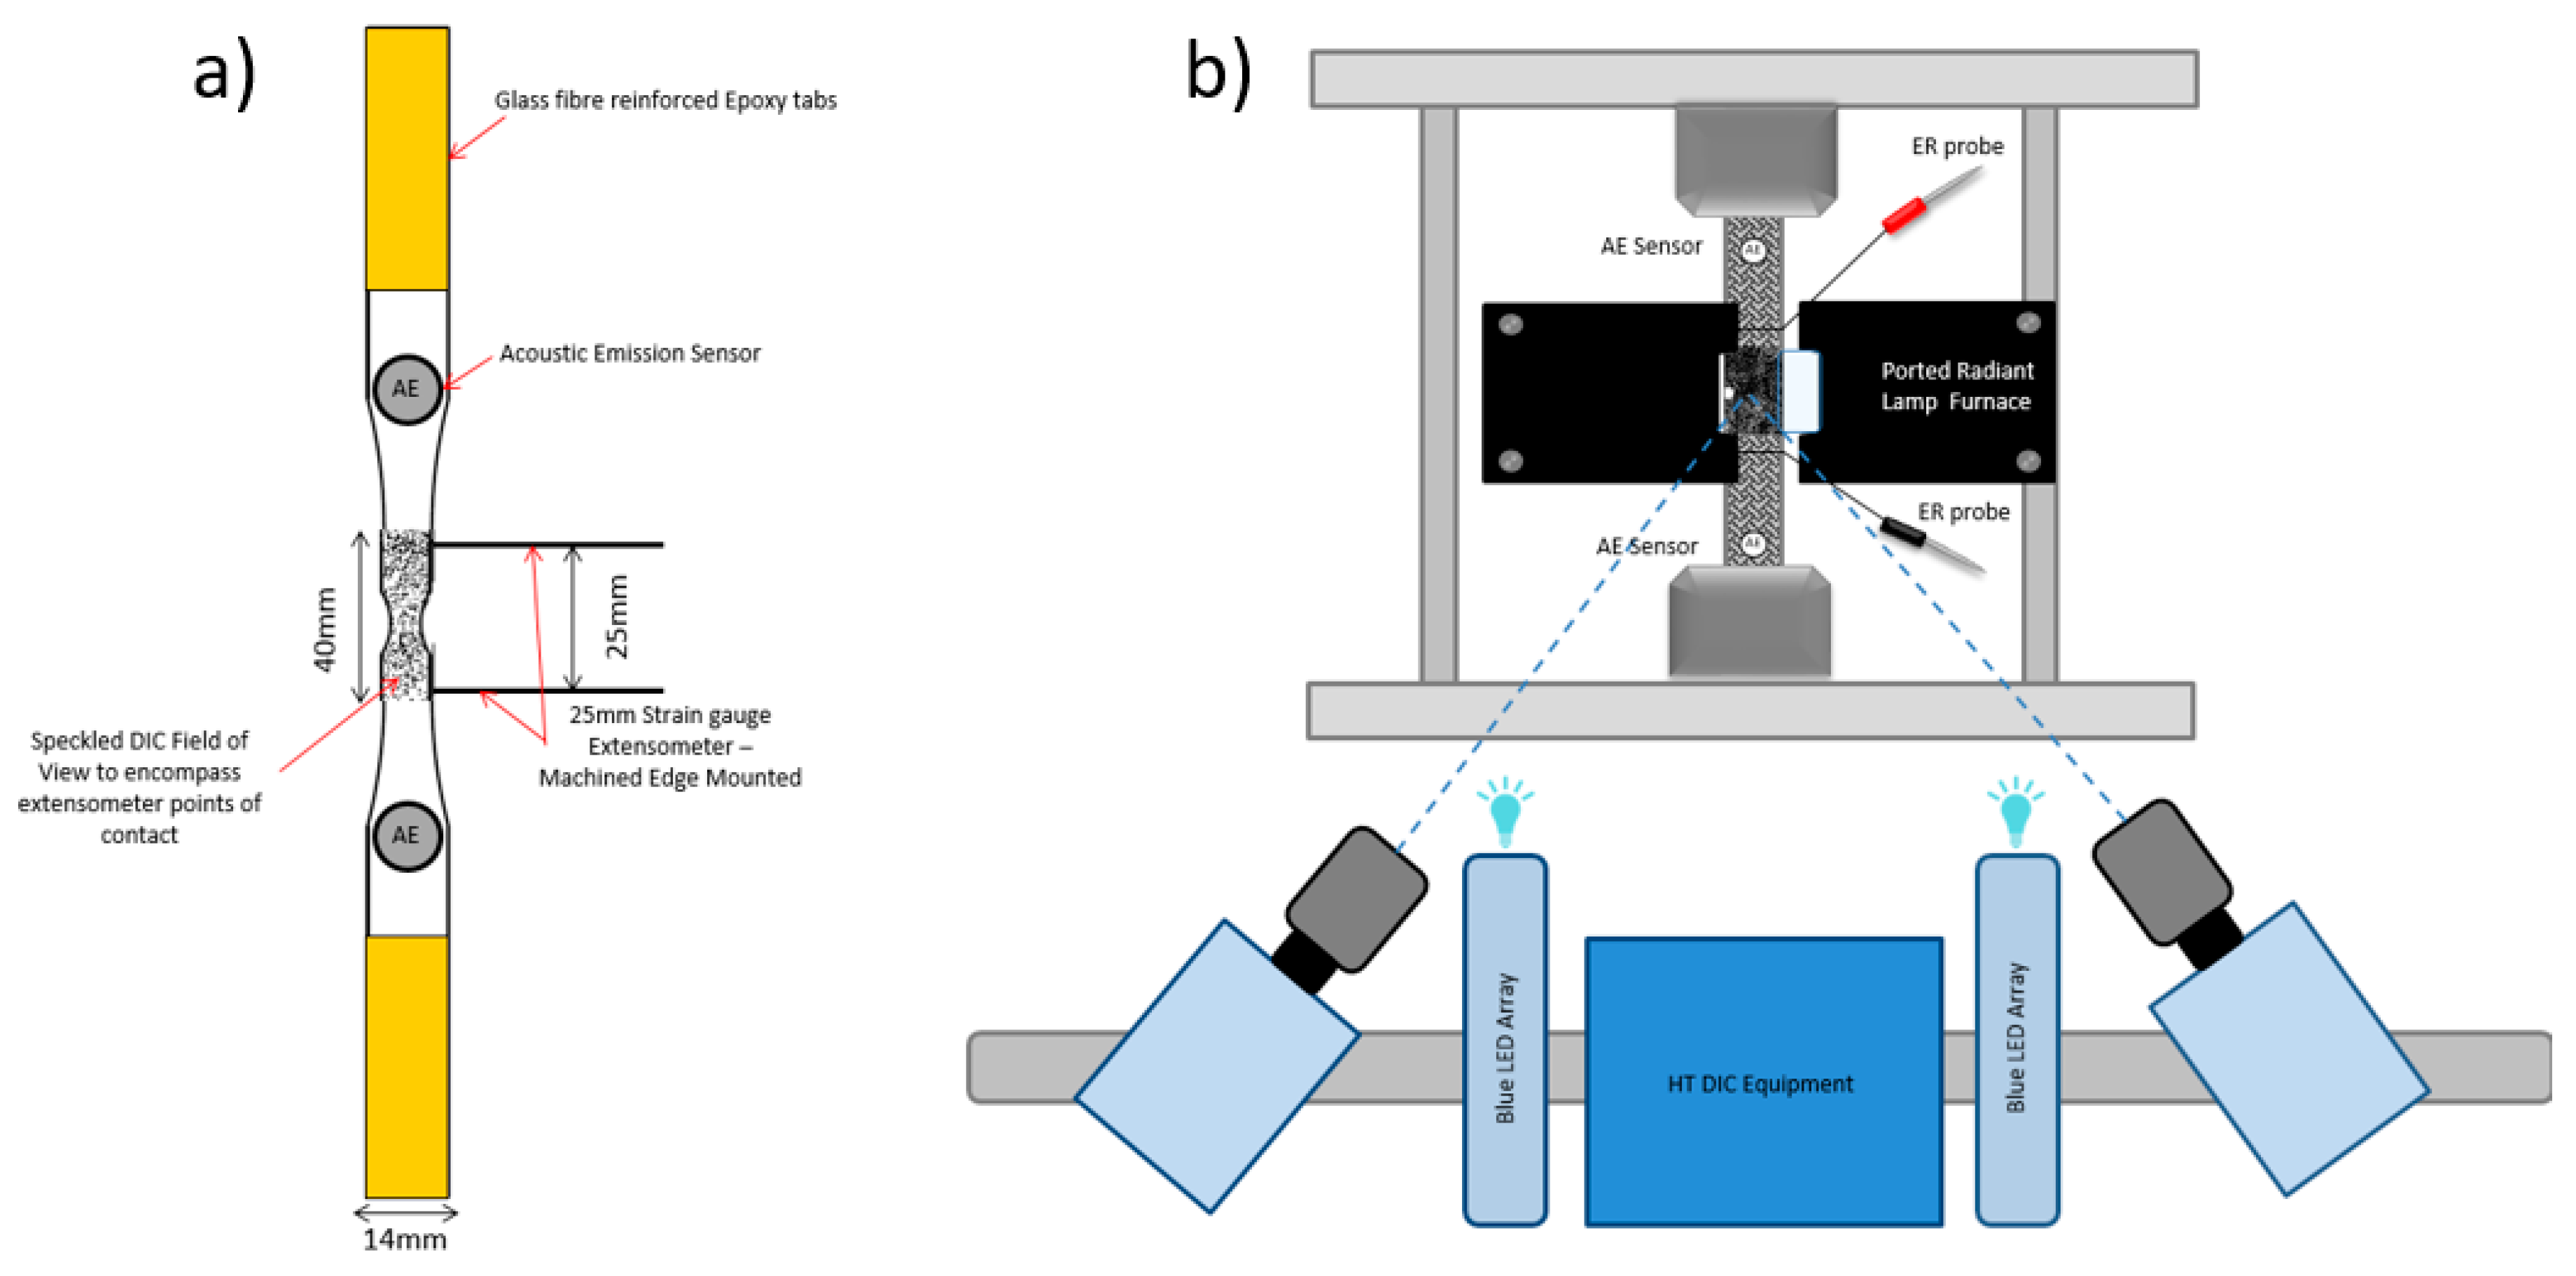
Our recent interest has focused upon the mechanical characterisation of SiCf/SiC composites under fatigue loading, with particular attention placed upon the monitoring of damage distributed throughout the composite and the subsequent characterisation. The present paper describes tests on notched coupons subjected to axial stress, with real-time surface strain distributions measured via digital image correlation (DIC). Associated acoustic emission (AE) signals and change in electrical resistance (ER) were recorded to allow for a correlation between surface and bulk damage progression. The role of composite architecture and inherent processing features in deformation, damage progression and ultimate fracture are discussed.
Our research has been driven towards obtaining an improved understanding of the onset and progression of damage. In order to achieve these goals, a number of advanced monitoring techniques are now employed on a routine basis. This meets the component design requirements of mechanical assessment on a macroscopic scale under tensile conditions (rather than utilising micro-scale samples or through the application of bend loading, for example) whilst still generating a fundamental understanding of deformation and failure mechanisms. These techniques include combinations of electrical resistance (ER); acoustic emission (AE); digital image correlation (DIC); X-ray computed tomography (XCT) and in-situ scanning electron microscopy (I-SSEM). Although independent techniques in their own right, various combinations of these methods offer an improved understanding of the damage mechanisms controlling structural integrity in CMCs. This is demonstrated using a two-dimensional reinforced SiC
f/SiC CMC system incorporating 0° and 90° woven fibre tows as a model material. Partly based on previously reported experimentation [
2], the present paper now benefits from extended analysis and the application of additional characterisation techniques.
3. Results
Trends in performance are discernible despite the application of normalisation. The initial “calibration” tests performed on specimens Control #1 and #2 were normalised based on the peak cumulative AE, stress and strain values obtained during testing of Control #1. As the basis for the normalised comparison between the fatigue tests, the peak resistance, strain and cumulative AE energy values measured at rupture from the room temperature fatigue test performed on Sample #1 were employed.
3.1. Room Temperature Monotonic Calibration—Control #1 and #2
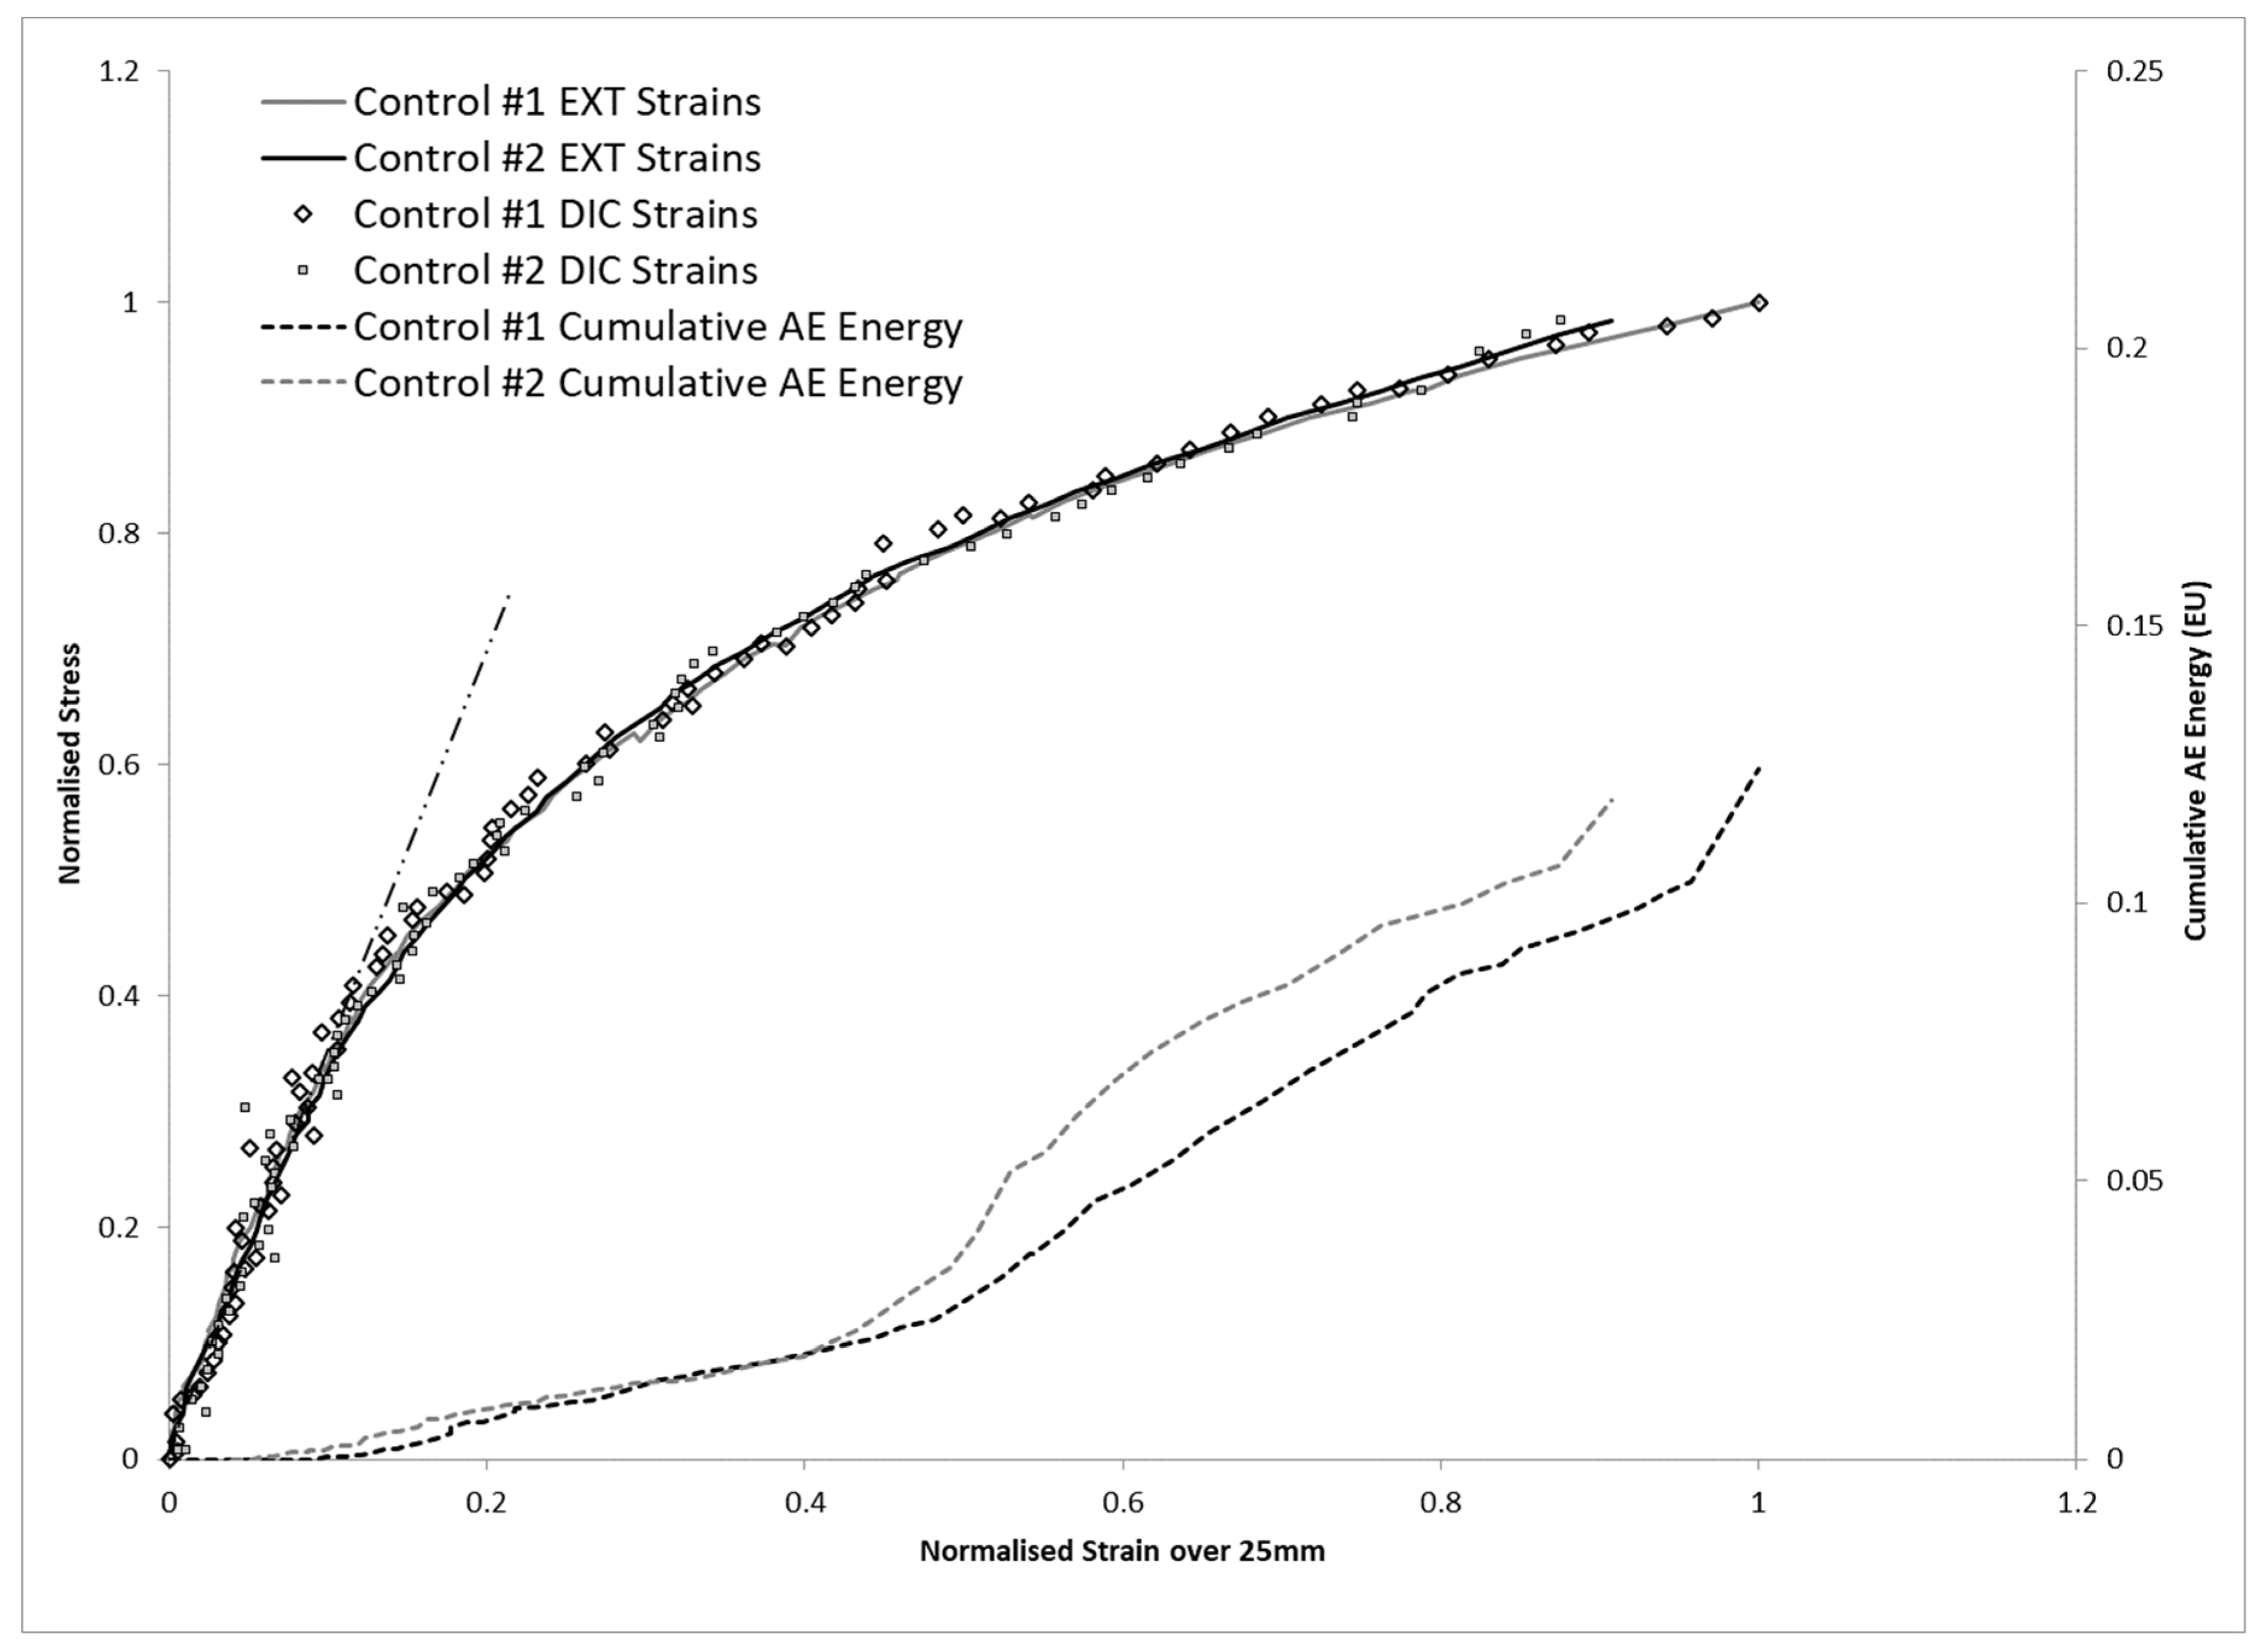
The constitutive behaviour of specimens Control #1 and #2, tested at room temperature, is represented in
Figure 4. In each case, the axial strain as measured from the extensometer was compared to the averaged uni-axial strain measured using DIC. The latter was calculated by defining two original points on the imaged machined edge surface, mirroring the locations of extensometer contact on the adjacent edge (i.e., with a 25 mm separation). Excellent agreement between this data was noted throughout the course of the test, validating the accuracy of the DIC technique.
Progressive damage was also monitored during these tests via acoustic emission.
Figure 4 superimposes a record of the cumulative AE energy released as a function of normalised axial bulk strain. In both cases, AE activity remained low while the CMC was under near-proportional loading; however, the rate of AE energy accumulation increased once beyond the limit of proportionality and approaching bulk fracture.
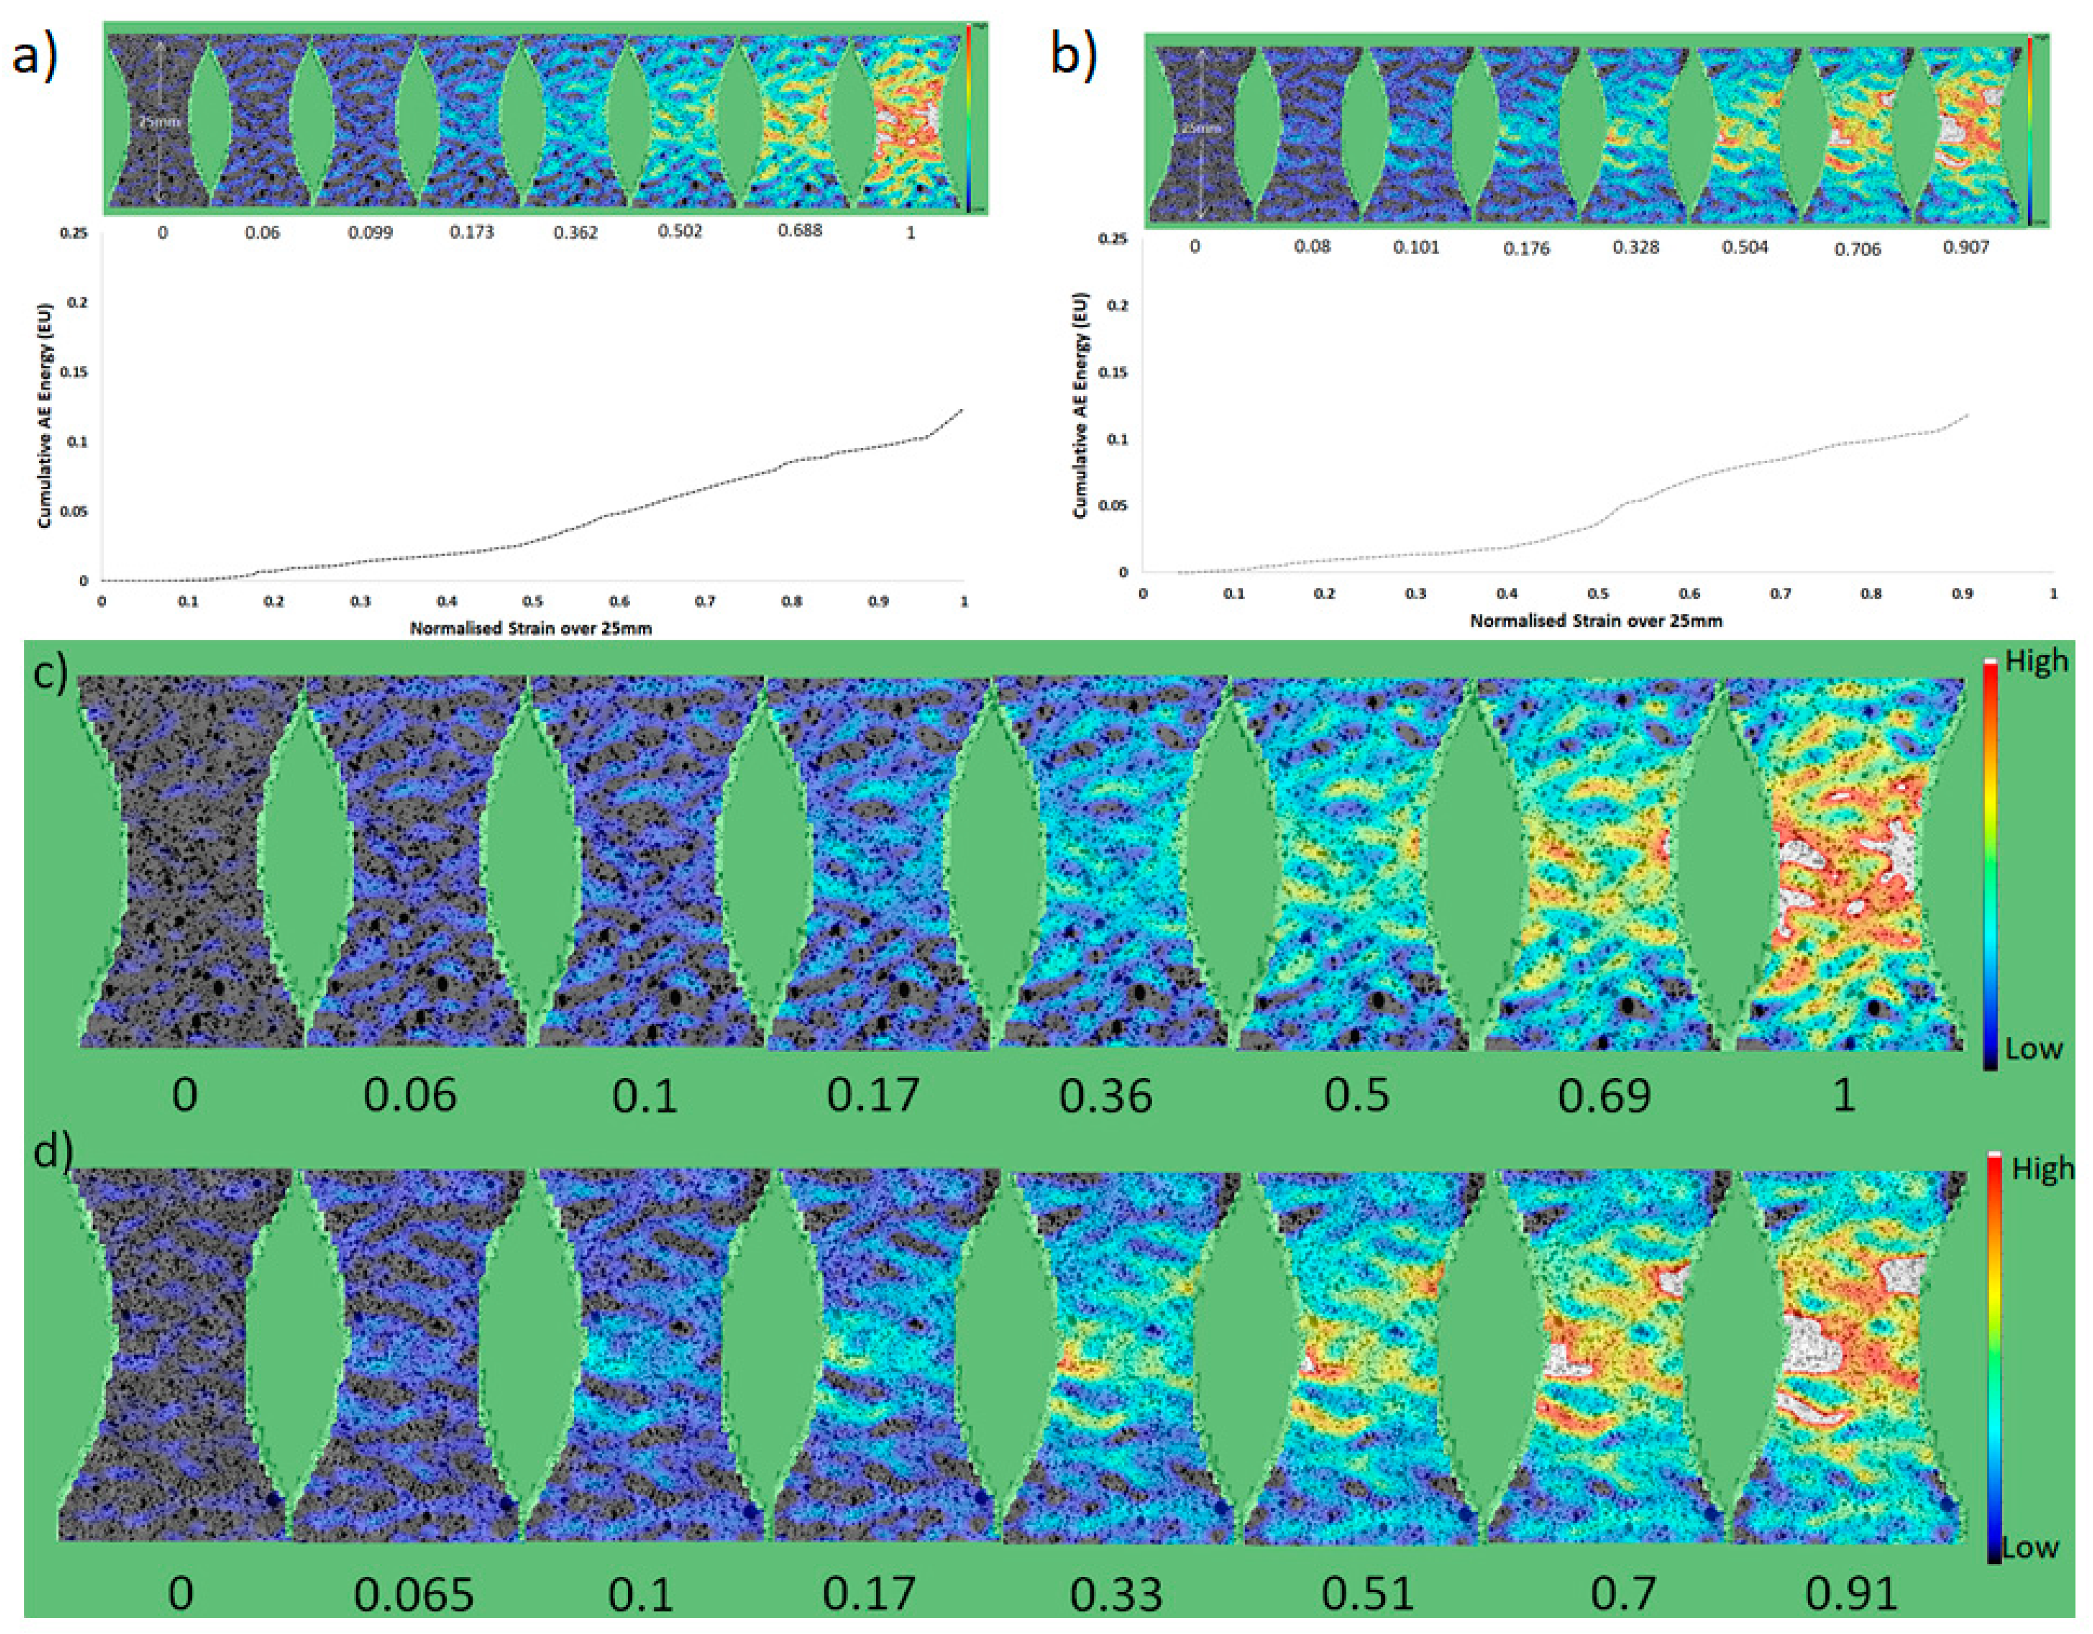
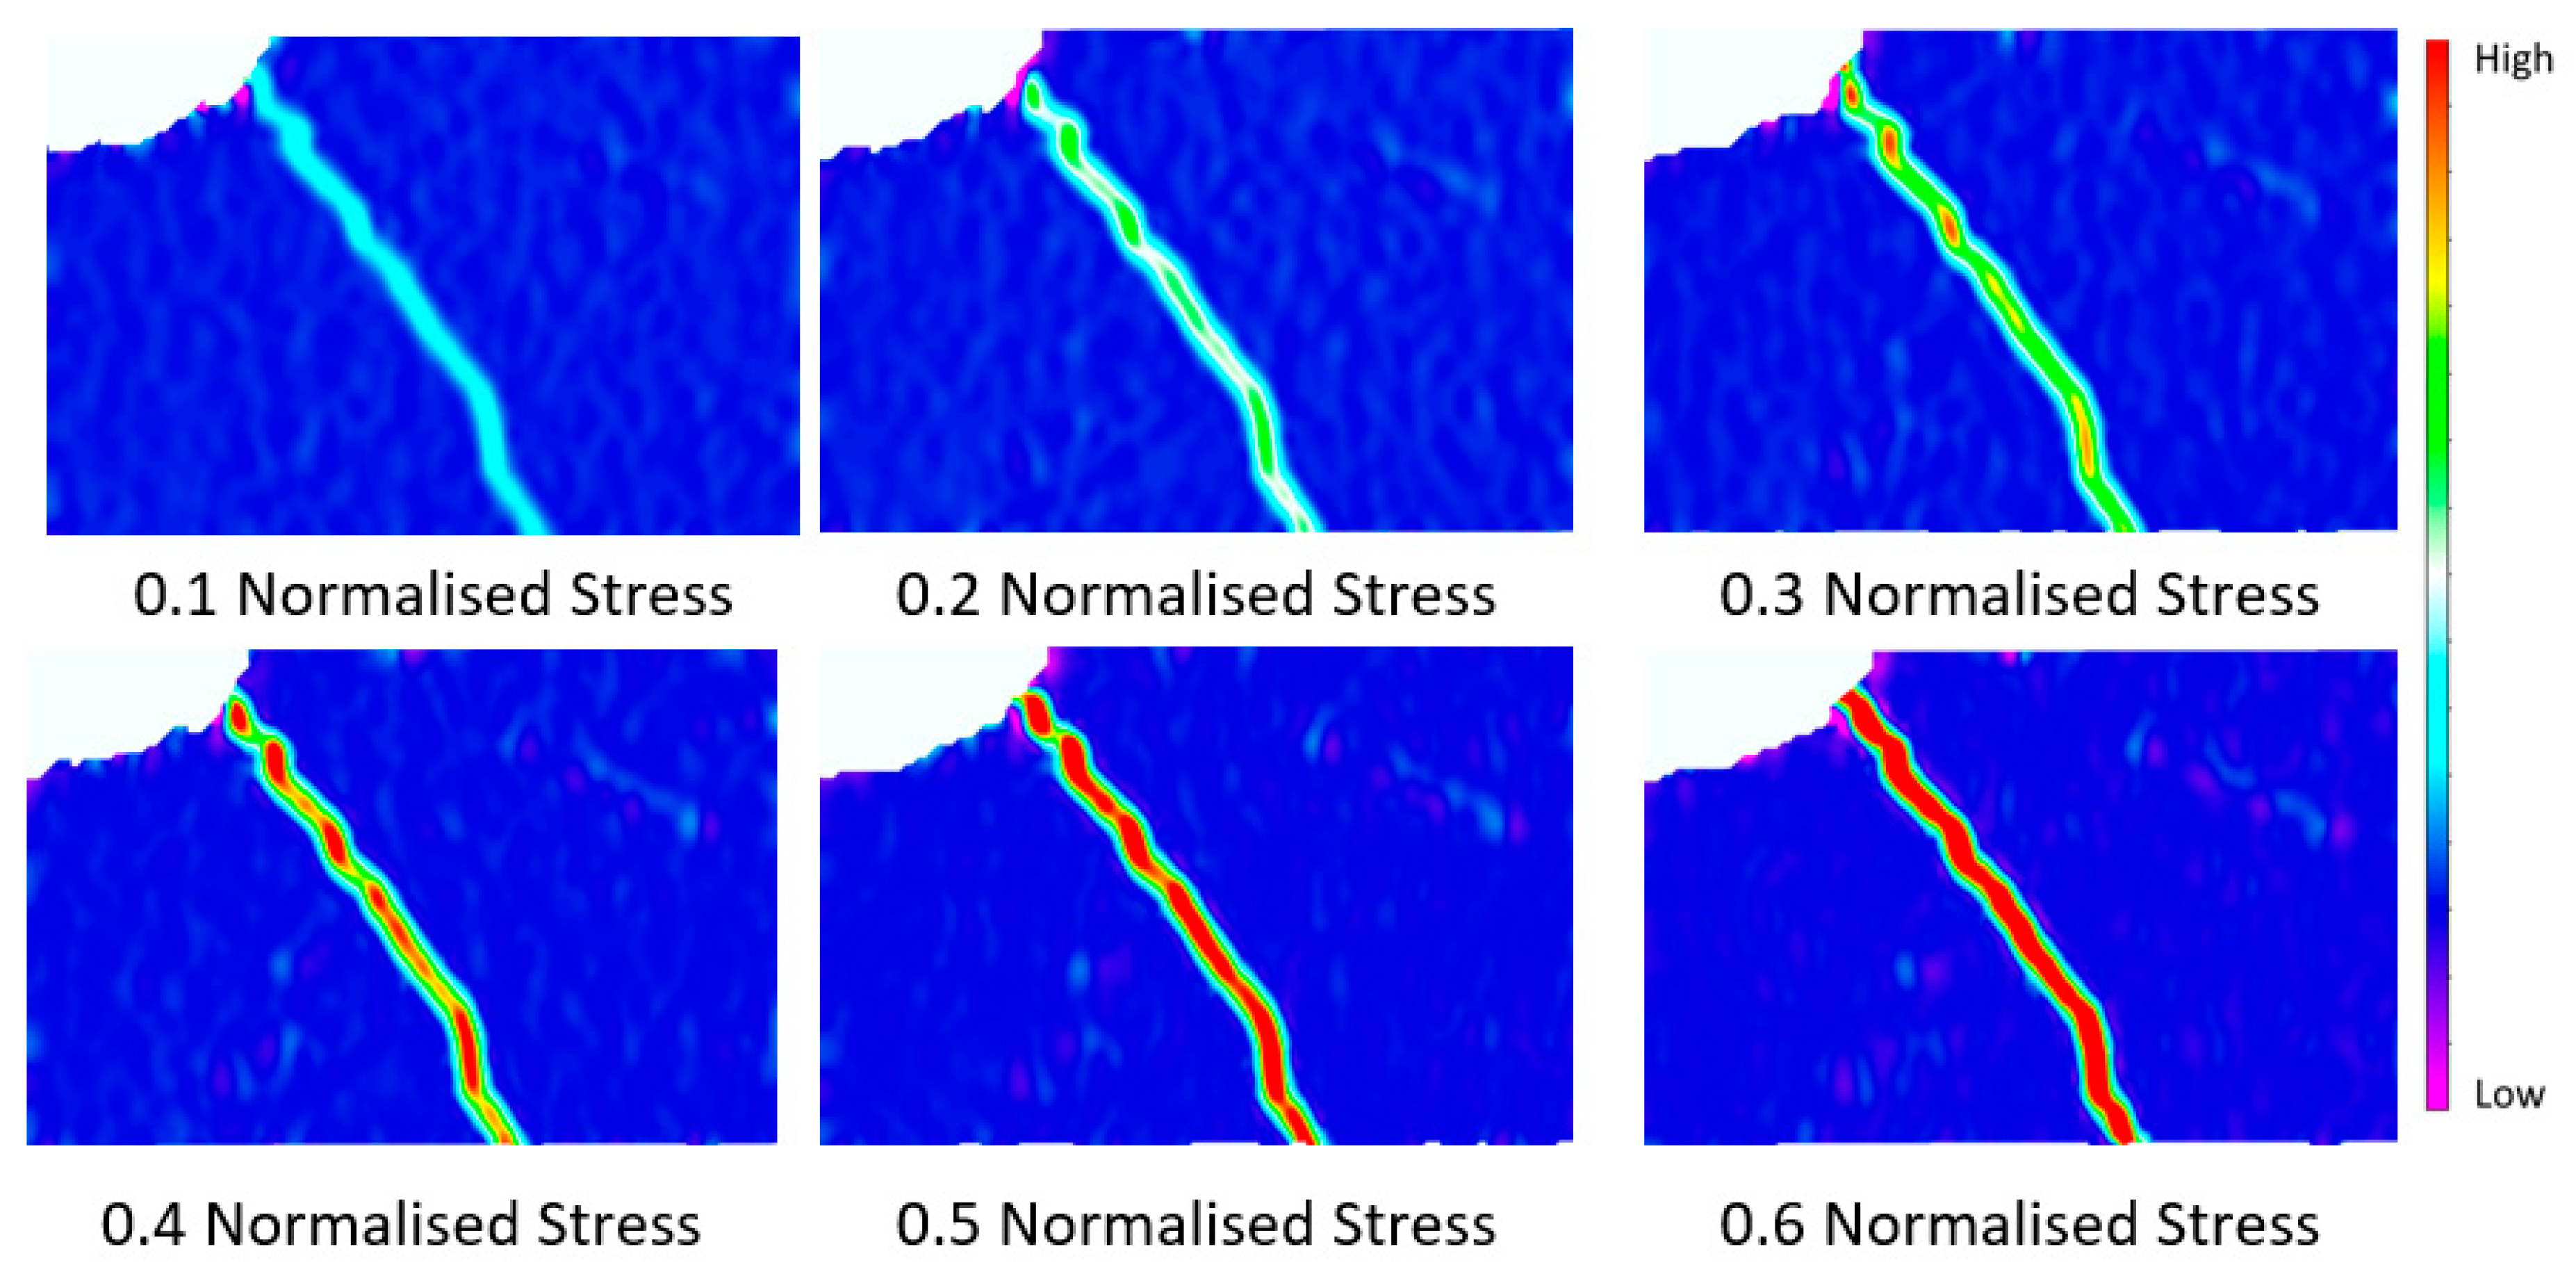
Instantaneous DIC images that were previously employed to define bulk strains plotted in
Figure 4 were sampled to inspect the local distribution in strain within the composite. Selected strain maps are illustrated in
Figure 5 for Control #1 and #2.
Figure 5a,b show the normalised cumulative acoustic energy alongside the associated DIC strain maps.
Figure 5c,d then illustrate higher magnification versions of the same DIC strain maps.
For either specimen, the distribution of strain became highly localised throughout the course of the test, particularly once the limit of proportionality was exceeded. Strain “hot spots” appeared to develop in specimen Control #2 at a slightly lower value of bulk strain compared to Control #1. Despite the waisted, shallow form of the double edge notches, regions of high localised strain were displaced well away from the plane of the net section. The individual high strain regions increased in size horizontally during loading, until opposing regions from either flank coalesced as ultimate failure ensued. When viewed as a function of time on load, significant damage was accumulated immediately prior to fracture.
The trends observed in the cumulative AE response of the specimens were consistent with the evidence from the DIC strain maps. In both tests, as the rate of AE energy increased, the most prevalent strain hot spots appeared in the DIC maps.
3.2. Fatigue Damage Experiments—Samples #1 to #4
A conservative approach was taken when selecting the loading conditions for the initial room temperature fatigue test on Sample #1. To avoid premature overload and to allow the ER readings to stabilise, the test was deliberately initiated at a relatively low cyclic peak load condition (0.13 normalised stress). Once no discernable increases in ER or AE signals were detected, the peak cyclic load was increased after ~10,000 cycles. Such steps were repeated until relevant increases were noted. Only the data pertinent to the final loading block are presented (
Figure 6), effectively ignoring any damage associated with the early stage/low stress loading regimes.
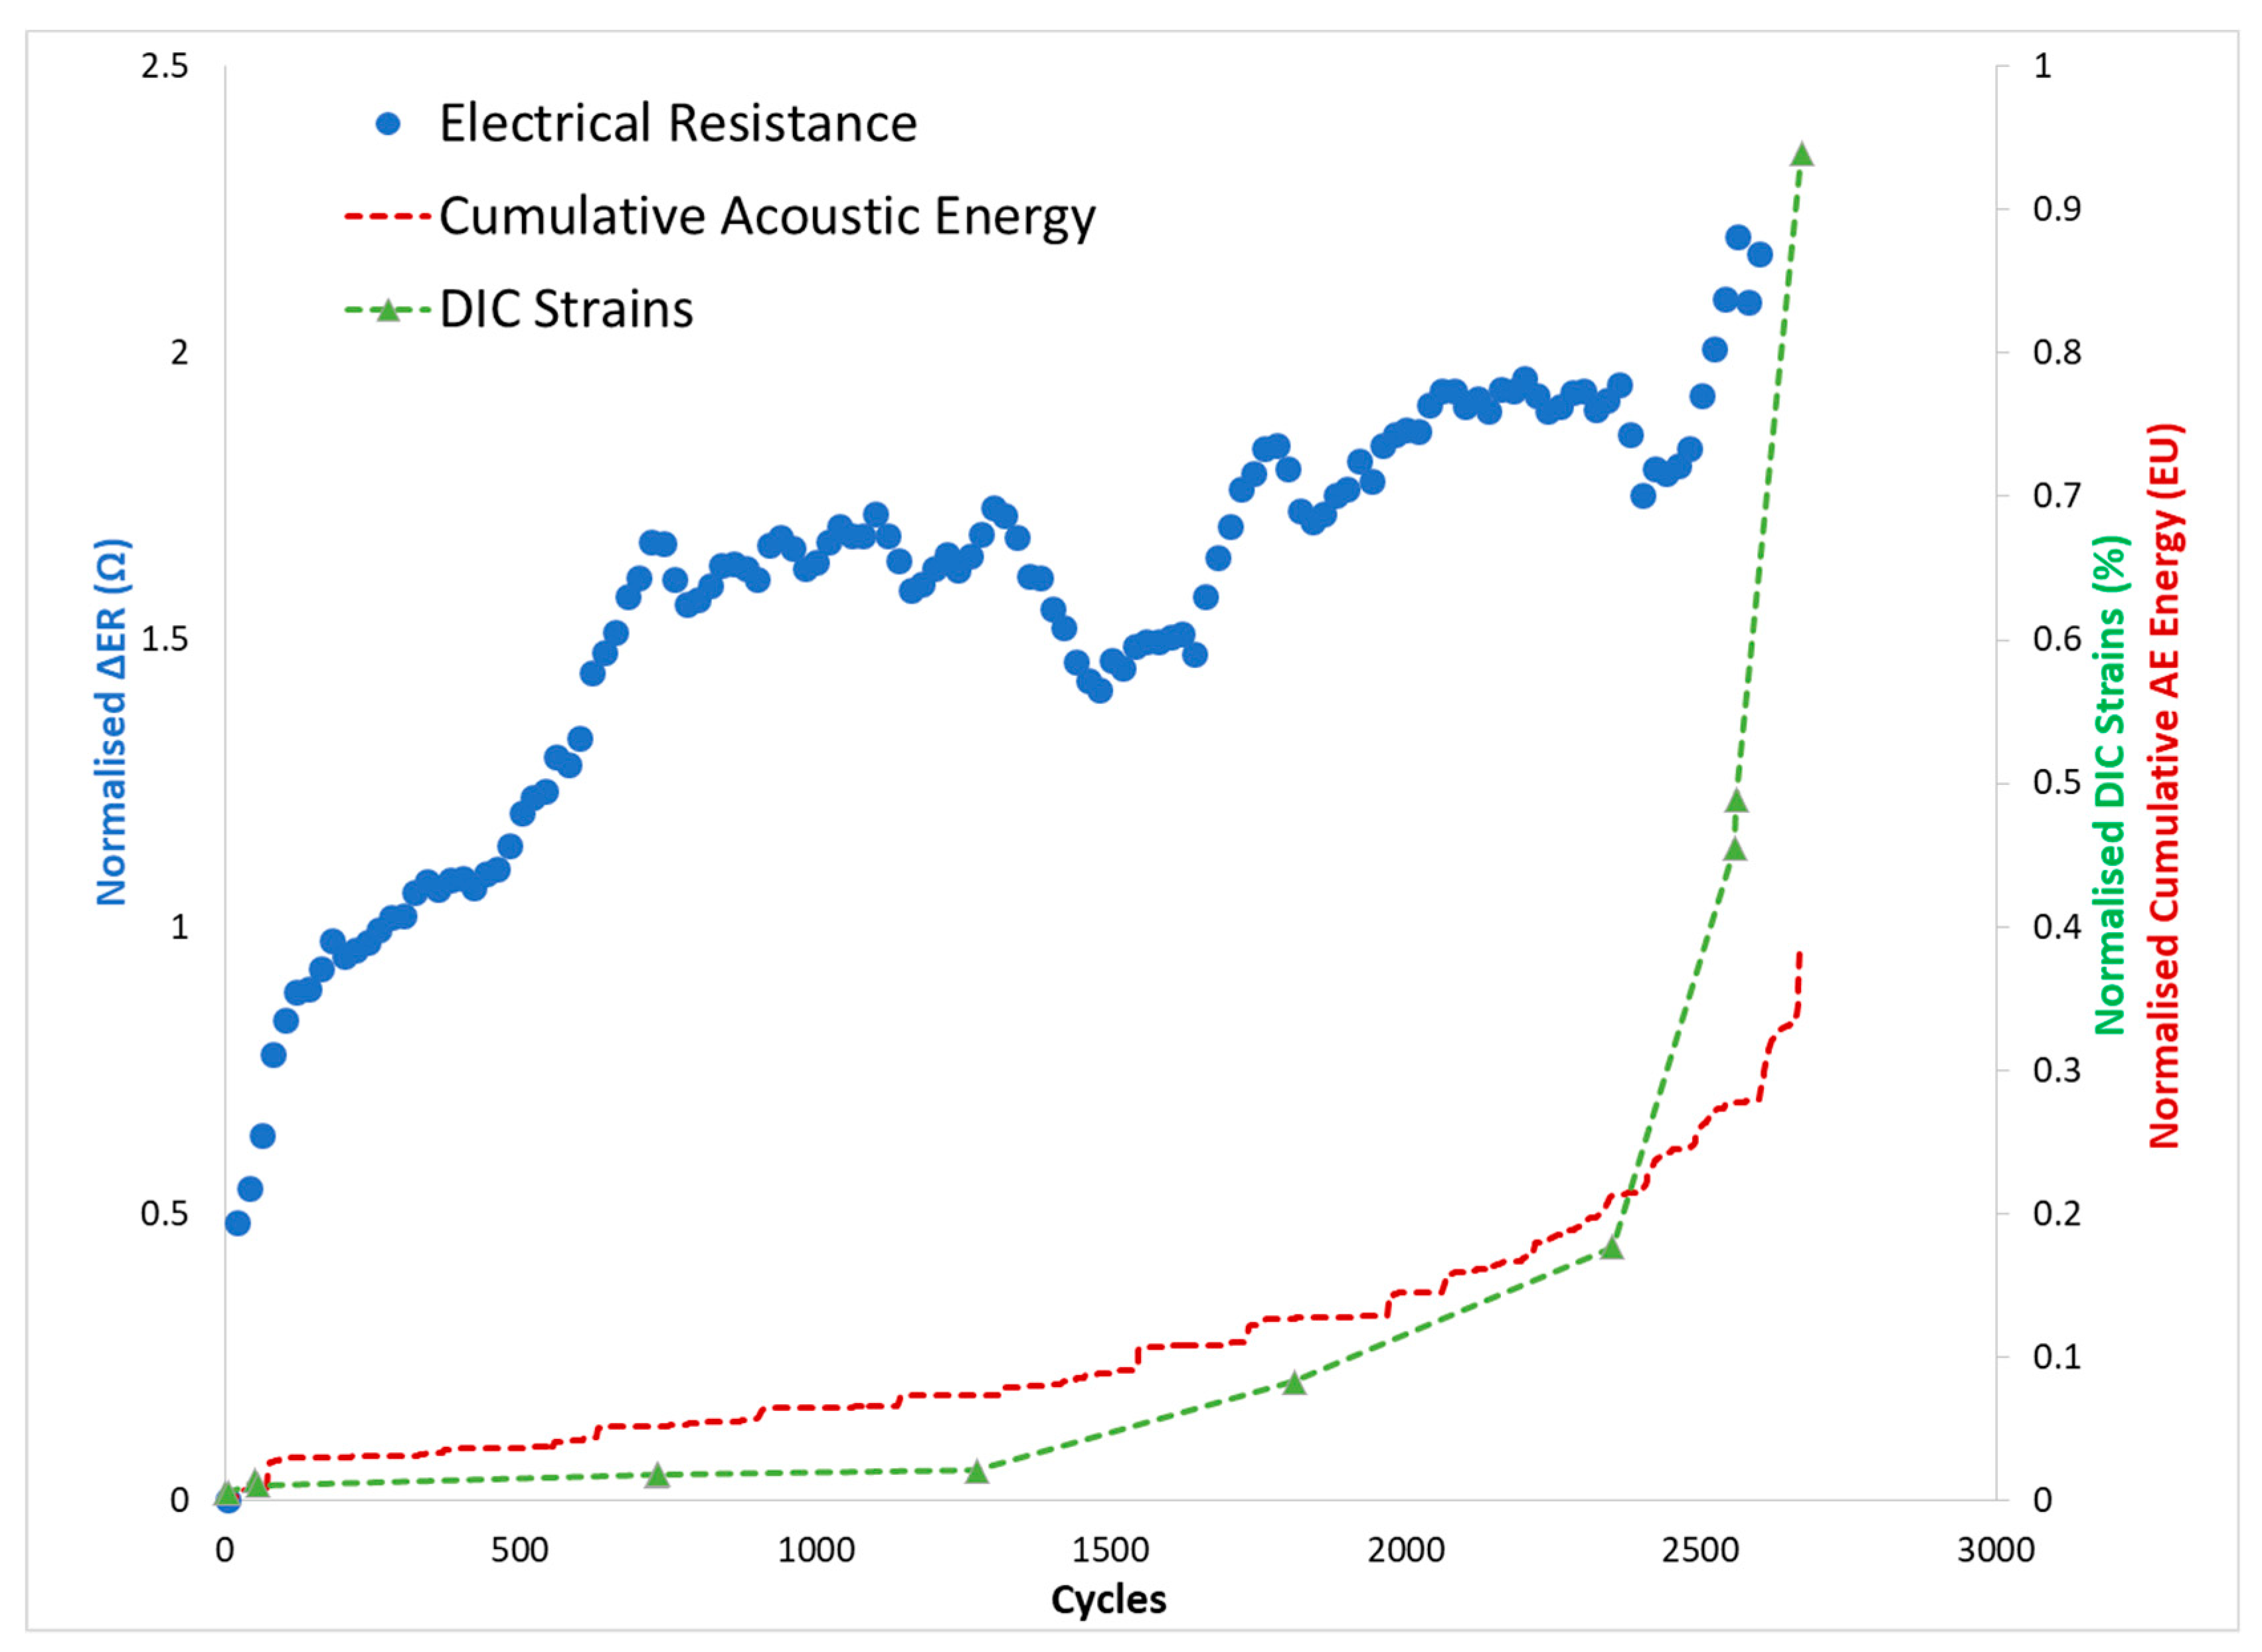
During this test, the trends in data from the different monitoring techniques correlated well. Each method indicated a rapid increase in response over the first 200 cycles leading to a near steady rate of signal accumulation during the remaining stages of the test. During the final 500 cycles, the ER measurements indicated an apparent onset in failure. The AE response increased rapidly, immediately prior to rupture. The specimen failed in a typical catastrophic fashion after approximately 2800 cycles. No definite indication of failure location was noted from the associated DIC measurements.
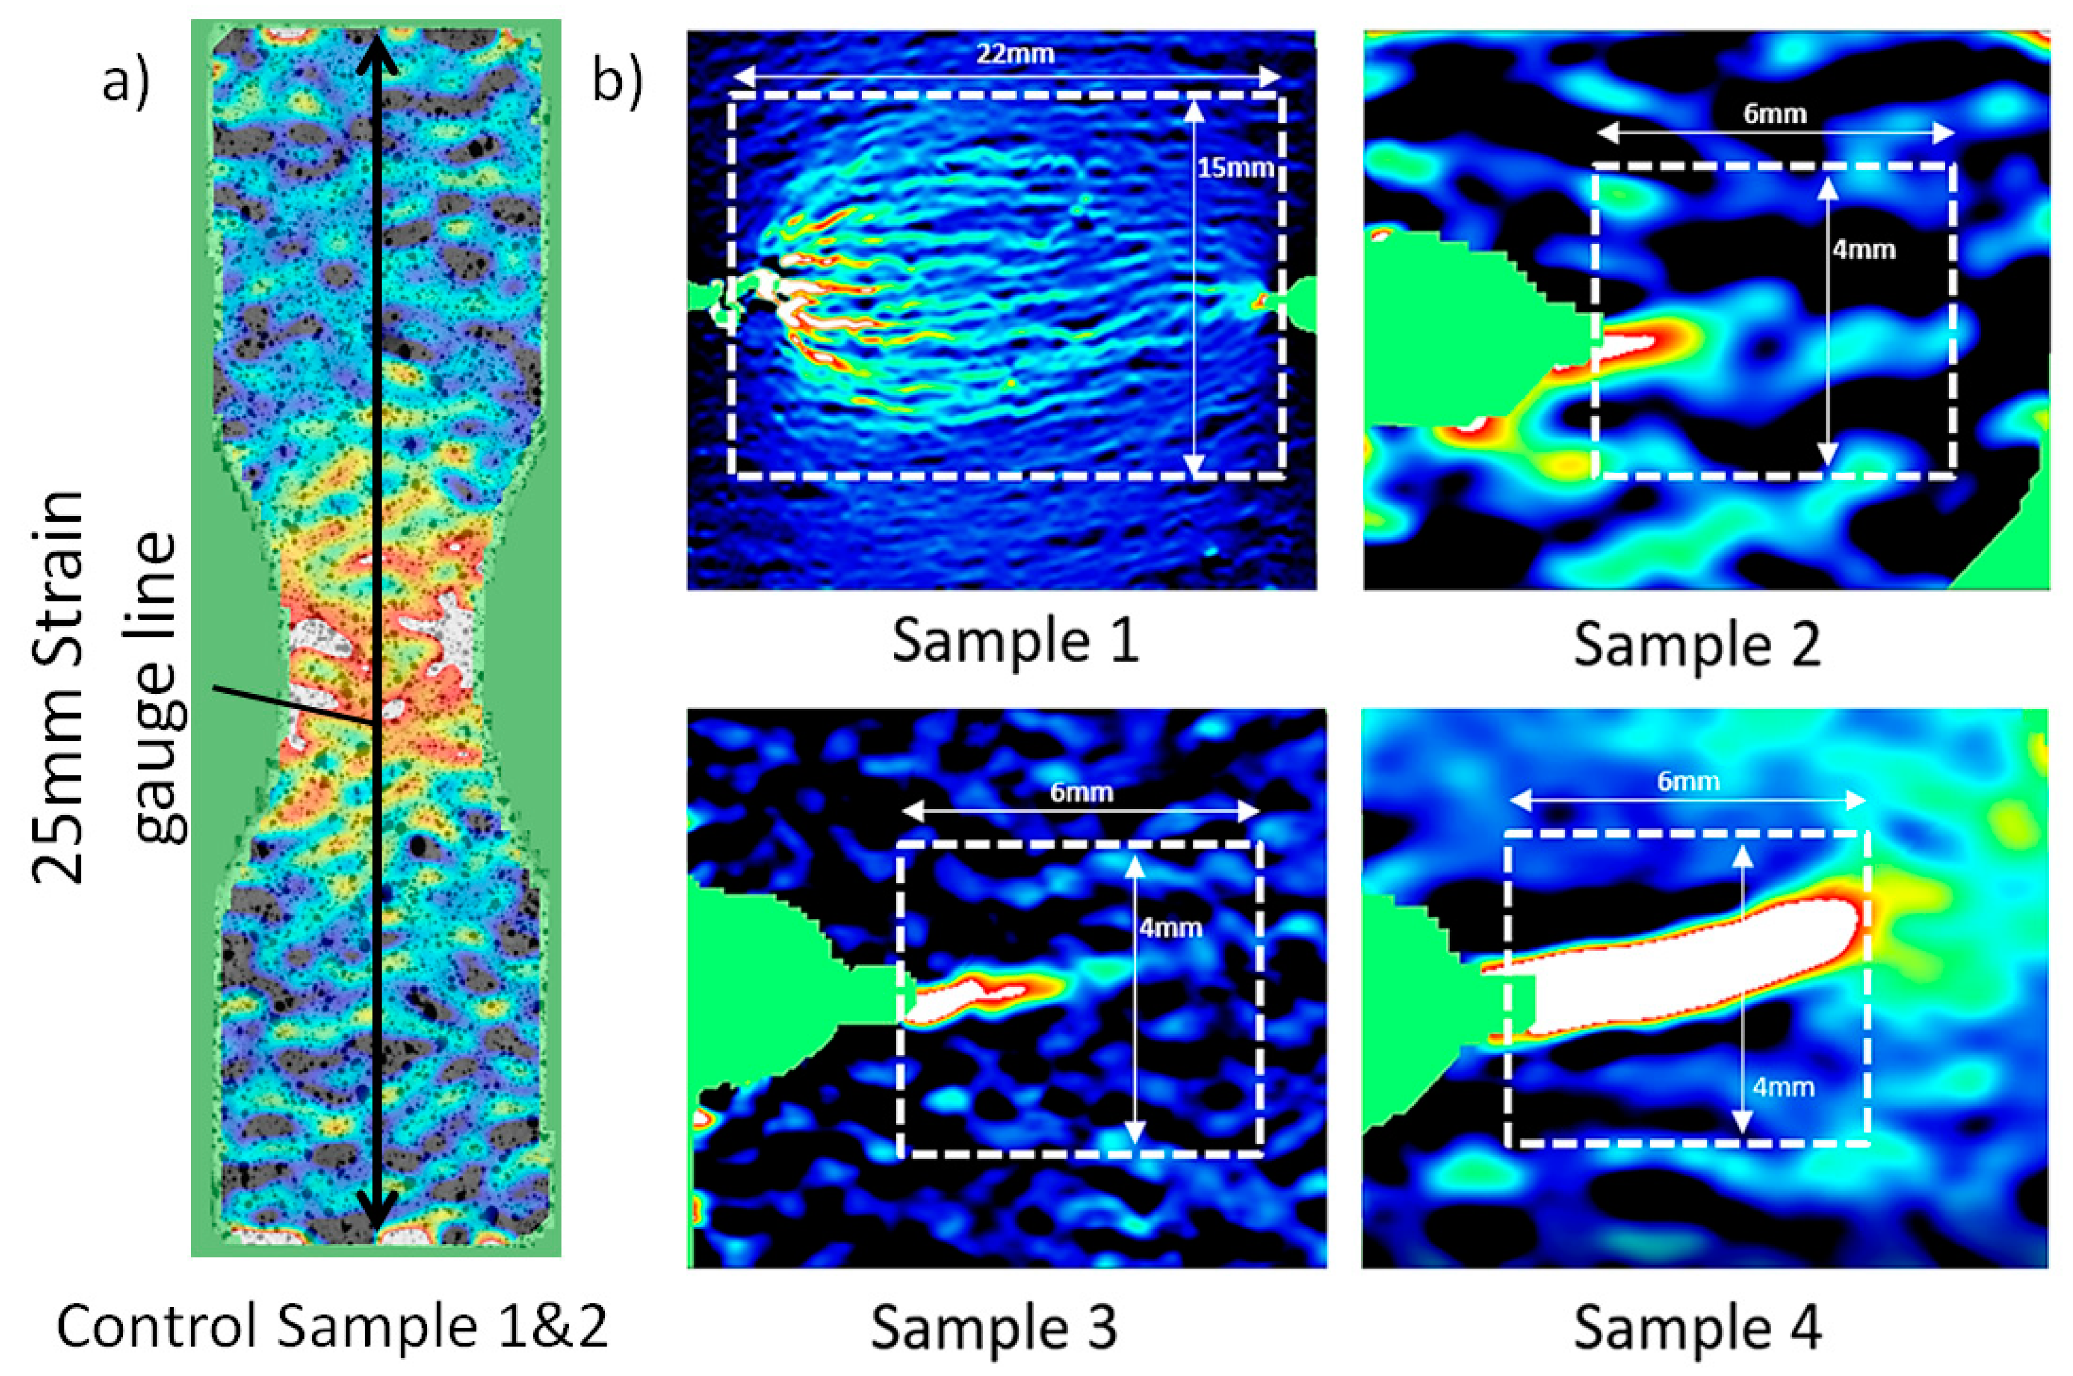
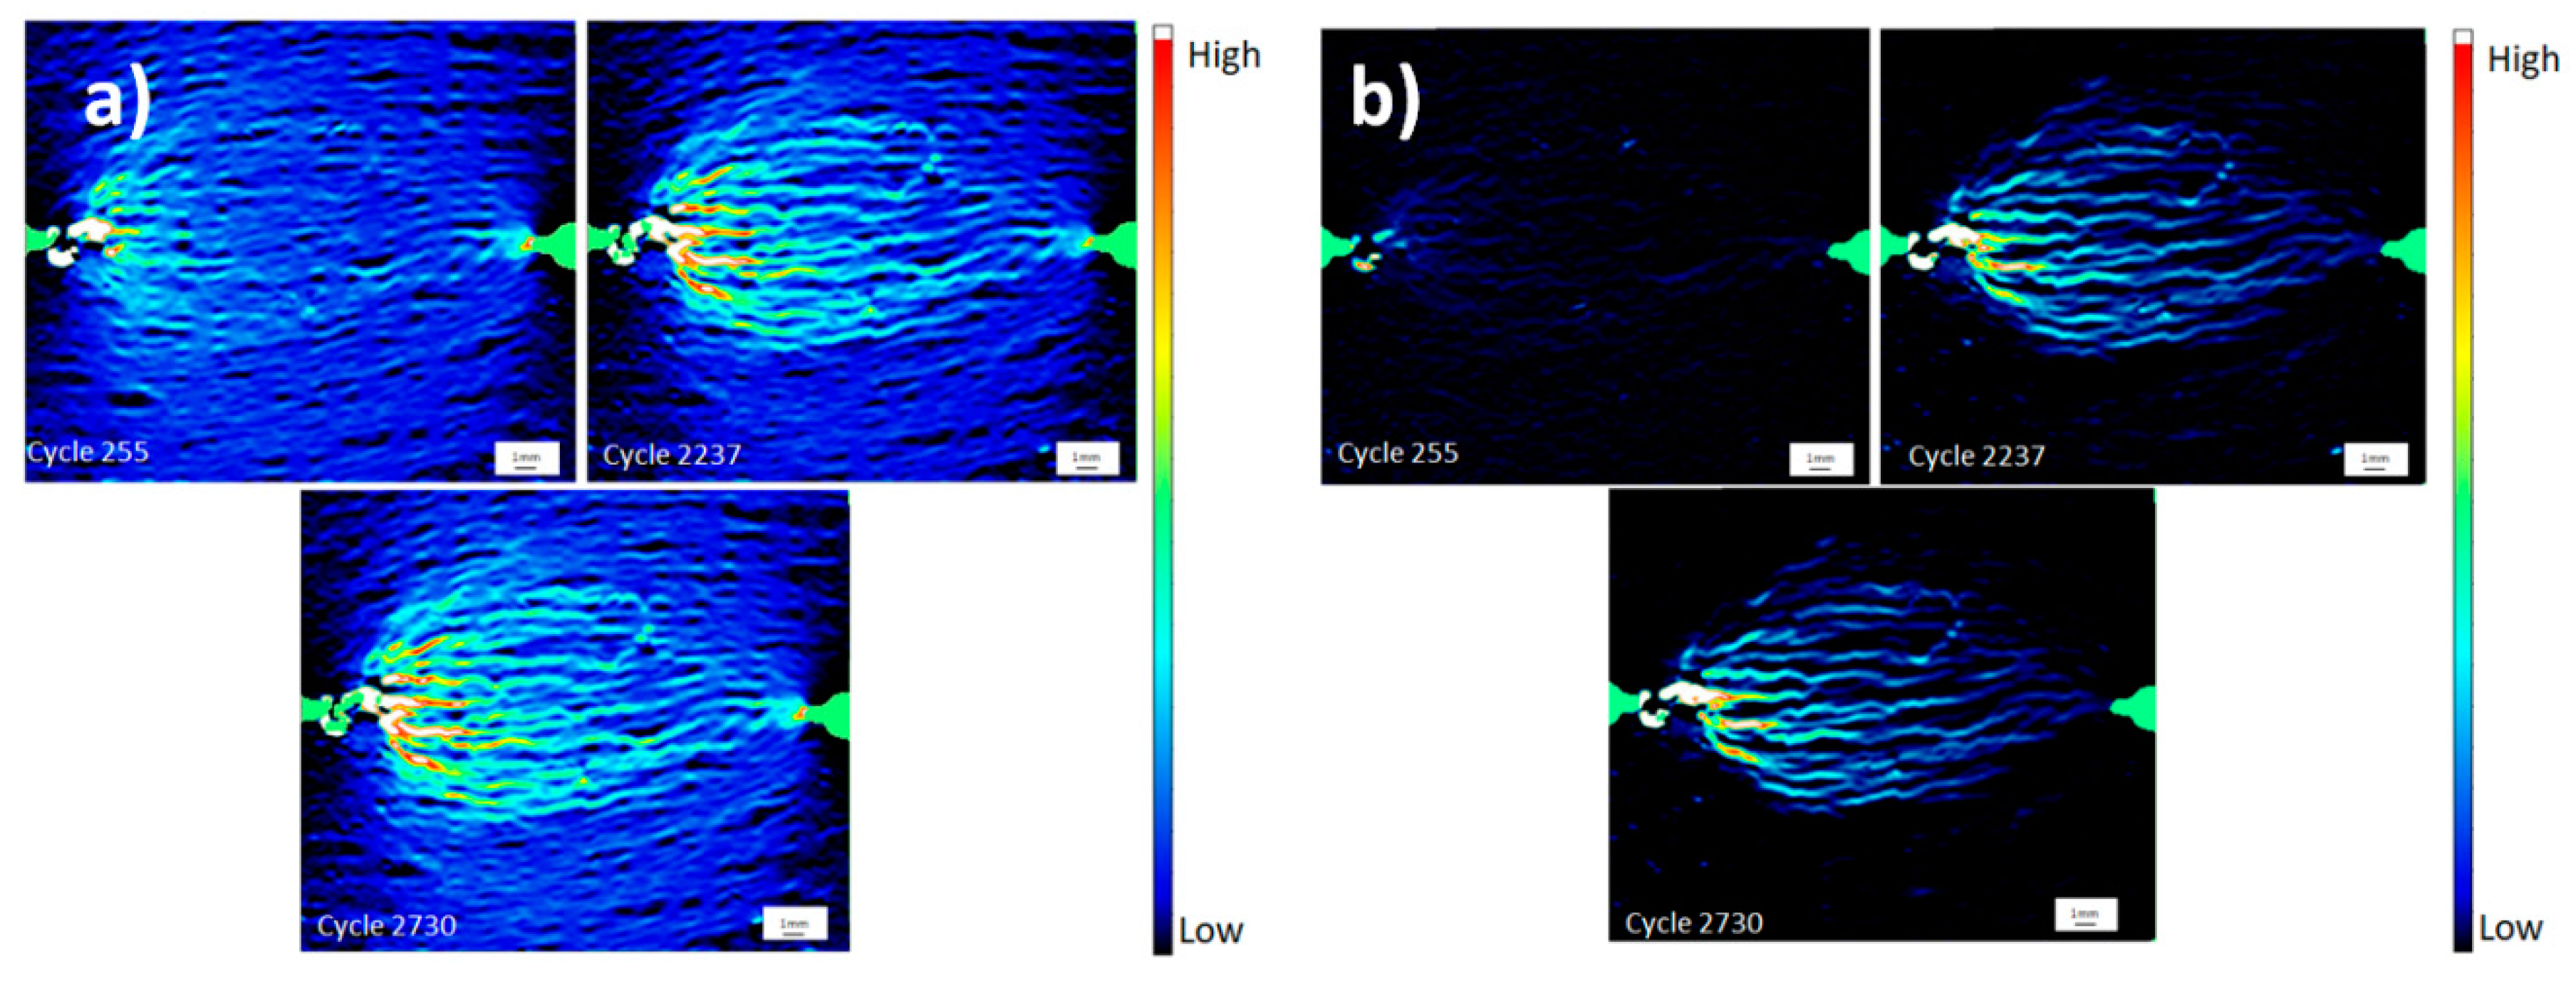
The DIC strain maps presented in
Figure 7 illustrate the distribution of damage during the test (N=225 onwards). Distinct, narrow zones of localised high strain developed and preferentially extended from the tip of the left-hand notch. The strain maps relate to images recorded at (a) the peak stress and (b) minimum stress conditions of the quoted cycles.
Areas of residual strain were noted at the trough of the loading cycle. Regions that previously displayed the highest localised strain values at the peak of the cycle remained in a permanently strained state post unloading, indicating permanent damage retained in the composite. Damage inboard of the right-hand notch was restricted to a very localised region at the tip of the machined slit feature, and this strain was fully recovered on unloading, even during N = 2730 which occurred immediately before catastrophic failure.
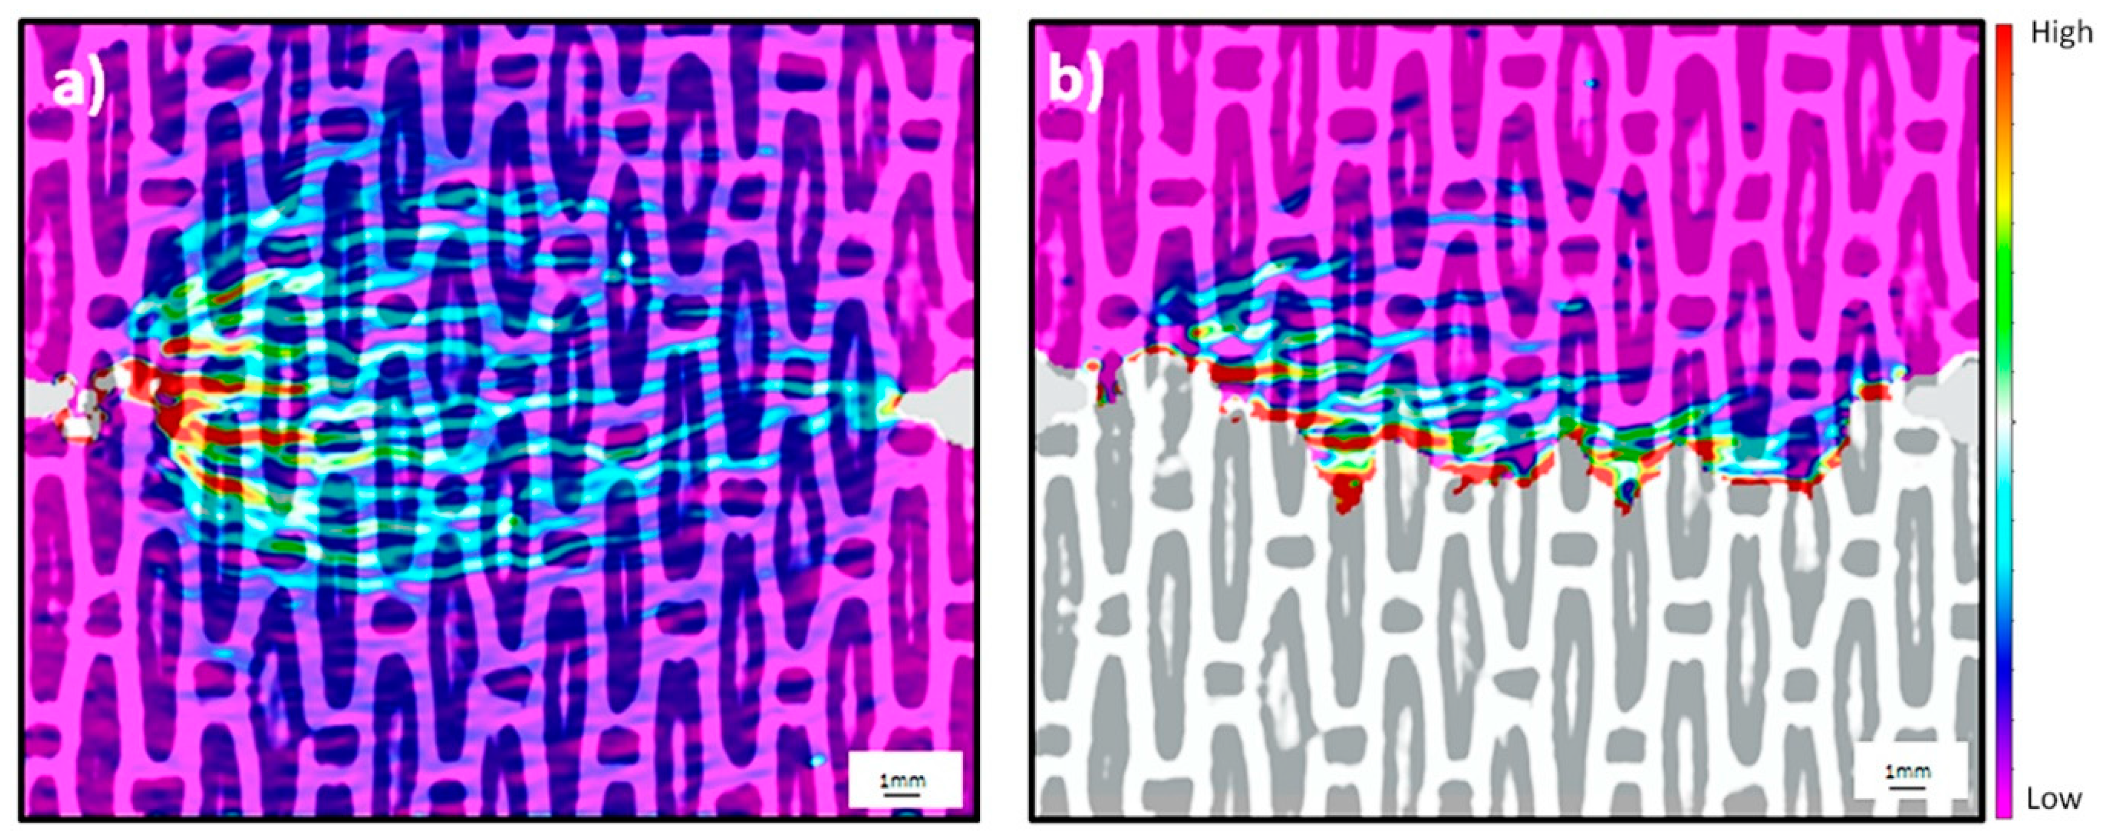
The images in
Figure 8 show the surface fibre architecture, as recorded using the “surface profile” function of the DIC imaging system, superimposed onto two strain maps obtained at (a) N = 2730 under peak stress and (b) from the one half of the ruptured specimen at N = 2800 and zero applied stress. Note this form of imaging was only possible for the room temperature test.
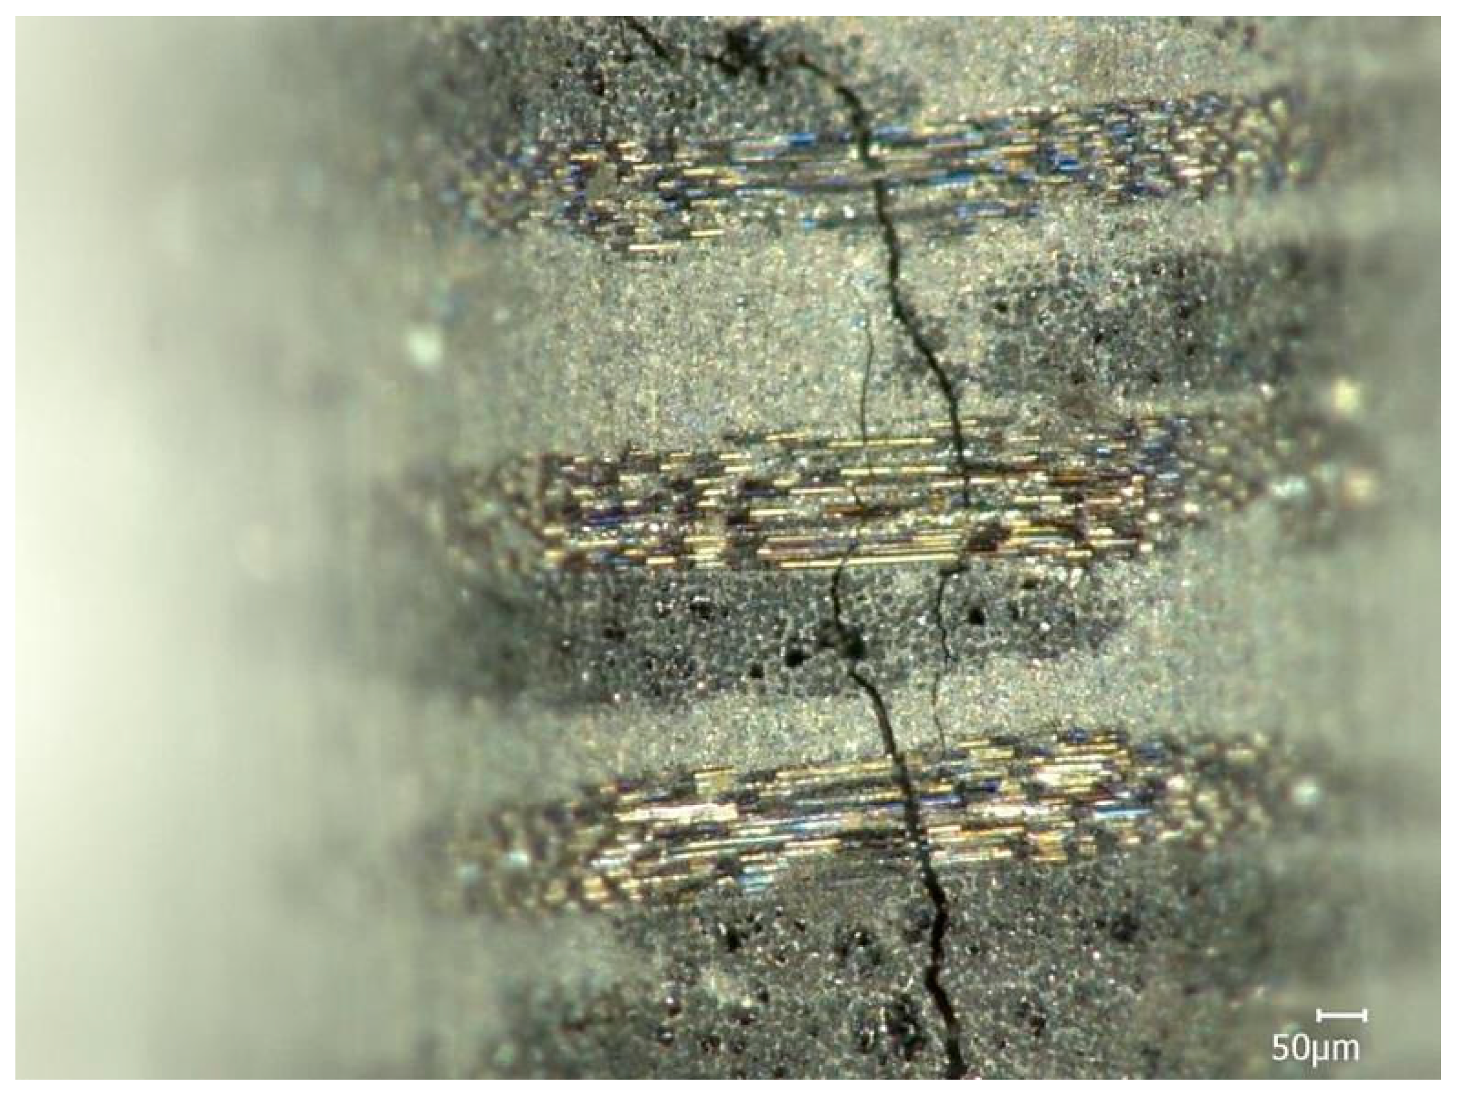
The images indicate that the tip of the left hand pre-machined sharp slit was located adjacent to a longitudinal, 0° fibre tow, slightly inboard of this front face surface. Fourteen distinct longitudinal tows were identified across the net section. Viewing from left to right, the horizontal regions of concentrated high strain traversed the consecutive longitudinal tows with minimal deviation; however, the number of individual damage zones increased with each tow away from the slit. The maximum height of the damage zone correlates spatially with the sixth longitudinal tow, beyond which the zone contracts towards the right-hand side of the specimen.
Figure 8b illustrates that the localised regions of permanent, residual strain are concentrated immediately adjacent to the flanks of the fracture surface. The areas of highest residual strain traversed both fibre and matrix phases exposed at the surface. Previously strained regions, more than ~10 mm, displaced from the fracture plane have been recovered in a fully elastic fashion. There was a minimal deviation of the major crack away from the net section plane, and only limited fibre pull out across the fracture surface.
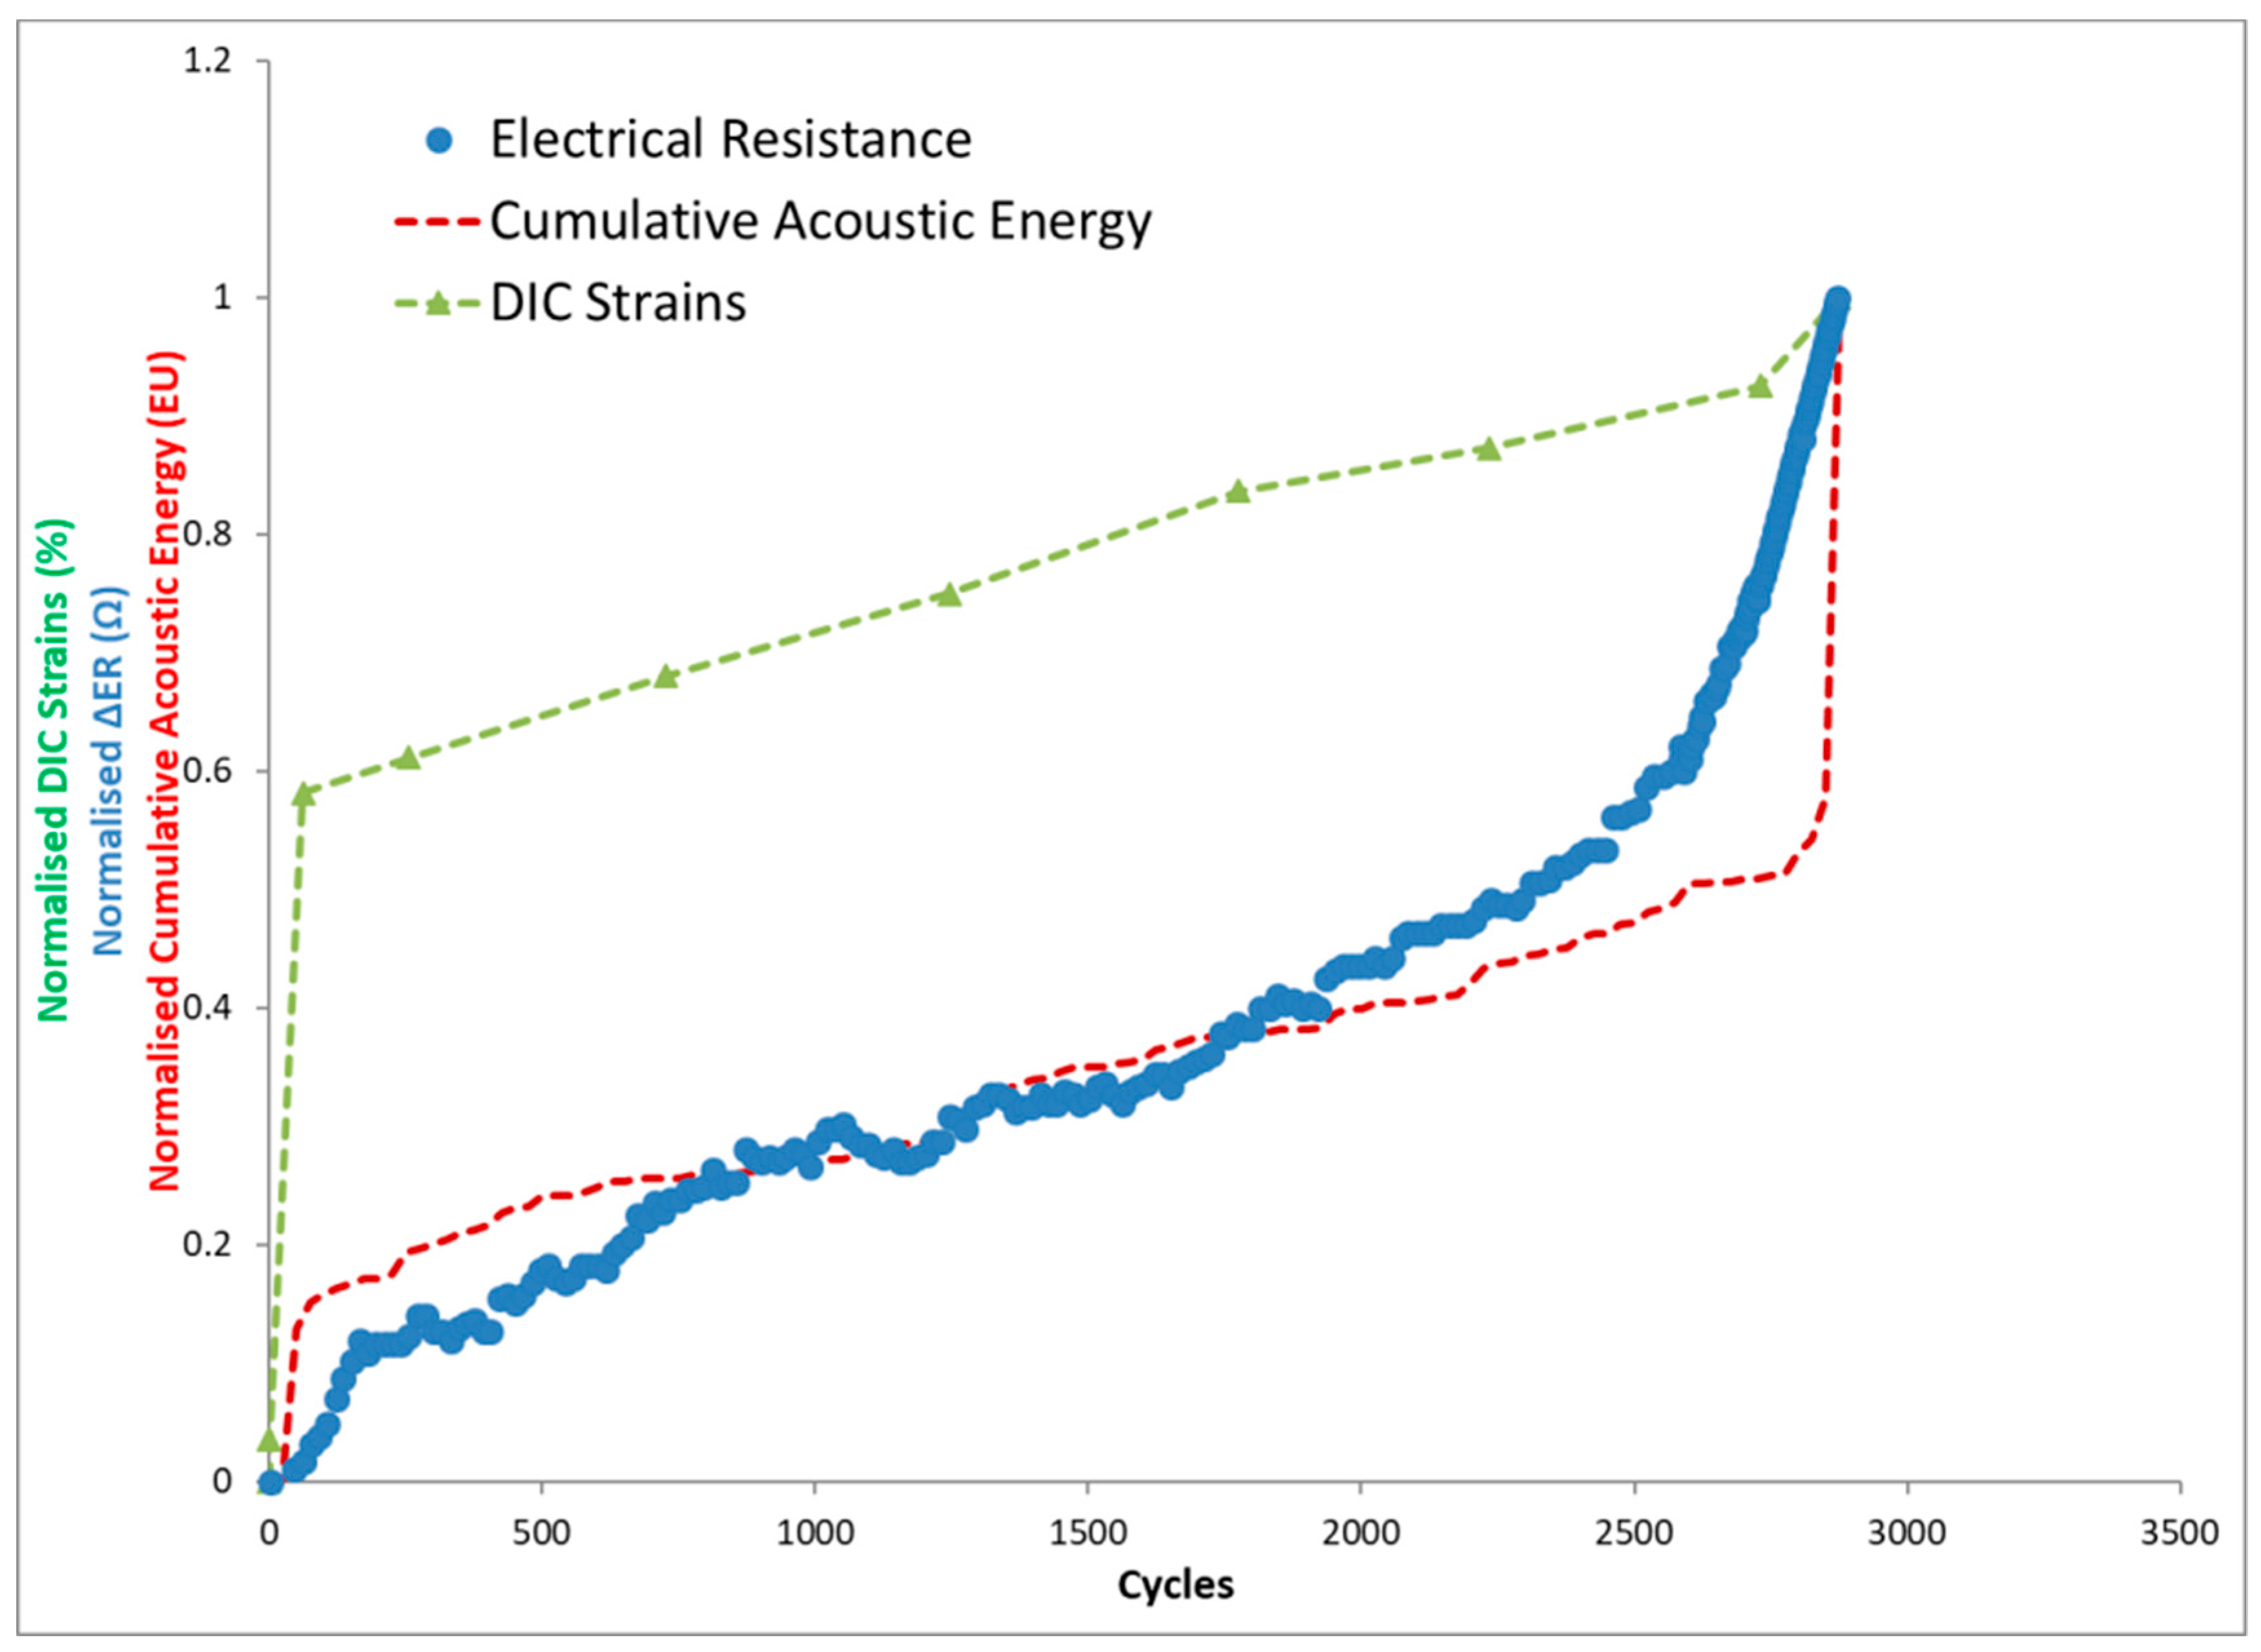
Sample #2 was tested at 800 °C, and a normalised peak cyclic stress of 0.6 was observed.
Figure 9 displays electrical resistance, strains calculated via DIC and the acoustic response as a function of applied cycles.
The resistance data measured from this specimen displayed a higher degree of scatter compared to the previous room temperature test. The overall trend, however, again displays a rapid increase over the first 500 cycles, which then slows to a more gradual increase with successive cycles. There was no significant change in the rate of resistance accumulation immediately prior to failure; however, compared to the room temperature response of Sample #1, the total ER increase during the course of this test approached 700%, a distinctly high value. DIC and AE data displayed a consistent response. Both AE and DIC presented relatively stable values over the first 1600 cycles; however, both indicated an acceleration toward failure. The gradient continued to increase until failure ensued in a rapid fashion around 3500 cycles.
The DIC strain maps measured during the course of this test provided some success in detailing the inhomogeneous strain field (
Figure 10); however, the degradation of the speckled high-temperature paint and the effects of thermal drift affected the resolution of the maps. Regardless, some useful information was obtained, with high localised strain detected at the tip of the notch slit immediately during the first load cycle, with the expansion of this region progressing over the course of the test.
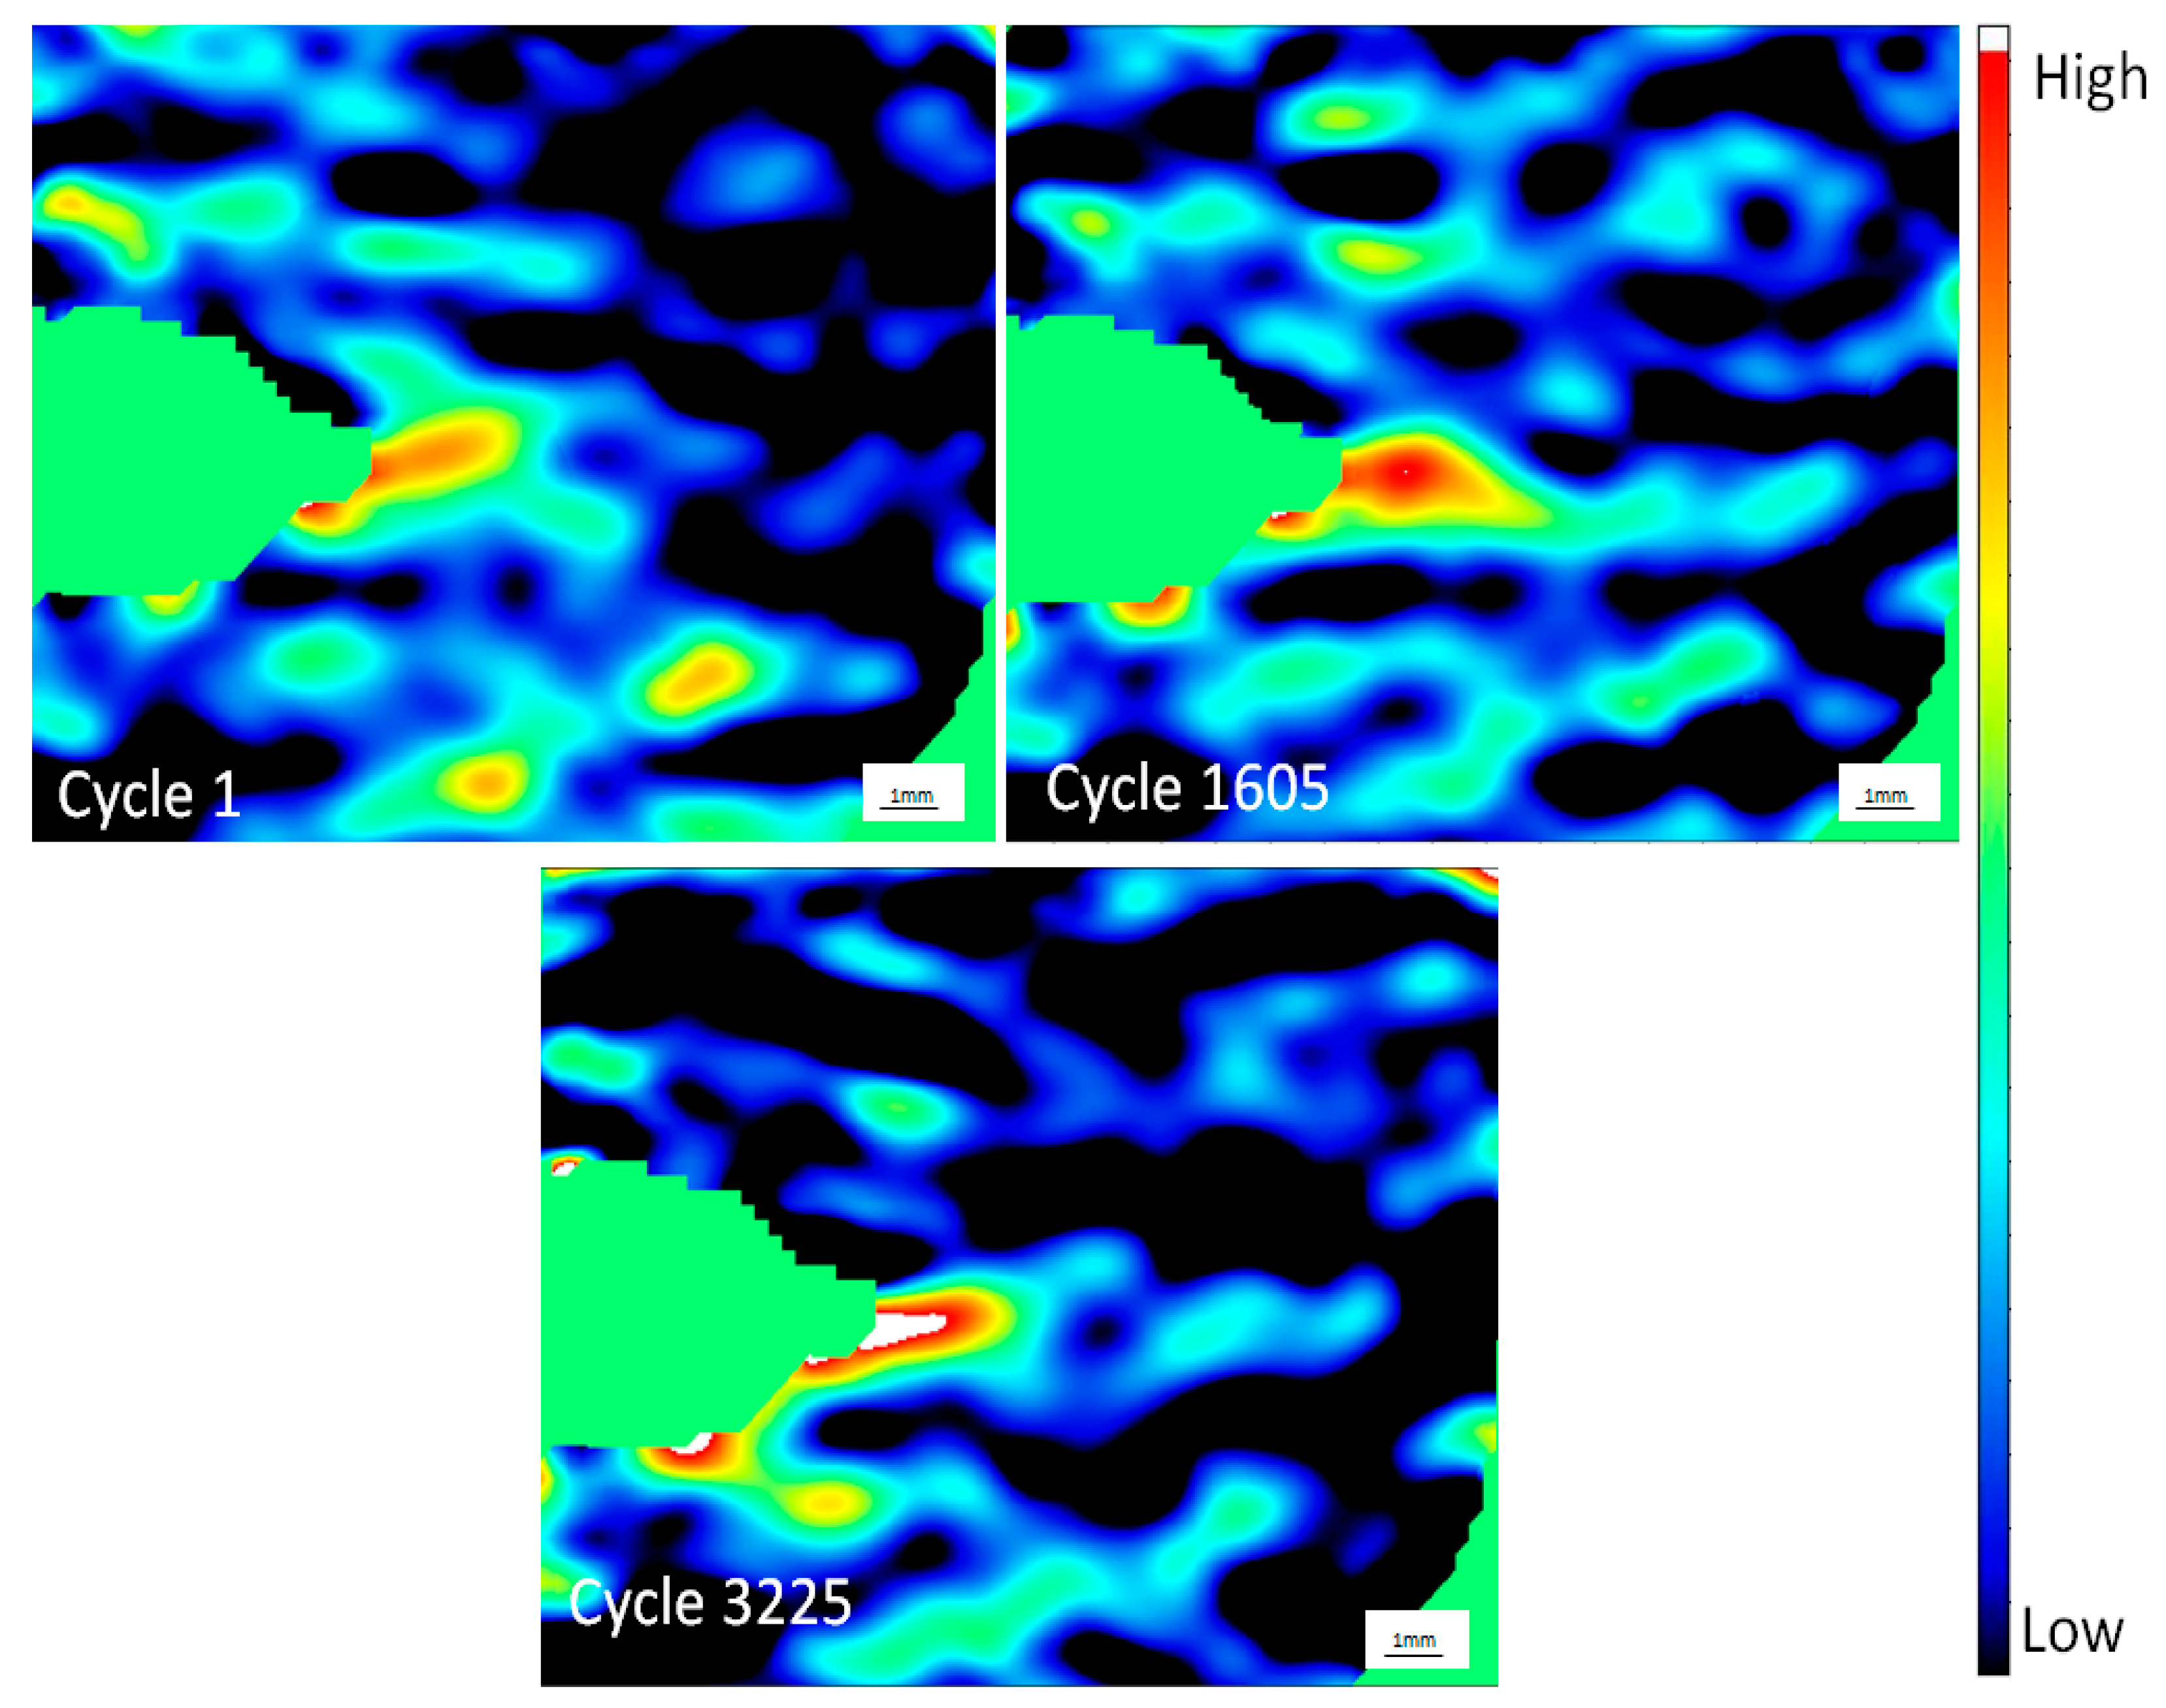
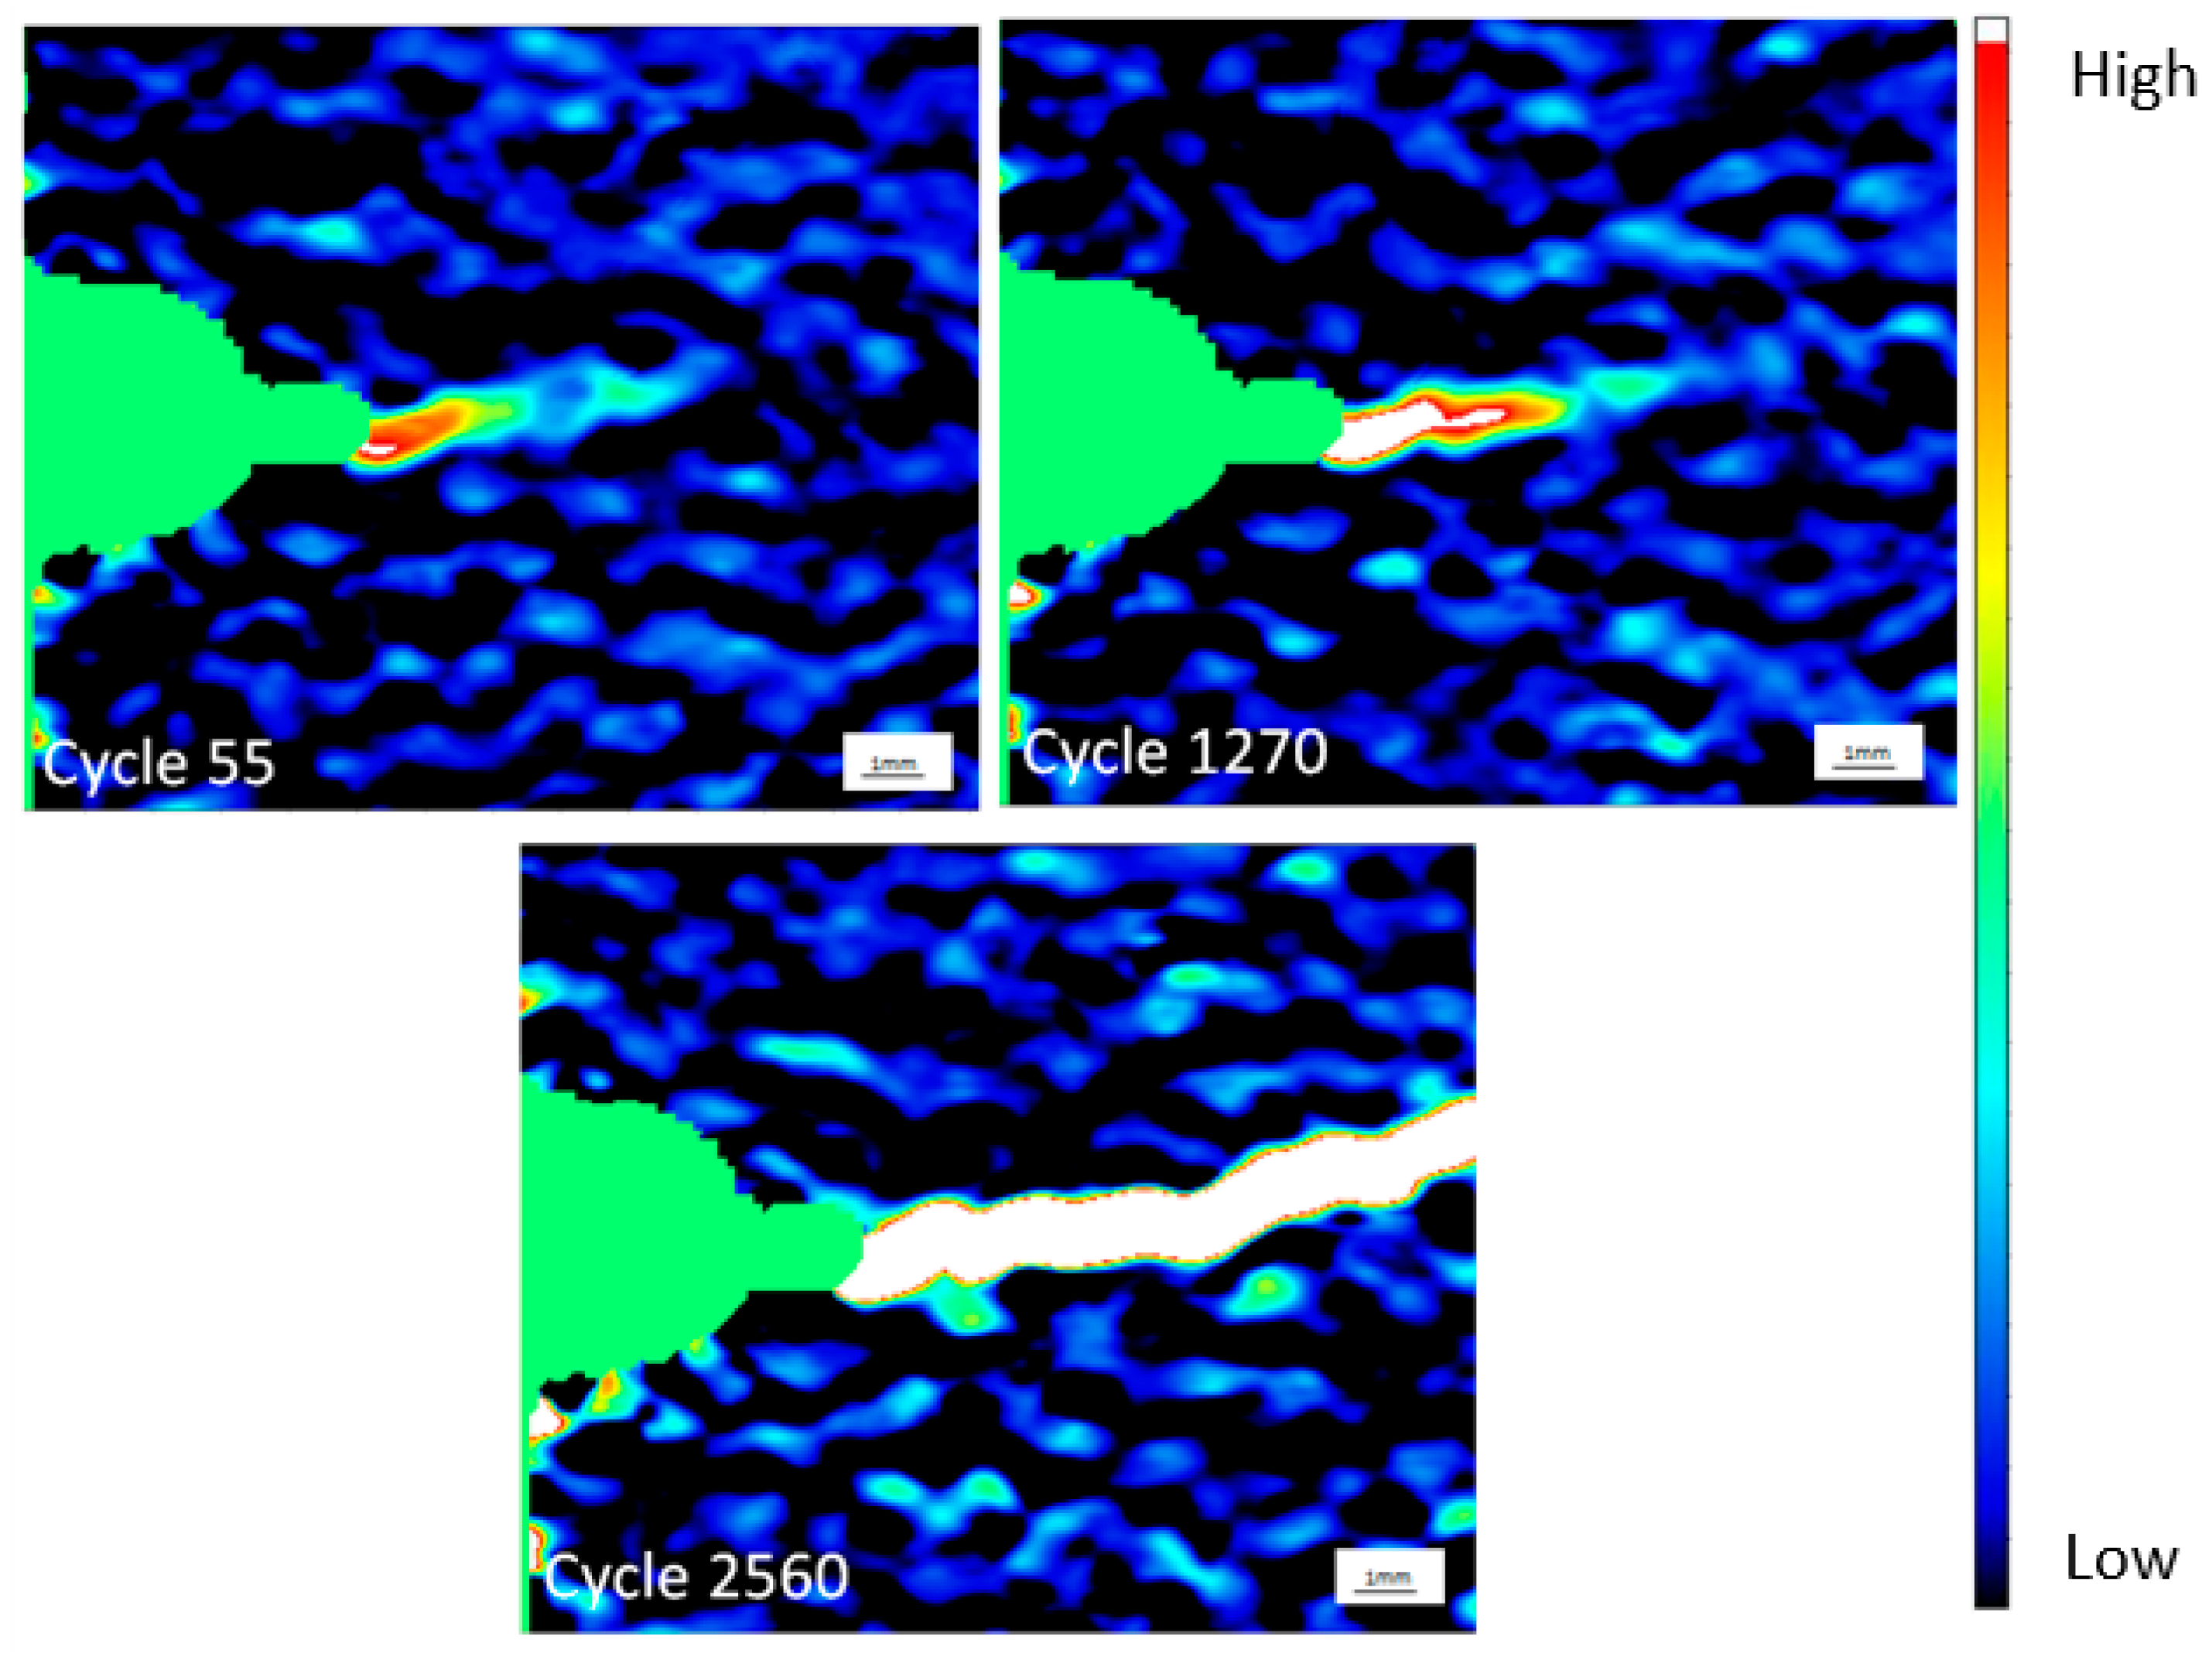
Figure 11 shows the results of the test on Sample #3, performed at normalised stress of 0.5. This test gave greater success in terms of DIC, benefitting from the improved image resolution due to changes in the speckle paint and employment of a temperature tolerant glass furnace window. On this occasion, both AE and DIC strain measurements indicated a more gradual increase approaching the failure event. ER was unable to predict the onset of failure given the degree of scatter during the course of the test.
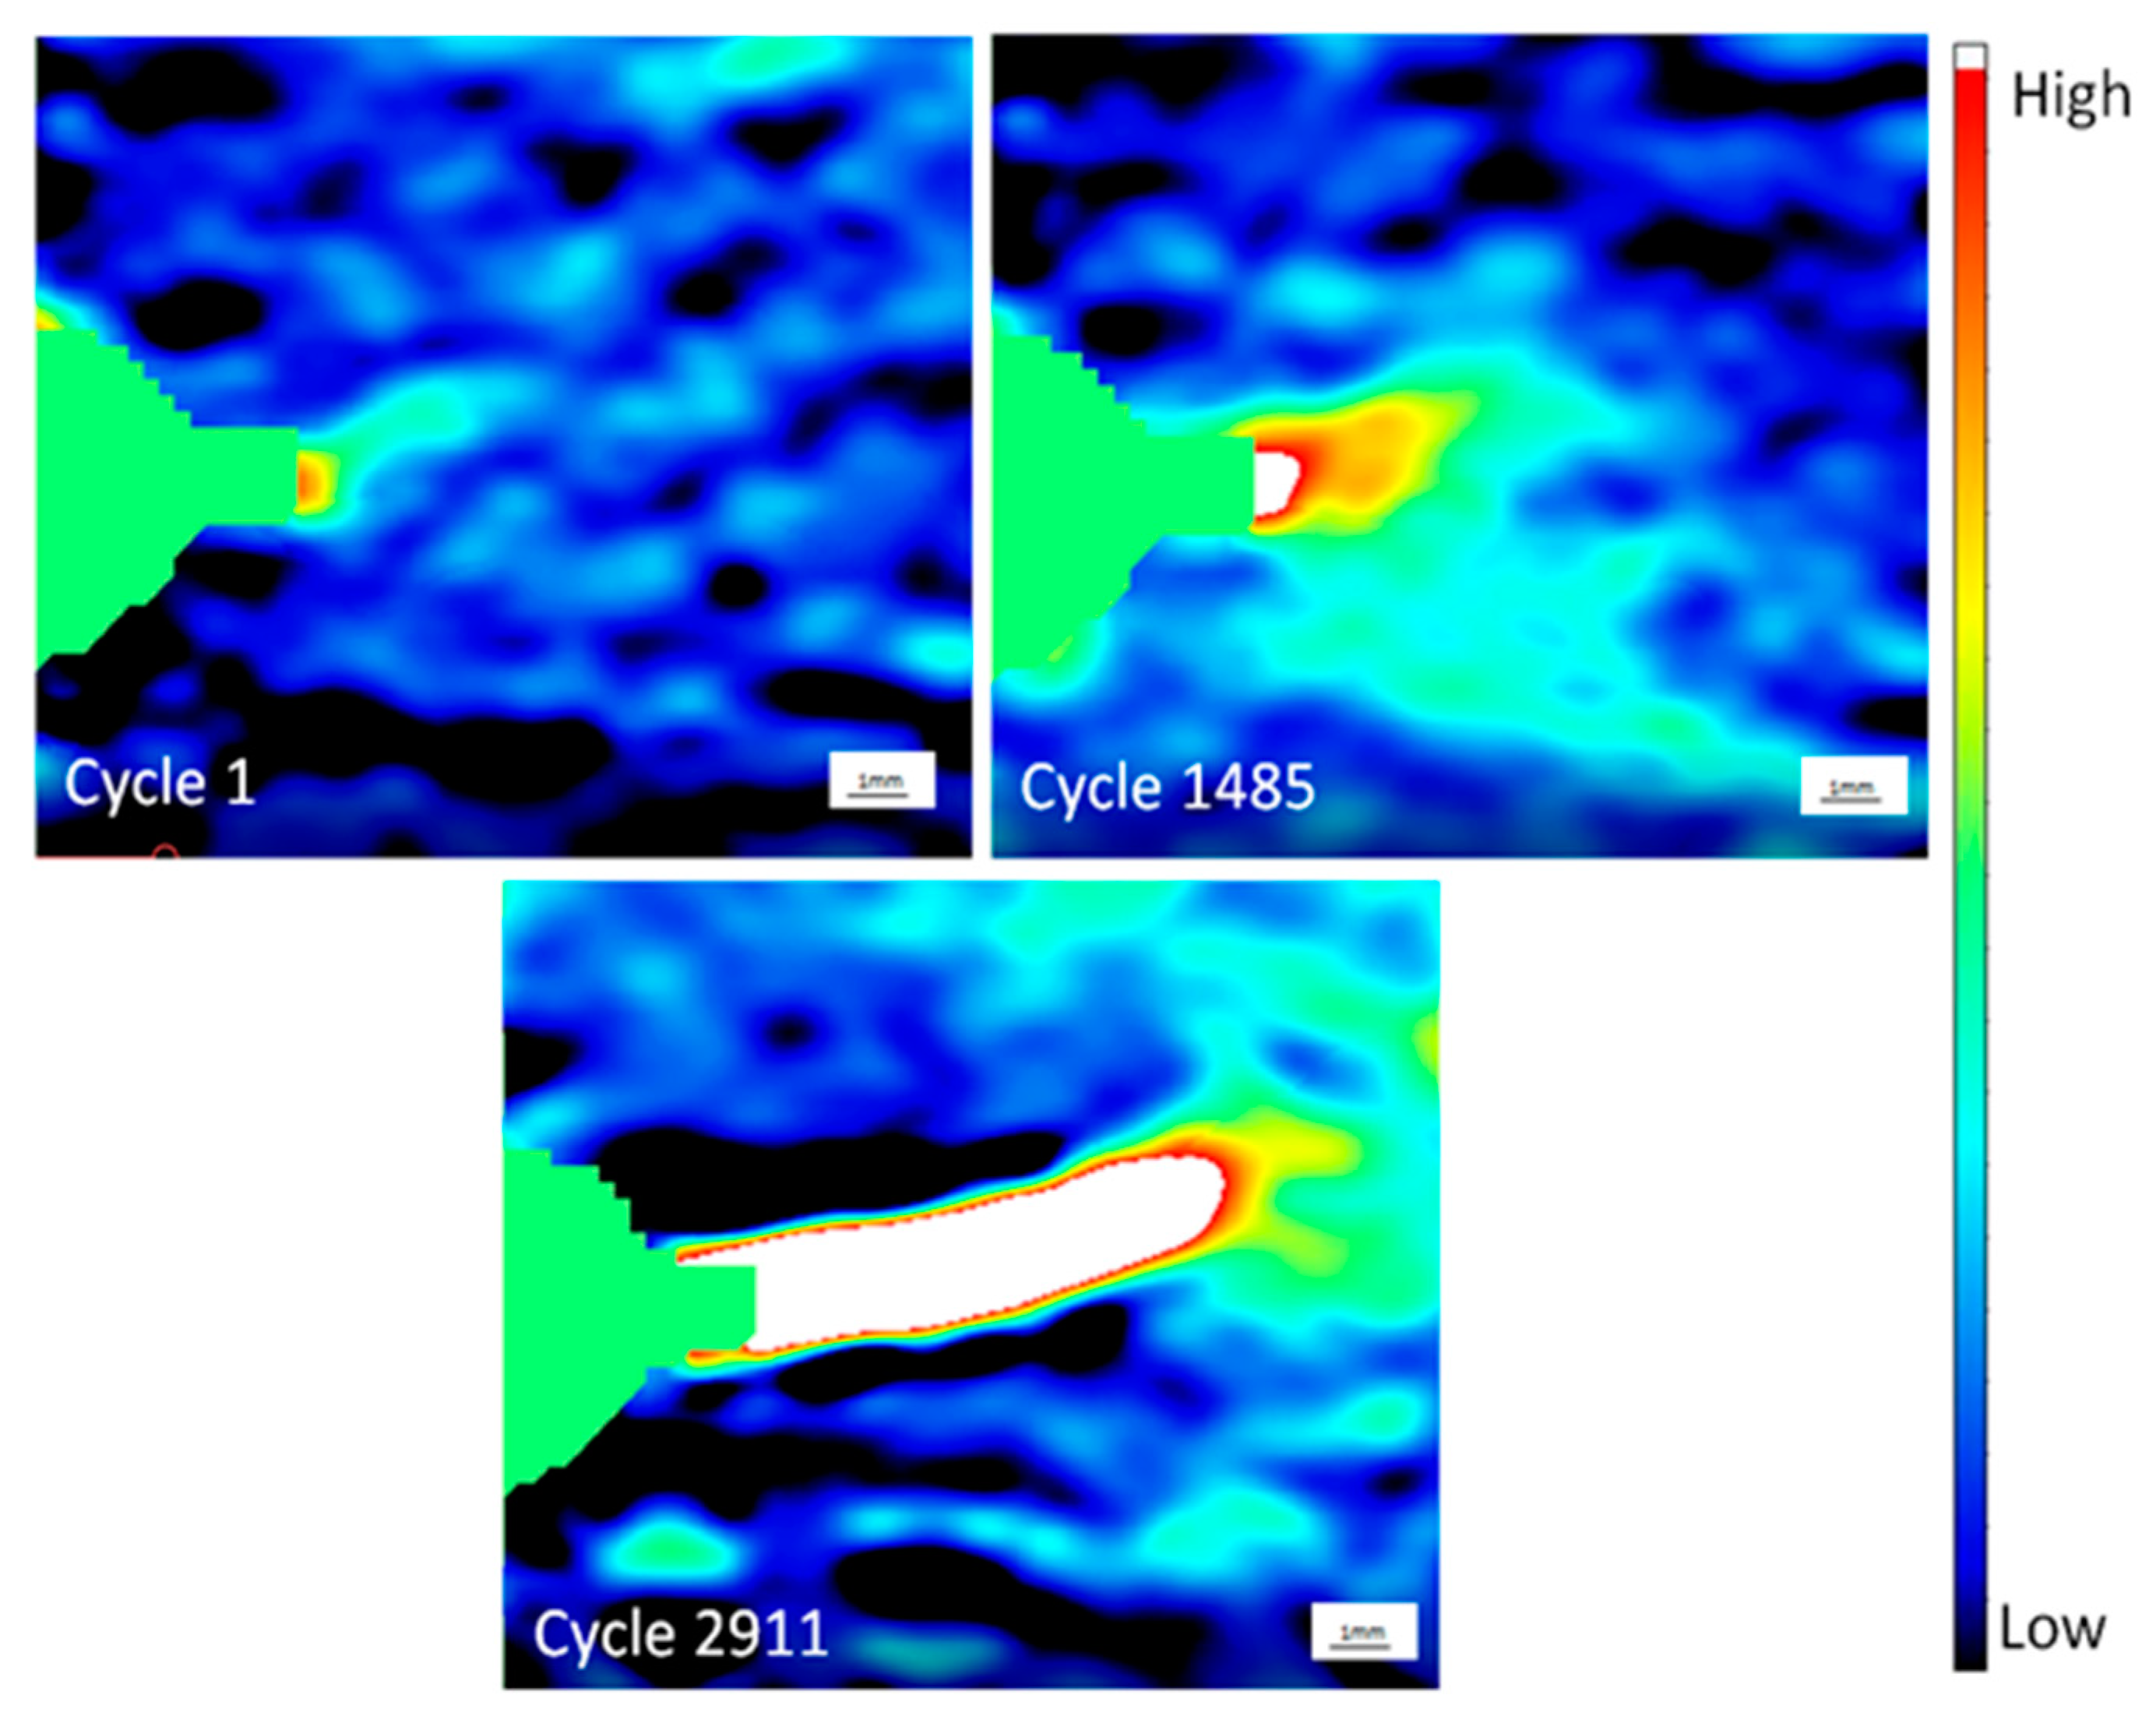
From the DIC strain maps, a small region of high strain was detected immediately ahead of the notch slit tip as early as N=55 into the test period (
Figure 12). This region grew in both lateral and axial size during successive cycles until the damage zone extended beyond the field of view, illustrated by the map taken at 2560 cycles. It should be emphasised that the specimen remained load bearing at this point, although the area coloured white in the associated strain map was actually associated with a visible, well-defined crack at this stage.
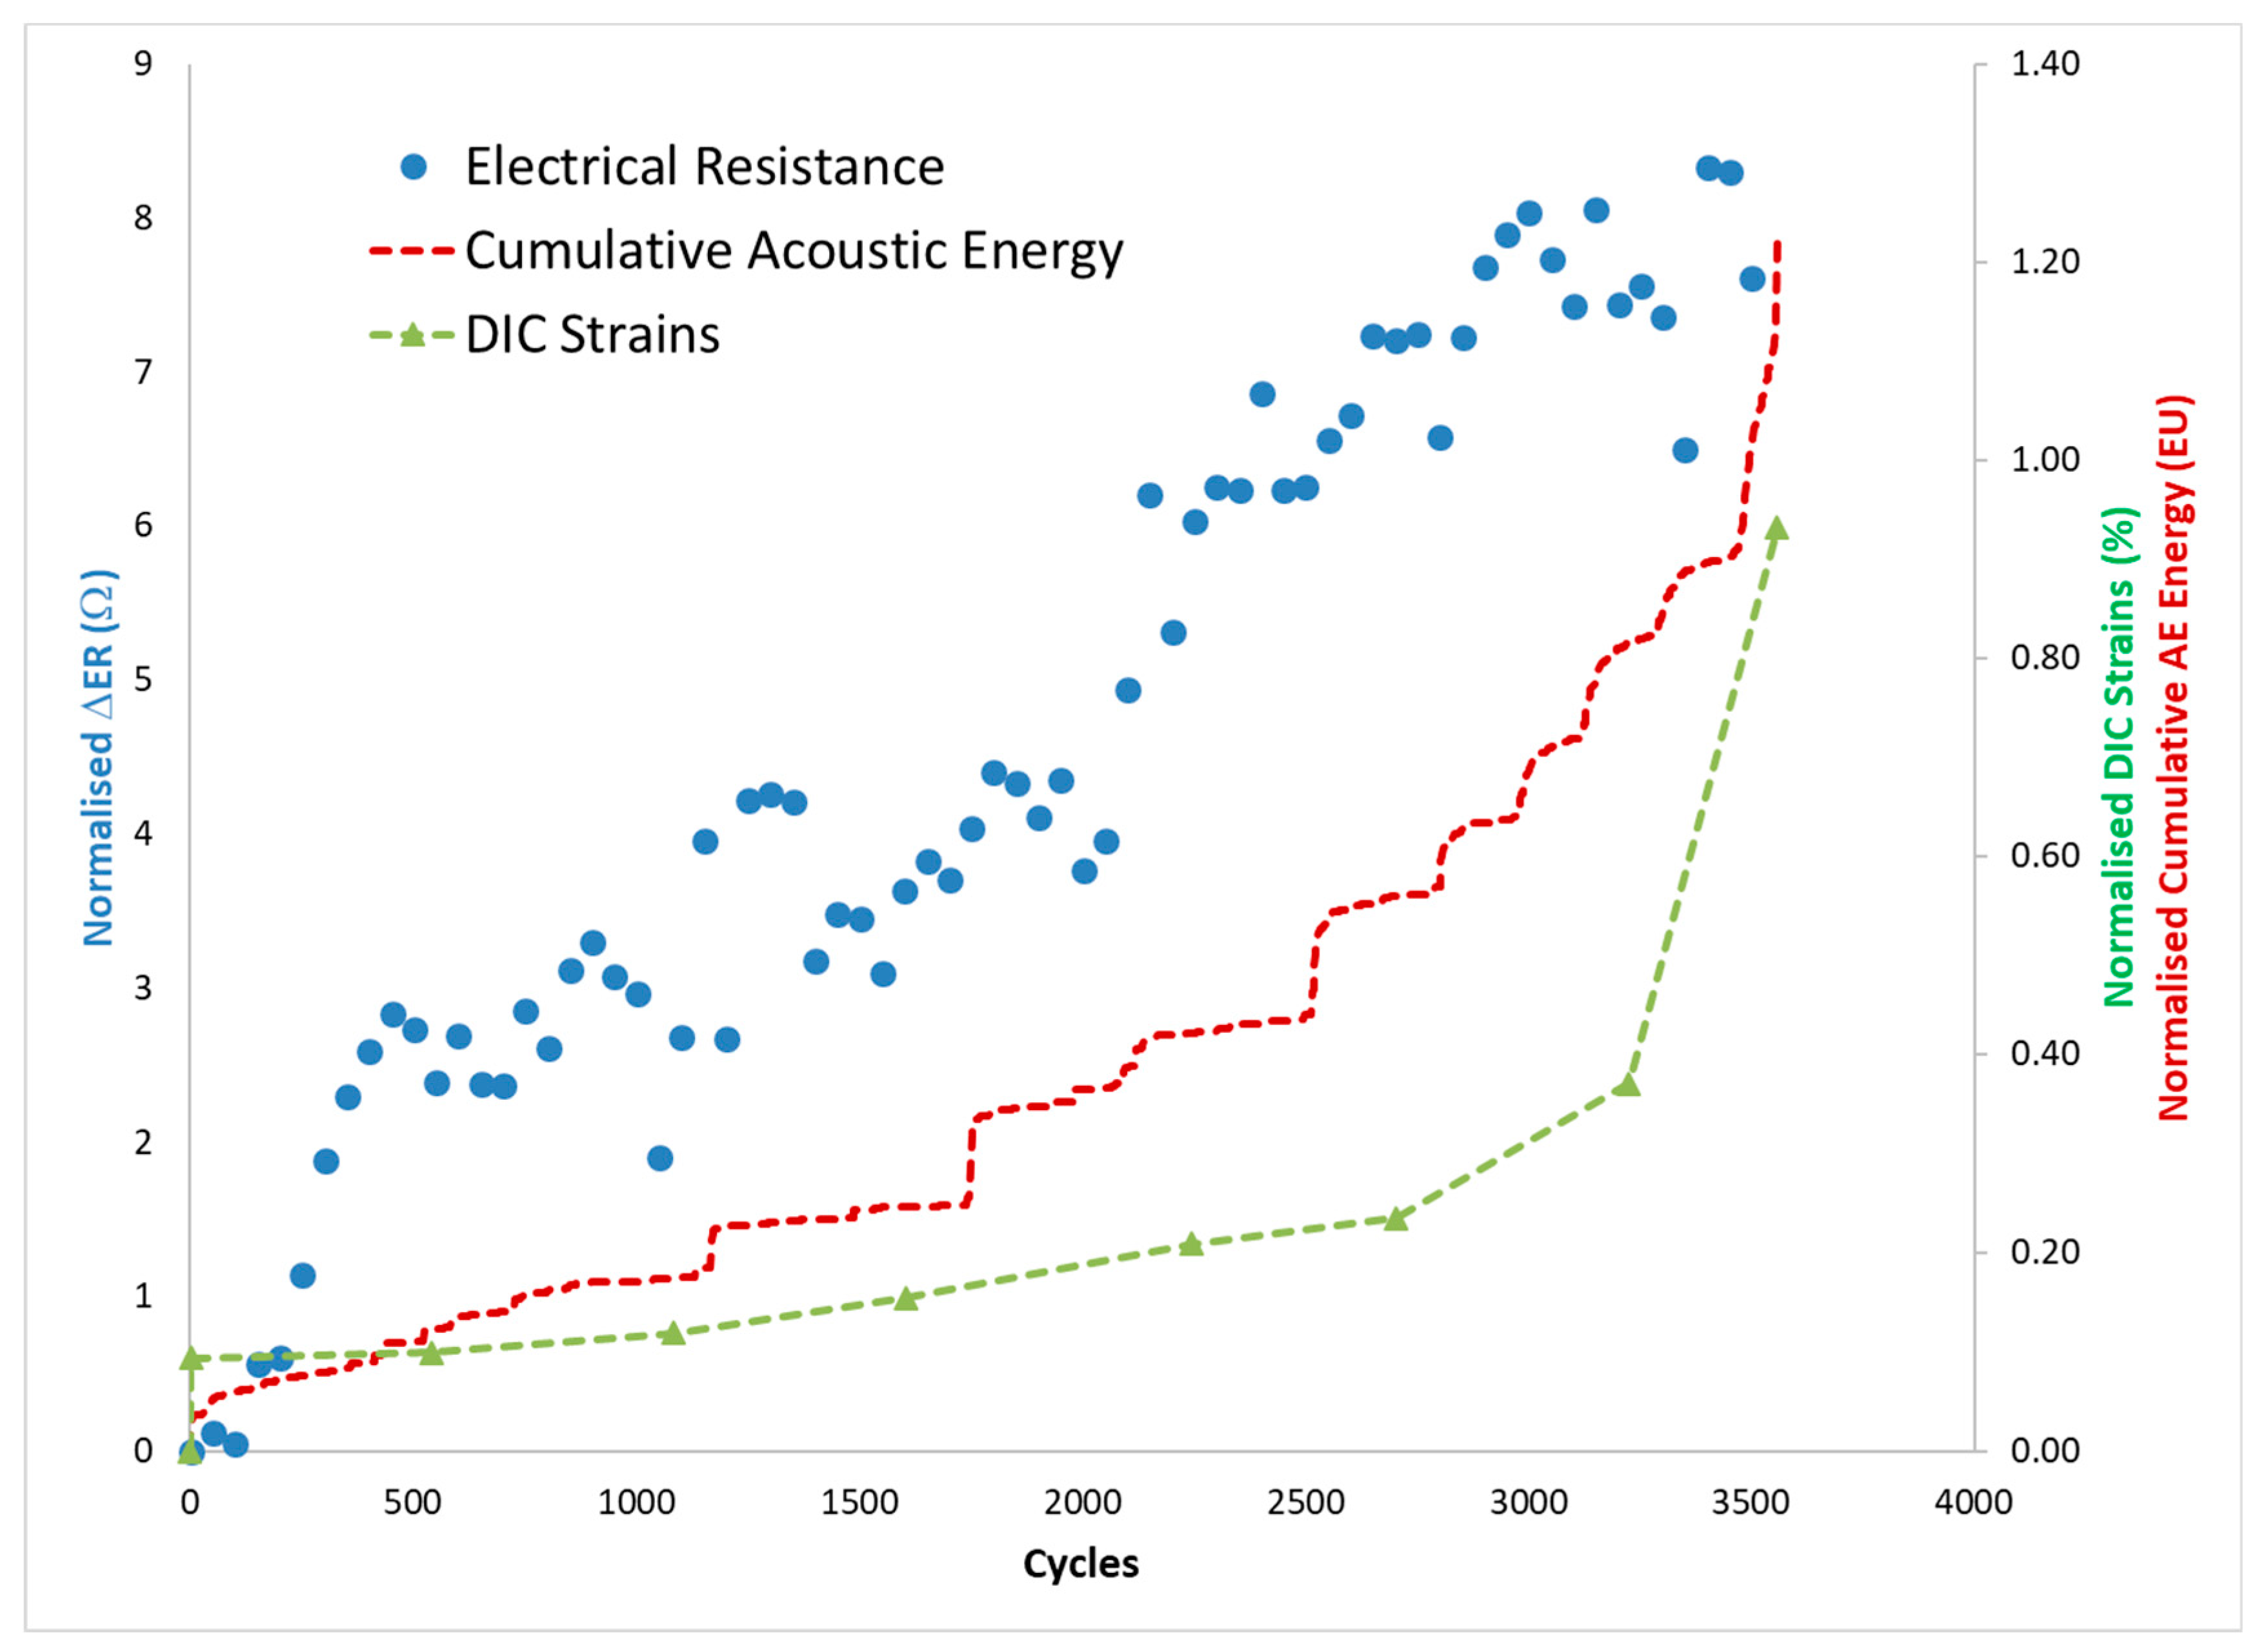
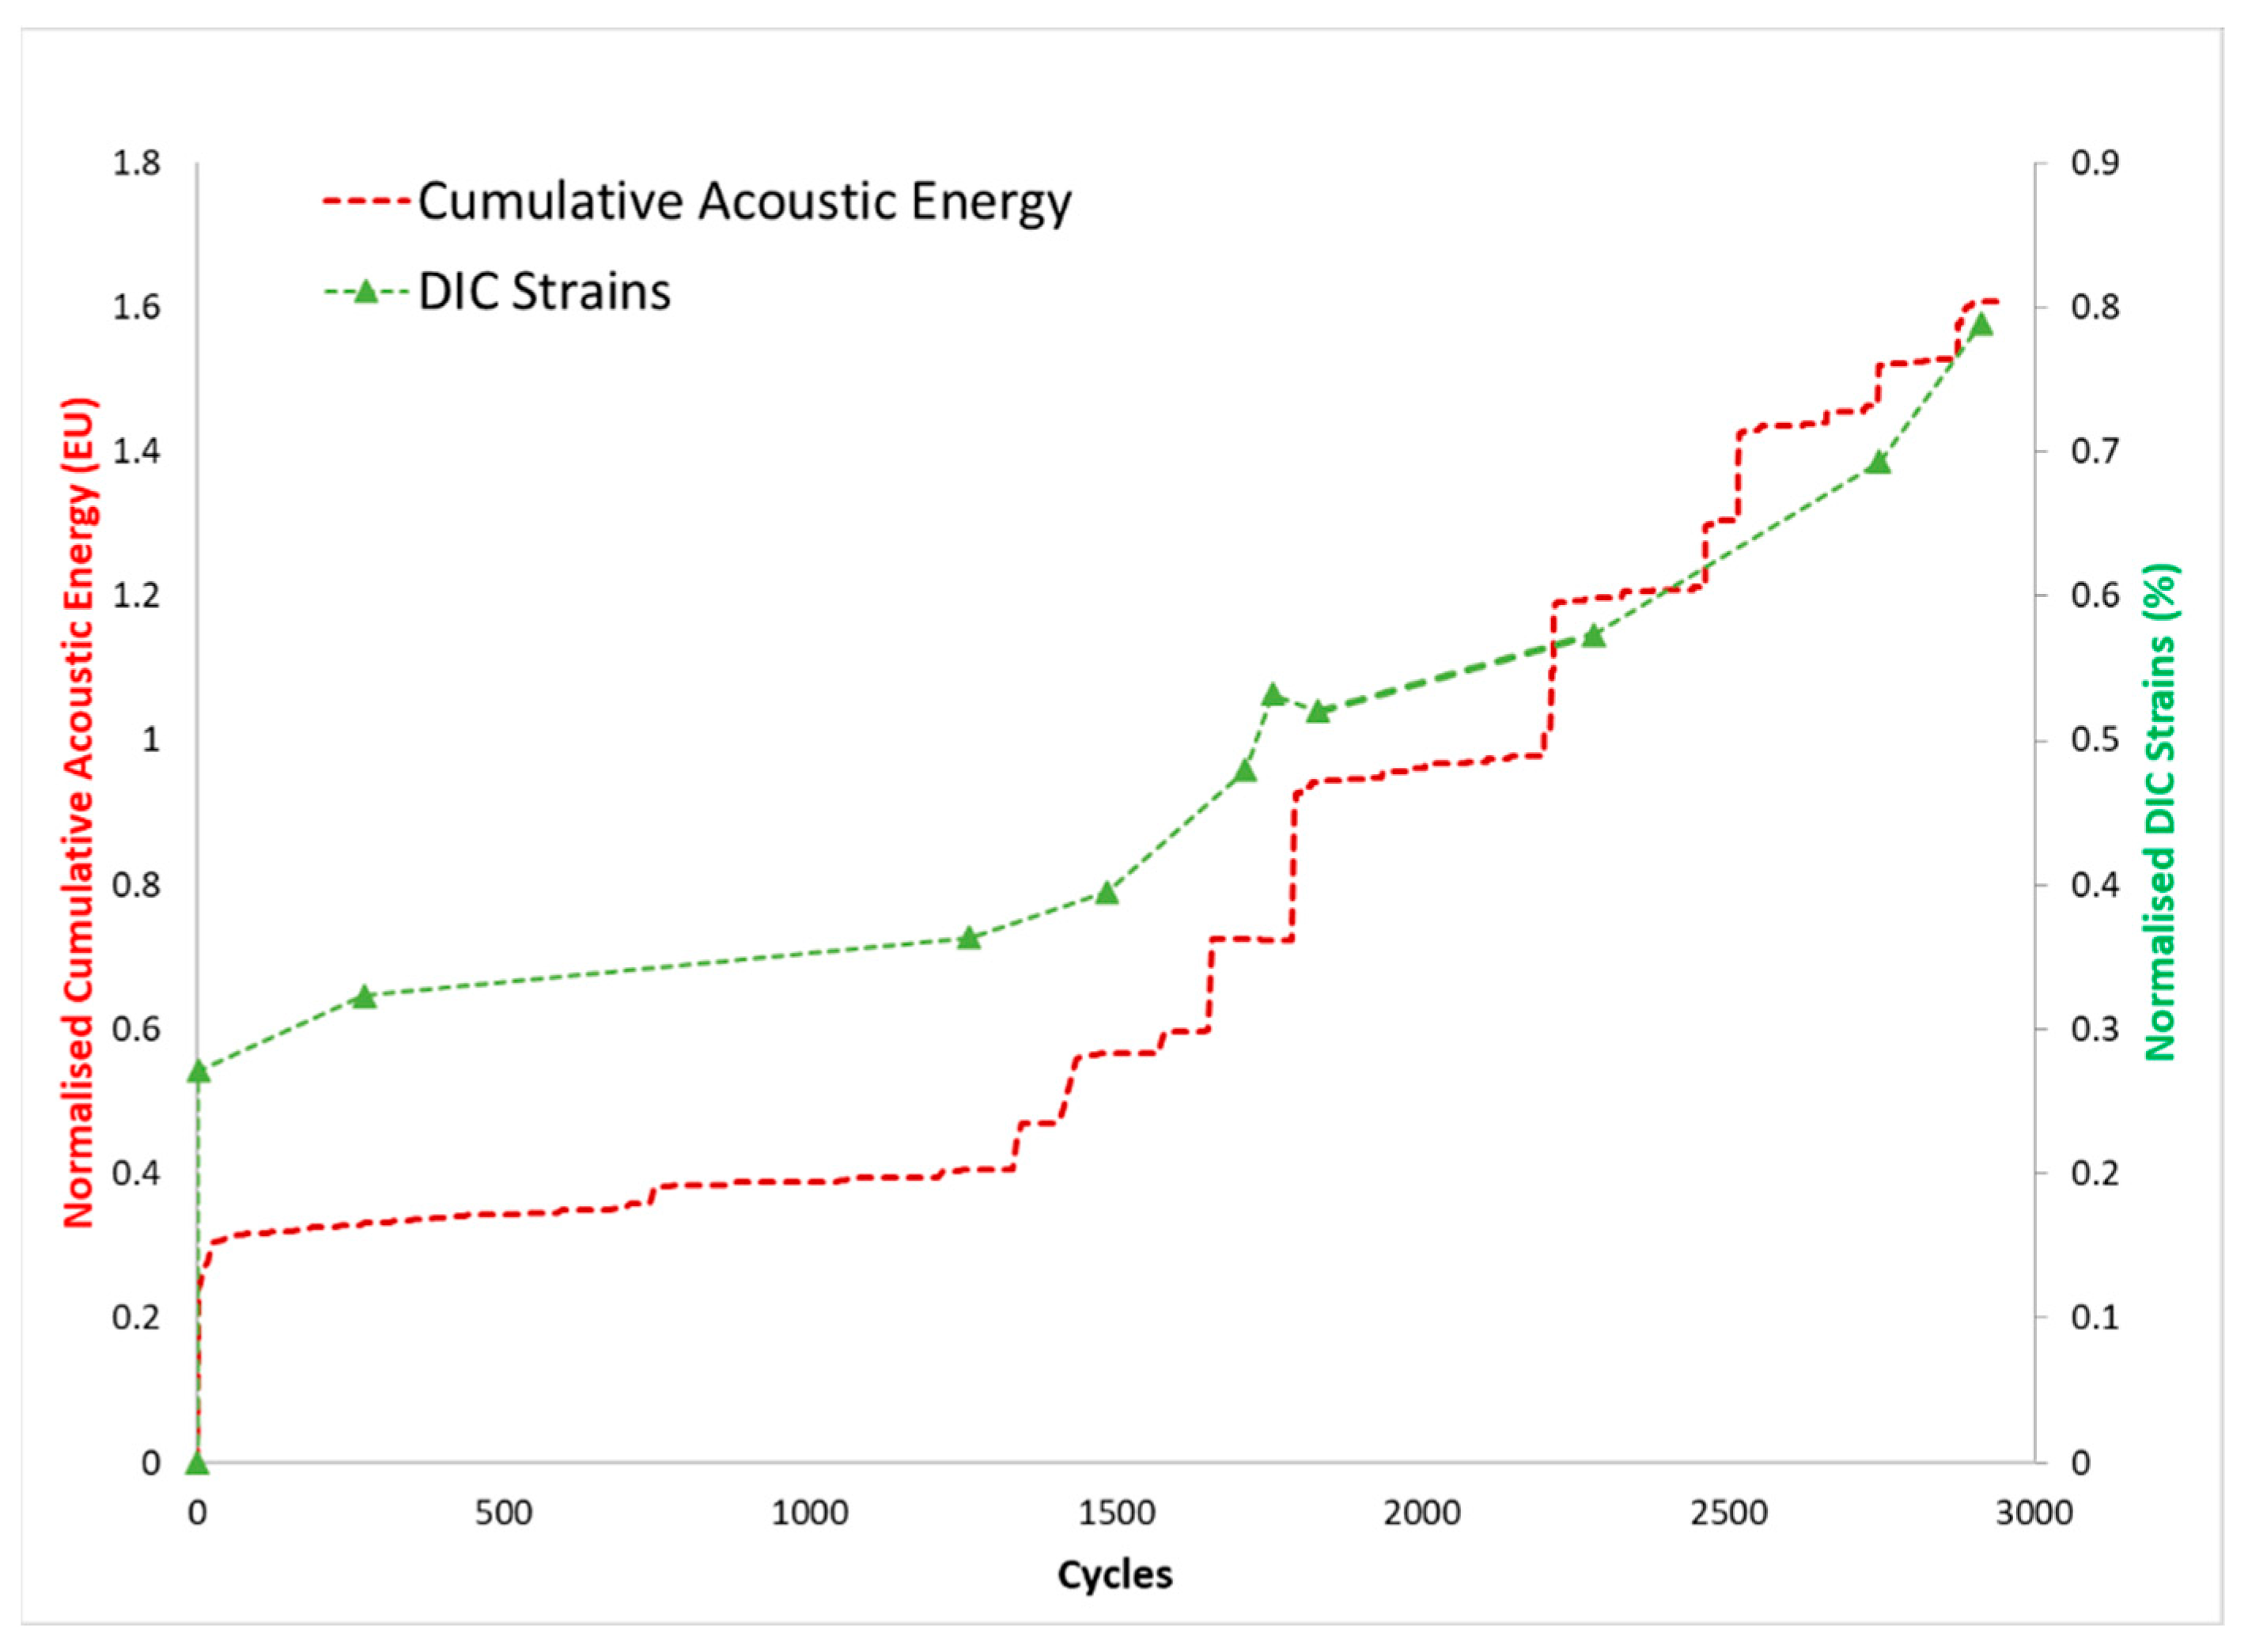
Unfortunately, no reliable ER data were recorded from Sample #4 due to inferior probe contacts. However, both AE and DIC indicated a significant and immediate increase as loading commenced, followed by a period of relative stability to approximately 1300 cycles. Beyond this stage, there was a marked increase in the rate of average AE accumulation which encompassed distinct steps in the signals (
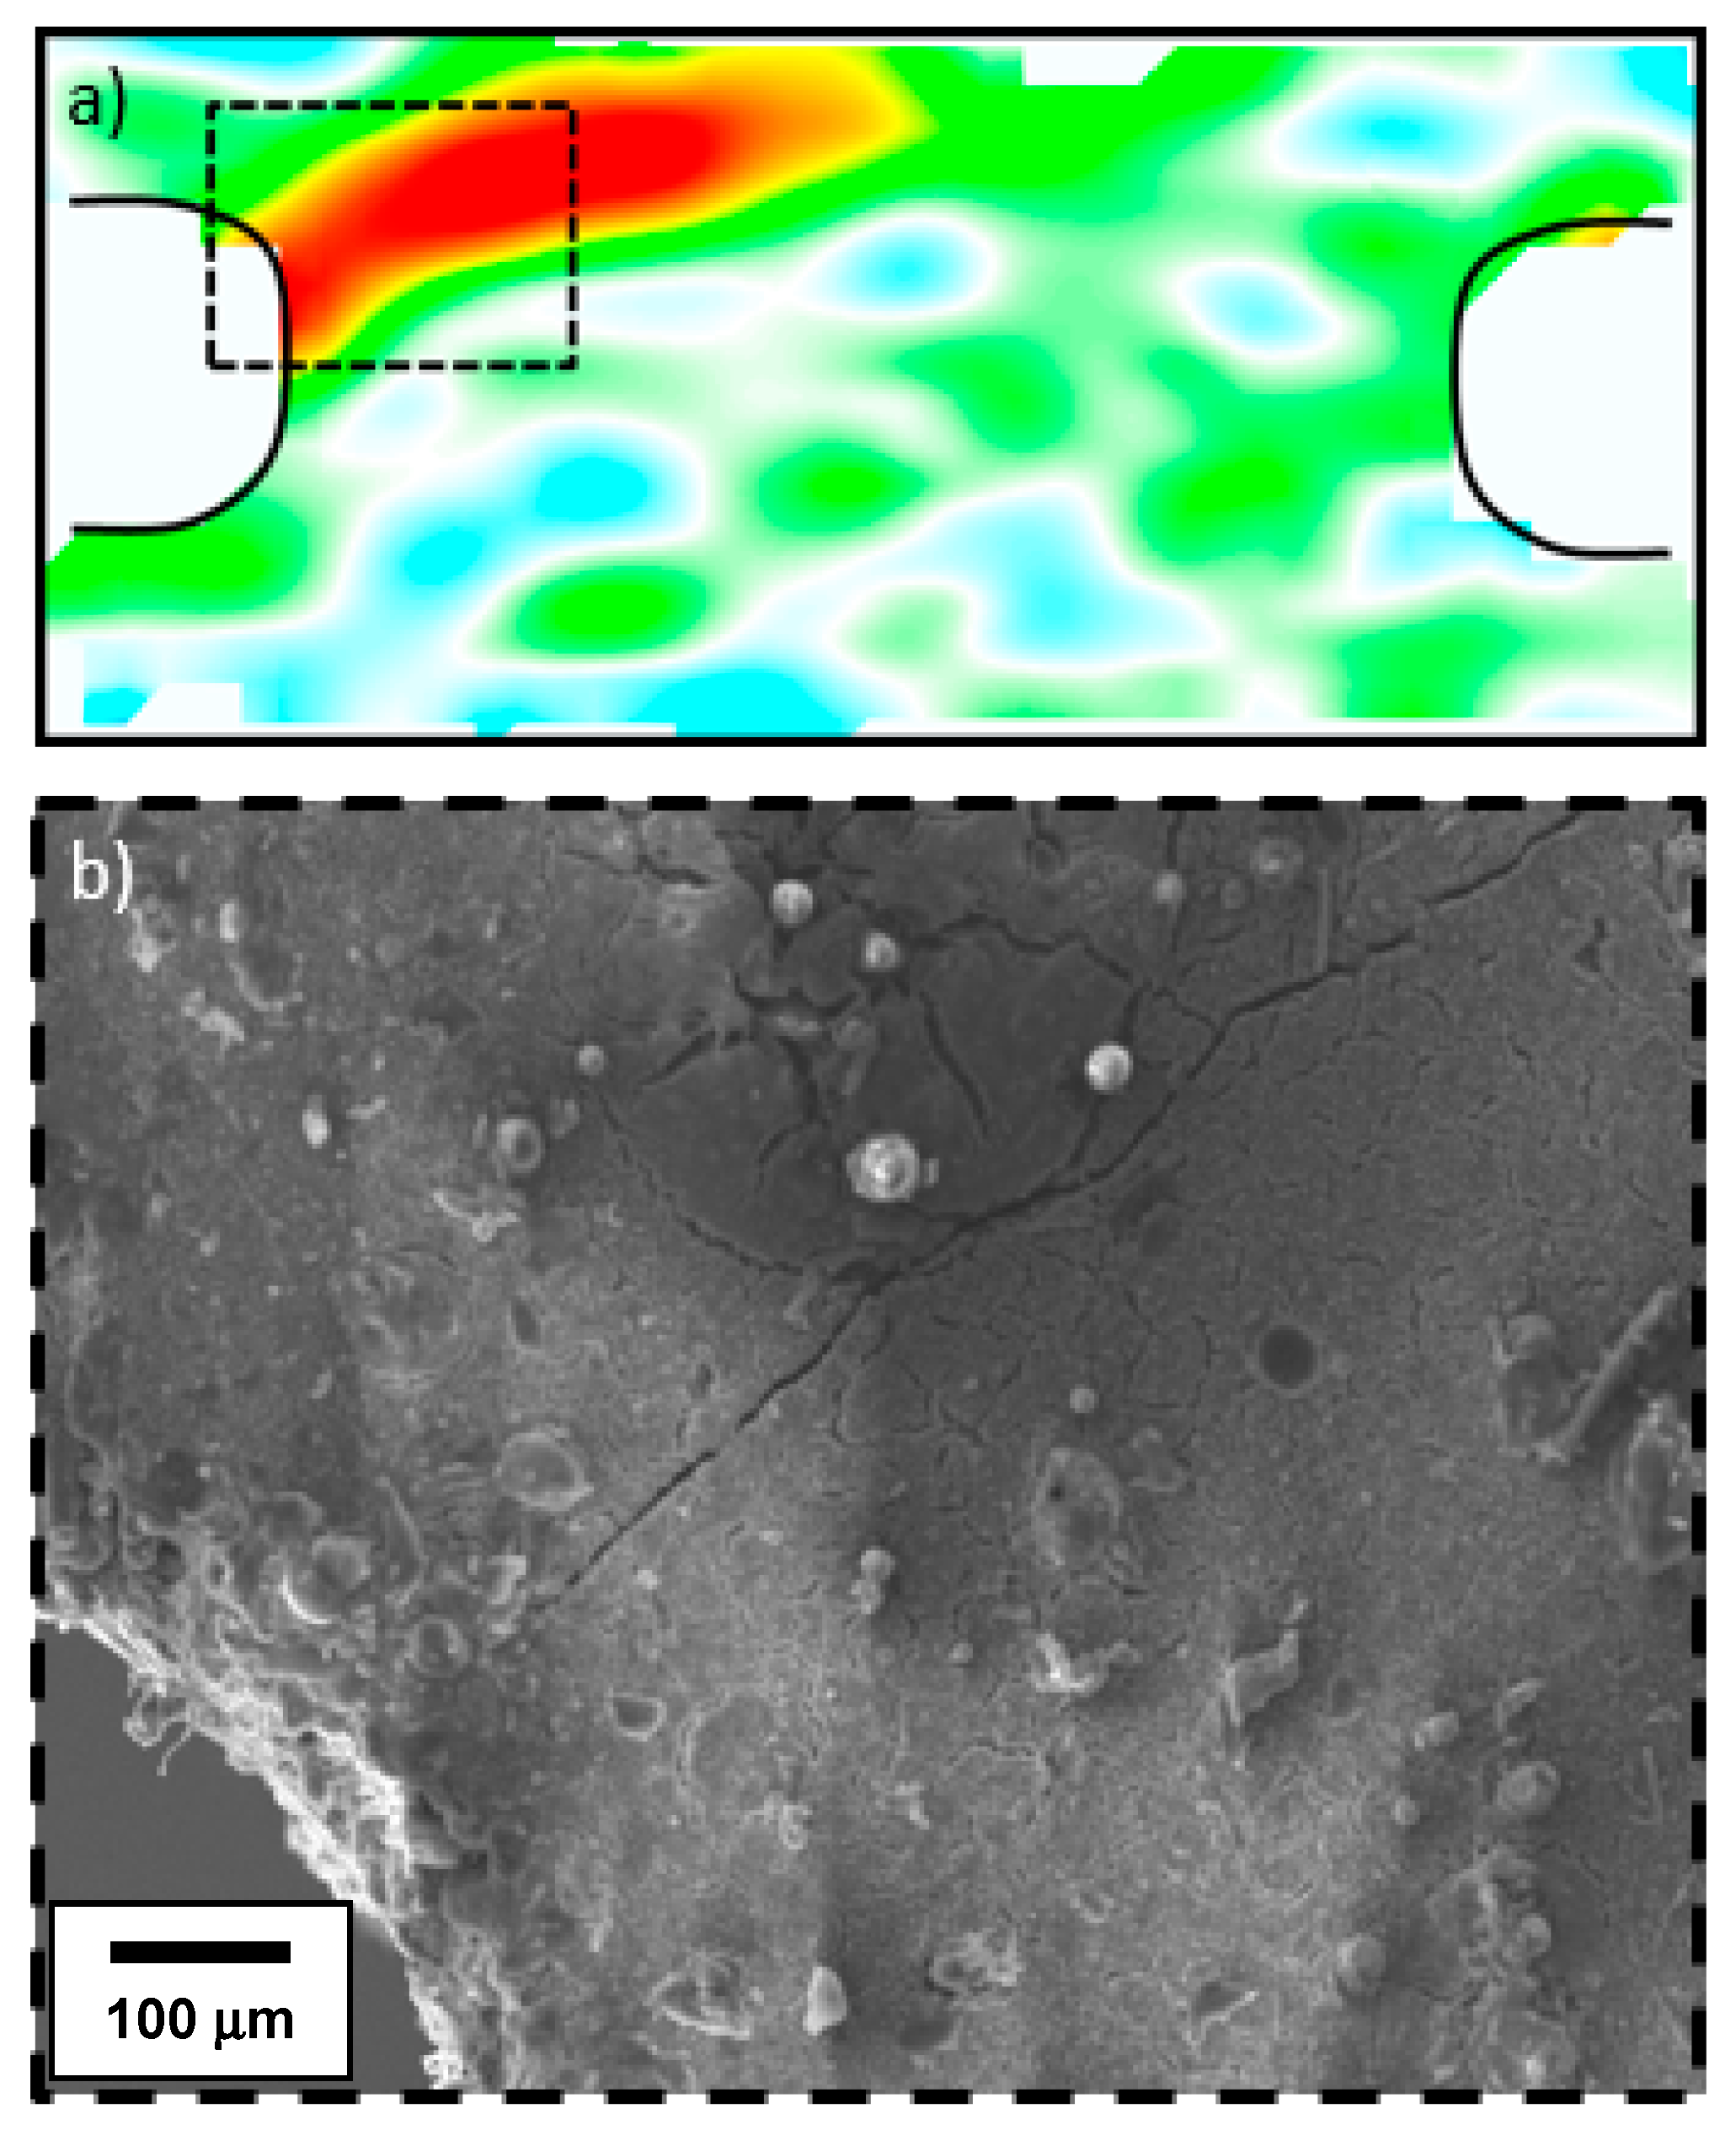
Figure 13). The associated DIC maps detected the development of a region of high strain emanating from the tip of the notch slit (
Figure 14).
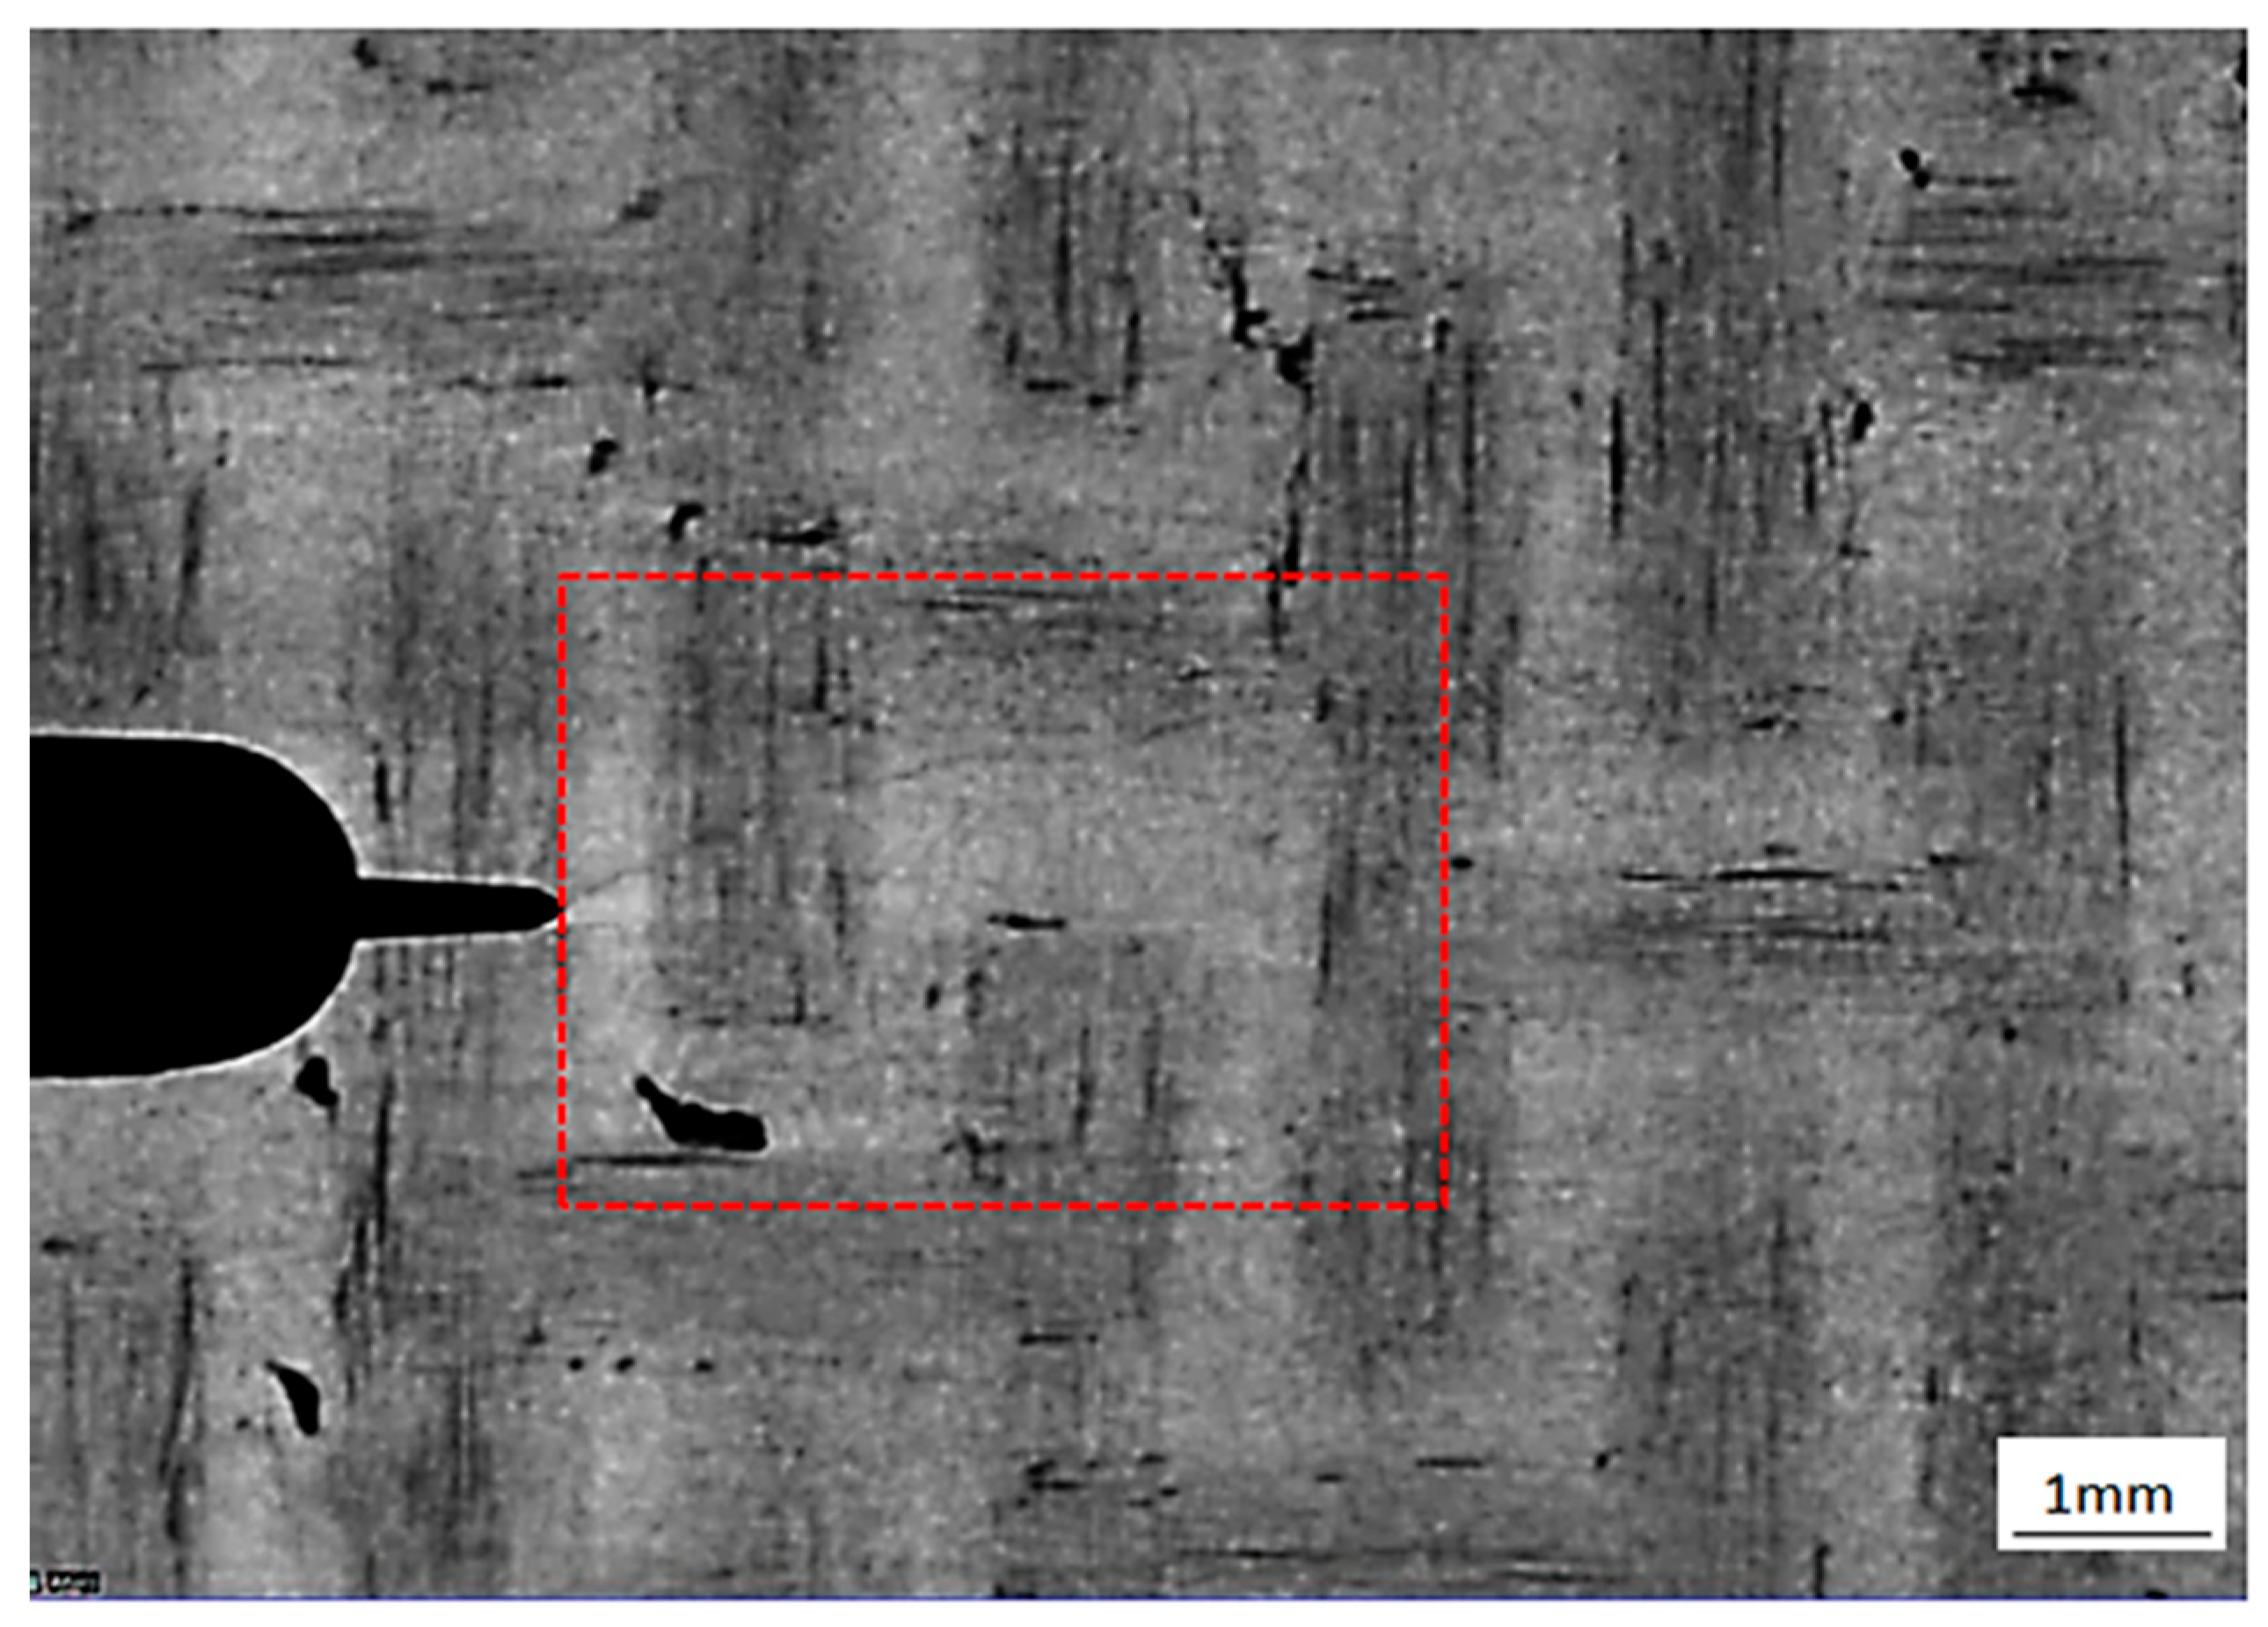
By terminating the fatigue loading, Sample #4 was extracted from the load train and assessed under XCT, where a fine crack was detected traversing across four longitudinal fibre tows (
Figure 15). The plane of fracture was inclined slightly relative to the tensile load axis.
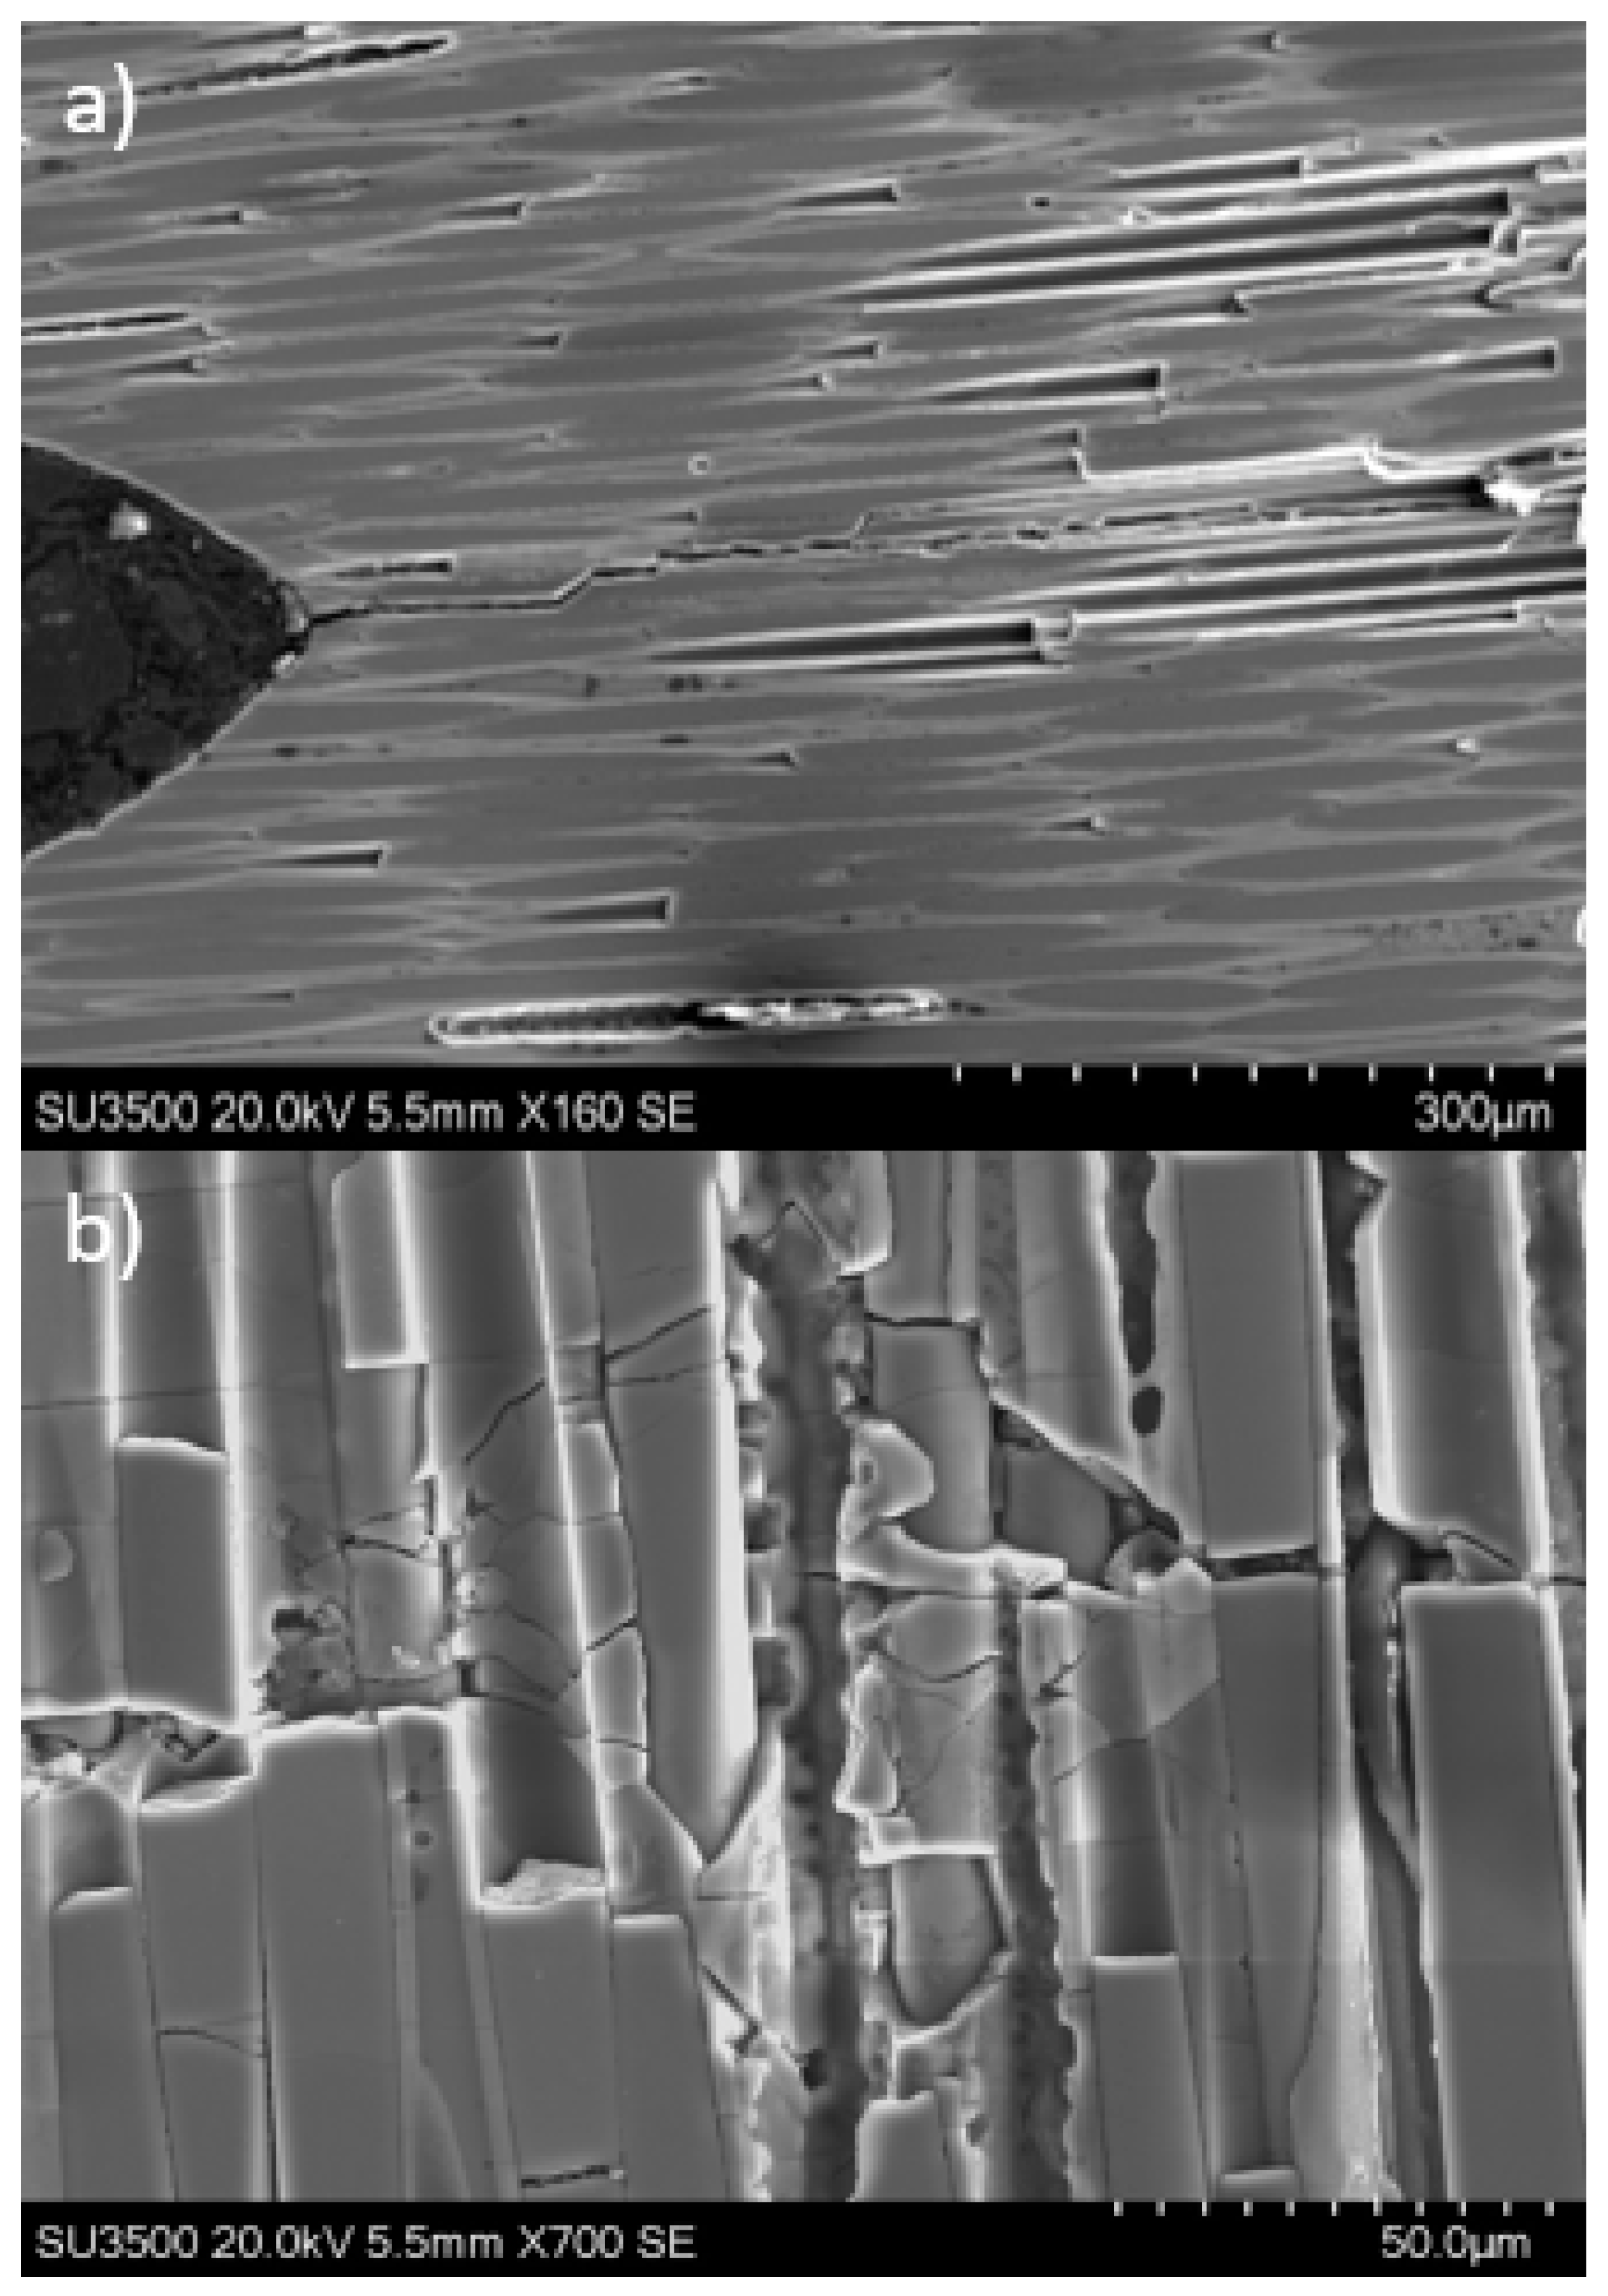
Destructive polishing of the specimen exposed the same crack interacting with transverse fibres on a sub-surface plane, viewed under scanning electron microscopy, as shown in
Figure 16a. As the crack interacted with a bundle of longitudinal fibres, viewed on the same polished plane, evidence of multiple micro-cracks in the matrix phase immediately juxtaposed to individual fibres was noted (
Figure 16b). A combination of bridging and fractured fibres were evident within the complex damage zone; however, the damage was restricted to a relatively small distance away from the plane of the main crack, noting that the vertical field of view in the image was restricted to approximately 100 μm. This correlated well with the region of high strain indicated by the DIC images, as shown in
Figure 14.
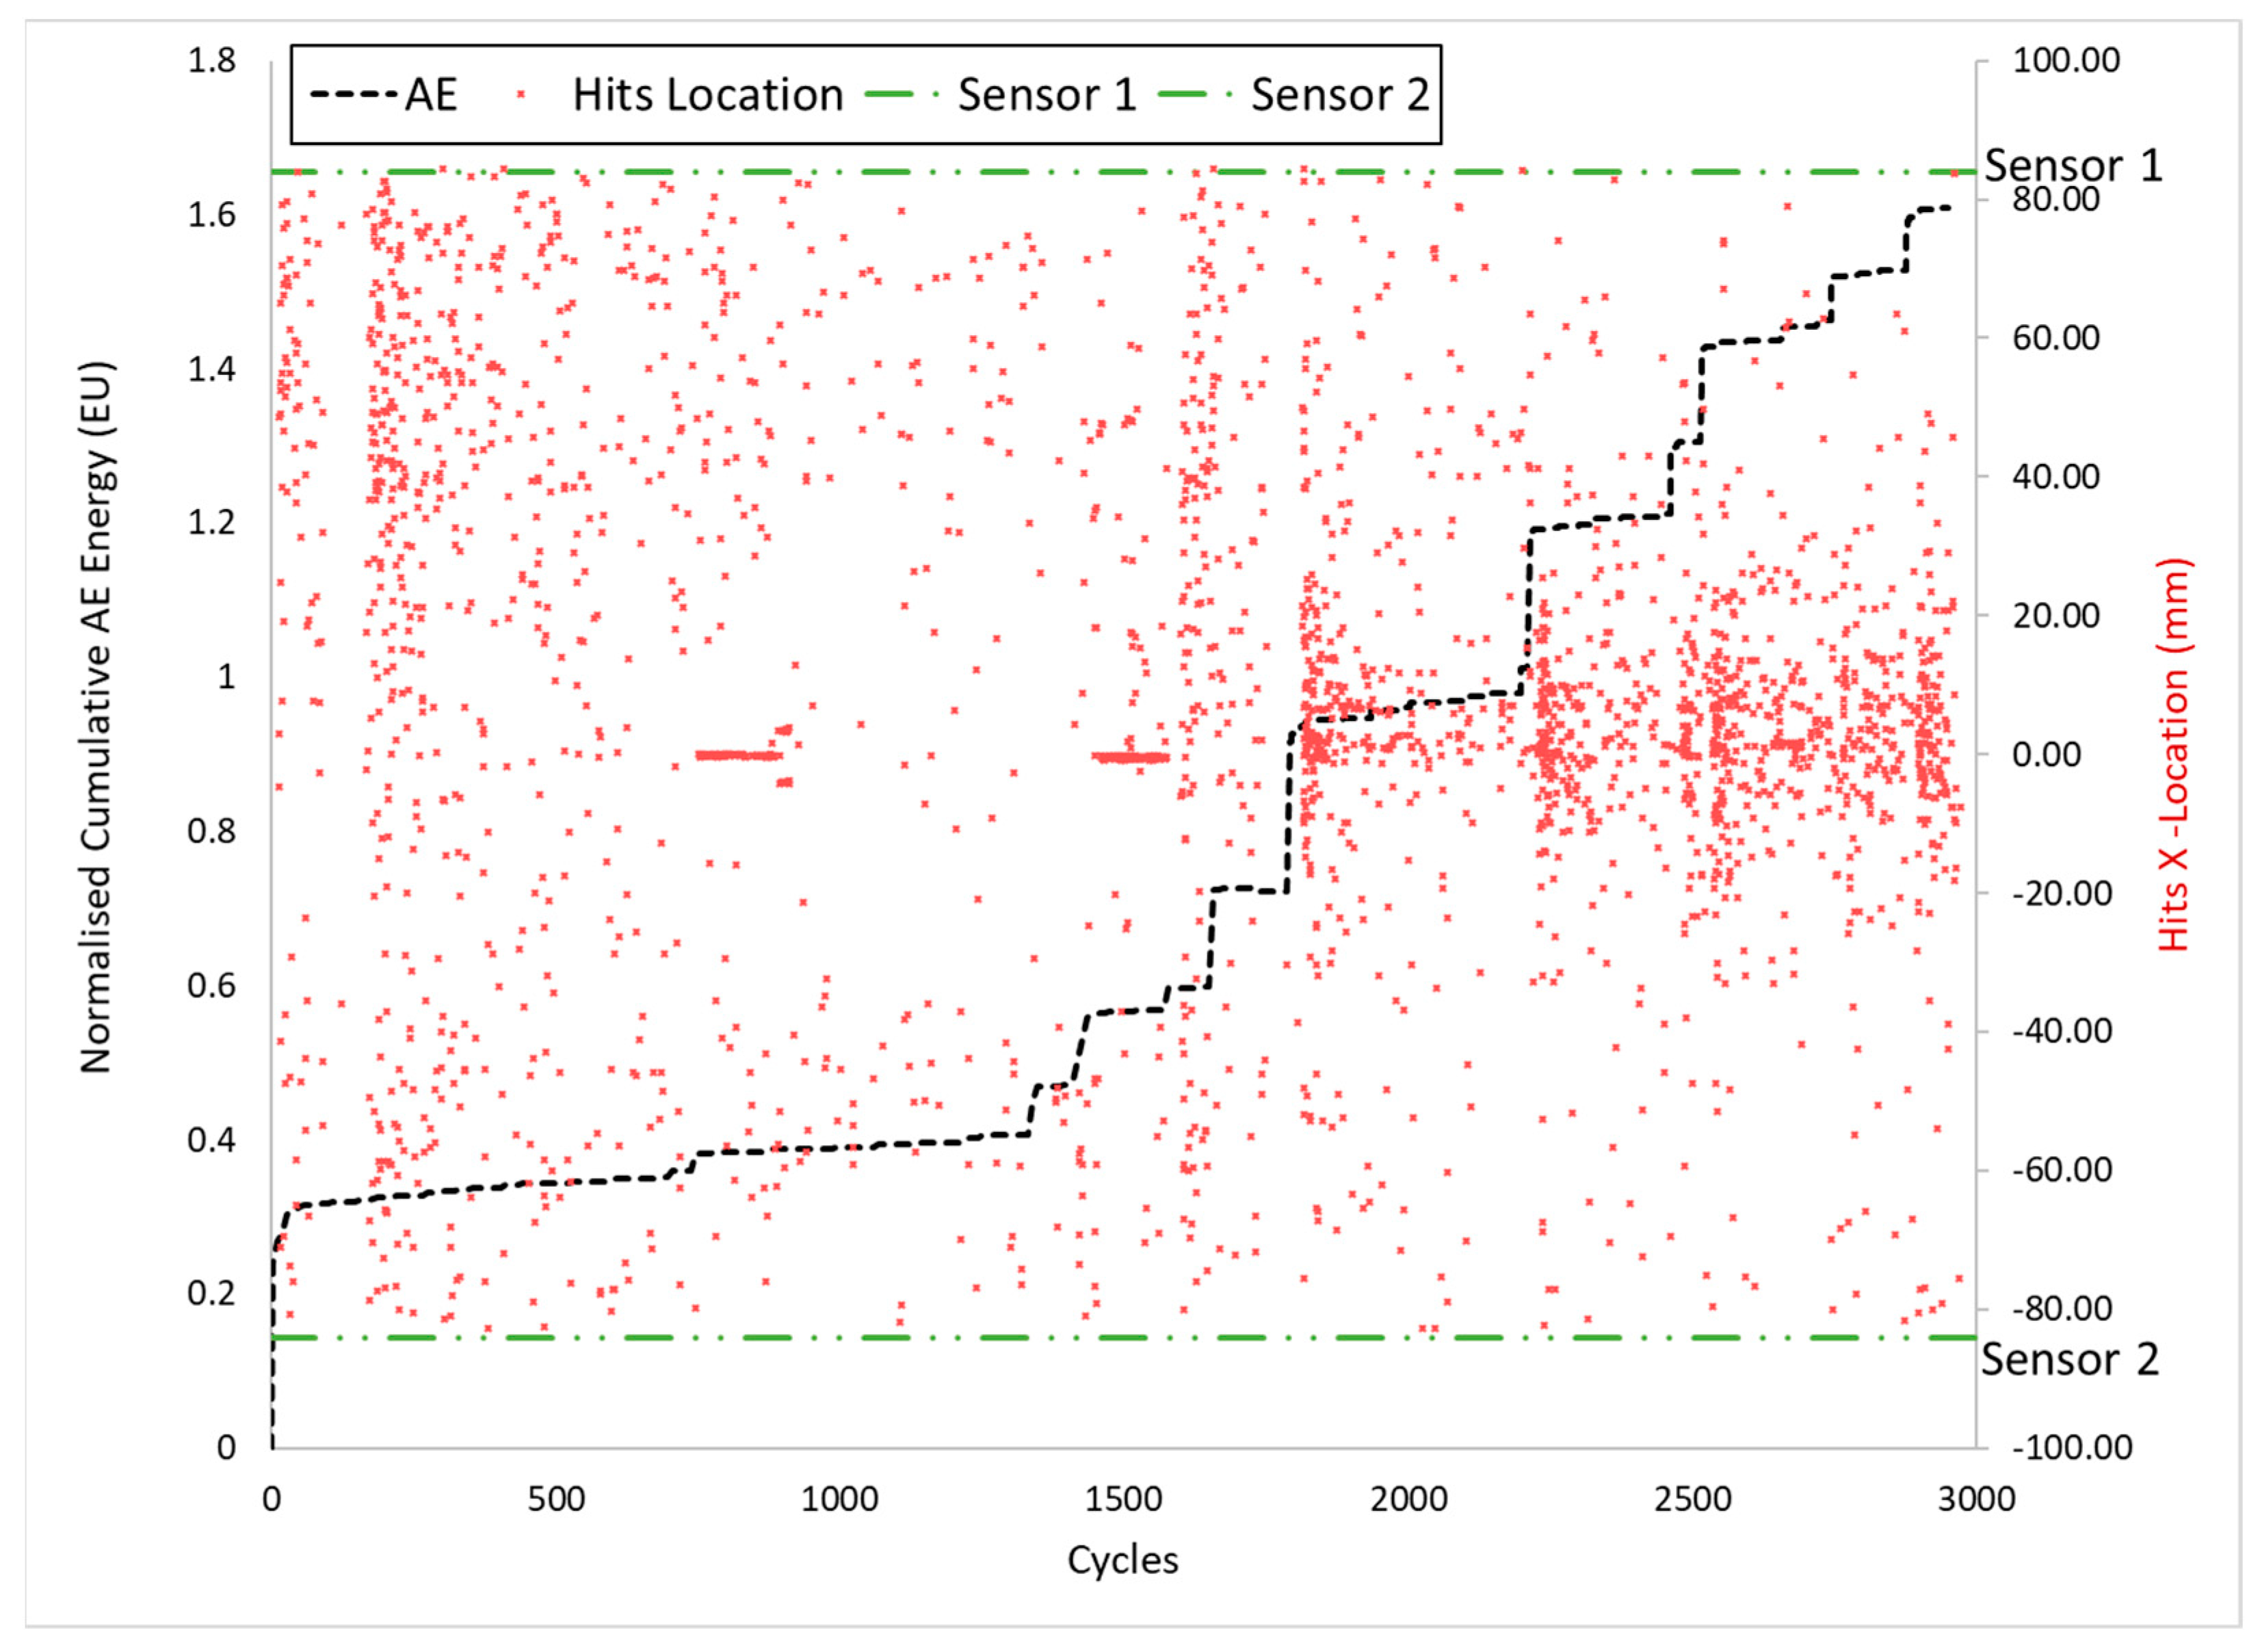
The spatial origins of the individual AE events that combined to constitute the accumulated energy data, plotted in
Figure 13, were determined from the time of flight analysis (
Figure 17). Those events corresponding to the central 80 mm hot zone of the furnace were displayed. During the first 700 cycles, events were distributed randomly along with the sample between the extremes of the hot gauge section. A concentrated band of events was then evident over a period of approximately 300 cycles, focused on the horizontal plane through the centre of the notch. A period of relatively low activity then followed until another group of events on the same central plane was detected shortly after 1500 cycles. The DIC images in
Figure 14, taken at these instances, indicated a corresponding broadening of the damage zone in the axial direction. The distinct steps in cumulative acoustic energy were mirrored by an increased density in individual events focused within the central gauge section, approximately ±20 mm above and below the notch.
4. Discussion
Various experimental techniques have been applied to monitor the initiation and development of damage in ceramic matrix composite test specimens at high-temperature, utilising a combination of electrical resistance measurements, digital image correlation and acoustic emission.
By correlating ER signals to AE records, optical inspection of surface cracks and interrupted computed tomography inspections from the same test, ER monitoring appears to detect the initiation of early stage cracking with some confidence and then provide a direct and progressive indication of sub-critical damage. However, the degree of scatter in ER measurements and the occasional loss in signal all together in certain experiments continues to prove problematic, in our experience, for the detection of ensuing failure. This is thought to reflect the relative immaturity of the experimental technique at our laboratory rather than a feature related to this specific CMC system. Other laboratories have reported better repeatability using ER [
9,
10]. However, distinct differences are noted between those previous and our current experiments. In the first case, ER was employed to monitor examples of a single, macroscopic interlaminar crack growing from the tip of a macroscale machined notch [
9]. In the second reference [
10], the experiments were designed to detect damage within a relatively large critically stressed volume, where during the earliest stages of the experiment, cracking would be on a micro-scale and randomly dispersed, similar to our current tests. However, Smith et al. applied a relatively severe loading sequence, with peak cyclic loads increased appreciably in a “ratchet” style to induce specimen rupture in fewer than five cycles. Notably, the current tests involved prolonged exposure to a high-temperature environment, and it has been demonstrated that oxidation to the fibres and interface could progressively degrade electrical properties over time [
11]. However, there were no consistent trends amongst the present ER data, and distinct differences in the magnitude of ER change measured for individual specimens (e.g., compare tests #2 and #3) were evident.
Therefore, the inconsistent ER responses we detected might result from the longer term nature of our fatigue tests, the associated progressive extrinsic damage mechanisms (matrix crack opening/closing, interfacial debonding and eventual fibre fractures) or simply the degradation of the localised bond between probe wires and the CMC specimen surface over time. This warrants further detailed investigation.
In contrast, it is encouraging to note that some limited success has since been achieved within our laboratory in calibrating ER to the growth of a single, dominant, translaminar fatigue crack in different specimen geometry (compact tension) tested at elevated temperature. However, the deviation of the macro-scale crack path away from the mode one plane adds complication to the ER calibration, together with crack tip bifurcation and the presence of cracking on multiple planes. Measurement of a final crack length is also a pre-requisite for crack growth calibration, and the failure in various CMC specimens is invariably catastrophic. Again, further investigation around our experimental ER practice is required before such crack growth data can be reported with confidence.
The most repeatable method of detecting the onset of failure was the use of AE. This has proven invaluable during previous studies on oxide-oxide CMCs [
12] together with the current campaign involving SiCf/SiC for the purposes of interrupting tests to allow XCT inspection of progressive damage mechanisms. Invariably, AE detected damage initiation during the earliest stages of loading and occasionally below the proportional load/stress limit defined from the macroscopic constitutive behaviour. Even for coupons containing relatively high geometric stress concentration features, AE signals were emitted from highly distributed locations.
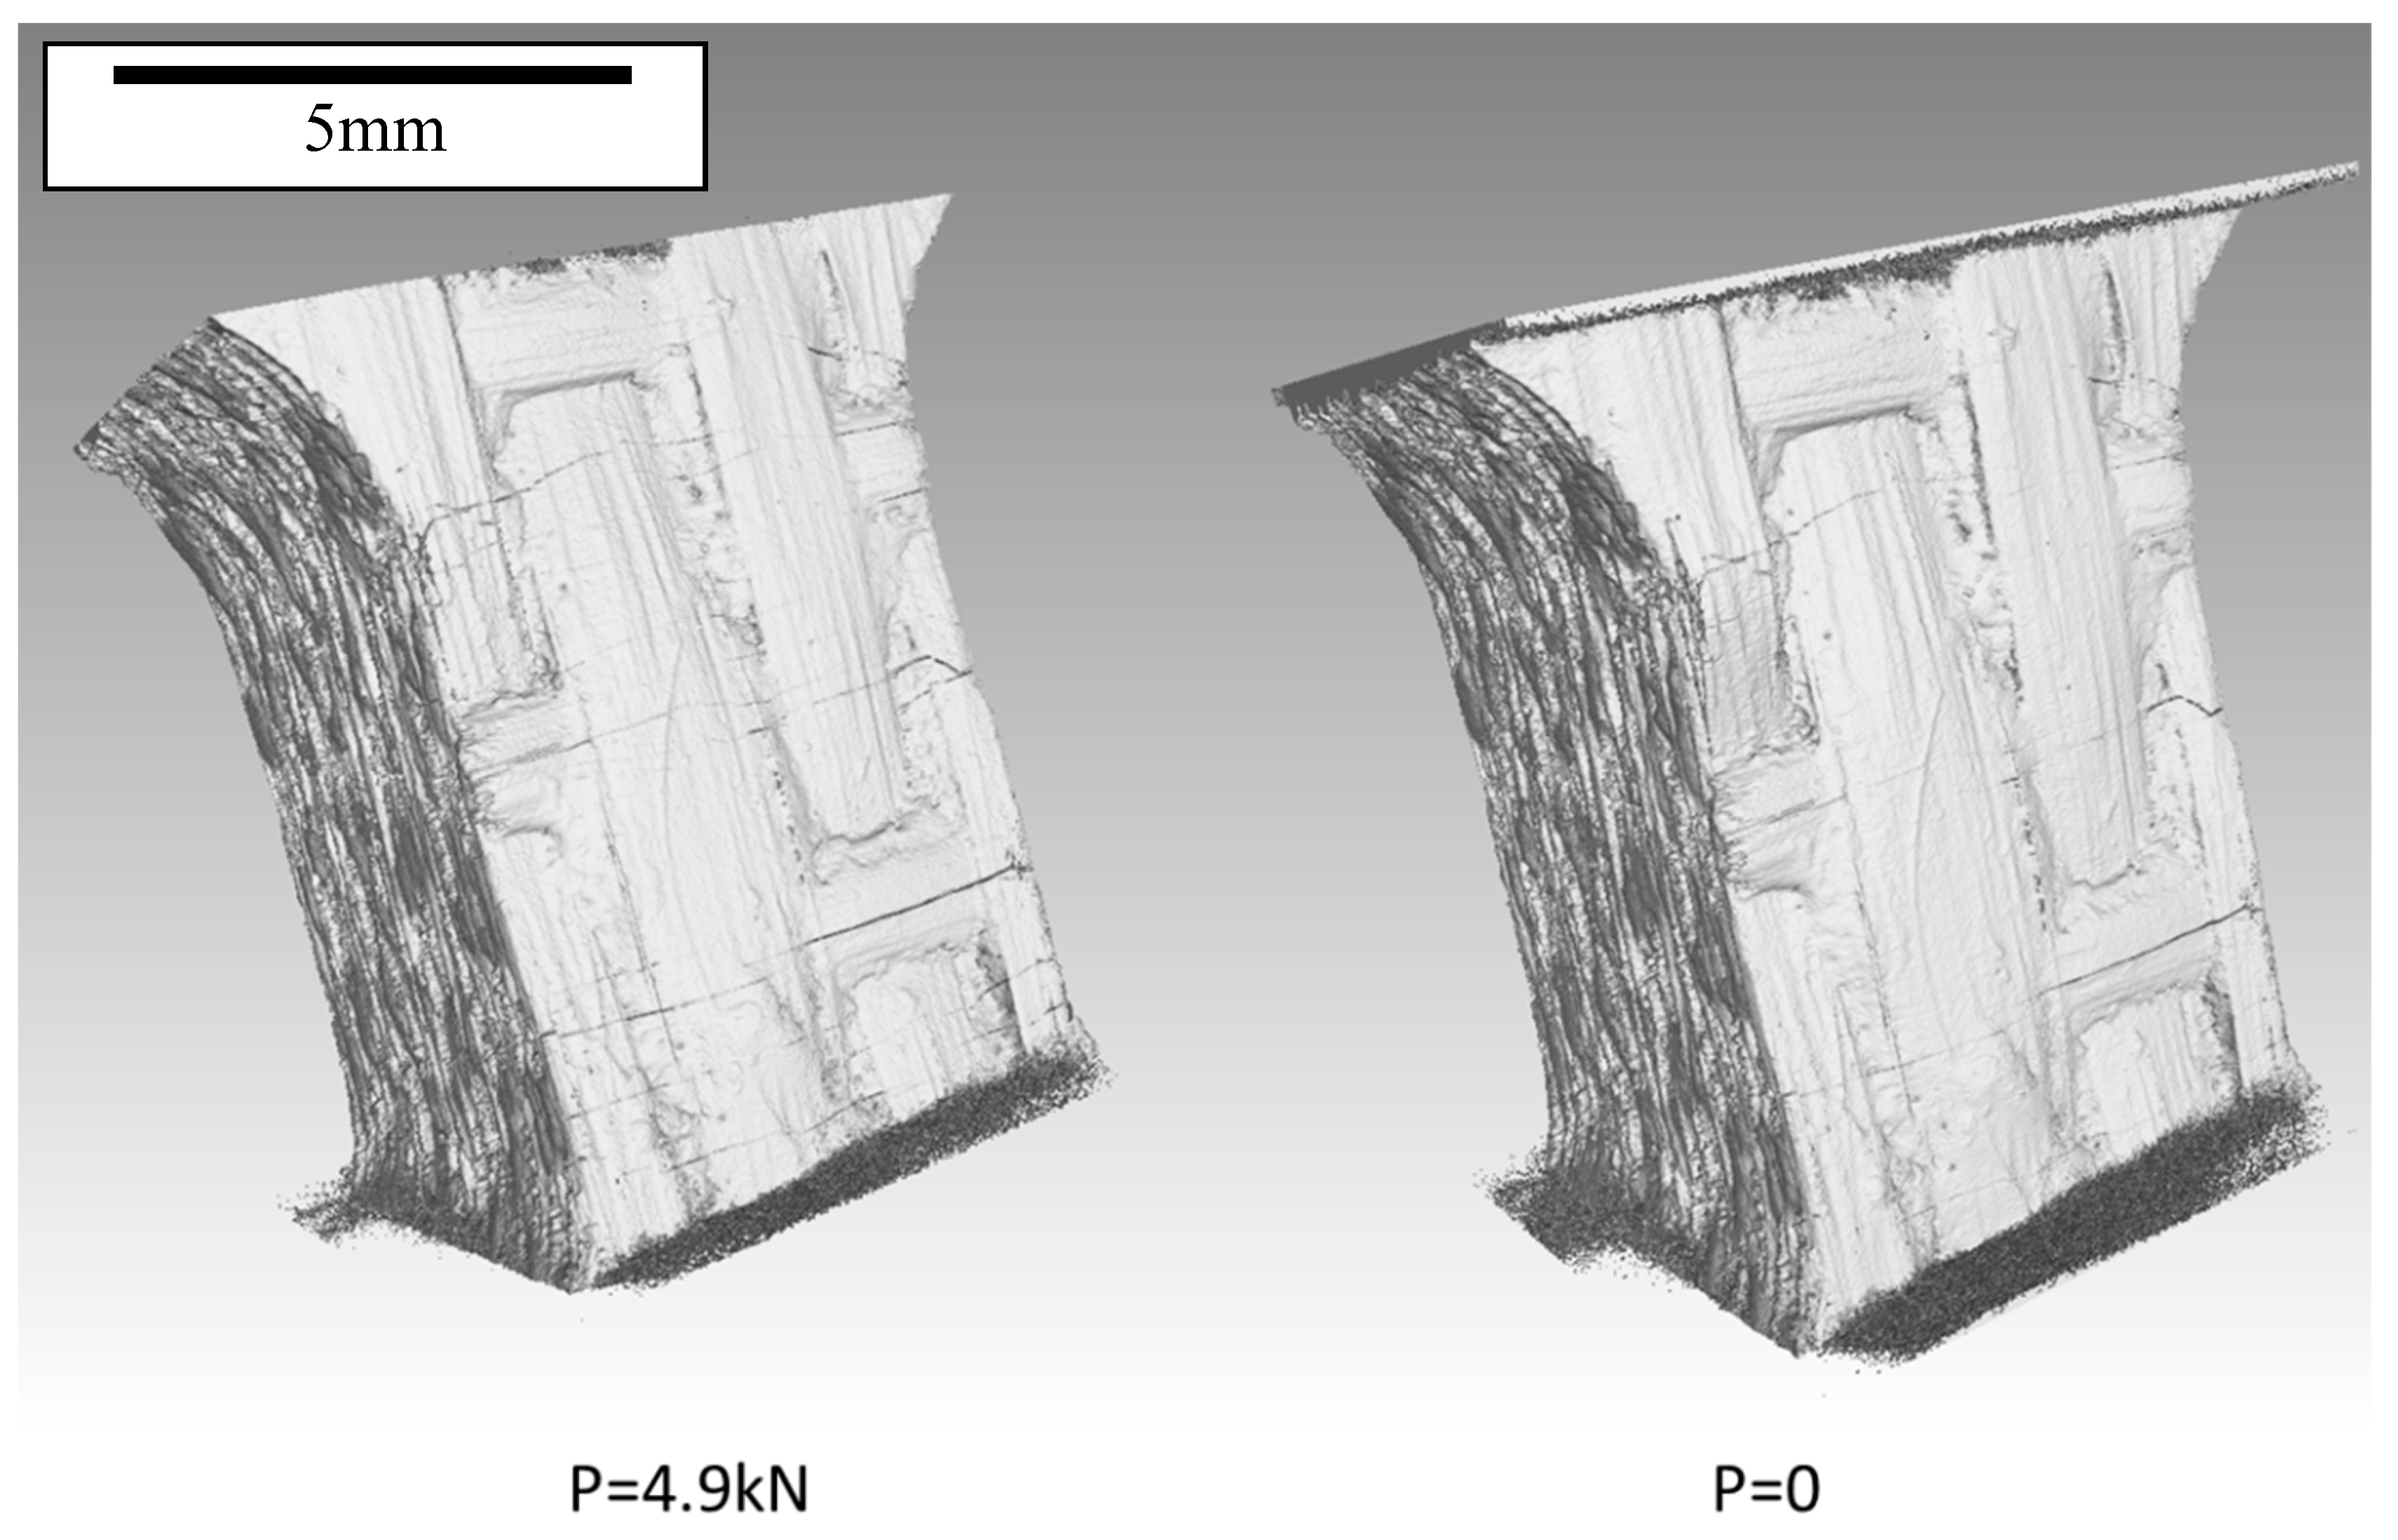
The scope of the work presented here primarily employed XCT inspection as a “post mortem” technique, post mechanical testing and unloading of the test specimen. XCT offers by far the greatest resolution for defining CMC architecture and process artefacts which can subsequently be correlated to damage and failure mechanisms. This makes XCT a valuable inspection tool. Despite the relatively high cost associated with the technique, the pre-production inspection of components via CT can be justified [
13]. One drawback of this technique is that by employing relatively large scale test samples, the likes of which were tested in this investigation, it is difficult to image under load due to size constraints within the X-ray chamber. Despite the evidence gained from AE monitoring, in particular, optical inspections of post-tested specimens failed to identify surface cracking to the extent expected. Our recent studies employing in-situ X-ray tomography have provided evidence as to why this may occur, by demonstrating the extent of crack closure occurring during unloading [
14]. An example of XCT scanning whilst the sample was under load is included in
Figure 18. The detection of surface cracking under optical or even scanning electron microscopy after unloading is often impossible.
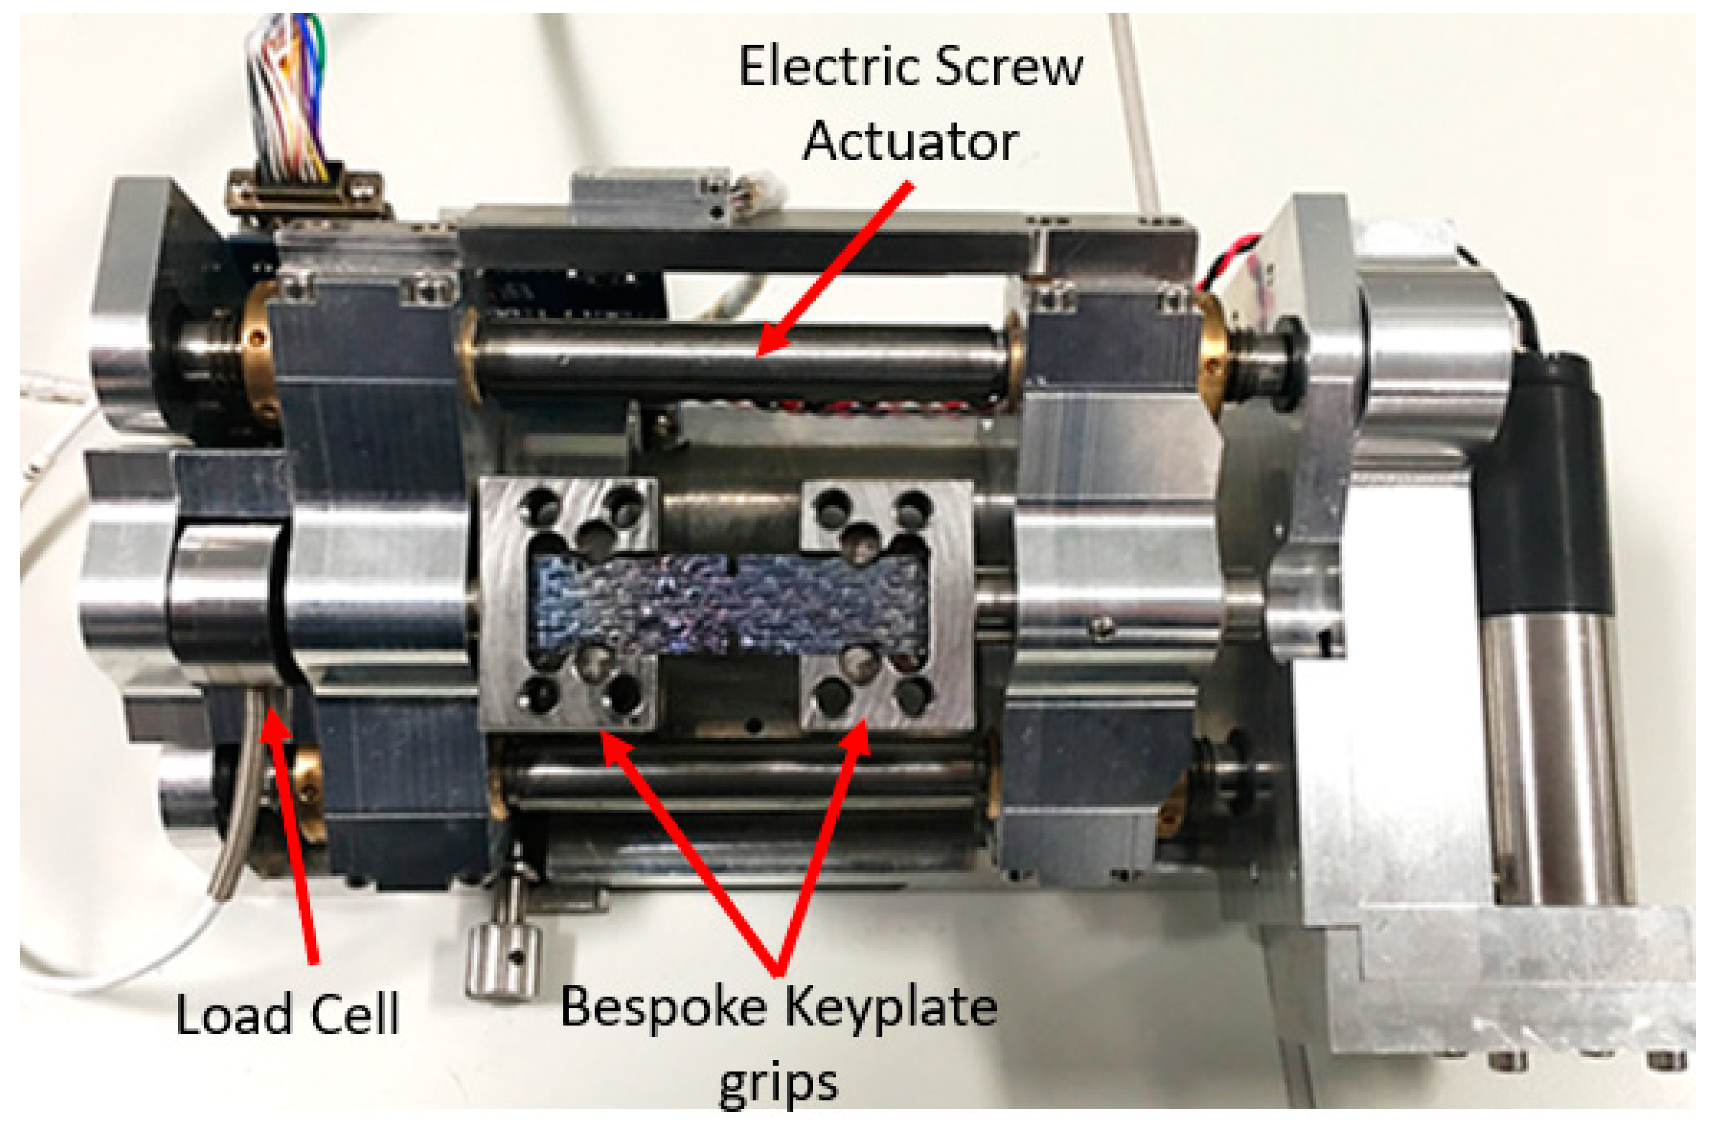
It became clear during the course of the present investigation that in-situ loading within an SEM could provide additional characterisation of pre-existing damage in CMCs. Therefore, subsequent fatigue tests using DIC and AE were interrupted prior to ultimate failure and removed from the standard fatigue test frame to be transferred to an in-situ SEM tensile loading stage. This aspect of the assessment was conducted at room temperature. The loading rig employed was a commercially available tensile stage integrated within the evacuated chamber of a conventional tungsten element SEM. Specific grips were designed and manufactured to interface with the CMC samples. The design of the tensile stage incorporates a fixed end grip and opposing moving actuator. During loading, the sample would naturally shift across the SEM field of view. Therefore, a stepped loading technique was employed to facilitate tracking of the original field of view between the opposing notches, and occasional re-focusing of the image was necessary. A single test was terminated after 39,000 combined fatigue cycles based on the rapid increase detected in AE energy. The central gauge section of the original test sample was carefully sectioned to remove the tab ends and retain a segment of 60 mm total length, incorporating the double edge notches in the mid-length position. Four small locator notches of 1 mm radius were machined towards the new specimen extremities using diamond tooling to enable load transfer between the grips and specimen alignment. A key-plate was then applied to assist load transfer and resist slippage within the grip. The test rig and gripping design are illustrated in
Figure 19.
The DIC image recorded immediately prior to unloading had indicated a clear region of damage associated with the left-hand notch (
Figure 20a). On transferring the central portion of the sample to the SEM tensile stage and viewing this region under high magnification secondary electron imaging, a fine crack could be detected correlating to the DIC region of high strain (
Figure 20b). In-situ loading was then applied to this sample to deliberately open the pre-existing crack. Analysis of the SEM records using the DIC software produced a sequence of strain maps to illustrate the associated crack opening displacement (COD) (
Figure 21). Within this field of view, no additional cracks became apparent during the loading ramp.
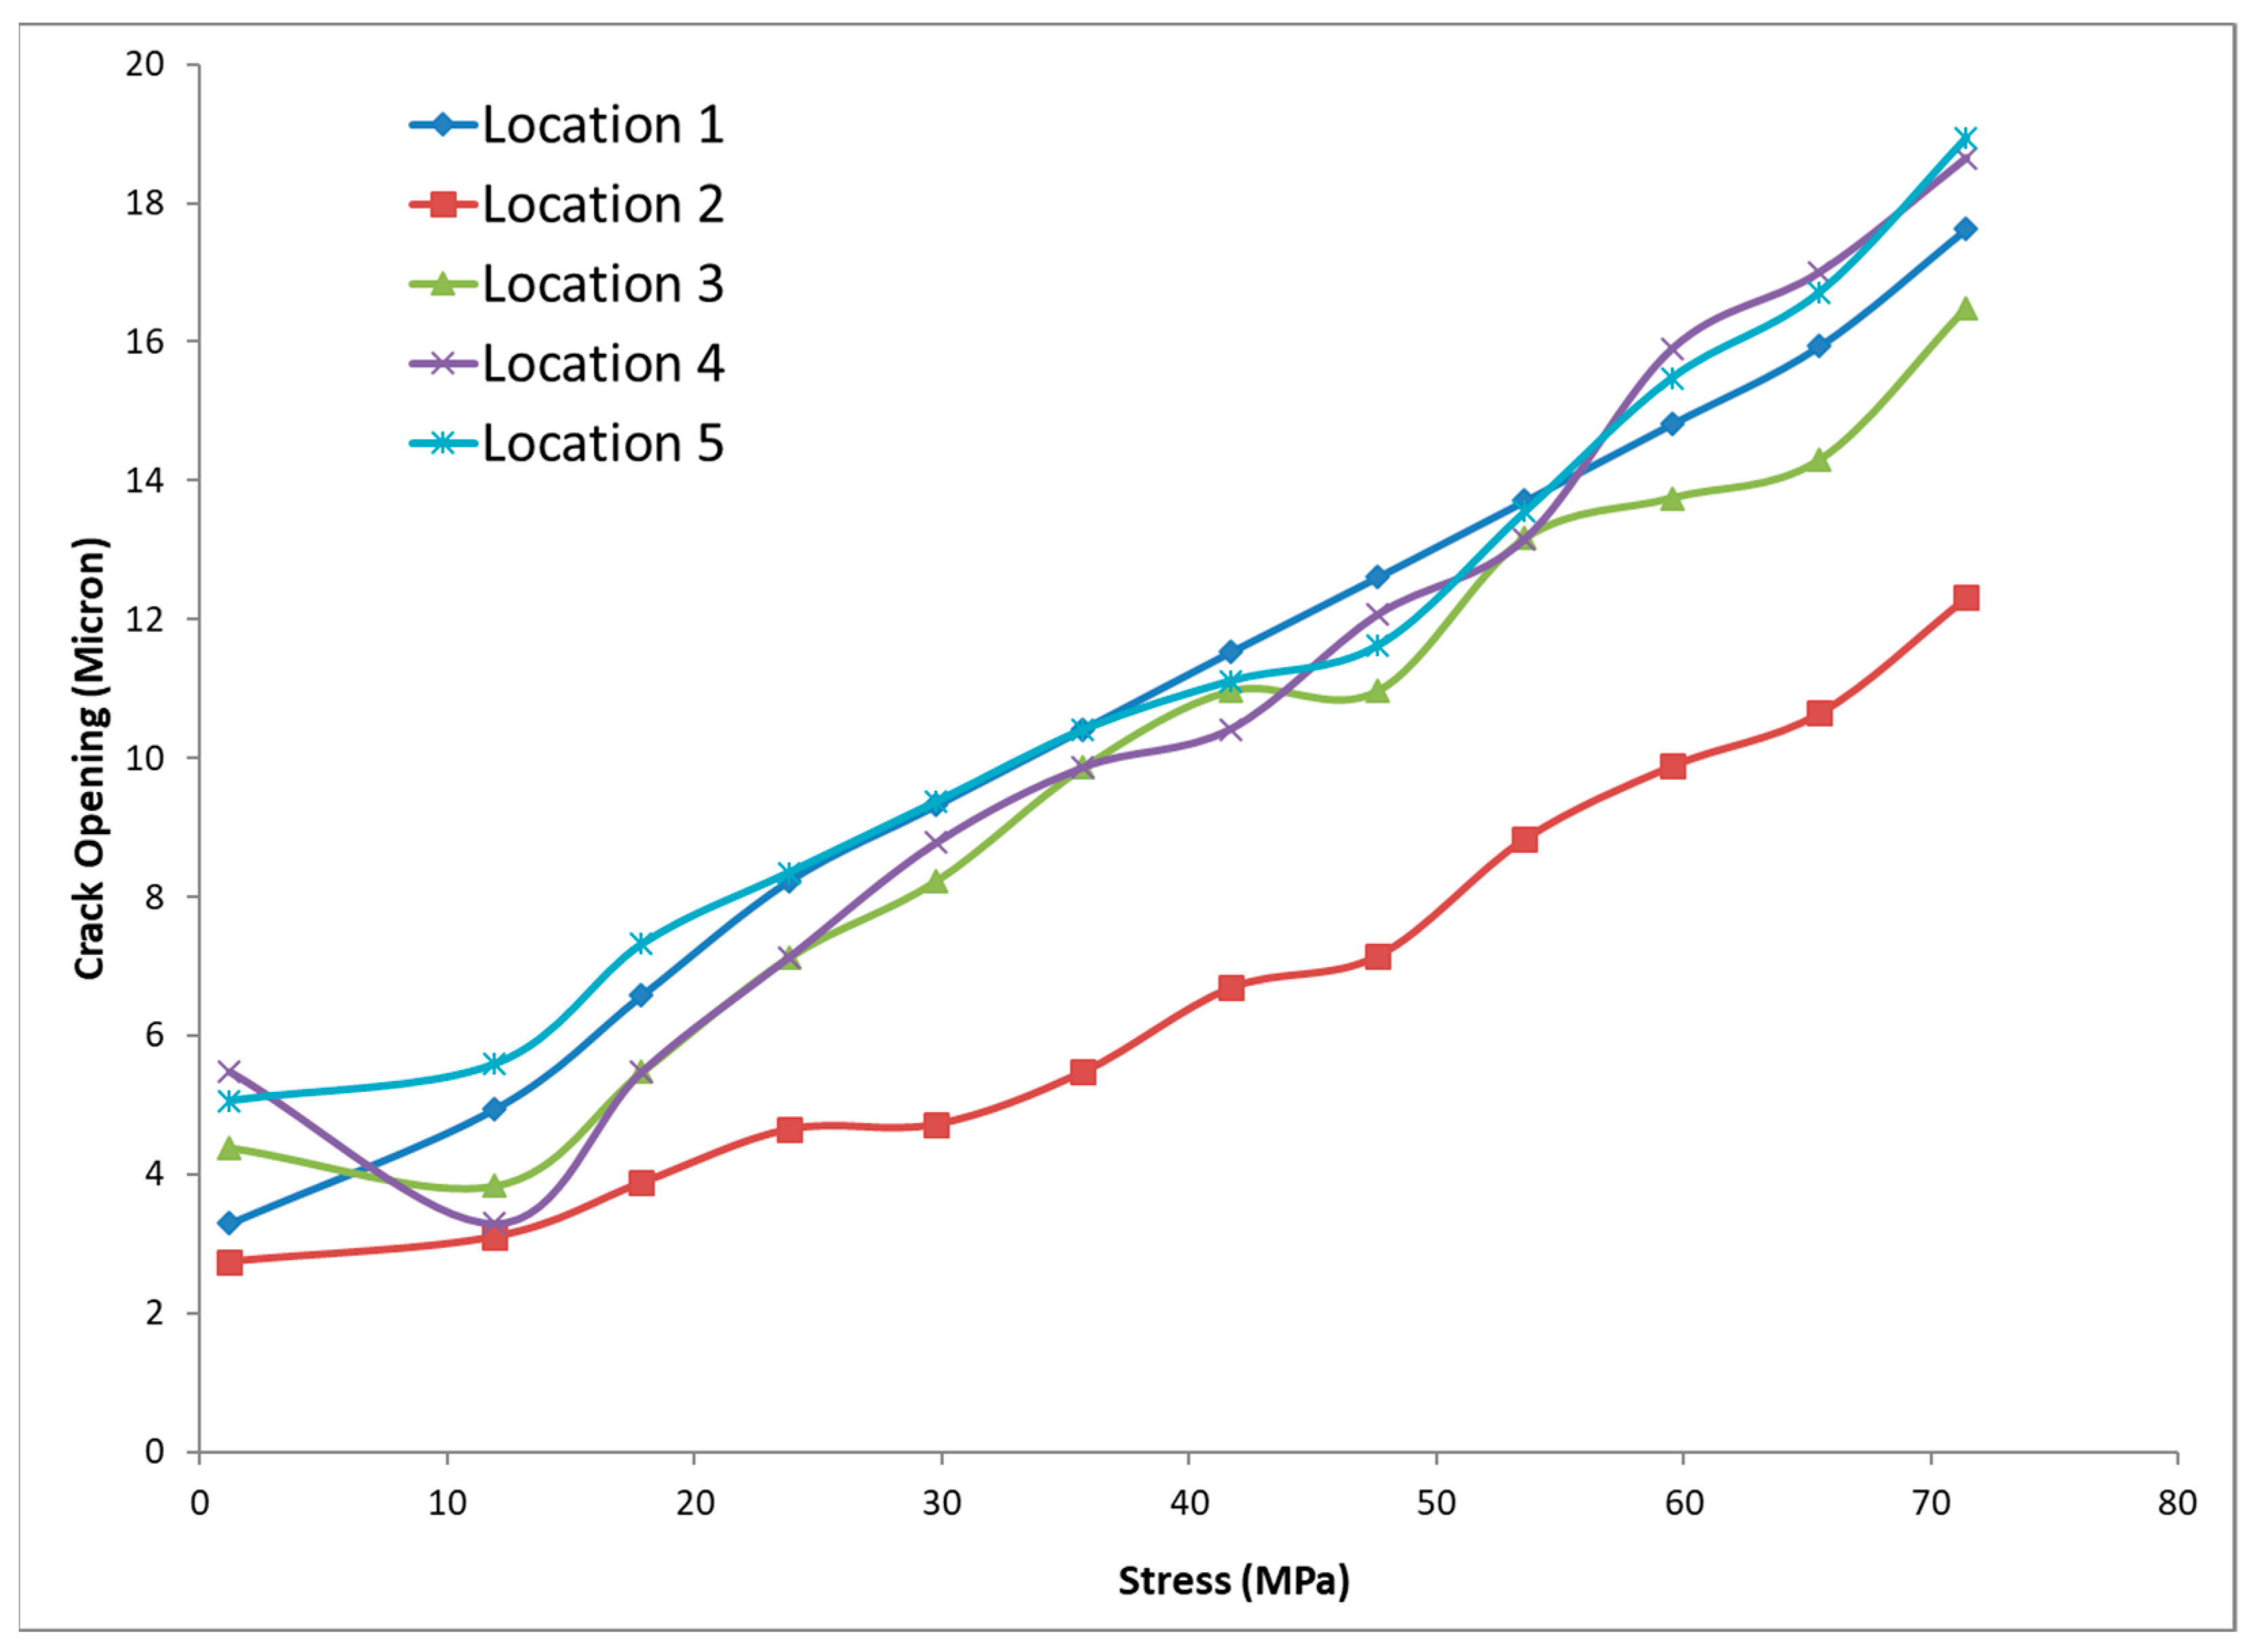
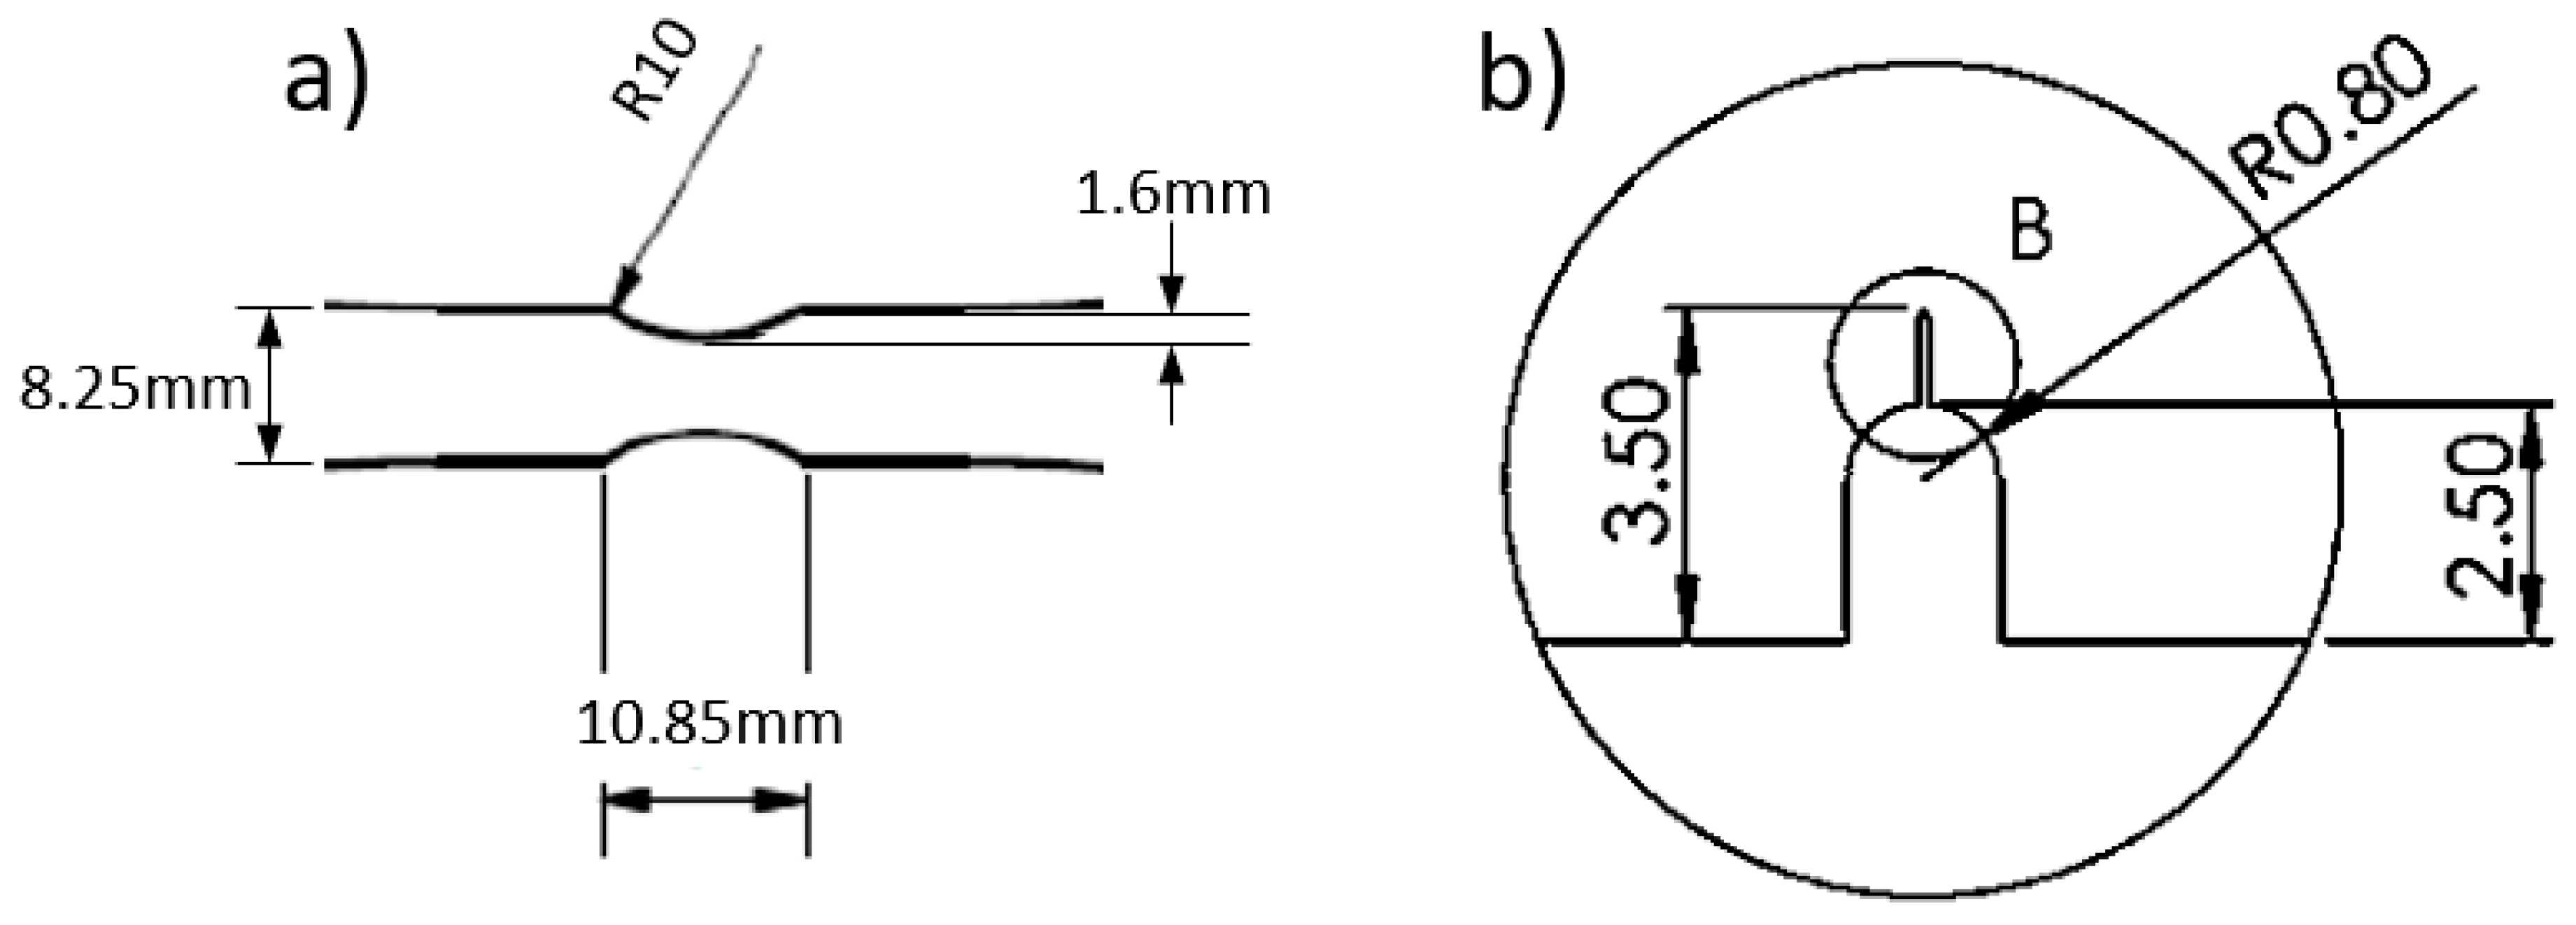
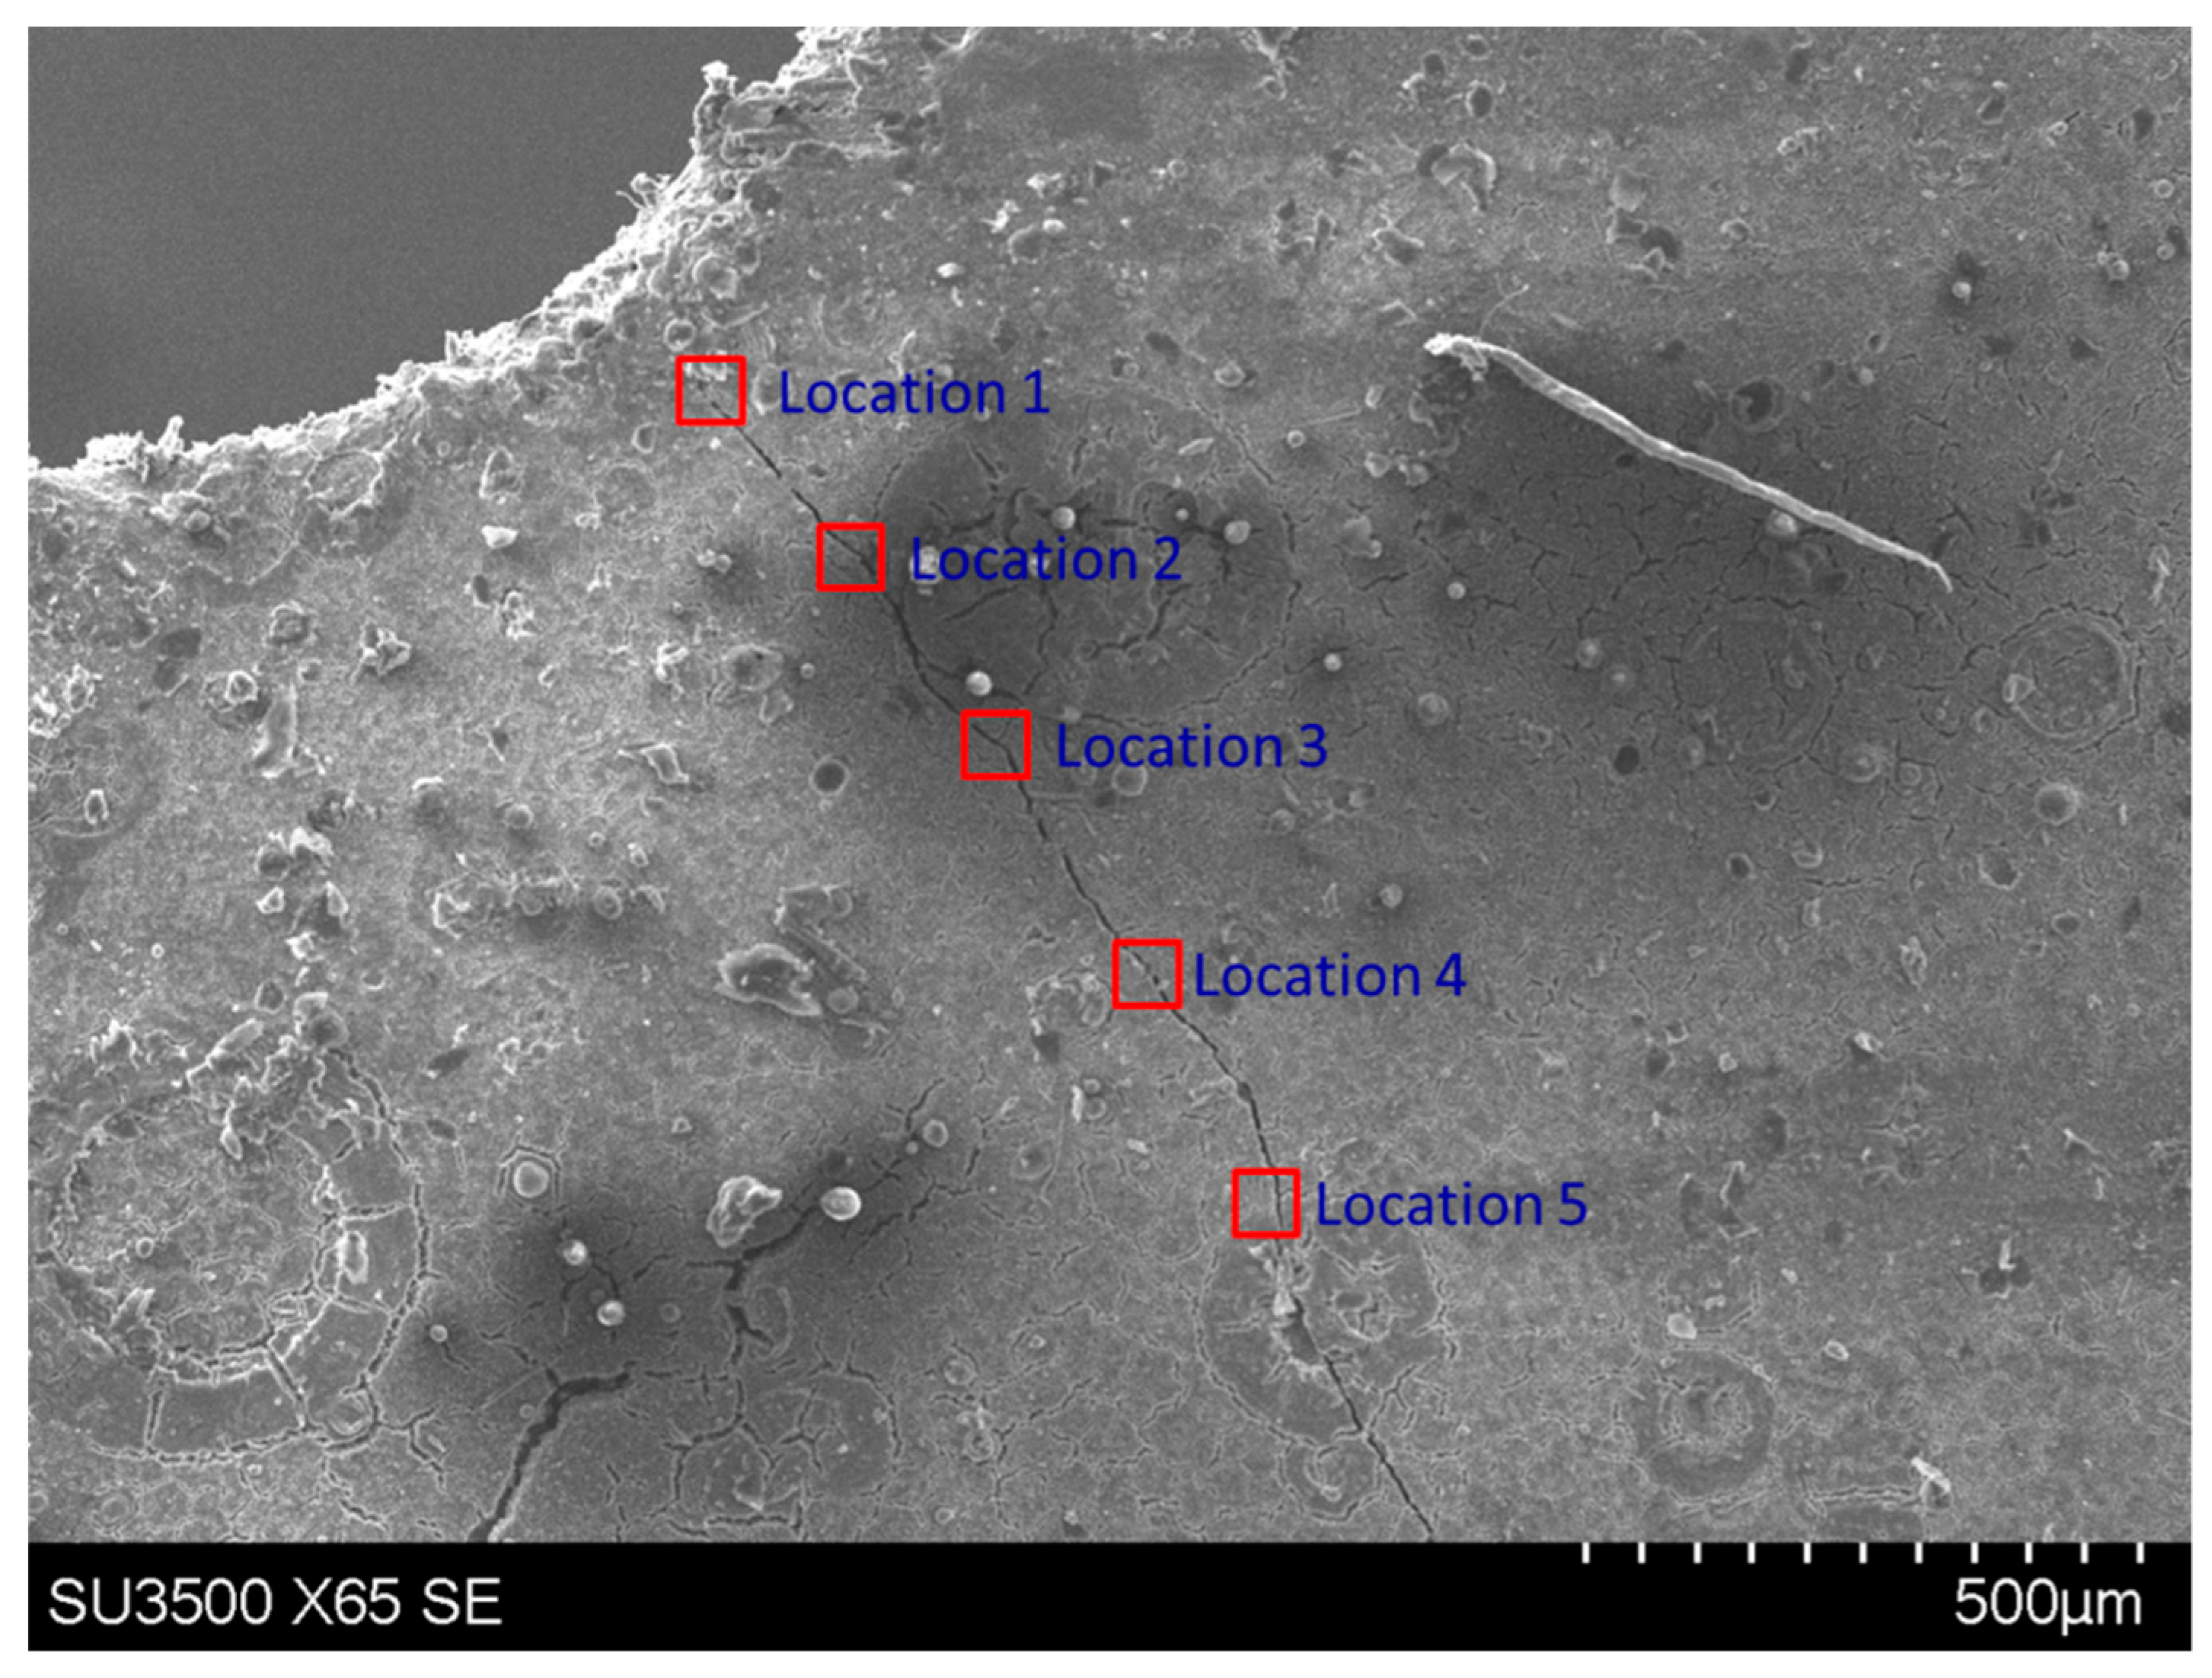
Using the commercially available photo editing software AxioVision, COD measurements were recorded as a function of applied stress at five near equally spaced locations along this crack, at positions indicated in
Figure 22. The measured displacements are presented in
Figure 23. COD was essentially directly proportional to applied stress. Whilst the local compliance was very similar at four of the locations, the displacements were consistently lower at location #2.
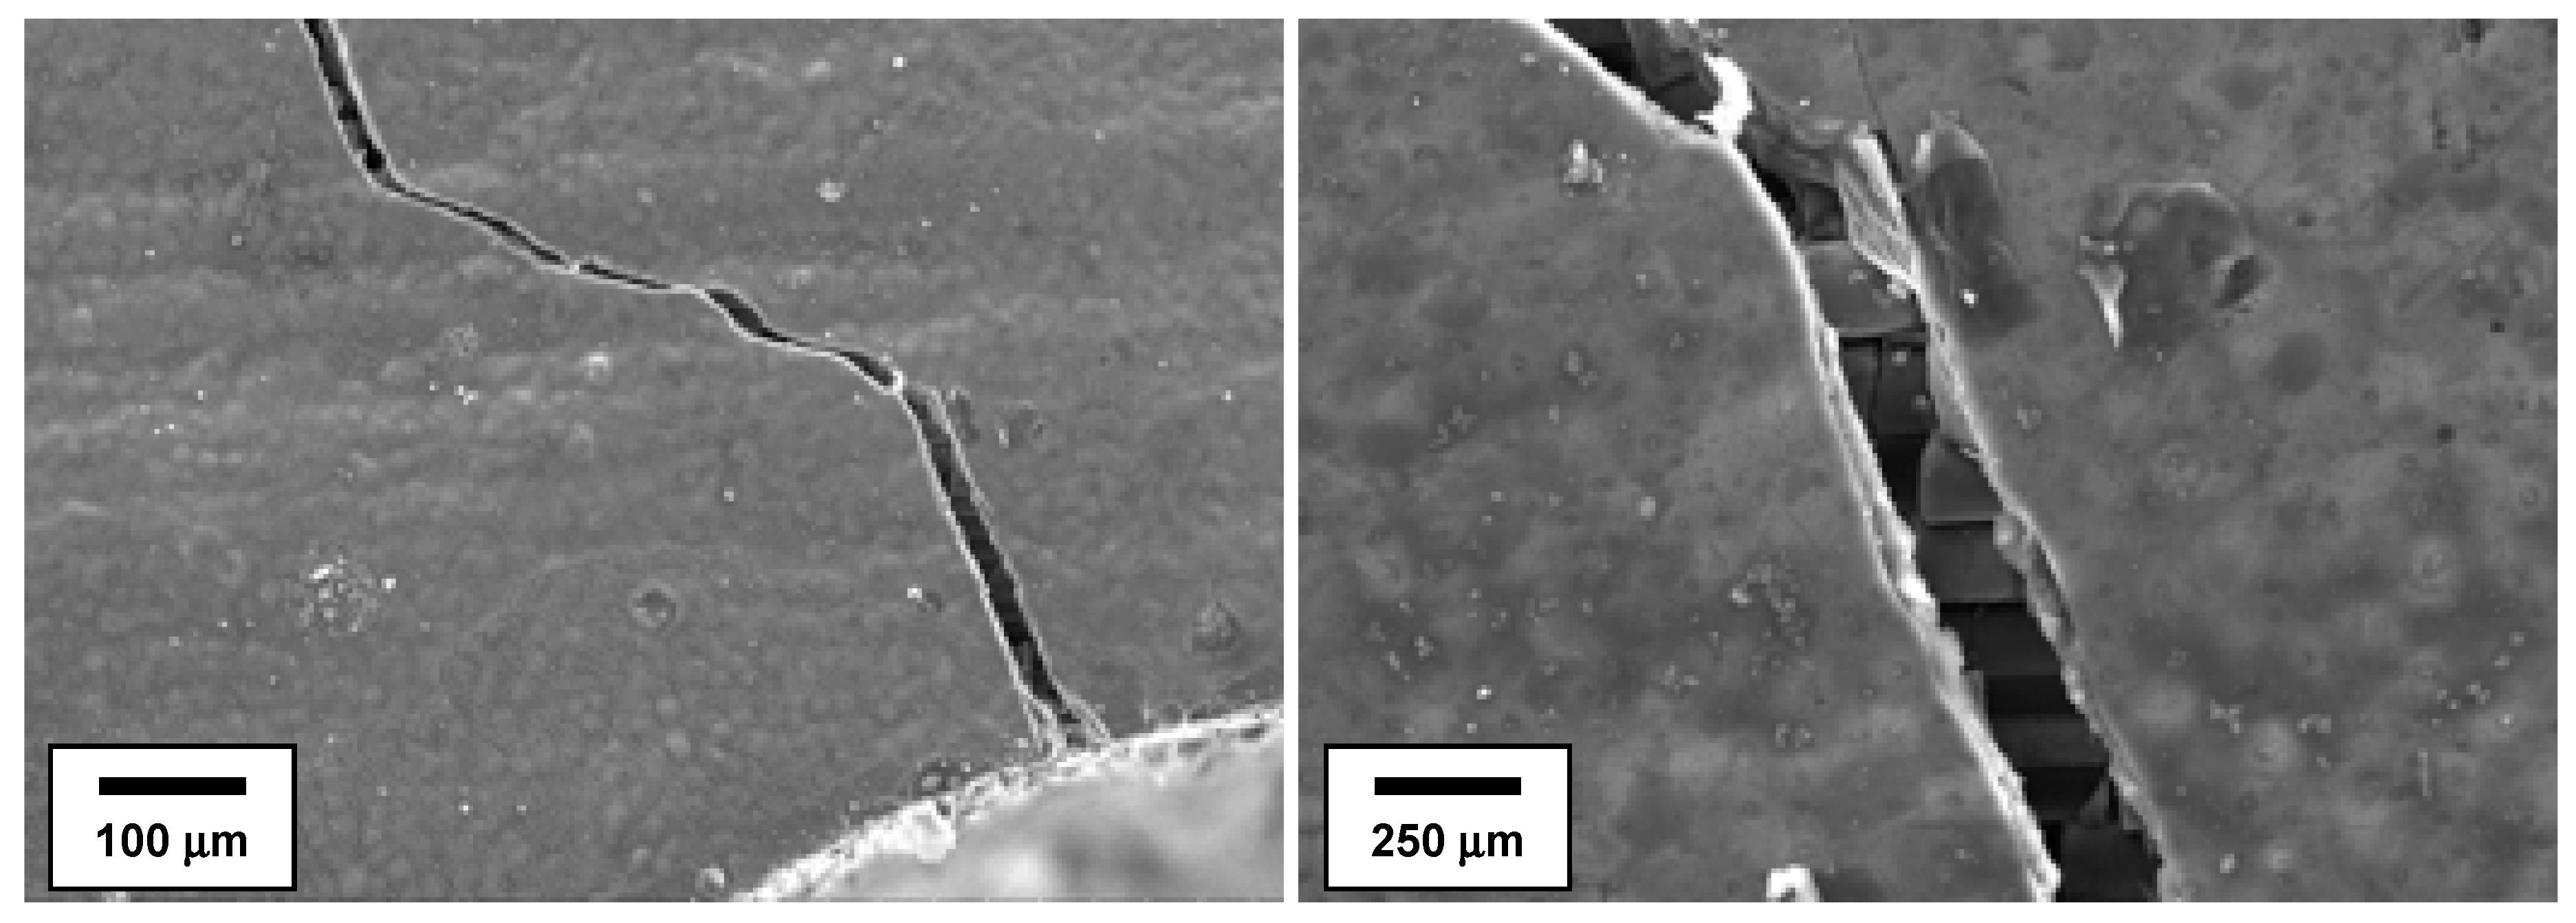
The reverse face of the same notch was also inspected under in-situ SEM loading. A single crack was again evident, initiated slightly offset from the notch root (
Figure 24). The SEM images taken at two stages during loading not only illustrate the surface matrix crack opening but also allow visibility of the local sub-surface fibres.
The optical inspection of the lateral edge of the coupon illustrates the through-thickness cracking along the root of the notch (
Figure 25). The macroscopic crack breaks the front and rear surfaces at a single location on each face; however, a complex path is evident as the crack traverses through the consecutive plies with examples of crack bridging and crack displacement evident. Such complexity in the crack path is representative of the pseudo-toughness demonstrated by CMCs compared to monolithic forms of ceramics.
The application of this in-situ SEM technique has enhanced the ability to locate pre-existing surface breaking fatigue cracks in tested CMC samples. More critically, the sub-structure relating to these cracks was obscured until inspected under load (
Figure 24). Once opened and viewed under load, the evidence of local fibre/matrix de-cohesion and bridging was noted. However, examples of fracture in selected individual fibres were also observed. The crack opening displacement measurements detailed in
Figure 22 and
Figure 23 illustrated a direct relationship between COD and loading; however, not all points along the crack opened to the same extent. This could indicate that compliance measured at the sample surface is extremely sensitive to the integrity of fibres and their interface to the matrix immediately beneath the local surface.
Under fatigue loading, the cumulative AE signals invariably detected early stage damage within test coupons of various geometry, with activity noted during the very first loading cycle. This was mirrored by a characteristic acceleration in emissions as failure was approached.
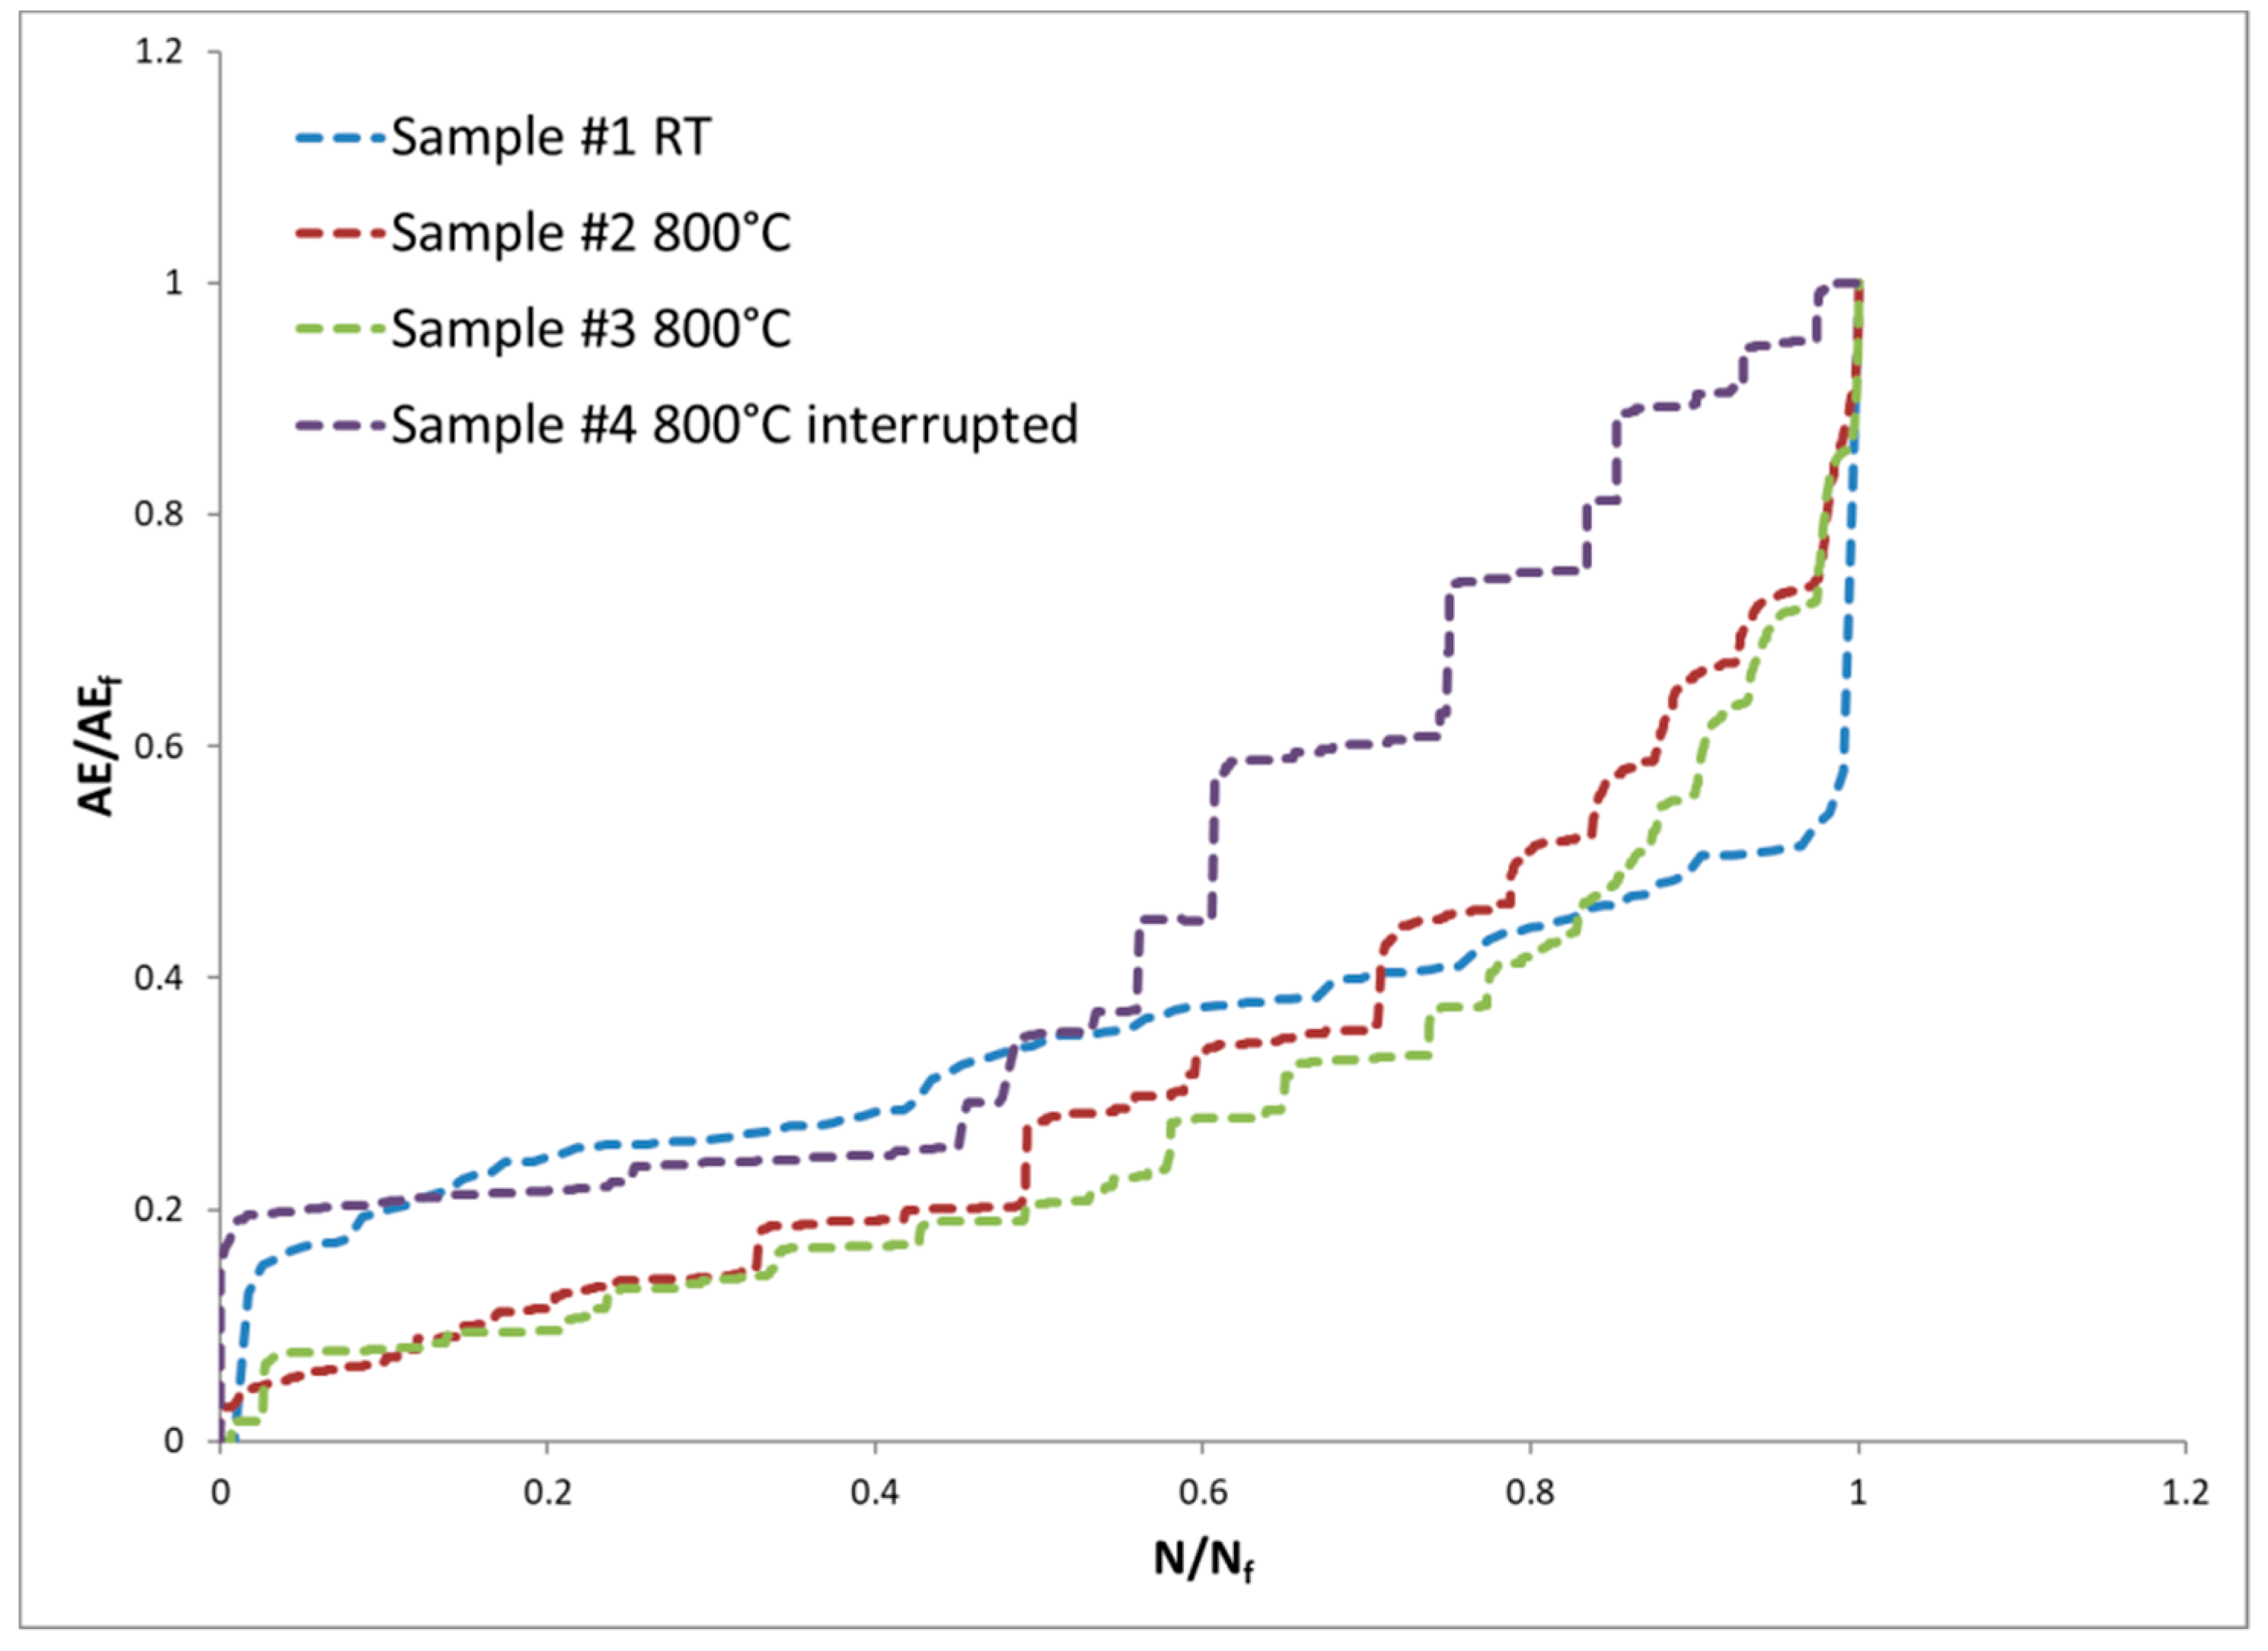
Figure 26 attempts to illustrate the general sigmoidal trends in AE measurement through normalising both the accumulated AE energy and cyclic fatigue life against their respective final values (AE
f and N
f) of Samples #1 to #4. These combined data represented behaviour in four separate samples over a similar period of fatigue life immediately prior to rupture (i.e., lives between 2500 and 3500 cycles) at two distinct temperatures. One notable difference was evident relating to the test temperature. Whilst the increase in AE signal at room temperature remained relatively gradual, all of the 800°C tests illustrated marked steps in the recorded accumulated energy signals. It is suggested that the elevated temperature response could indicate repeated episodes of environmental incubation (oxidation) and subsequent mechanical damage.
The discussion to date has largely considered the various monitoring techniques in isolation. However, it is the monitoring of CMC coupons under mechanical loading employing the concurrent combination of AE, ER and imaging (whether optical, SEM or DIC based) that offers a holistic assessment of damage accumulation. Any one of these techniques, when used in isolation, may be able to detect the onset and progression of damage but will not provide a complete temporal and spatial distribution of the deformation. It is obvious that imaging alone will only detect surface strain and cracking and continuous monitoring would be required to precisely define the onset of damage in time (or a number of fatigue cycles). ER monitoring, as with extensometery, samples a large, macroscopic volume of critically stressed material and will not isolate damage locations with any accuracy. AE is able to detect damage events and location throughout the bulk section with proficiency; however, this is an indirect monitoring technique and will not characterise the form of damage and the interaction to local CMC architecture. In-situ SEM studies provide excellent resolution of surface crack opening and closure; however, the field of view is highly restricted. It may be argued that continuous synchrotron X-ray computed tomography be considered as the ultimate technique available for the resolution of damage within a reasonably large volume of CMC material [
15]; however, access to beam-line facilities with in-situ loading is restrictive. When looking ahead to the service inspection of CMC components, some form of ER or mechanical resonance technique may be favoured for condition monitoring, especially if the part has to remain in-situ within a supporting structure.
With respect to the fatigue experiments, Samples #1 to #4, although intimate control of the machined notch finish was not a pre-requisite for this study, the authors are confident that damage was ultimately controlled by the local composite architecture and not the machined edge condition. With experience gathered from a wider matrix of testing and best practice of load-train alignment, we are also convinced that the asymmetrical distribution of strain in the case of the DEN specimens was not the result of misalignment [
16]. Instead, damage consistently initiates from one side of the DEN specimens, and cracks then propagate across the coupon net section. On occasion, the early onset of localised strain concentration in notched coupons can be significantly displaced away from the plane of the notch root and is controlled by local architecture and/or processing artefacts. Such behaviour has even been detected in samples with relatively high K
t factor [
17].
Distinct differences were detected by DIC in the strain field developed at room and elevated temperatures.
Figure 8 provides a clear example of a distributed damage zone, with isolated regions of high strain extending horizontally across the field of view. Multiple cracks developed within these strained areas and were associated with the transverse fibre tows. In contrast, the region of high strain relating to the high-temperature fatigue tests was consistently localised to a single zone (
Figure 12,
Figure 14 and
Figure 20, for example) and eventually a single dominant crack developed to promote ultimate failure. The fracture surfaces from the tests performed at 800 °C also demonstrated more restricted fibre pull out. This behaviour is consistent with a reduction in crack density with increased temperature reported for a range of SiC matrix CMC systems, notably incorporating various classes of fibre and interface phase [
15,
18] and has been attributed to a moderate reduction in brittle behaviour.
5. Conclusions
Despite an intimate knowledge of material condition [
19] and a wealth of in-situ monitoring techniques at our disposal, (on this occasion bulk extensometry, AE and DIC were all combined, plus use of ER measurements on selected specimens), the identification of the precise, single location of ultimate failure initiating during such mechanical tests is considered virtually impossible [
20]. The recent employment of spatial analysis of the AE signals has further demonstrated that cracking events in these CMCs can often be randomly distributed and often well displaced from the regions of highest stress concentration. This was confirmed by the DIC strain maps. However, the damage is not evenly distributed across the critically stressed volume. Instead regions of relatively high strain or “hot spots” develop and extend orthogonal to the tensile stress axis, closely following transverse fibre bundles and the interfacial matrix. During the earliest stages of loading, it is assumed that any increase in AE energy will be predominantly due to matrix cracking, as previously reported using interrupted test techniques [
21]. However, with progressive loading, more energetic signals are detected that must include contributions from longitudinal fibre fractures and delamination of transverse fibre bundles from the matrix. AE monitoring has consistently proven to be the most reliable technology available to us for the detection of an ensuing failure in laboratory specimens of this scale, consistent with previous reports [
22,
23,
24].
High-temperature DIC was successfully employed during the current campaign. Early attempts demonstrated the difficulties caused by thermal drift, furnace bore reflections and degradation of the speckle paint, combining to impose a loss in spatial resolution. However, these problems were averted through the use of a transparent port to the furnace window, improved furnace wall insulation and coarsening the speckle pattern, which when combined provided improved resolution of the damage formation and progression in this material at 800 °C.
The benefit of employing a concurrent, multi-technique approach to monitoring damage in CMCs has been demonstrated.

 ,
, 


